
The Performance of Remodeling Contractors in an Era of ... · PDF fileThe Performance of...
42
Joint Center for Housing Studies Harvard University The Performance of Remodeling Contractors in an Era of Industry Growth and Specialization Abbe Will and Kermit Baker December 2007 W07-8 © by Abbe Will and Kermit Baker. All rights reserved. Short sections of text, not to exceed two paragraphs, may be quoted without explicit permission provided that full credit, including © notice, is given to the source. Any opinions expressed are those of the author and not those of the Joint Center for Housing Studies of Harvard University or of any of the persons or organizations providing support to the Joint Center for Housing Studies.
Transcript of The Performance of Remodeling Contractors in an Era of ... · PDF fileThe Performance of...
Joint Center for Housing Studies Harvard University
The Performance of Remodeling Contractors in an Era of Industry Growth and Specialization
Abbe Will and Kermit Baker December 2007
W07-8
© by Abbe Will and Kermit Baker. All rights reserved. Short sections of text, not to exceed two paragraphs, may be quoted without explicit permission provided that full credit, including © notice, is given to the source. Any opinions expressed are those of the author and not those of the Joint Center for Housing Studies of Harvard University or of any of the persons or organizations providing support to the Joint Center for Housing Studies.


Abstract Professional remodeling contractors have not experienced the same flurry of
consolidation as in the national homebuilding industry in recent years. The home improvement
industry remains fragmented with many small contractors that focus on local markets and are
highly susceptible to failure with each new cycle of remodeling activity. This paper analyzes the
structure, performance and survivorship trends of professional contractors serving the
remodeling industry using data from the U.S. Census Bureau’s Economic Census of the
construction sector and Business Information Tracking Series, as well as Qualified Remodeler
magazine’s Top 500 Remodelers. While remodelers are finding efficiencies in becoming more
specialized businesses, there is little evidence that specialization leads to higher or less volatile
growth. In fact, more diversified firms, such as full-service remodelers may be better equipped
to handle the cyclical nature of the industry.

1
I. Introduction
The U.S. home improvement industry is a significant part of the national economy as
each year hundreds of billions of dollars are spent on remodeling activities. Yet comprehensive
studies of the characteristics and performance of remodeling contractors are few, largely due to
the limited availability of quality data sources. This study aims to not only describe the changing
size and structure of professional contractors serving the remodeling industry but also to assess
the performance of remodeling contractors over time and across different business models, and
to determine trends in contractor survivorship.
Professional remodeling contractors have experienced very little consolidation over the
years, in stark contrast to the national homebuilding industry. The majority of remodeling
contractors today still run relatively small operations that serve a limited geographical area.
Rather than consolidate, it appears that remodeling contractors are seeking competitive
advantage in becoming more specialized businesses. By understanding the impact of
specialization of operations on the performance of remodelers, it will be possible to assess
whether specialization might lead to stronger growth and more stability in the remodeling
industry in the years to come.
Section II of this report looks at the size and structure of the remodeling contracting
industry, recent growth trends, and the implications of continued fragmentation within the
industry. Section III discusses the extent of specialization among contractors and the extent to
which that phenomenon has offset the lack of industry concentration in terms of their business
performance. Section IV looks at recent trends in survivorship, and discusses the role of age,
size, and recent growth as contributors to business failures of remodeling firms.
The report concludes that industry fragmentation has been a significant contributor to
high failure rates in the industry. Contractor specialization, while possibly leading to higher
growth rates at many firms, appears not to have been a strategy that offsets these high failure
rates because in recent years specialized firms have seen greater volatility in business levels than
in full-service firms.
2
II. Remodeling Industry Overview
Size and Structure
Exceptional growth in homeowner improvements pushed the residential remodeling
market to an all-time high of $280 billion in 2005, the majority of which went toward
professionally installed projects.1 Although government surveys, such as the biennial American
Housing Survey and the quarterly Residential Improvements and Repairs (C50) Report
frequently collect data on consumer expenditures for home improvements and maintenance,
detailed statistics on professional remodeling contractors are captured only once every five years
as part of the U.S. Census Bureau’s Economic Census of the construction sector (Construction
Census).2
A key source for data on the professional remodeling industry, the Construction Census is
a comprehensive survey of business activity covering residential and nonresidential construction
establishments with payroll employees, where an establishment is defined as a single physical
place of business.3 The Census Bureau also collects less detailed data on self-employed
contractors through the Nonemployer Statistics series, which annually tabulates the number and
receipts of business establishments that have no paid employees but are subject to federal income
tax. According to the Census Bureau, the majority of self-employed individuals operate very
small proprietorships that are likely not the main source of income for the business owner.
The term ‘general remodeling contractor’ used throughout this paper refers to the
industry of residential remodelers as defined by the North American Industry Classification
System (NAICS), which along with new residential construction, industrial building
construction, and commercial and institutional building construction makes up the Construction
of Buildings subsector of the economy. The industry of residential remodelers consists of
businesses that are primarily responsible for the remodeling of single-family and multifamily
residences (including additions, alterations, reconstruction, maintenance and repair work).
Included in this industry are general remodeling contractors, remodeling design-build firms, 1 See Joint Center report Foundations for Future Growth in the Remodeling Industry for market size methodology. 2 The Economic Census collects data at the industry level using the 2002 North American Industry Classification System (NAICS). NAICS codes categorize establishments by the primary activity in which they are engaged, and related industries are aggregated into subsectors, which then define major economic sectors. The construction sector is comprised of three subsectors: construction of buildings, specialty trade contractors, and heavy and civil engineering construction. 3 For convenience, the terms establishment, business and firm are used interchangeably throughout the paper.
3
remodeling project construction management firms and operative remodelers, which remodel
existing housing either for others or on their own account for sale.
Specialty Trade Contractors form a separate subsector of the construction industry that
includes businesses whose primary activity is performing specific activities involved in
residential and nonresidential building construction, such as site preparation, framing, plumbing,
painting, electrical work, etc. The work performed by special trade contractors may be for new
construction or additions, alterations, maintenance, and repairs (i.e. remodeling). Specialty trade
work is often subcontracted from general contractors but work also may be done directly for the
owner of the property, which is especially likely in the case of improvements to existing housing.
(U.S. Census Bureau, 2002 NAICS Codes and Titles).
The most recent data available on residential general and special trade remodelers is from
the 2002 Construction Census which was released in late 2005 and early 2006. The census
estimates that there were a total of 710,000 businesses with payrolls operating in the construction
sector in 2002, and general and special trade residential remodelers comprised fully 28 percent of
the entire sector, as seen in Figure 1. According to Joint Center estimates based on unpublished
Census tabulations, residential construction alone encompassed more than 438,000
establishments, 45 percent of which were considered professional remodelers. The Joint Center
defined these professional remodelers as general and special trade construction businesses
earning more than 50 percent of receipts that year from remodeling activities (including
maintenance and repair). By this definition in 2002 professional remodelers with payrolls
included 82,900 general remodeling contractors and 117,200 specialty trade contractors.4
4 The Joint Center estimates that the number of general and special trade remodeling contractor businesses with payrolls grew 16.8 percent from 1997 to 2002. See Appendix Table A-3.
4
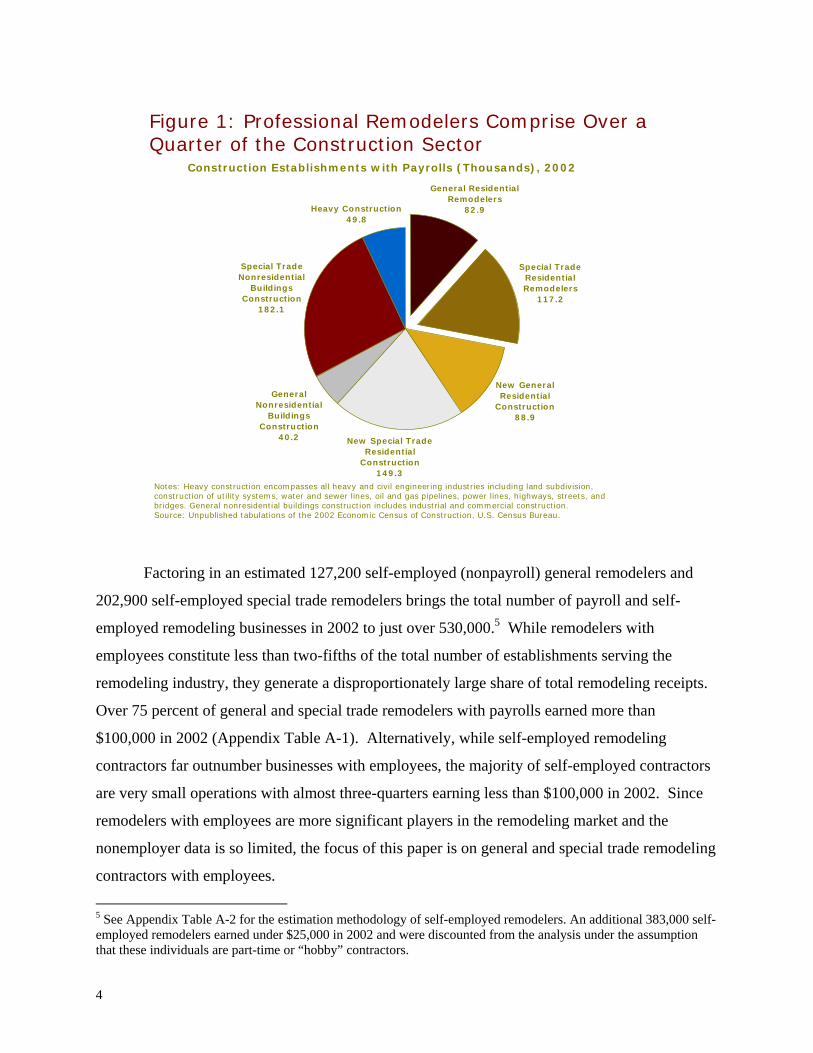
Figure 1: Professional Remodelers Comprise Over a Quarter of the Construction Sector
Special Trade Nonresidential
Buildings Construction
182.1
General Nonresidential
Buildings Construction
40.2 New Special Trade Residential
Construction149.3
New General Residential
Construction88.9
Special Trade Residential Remodelers
117.2
General Residential Remodelers
82.9Heavy Construction49.8
Construction Establishments with Payrolls (Thousands), 2002
Notes: Heavy construction encompasses all heavy and civil engineering industries including land subdivision, construction of utility systems, water and sewer lines, oil and gas pipelines, power lines, highways, streets, and bridges. General nonresidential buildings construction includes industrial and commercial construction.Source: Unpublished tabulations of the 2002 Economic Census of Construction, U.S. Census Bureau.
Factoring in an estimated 127,200 self-employed (nonpayroll) general remodelers and
202,900 self-employed special trade remodelers brings the total number of payroll and self-
employed remodeling businesses in 2002 to just over 530,000.5 While remodelers with
employees constitute less than two-fifths of the total number of establishments serving the
remodeling industry, they generate a disproportionately large share of total remodeling receipts.
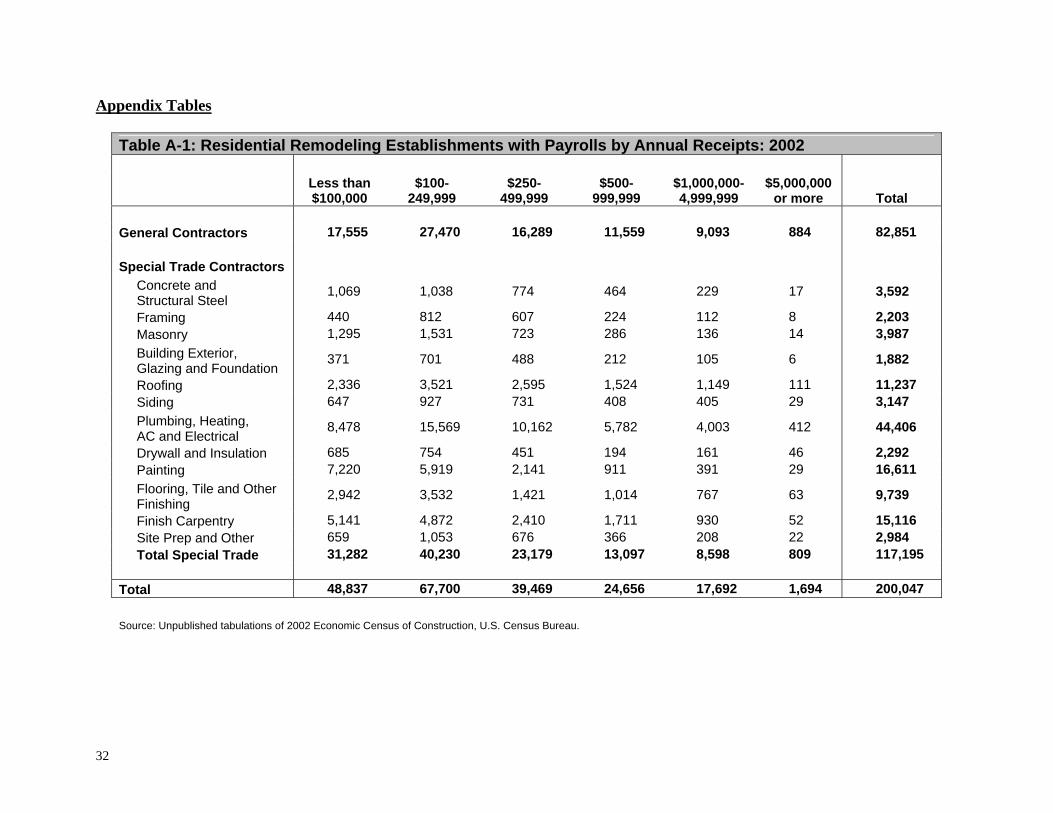
Over 75 percent of general and special trade remodelers with payrolls earned more than
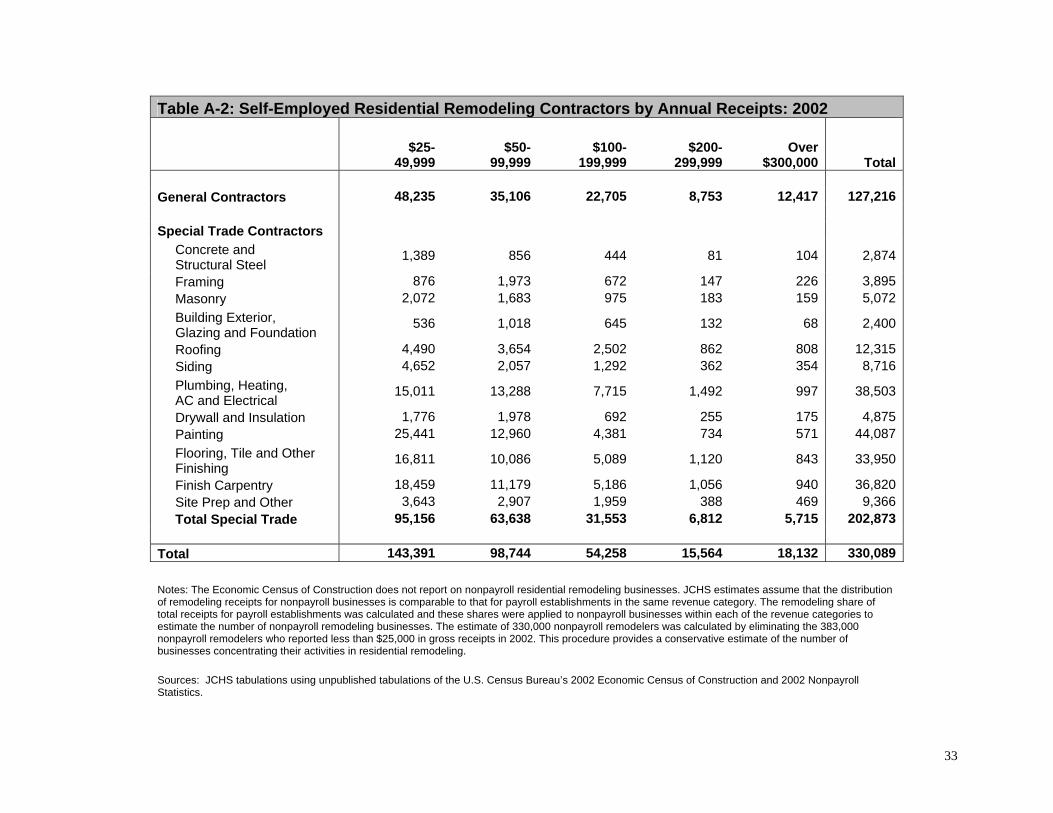
$100,000 in 2002 (Appendix Table A-1). Alternatively, while self-employed remodeling
contractors far outnumber businesses with employees, the majority of self-employed contractors
are very small operations with almost three-quarters earning less than $100,000 in 2002. Since
remodelers with employees are more significant players in the remodeling market and the
nonemployer data is so limited, the focus of this paper is on general and special trade remodeling
contractors with employees.
5 See Appendix Table A-2 for the estimation methodology of self-employed remodelers. An additional 383,000 self-employed remodelers earned under $25,000 in 2002 and were discounted from the analysis under the assumption that these individuals are part-time or “hobby” contractors.
5
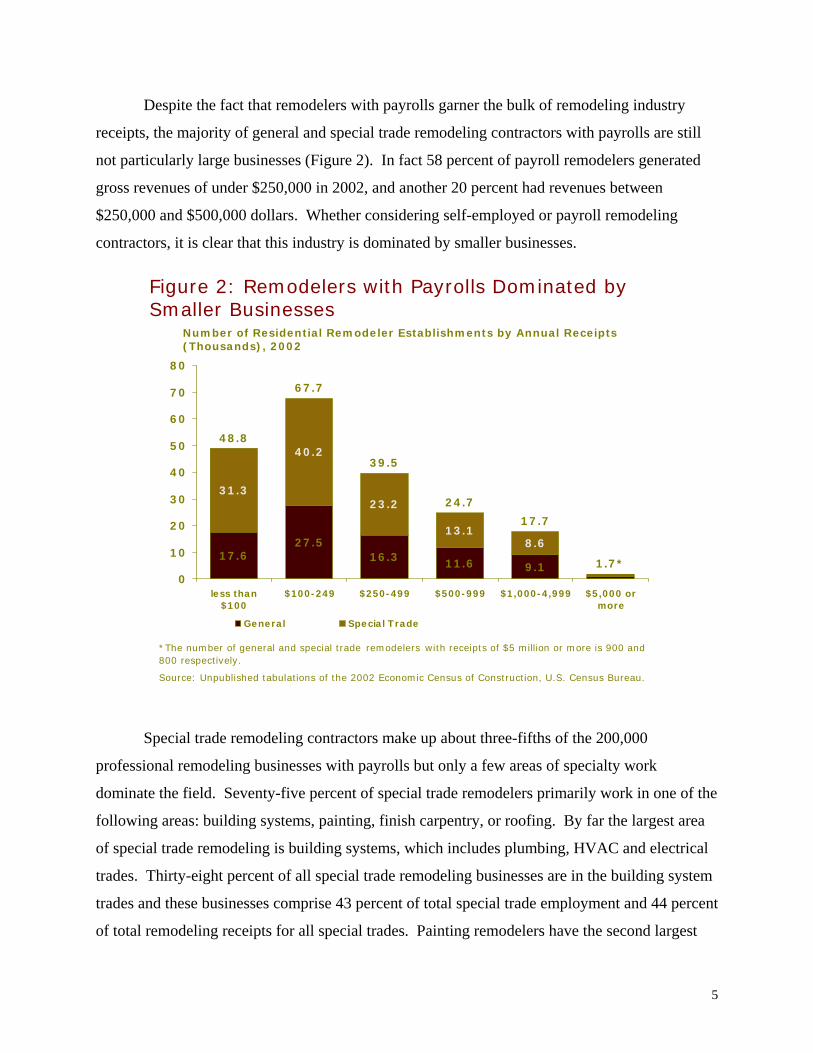
Despite the fact that remodelers with payrolls garner the bulk of remodeling industry
receipts, the majority of general and special trade remodeling contractors with payrolls are still
not particularly large businesses (Figure 2). In fact 58 percent of payroll remodelers generated
gross revenues of under $250,000 in 2002, and another 20 percent had revenues between
$250,000 and $500,000 dollars. Whether considering self-employed or payroll remodeling
contractors, it is clear that this industry is dominated by smaller businesses.
Figure 2: Remodelers with Payrolls Dominated by Smaller Businesses
17.627.5
16.3 11.6 9.1
31.3
40.2
23.2
13.18.6
48.8
67.7
39.5
24.717.7
1.7*0
10
20
30
40
50
60
70
80
less than$100
$100-249 $250-499 $500-999 $1,000-4,999 $5,000 ormore
General Special Trade
Number of Residential Remodeler Establishments by Annual Receipts (Thousands), 2002
*The number of general and special trade remodelers with receipts of $5 million or more is 900 and 800 respectively.
Source: Unpublished tabulations of the 2002 Economic Census of Construction, U.S. Census Bureau.
Special trade remodeling contractors make up about three-fifths of the 200,000
professional remodeling businesses with payrolls but only a few areas of specialty work
dominate the field. Seventy-five percent of special trade remodelers primarily work in one of the
following areas: building systems, painting, finish carpentry, or roofing. By far the largest area
of special trade remodeling is building systems, which includes plumbing, HVAC and electrical
trades. Thirty-eight percent of all special trade remodeling businesses are in the building system
trades and these businesses comprise 43 percent of total special trade employment and 44 percent
of total remodeling receipts for all special trades. Painting remodelers have the second largest
6
share of special trade remodeler establishments at 14 percent, and roofing remodelers have the
second largest shares of employment and receipts at 12 percent each.
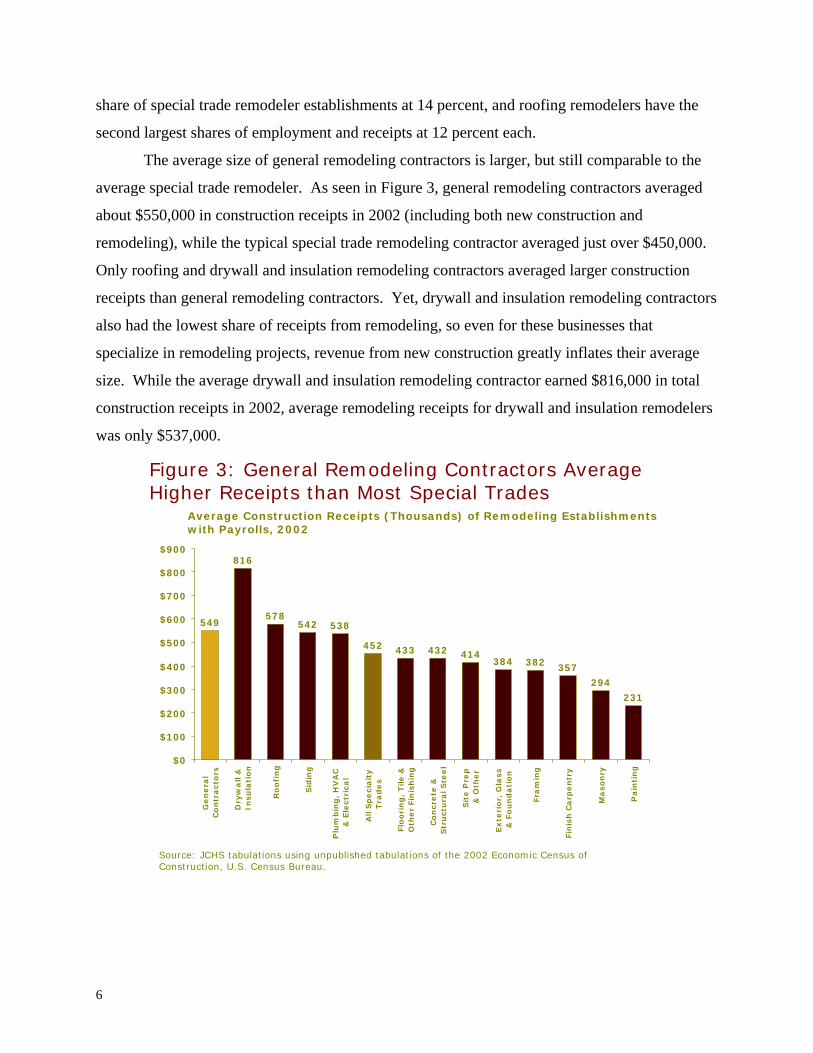
The average size of general remodeling contractors is larger, but still comparable to the
average special trade remodeler. As seen in Figure 3, general remodeling contractors averaged
about $550,000 in construction receipts in 2002 (including both new construction and
remodeling), while the typical special trade remodeling contractor averaged just over $450,000.
Only roofing and drywall and insulation remodeling contractors averaged larger construction
receipts than general remodeling contractors. Yet, drywall and insulation remodeling contractors
also had the lowest share of receipts from remodeling, so even for these businesses that
specialize in remodeling projects, revenue from new construction greatly inflates their average
size. While the average drywall and insulation remodeling contractor earned $816,000 in total
construction receipts in 2002, average remodeling receipts for drywall and insulation remodelers
was only $537,000.
Figure 3: General Remodeling Contractors Average Higher Receipts than Most Special Trades
549
816
578542 538
452 433 432 414384 382 357
294231
$0
$100
$200
$300
$400
$500
$600
$700
$800
$900
Ge
ne
ral
Co
ntr
act
ors
Dry
wa
ll &
In
sula
tio
n
Ro
ofi
ng
Sid
ing
Plu
mb
ing
, H
VA
C
& E
lect
rica
l
All
Sp
eci
alt
y T
rad
es
Flo
ori
ng
, T
ile &
Oth
er
Fin
ish
ing
Co
ncr
ete
&
Str
uct
ura
l Ste
el
Sit
e P
rep
&
Oth
er
Ex
teri
or,
Gla
ss
& F
ou
nd
ati
on
Fra
min
g
Fin
ish
Ca
rpe
ntr
y
Ma
son
ry
Pa
inti
ng
Average Construction Receipts (Thousands) of Remodeling Establishments with Payrolls, 2002
Source: JCHS tabulations using unpublished tabulations of the 2002 Economic Census of Construction, U.S. Census Bureau.
7
Regional Differences
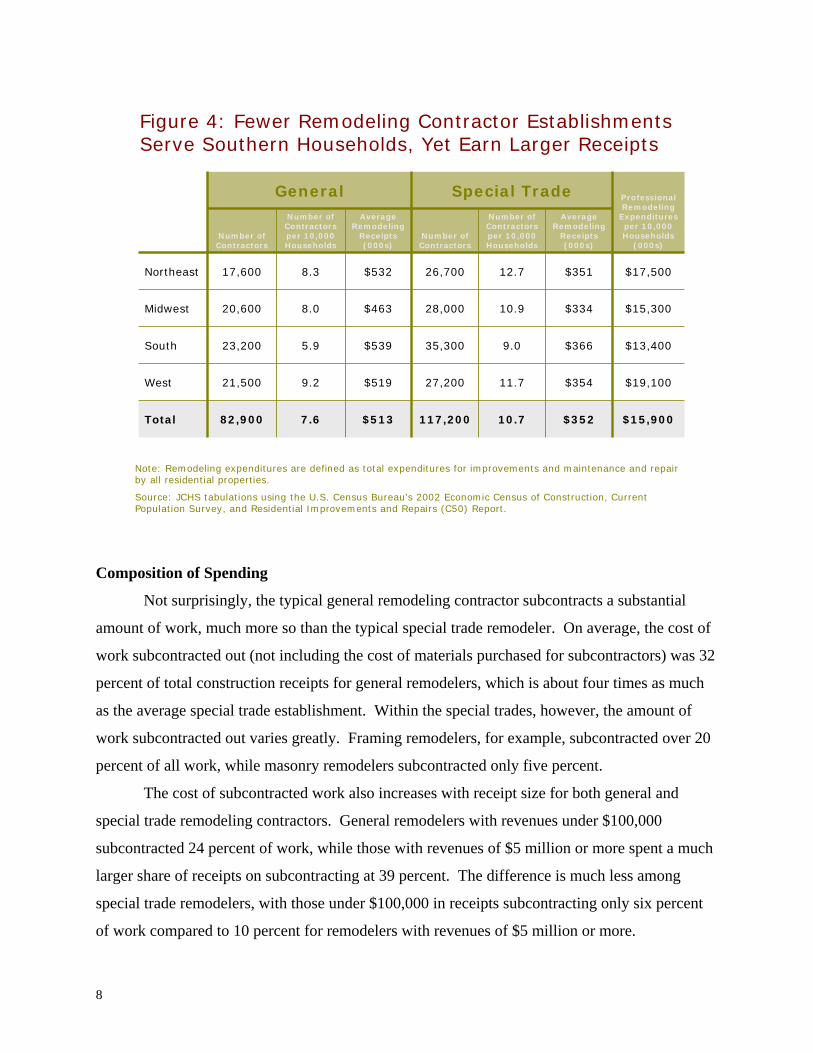
Residential remodeling contractors with payrolls show several differences by region.
While professional remodelers were fairly evenly dispersed across the four major regions of the
country, the South had the greatest share of general and special trade remodelers (close to 30
percent of the nation’s total) in 2002.6 On a per household basis, however, the South had the
fewest number of remodeling businesses. There were only 15 remodeling establishments per
10,000 households in the South compared to 19 in the Midwest and 21 in both the Northeast and
West (Figure 4). Also, on a per household basis, Southern homeowners spent the least on
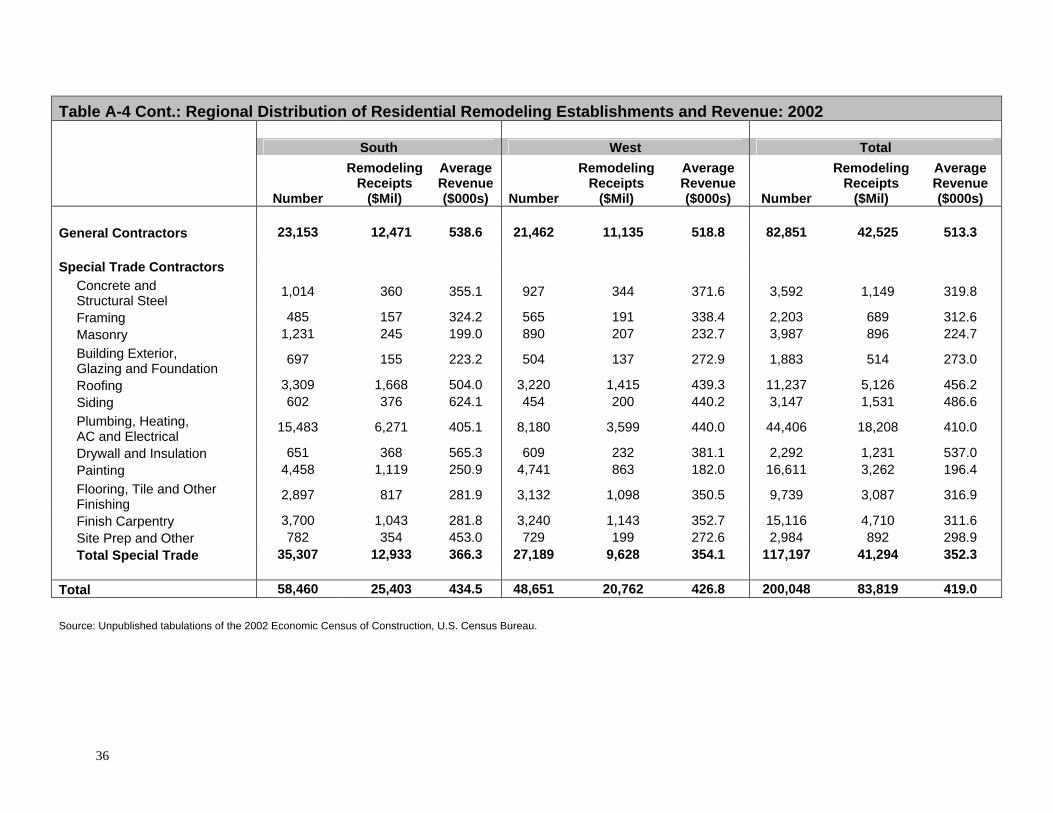
improvements at $13.4 million per 10,000 households in 2002, but both general and special trade
remodelers operating in the South were typically larger than in other parts of the country, with
average remodeling receipts of $539,000 and $366,000 respectively (Appendix Table A-4).
Lastly, while general remodeling contractors are much larger on average than special trade
remodelers, the magnitude of this relationship varies by region. General remodeling businesses
reported on average 39 percent more revenue than special trade remodelers in the Midwest and
up to 51 percent more in the Northeast.
6 The U.S. Census Bureau groups states into four regions: Northeast, Midwest, South, and West. See http://www.census.gov/geo/www/us_regdiv.pdf for regional definitions.
8
Figure 4: Fewer Remodeling Contractor Establishments Serve Southern Households, Yet Earn Larger Receipts
$15,900$35210.7117,200$5137.682,900Total
$19,100 $354 11.7 27,200 $519 9.2 21,500 West
$13,400 $366 9.0 35,300 $539 5.9 23,200 South
$15,300 $334 10.9 28,000 $463 8.0 20,600 Midwest
$17,500 $351 12.7 26,700 $532 8.3 17,600 Northeast
Average Remodeling
Receipts (000s)
Number of Contractors per 10,000 Households
Number of Contractors
Average Remodeling
Receipts (000s)
Number of Contractors per 10,000 Households
Number of Contractors
ProfessionalRemodeling
Expenditures per 10,000 Households
(000s)
Special Trade General
Note: Remodeling expenditures are defined as total expenditures for improvements and maintenance and repair by all residential properties.
Source: JCHS tabulations using the U.S. Census Bureau's 2002 Economic Census of Construction, Current Population Survey, and Residential Improvements and Repairs (C50) Report.
Composition of Spending
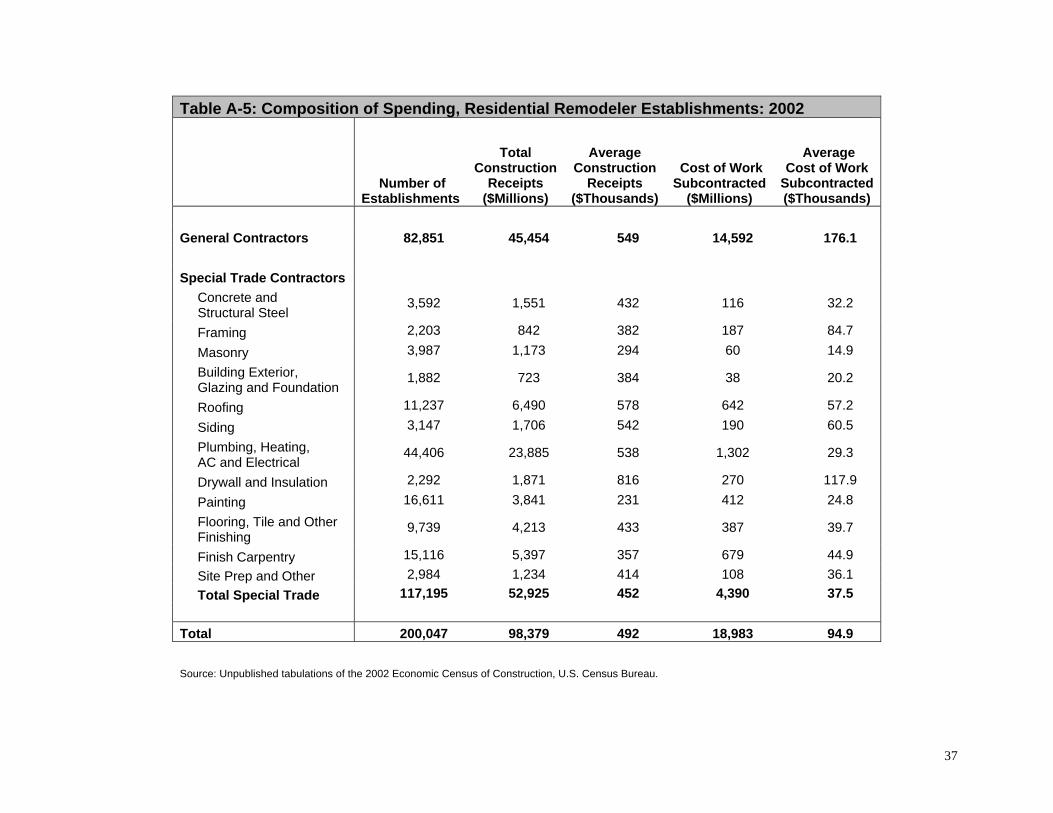
Not surprisingly, the typical general remodeling contractor subcontracts a substantial
amount of work, much more so than the typical special trade remodeler. On average, the cost of
work subcontracted out (not including the cost of materials purchased for subcontractors) was 32
percent of total construction receipts for general remodelers, which is about four times as much
as the average special trade establishment. Within the special trades, however, the amount of
work subcontracted out varies greatly. Framing remodelers, for example, subcontracted over 20
percent of all work, while masonry remodelers subcontracted only five percent.
The cost of subcontracted work also increases with receipt size for both general and
special trade remodeling contractors. General remodelers with revenues under $100,000
subcontracted 24 percent of work, while those with revenues of $5 million or more spent a much
larger share of receipts on subcontracting at 39 percent. The difference is much less among
special trade remodelers, with those under $100,000 in receipts subcontracting only six percent
of work compared to 10 percent for remodelers with revenues of $5 million or more.
9
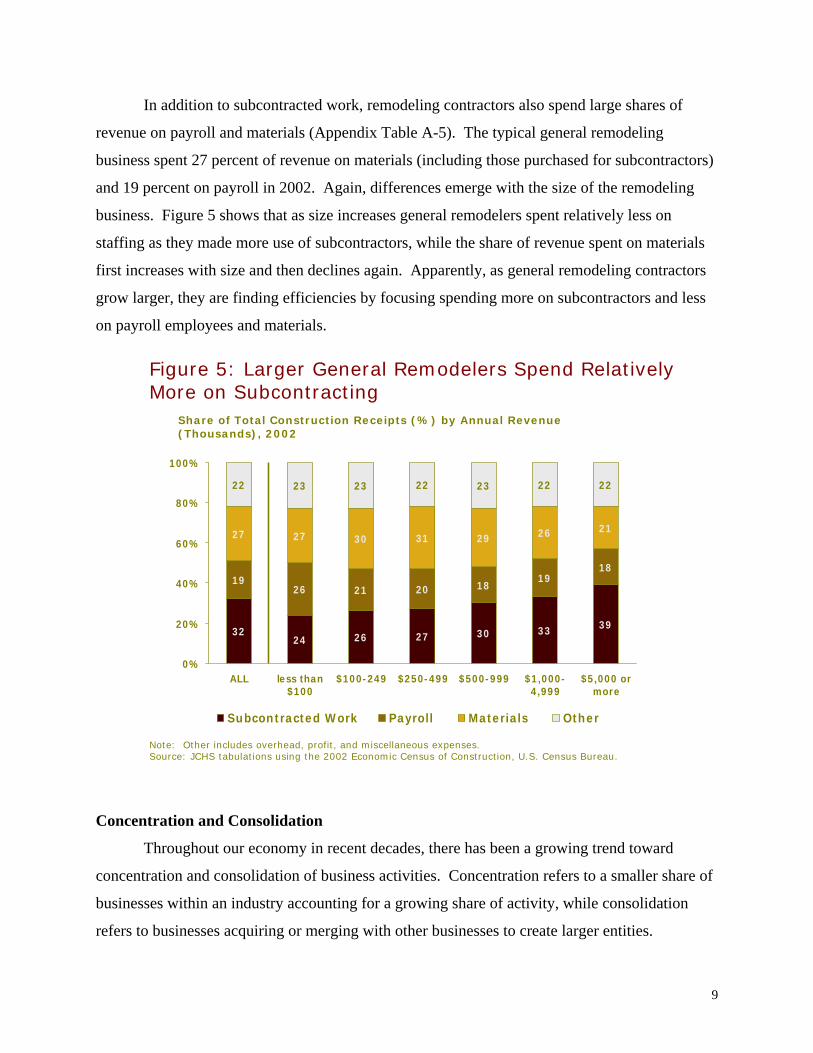
In addition to subcontracted work, remodeling contractors also spend large shares of
revenue on payroll and materials (Appendix Table A-5). The typical general remodeling
business spent 27 percent of revenue on materials (including those purchased for subcontractors)
and 19 percent on payroll in 2002. Again, differences emerge with the size of the remodeling
business. Figure 5 shows that as size increases general remodelers spent relatively less on
staffing as they made more use of subcontractors, while the share of revenue spent on materials
first increases with size and then declines again. Apparently, as general remodeling contractors
grow larger, they are finding efficiencies by focusing spending more on subcontractors and less
on payroll employees and materials.
Figure 5: Larger General Remodelers Spend Relatively More on Subcontracting
39333027262432
1819
1820212619
21262931302727
22222322232322
0%
20%
40%
60%
80%
100%
ALL less than$100
$100-249 $250-499 $500-999 $1,000-4,999
$5,000 ormore
Subcontracted Work Payroll Materials Other
Share of Total Construction Receipts (%) by Annual Revenue (Thousands), 2002
Note: Other includes overhead, profit, and miscellaneous expenses.Source: JCHS tabulations using the 2002 Economic Census of Construction, U.S. Census Bureau.
Concentration and Consolidation
Throughout our economy in recent decades, there has been a growing trend toward
concentration and consolidation of business activities. Concentration refers to a smaller share of
businesses within an industry accounting for a growing share of activity, while consolidation
refers to businesses acquiring or merging with other businesses to create larger entities.
10
The scale of activity created by concentration and consolidation often produces greater
efficiencies by reducing the share of resources that need to be devoted to centralized overhead
functions (e.g. human resources, information technology, space management). Additionally it
may give a business sufficient market power to be able to negotiate more effectively with its
suppliers, and sufficient revenue to fend off challenges from its competition.
In the homebuilding sector, a wave of consolidation began in the early 1990s that
continues to this day. Over this time, the share of new homes sold by the top ten builders in the
country grew from under 10 percent in 1991 to almost 30 percent by 2006.7 The need to raise
capital on Wall Street to finance larger and larger land positions is often cited as a key reason for
this consolidation among home builders.8
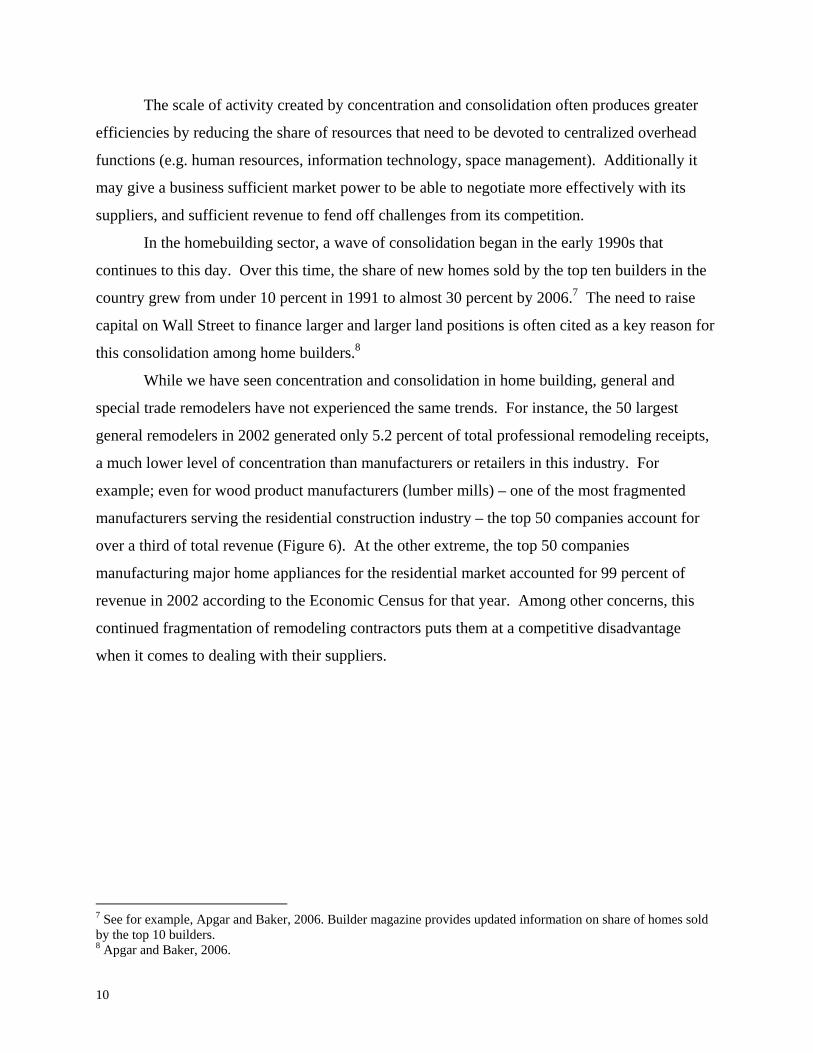
While we have seen concentration and consolidation in home building, general and
special trade remodelers have not experienced the same trends. For instance, the 50 largest
general remodelers in 2002 generated only 5.2 percent of total professional remodeling receipts,
a much lower level of concentration than manufacturers or retailers in this industry. For
example; even for wood product manufacturers (lumber mills) – one of the most fragmented
manufacturers serving the residential construction industry – the top 50 companies account for
over a third of total revenue (Figure 6). At the other extreme, the top 50 companies
manufacturing major home appliances for the residential market accounted for 99 percent of
revenue in 2002 according to the Economic Census for that year. Among other concerns, this
continued fragmentation of remodeling contractors puts them at a competitive disadvantage
when it comes to dealing with their suppliers.
7 See for example, Apgar and Baker, 2006. Builder magazine provides updated information on share of homes sold by the top 10 builders. 8 Apgar and Baker, 2006.
11
Figure 6: The Remodeling Contractor Industry Remains More Fragmented Than Other Parts of the Residential Construction Sector
1.4
42.0
10.0
2.1
45.3
15.4
48.4
25.1
5.2
51.5
35.4
3.3
0
10
20
30
40
50
60
General RemodelingContractors
Building MaterialSupply Dealers
Wood ProductManufacturers
Top 4 Top 8 Top 20 Top 50Sources: Unpublished tabulations of the 2002 Economic Census of Construction, and 2002 Censuses of Retailers and Manufacturers.
Share of Total Revenue (Percent)
Remodeling contractors remain a fragmented industry with no signs of emerging
concentration. The combined number of payroll and nonpayroll remodeling businesses grew an
astonishing 32 percent over the five year time period from 1997 to 2002.9 Most of this growth in
remodeling businesses is attributed to the dramatic rise in self-employed remodelers, which tend
to be relatively small establishments as noted earlier. The addition of many small remodelers
adds to the traditional fragmentation that has characterized this industry.
While there is little evidence indicating that the remodeling industry is taking steps
toward consolidation, some contractors do work at a significantly larger scale than others. Close
to 10,000 general remodeling contracting firms, or about 12 percent of all general remodeling
establishments, generated revenue of one million dollars or more in 2002. These remodelers
accounted for a disproportionately large share of both employment and revenue in the industry,
with over 40 percent of total employment and close to 60 percent of total construction receipts
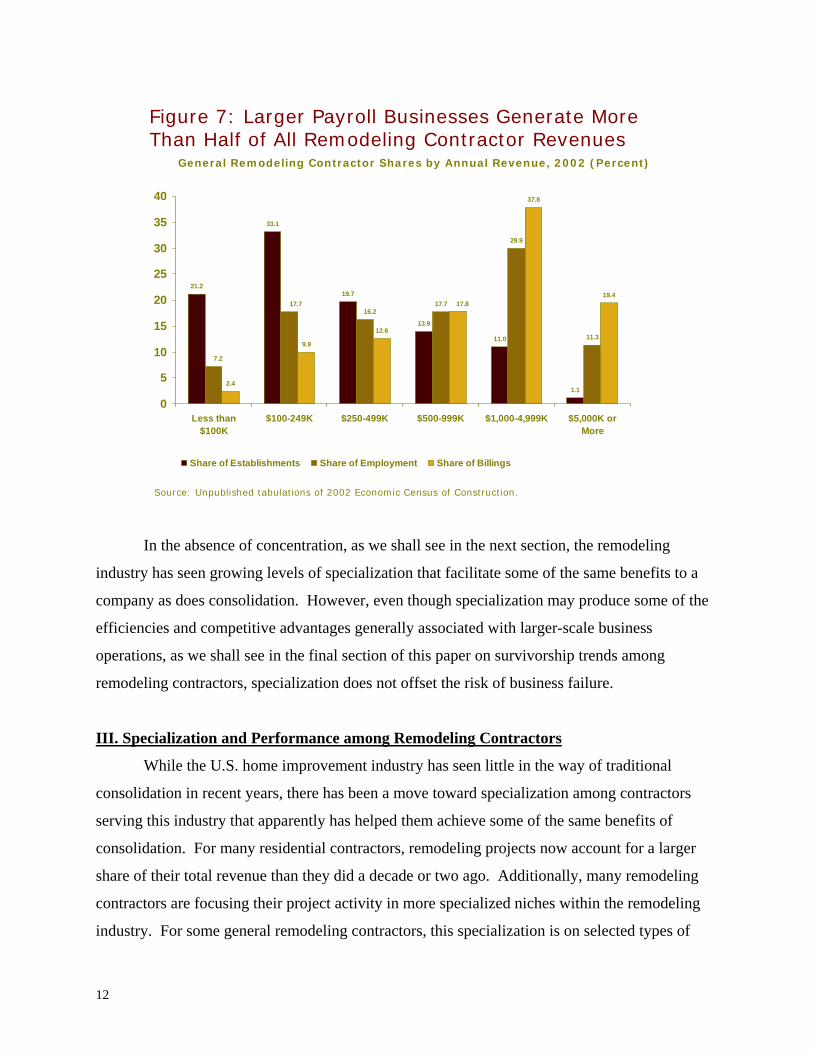
generated by general remodeling contractor businesses with payrolls (Figure 7).
9 See Chapter 2 in the Joint Center report Foundations for Future Growth in the Remodeling Industry for detail on growth in payroll and self-employed remodelers.
12
Figure 7: Larger Payroll Businesses Generate More Than Half of All Remodeling Contractor Revenues
21.2
33.1
19.7
13.9
11.0
1.1
17.7
29.9
11.3
2.4
9.9
12.6
37.8
19.4
7.2
16.217.7 17.8
0
5
10
15
20
25
30
35
40
Less than$100K
$100-249K $250-499K $500-999K $1,000-4,999K $5,000K orMore
Share of Establishments Share of Employment Share of Billings
Source: Unpublished tabulations of 2002 Economic Census of Construction.
General Remodeling Contractor Shares by Annual Revenue, 2002 (Percent)
In the absence of concentration, as we shall see in the next section, the remodeling
industry has seen growing levels of specialization that facilitate some of the same benefits to a
company as does consolidation. However, even though specialization may produce some of the
efficiencies and competitive advantages generally associated with larger-scale business
operations, as we shall see in the final section of this paper on survivorship trends among
remodeling contractors, specialization does not offset the risk of business failure.
III. Specialization and Performance among Remodeling Contractors
While the U.S. home improvement industry has seen little in the way of traditional
consolidation in recent years, there has been a move toward specialization among contractors
serving this industry that apparently has helped them achieve some of the same benefits of
consolidation. For many residential contractors, remodeling projects now account for a larger
share of their total revenue than they did a decade or two ago. Additionally, many remodeling
contractors are focusing their project activity in more specialized niches within the remodeling
industry. For some general remodeling contractors, this specialization is on selected types of
13
remodeling projects, such as kitchen and bath remodeling, decks or basements. Others may
focus on projects of a certain size or complexity, such as smaller handyman services or larger
upper-end design/build projects. Still others may specialize on a specific type of client, for
example large rental property owners, or insurance companies for disaster-related restoration
projects. This section looks generally at how specialization affects the performance of
residential remodeling firms, as well as how the underlying volatility in the remodeling industry
affects specialty firms.
Increased Industry Specialization
Over the past few decades, residential remodeling has become a more specialized
industry. Traditionally, general construction contractors and special trade contractors often
served multiple construction sectors including homebuilding, residential remodeling,
nonresidential construction, and nonresidential reconstruction. However, more recent
government construction Censuses indicate that most contractors now concentrate their work in a
single construction sector. For example, the 2002 Construction Census indicates that 85 percent
of the total value of remodeling receipts for general residential contractors was generated by
general remodeling contracting firms, up from 82 percent in 1997.10 So, from an industry-wide
perspective, the overwhelming majority of remodeling work is done by firms that concentrate on
remodeling projects. When looking at specialization through a slightly different lens – the
individual general remodeling contractor – it is even more apparent: in 2002 the average
remodeling contractor generated 94 percent of its business from remodeling projects.
Special trade remodelers are somewhat less focused on remodeling than general
contractors. Still, from an industry perspective fully 75 percent of special trade remodeling
industry revenue in 2002 was generated by those specialty trade firms that could be classified as
remodeling firms. A similar picture emerges from an individual firm perspective. The typical
special trade remodeling contractor generated 78 percent of its revenue from remodeling
projects. However, there was a high degree of variation in terms of specialization for these
10 In this analysis, remodeling contractors are defined as those contractors that received more than half of their revenue from remodeling projects that year based on unpublished tabulations of the Economic Census of Construction. However, this Census covers only businesses with payrolls. As was discussed earlier in this report, nonpayroll firms make up the majority of businesses serving the remodeling industry, and account for a significant portion of industry revenue. The inclusion of nonemployer businesses would no doubt change the specialization figures but probably not the broad conclusions from this analysis.
14
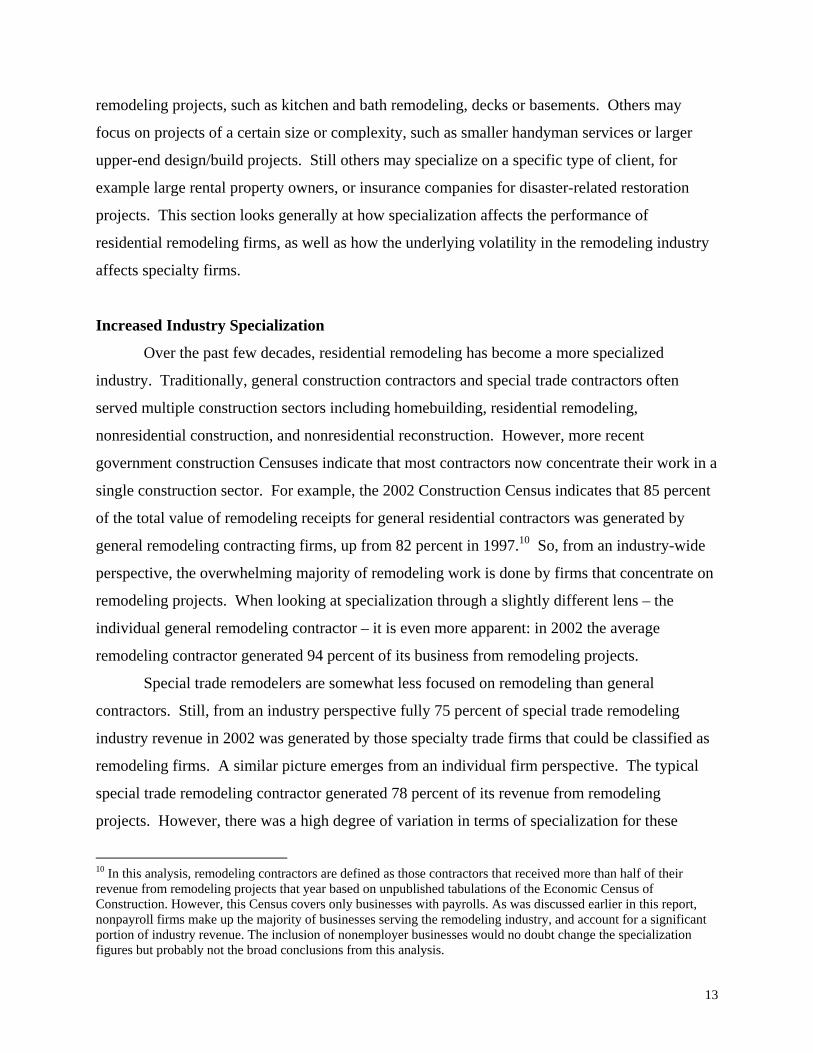
special trade remodeling firms by their individual trade. While averaging 78 percent, siding
remodelers averaged 90 percent of their revenue from remodeling, and drywall and insulation
remodeling contractors averaged just 66 percent, apparently finding it easier to move back and
forth between remodeling and new construction projects (Figure 8).
Figure 8: General Contractors Focus More on Remodeling Than Specialty Trades
94
9087
8582
79 7876 76
74 73 72 71
66
60%
65%
70%
75%
80%
85%
90%
95%
100%
Gen
eral
Rem
od
eler
s
Sid
ing
Fin
ish
C
arp
entr
y
Pai
nti
ng
Fram
ing
Ro
ofi
ng
All
Sp
ecia
lty
Tra
des
Mas
on
ry
Plu
mb
ing
, H
VA
C
& E
lect
rica
l
Co
ncr
ete
&S
tru
ctu
ral
Ste
el
Flo
ori
ng
, T
ile
&
Oth
er F
inis
hin
g
Sit
e P
rep
&
Oth
er
Bu
ild
ing
Ext
erio
r,
Gla
ss &
Fo
un
dat
ion
Dry
wal
l &
In
sula
tio
n
Percent of Total Construction Receipts from Remodeling
Source: JCHS tabulations using unpublished tabulations of the 2002 Economic Census of Construction,U.S. Census Bureau.
Franchising seems to be a promising business model for remodeling contractors that may
lead to both increased industry specialization and consolidation. Franchising a national
operation provides remodelers with established systems for key business operations such as
marketing, sales, scheduling, and financial management. Established systems and procedures as
well as training and support are very attractive benefits to franchising for smaller scale
remodelers wanting to increase their revenues, expand their offerings, gain brand awareness or
simply remain profitable.
While the total number of remodeling franchise businesses is not available, Qualified
Remodeler magazine began tracking large national franchises in 2003 as part of its annual Top
500 Remodelers survey. Fourteen major remodeling franchises have been identified through this
15
effort.11 Insurance restoration franchises, full-service and handyman firms are included on the
National Firms list, but most of the largest remodeling franchises are specialty firms focusing on
siding, windows, basements, decks, kitchens or baths. The top franchises in 2006 had over 1,000
locations across the U.S. and reported revenue of $1.2 billion. Remodeling franchises that
appeared on the National Firms list every year from 2003-2006 had annual revenue growth of
19.6 percent on average.12 This high growth rate is likely due to both increased sales and gains
in the number of franchise locations in operation. In either case, franchising appears to be
gaining popularity among remodeling contractors as a sound and successful business strategy.
Optimal Size for Remodeling Contractors
In spite of the considerable fragmentation of remodeling contractors, little research has
been conducted to identify the optimal size of a firm serving this industry. The ease of entry into
the industry – capital needs generally are modest and licensing and registration requirements for
contractors are minimal in most communities – coupled with the variation in building codes from
community to community, point to competitive advantages for smaller firms serving a local
market. On the other hand, economies of scale for marketing, as well as the required level of
investments to develop systems for scheduling, ordering, and billing point to advantages of scale
in remodeling operations.
Many remodeling practitioners feel that the optimal size of a remodeling firm depends on
its specialization. Mark Richardson, President of Case Design/Remodeling, a large full-service
remodeling firm with many specialty divisions, has developed a typology of firm specialties and
identified what he feels to be the ideal range for the scale of operations for each of these
specialties. Firms installing specialty products (e.g. skylights, garage doors, gutters) lend
themselves to smaller-scale operations because demand for any of these products in a local area
is usually limited. Contractors undertaking more common specialty projects (e.g. roofing,
siding, or window replacements) where the typical individual project size is larger can benefit
from larger scale opportunities that the market presents. 11 By area of business, these fourteen franchises are: Insurance Restoration – Paul Davis Restoration and Disaster Kleenup International; Full-Service – True Home Value; Handyman – Handyman Connection; Single-line Specialty – Window World, Accent Windows, Nationwide Floor & Window, DreamMaker Kitchen & Bath, Kitchen Tune-Up, ABC Seamless, United States Seamless, Liquid Siding of America, Archadeck and Owens Corning Remodeling. 12 The following four national franchise companies appeared on Qualified Remodeler’s National Firms list since the list began in 2003: Paul Davis Restoration, Window World, ABC Seamless and DreamMaker Kitchen & Bath.
16
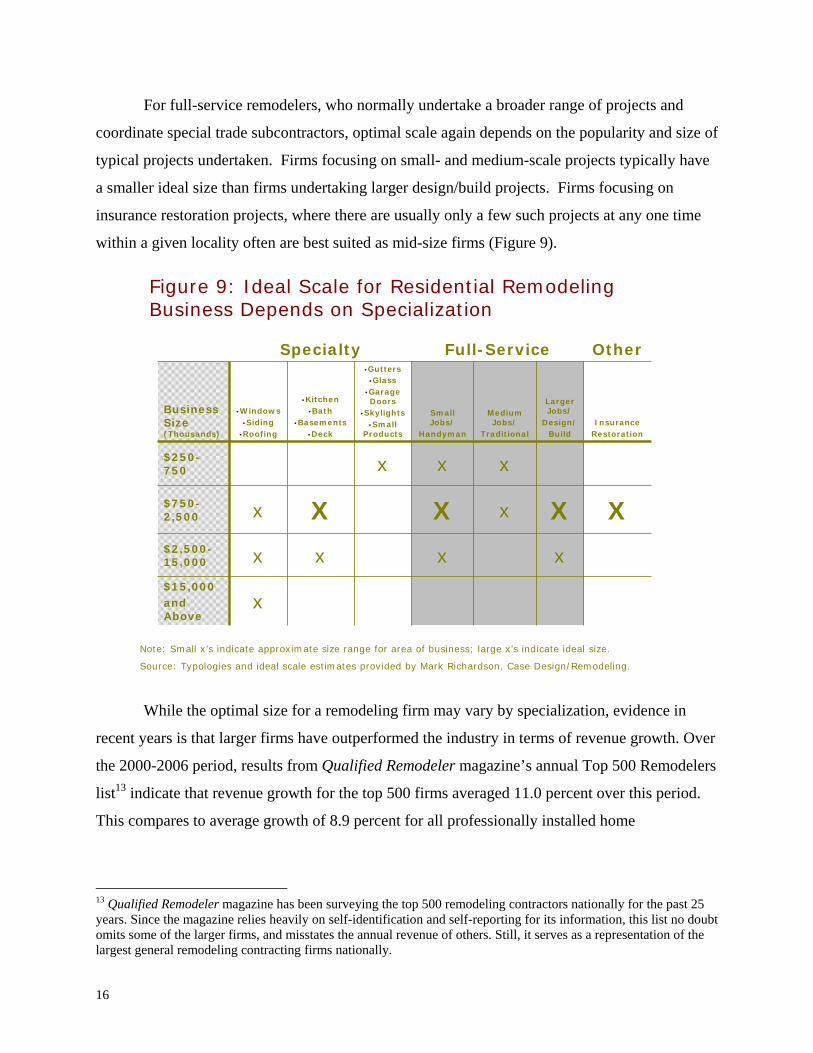
For full-service remodelers, who normally undertake a broader range of projects and
coordinate special trade subcontractors, optimal scale again depends on the popularity and size of
typical projects undertaken. Firms focusing on small- and medium-scale projects typically have
a smaller ideal size than firms undertaking larger design/build projects. Firms focusing on
insurance restoration projects, where there are usually only a few such projects at any one time
within a given locality often are best suited as mid-size firms (Figure 9).
Figure 9: Ideal Scale for Residential Remodeling Business Depends on Specialization
Note: Small x’s indicate approximate size range for area of business; large x’s indicate ideal size.
Source: Typologies and ideal scale estimates provided by Mark Richardson, Case Design/Remodeling.
OtherFull-ServiceSpecialty
x$15,000and Above
xxxx$2,500-15,000
XXxXXx$750-2,500
xxx$250-750
InsuranceRestoration
Larger Jobs/
Design/Build
Medium Jobs/
Traditional
Small Jobs/
Handyman
•Gutters•Glass
•Garage Doors
•Skylights•Small
Products
•Kitchen•Bath
•Basements•Deck
•Windows•Siding
•Roofing
Business Size(Thousands)
While the optimal size for a remodeling firm may vary by specialization, evidence in
recent years is that larger firms have outperformed the industry in terms of revenue growth. Over
the 2000-2006 period, results from Qualified Remodeler magazine’s annual Top 500 Remodelers
list13 indicate that revenue growth for the top 500 firms averaged 11.0 percent over this period.
This compares to average growth of 8.9 percent for all professionally installed home
13 Qualified Remodeler magazine has been surveying the top 500 remodeling contractors nationally for the past 25 years. Since the magazine relies heavily on self-identification and self-reporting for its information, this list no doubt omits some of the larger firms, and misstates the annual revenue of others. Still, it serves as a representation of the largest general remodeling contracting firms nationally.
17
improvement projects according to the U.S. Census Bureau’s survey of residential improvements
and repairs (C50).14
Volatility in Remodeling Activity
Like most sectors in the construction industry, remodeling activity exhibits a lot of
variability in year-to-year levels of activity. This is because large portions of the remodeling
industry are composed of discretionary expenditures, which households will undertake when the
economy is healthy, financing costs are favorable, and incomes are growing. When the economy
is weak and conditions are unfavorable, households will typically defer these expenditures.
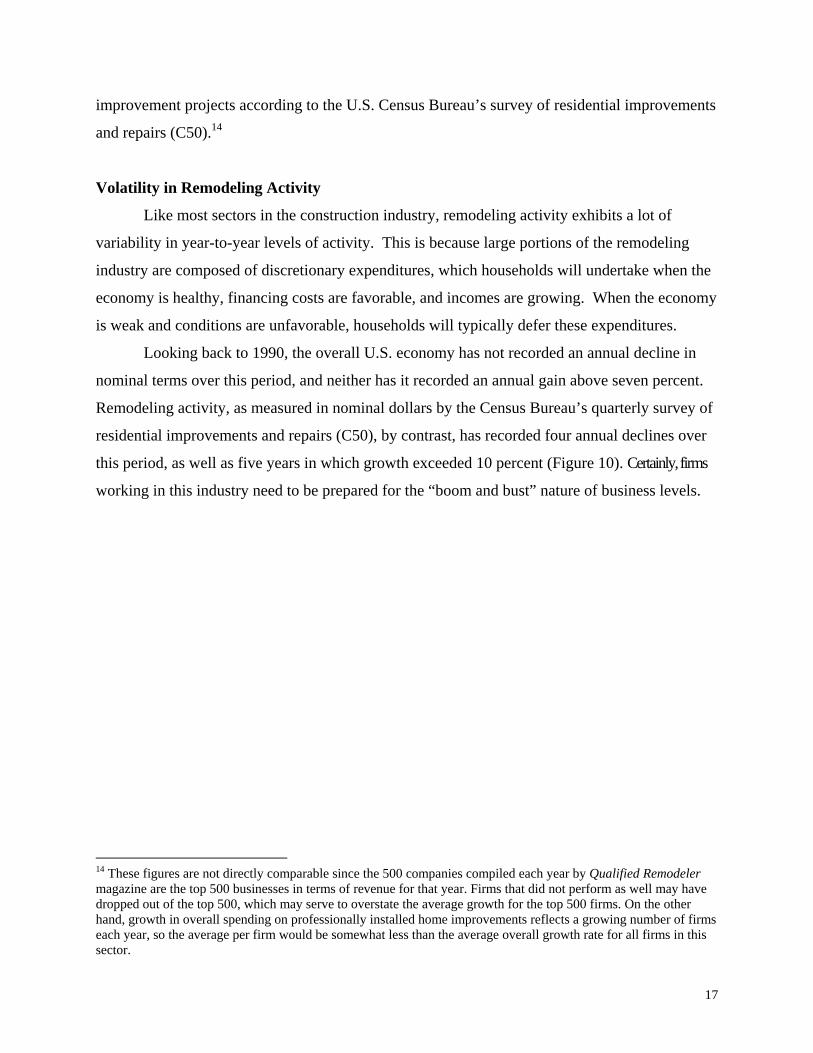
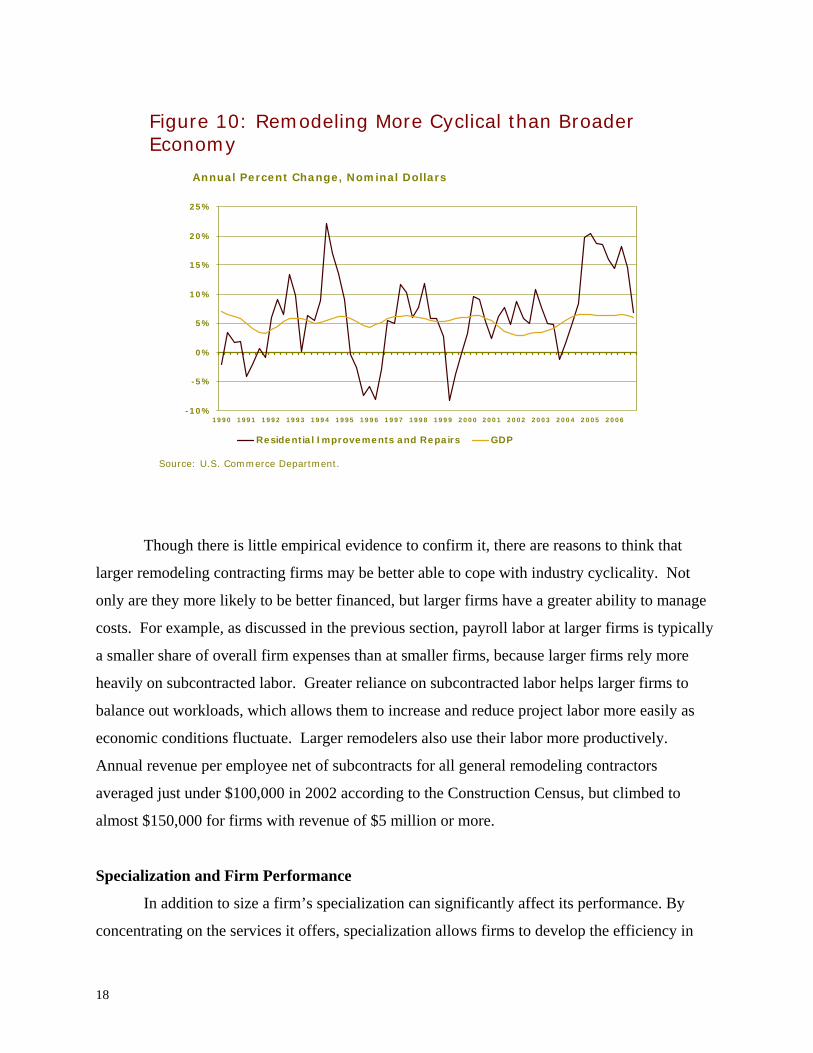
Looking back to 1990, the overall U.S. economy has not recorded an annual decline in
nominal terms over this period, and neither has it recorded an annual gain above seven percent.
Remodeling activity, as measured in nominal dollars by the Census Bureau’s quarterly survey of
residential improvements and repairs (C50), by contrast, has recorded four annual declines over
this period, as well as five years in which growth exceeded 10 percent (Figure 10). Certainly, firms
working in this industry need to be prepared for the “boom and bust” nature of business levels.
14 These figures are not directly comparable since the 500 companies compiled each year by Qualified Remodeler magazine are the top 500 businesses in terms of revenue for that year. Firms that did not perform as well may have dropped out of the top 500, which may serve to overstate the average growth for the top 500 firms. On the other hand, growth in overall spending on professionally installed home improvements reflects a growing number of firms each year, so the average per firm would be somewhat less than the average overall growth rate for all firms in this sector.
18
Figure 10: Remodeling More Cyclical than Broader Economy
-10%
-5%
0%
5%
10%
15%
20%
25%
1990 1991 1992 1993 1994 1995 1996 1997 1998 1999 2000 2001 2002 2003 2004 2005 2006
Residential Improvements and Repairs GDP
Source: U.S. Commerce Department.
Annual Percent Change, Nominal Dollars
Though there is little empirical evidence to confirm it, there are reasons to think that
larger remodeling contracting firms may be better able to cope with industry cyclicality. Not
only are they more likely to be better financed, but larger firms have a greater ability to manage
costs. For example, as discussed in the previous section, payroll labor at larger firms is typically
a smaller share of overall firm expenses than at smaller firms, because larger firms rely more
heavily on subcontracted labor. Greater reliance on subcontracted labor helps larger firms to
balance out workloads, which allows them to increase and reduce project labor more easily as
economic conditions fluctuate. Larger remodelers also use their labor more productively.
Annual revenue per employee net of subcontracts for all general remodeling contractors
averaged just under $100,000 in 2002 according to the Construction Census, but climbed to
almost $150,000 for firms with revenue of $5 million or more.
Specialization and Firm Performance
In addition to size a firm’s specialization can significantly affect its performance. By
concentrating on the services it offers, specialization allows firms to develop the efficiency in
19
operations of larger full-service firms. Additionally, these firms may gain the market power with
its suppliers of larger full-service firms for the narrower set of product lines that it purchases. In
this sense, specialized remodeling contractors can gain some of the efficiencies and market power
that normally would derive from industry concentration without actually having to consolidate.
In fact, the majority of larger remodeling firms have specialized their service offerings.
Of the 500 top firms from Qualified Remodeler magazine’s 2006 list, close to two out of five
firms are classified as specialty remodelers (e.g. roofing, siding, window replacement
contractors). Another 28 percent of the top firms are classified as design/build firms, meaning
that they offer design as well as construction services to their clients, often because of the
complexity of the projects. Full-service firms, meaning they provide home improvement
services across a broad spectrum of remodeling projects, comprise just 27 percent of the top 500
firms on this list.15 The remaining seven percent of firms on the list are in the “other” category,
mostly encompassing insurance restoration, handyman services, and franchises.
While specialization may allow a remodeling firm to operate more efficiently, a risk of
this strategy is that it exposes the firm to greater levels of volatility. For example, if business
conditions change in a local market, firms with less diversified project offerings may well see
greater volatility in revenue.
Indeed, analysis of Qualified Remodeler magazine’s database of top 500 remodeling
contractors over the 2000 to 2006 period16 indicates that more specialized remodeling firms –
design/build, specialty, and “other” – generally reported more revenue volatility than full-service
firms and for some categories this higher volatility was not even compensated with higher
revenue growth.
For this analysis, volatility was measured as the differential in compound annual growth
rates over the 2000 to 2006 period between the worst-performing 25 percent of firms in a
category (25th percentile) and the best-performing 25 percent of firms (75th percentile). The result
was that design/build, specialty, and “other” firms showed somewhat more volatility in revenue
growth as compared to full-service firms. However, design/build was the only category that
15 Even these full-service firms, however, may be categorized as full-service because they have a broad range of specialty divisions. Therefore, they may be organized like specialty firms but still be classified as full-service firms because of the range of services offered. 16 Since firms that routinely reported information to Qualified Remodeling magazine were assumed to provide more accurate information than those that only responded occasionally, this analysis was restricted to firms that reported information in both 2000 and 2006, and that reported information for at least four years over this period.
20
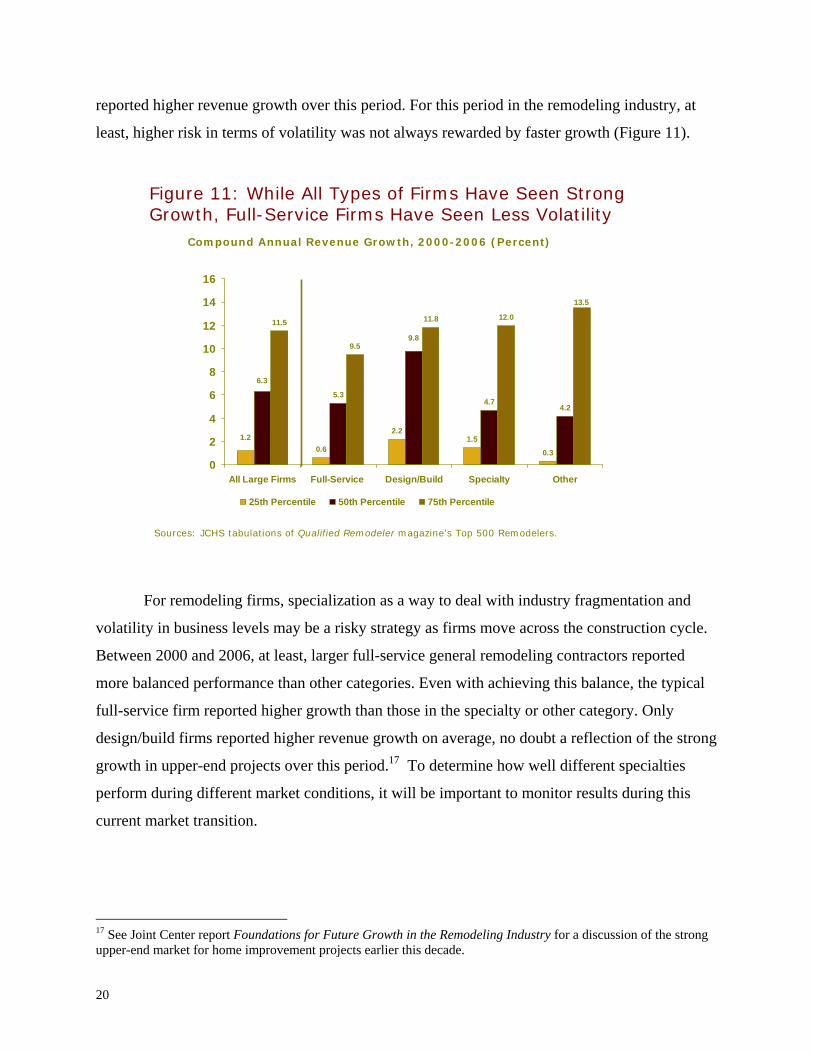
reported higher revenue growth over this period. For this period in the remodeling industry, at
least, higher risk in terms of volatility was not always rewarded by faster growth (Figure 11).
Figure 11: While All Types of Firms Have Seen Strong Growth, Full-Service Firms Have Seen Less Volatility
Sources: JCHS tabulations of Qualified Remodeler magazine’s Top 500 Remodelers.
0.6
2.21.5
0.3
5.34.7
4.2
11.5
9.5
11.8 12.0
1.2
9.8
6.3
13.5
0
2
4
6
8
10
12
14
16
All Large Firms Full-Service Design/Build Specialty Other
25th Percentile 50th Percentile 75th Percentile
Compound Annual Revenue Growth, 2000-2006 (Percent)
For remodeling firms, specialization as a way to deal with industry fragmentation and
volatility in business levels may be a risky strategy as firms move across the construction cycle.
Between 2000 and 2006, at least, larger full-service general remodeling contractors reported
more balanced performance than other categories. Even with achieving this balance, the typical
full-service firm reported higher growth than those in the specialty or other category. Only
design/build firms reported higher revenue growth on average, no doubt a reflection of the strong
growth in upper-end projects over this period.17 To determine how well different specialties
perform during different market conditions, it will be important to monitor results during this
current market transition.
17 See Joint Center report Foundations for Future Growth in the Remodeling Industry for a discussion of the strong upper-end market for home improvement projects earlier this decade.
21
IV. Remodeling Contractor Survivorship
Certainly the remodeling industry is dominated by many small contractor establishments,
which have greater exposure to the recurrent upturns and downturns in the housing and
remodeling markets. The nature of the remodeling industry is such that the costs of entry are
relatively low. However, a large number of small businesses with modest investments entering
the industry when the market is strong and then exiting when it takes a turn for the worse makes
for an unstable industry.
The study of business dynamics for firms outside of the manufacturing sector was for
many years hampered by difficulties in tracking businesses over time. Jovanovic (1982)
provides a theoretical framework for the growth and survival of firms, such that firms enter an
industry not knowing their full ability to produce output. Efficient firms grow and survive, while
inefficient firms decline and fail, implying that smaller firms are less efficient and thus more
likely to fail than larger firms. Both Nucci (1999) and Caves (1998) present comprehensive
summaries of the empirical literature on business dissolutions and firm turnover, with much of
the literature concluding that business dissolution declines with the age of the business and also
with the number of employees, yet business dissolution rates are not uniform across all types of
industries or locations. For example, in his research of U.S. businesses with payroll, Nucci
found that both the manufacturing and wholesale industries had the lowest rates of dissolution
with 10 percent of active businesses closing from 1987-1988, and the mining and construction
industries had the highest rates of closure at 15 percent. Though investigating a time period with
a very different economic situation, Knaup (2005) still found some variation among industries,
with start-ups in the information industry in 1998 having a four year dissolution rate of 62
percent, but new establishments in education and health services dissolved at a rate of only 45
percent over four years.
In recent years, several studies have focused on business dissolution and survivorship
within the construction industry. Arditi et al. (2000) analyzed the reasons for contractor failure
and found that over two-thirds of failures from 1989-1993 were due mainly to budgetary reasons,
or administrative systems and procedures under the control of management, while another
quarter of failures were due mainly to macroeconomic issues out of the control of management,
such as industry weakness or high interest rates, to which management could not react quickly
enough or strategize around. In looking at single-family homebuilders in Ontario from 1978-
22
1998, Buzzelli and Harris (2003) concluded that though the business cycle is indeed responsible
for some of the contractor instability in the market, it is the size of the contractor that ultimately
determines industry exits. On average, 40 percent of small builders (building less than 26 homes
per year) exited the homebuilding industry per year compared to less than five percent of large
builders (building more than 100 homes per year). Carliner (2001) also noted that younger
construction establishments exited the industry at a rate more than twice that of older businesses.
More specifically, a 2001 Joint Center for Housing Studies working paper by Belsky et al.
identified significant factors in the dissolution of general and special trade remodeling
contractors and found that, again, the probability of dissolution decreases with age, size, and
growth in residential construction demand.
There exist few data series which can be used to track the same contractors over time, but
one such database is the Business Information Tracking Series (BITS) from the U.S. Census
Bureau.18 Data from BITS provide rough estimates of the magnitude of change in the number of
contractor businesses serving the remodeling industry over time. Compared to other
construction industries, a fairly high share of general remodeling contractors ceased operating
between 2003 and 2004, the most recent year for which data on remodelers are available.19
Almost 13 percent of general remodelers identified in 2003 were no longer operating in 2004,
while the entire construction sector had a failure rate of 11.0 percent and all U.S. businesses with
payrolls had a failure rate of only 9.1 percent over the same time period.20 Moreover, 2003 was
a fairly normal year for the industry, with owner improvements up an estimated 2.5 percent from
the year prior according to the U.S. Census Bureau’s Residential Improvements and Repairs
(C50) Report. Thus, even in a somewhat typical year for the remodeling industry, a relatively
high percentage of businesses still exited the industry. 18 Part of the Statistics of U.S. Businesses program, BITS is a longitudinal database of all known business establishments with payroll in the U.S. Another promising dataset for studying business formations and dissolutions is the Integrated Longitudinal Business Database compiled by the U.S. Census Bureau, which combines the payroll and nonpayroll universes of all business establishments in the U.S. (see Davis et al. 2007). 19 Due to limits of the database, this analysis of contractor survivorship involves identifying contractor establishments in 2003, tabulating how many ceased operations in the following year, and then assessing these one-year failure rates by both the size of the establishment (as gauged by the size of its payroll expenditures since BITS only captures revenue statistics once every five years in which there was an economic census) and by changes to payroll in the year prior to exiting the industry. 20 Incidentally, the term “failure rate” is used here only to mean the establishment ceases to exist, but not necessarily because the business actually failed to generate enough revenue to cover expenses. In fact, Head’s (2000) analysis of the business dynamics of start-ups using BITS data found that close to a third of owners of firms which opened between 1989 and 1992 and closed between 1992 and 1996 considered their business successful at the time of closure.
23
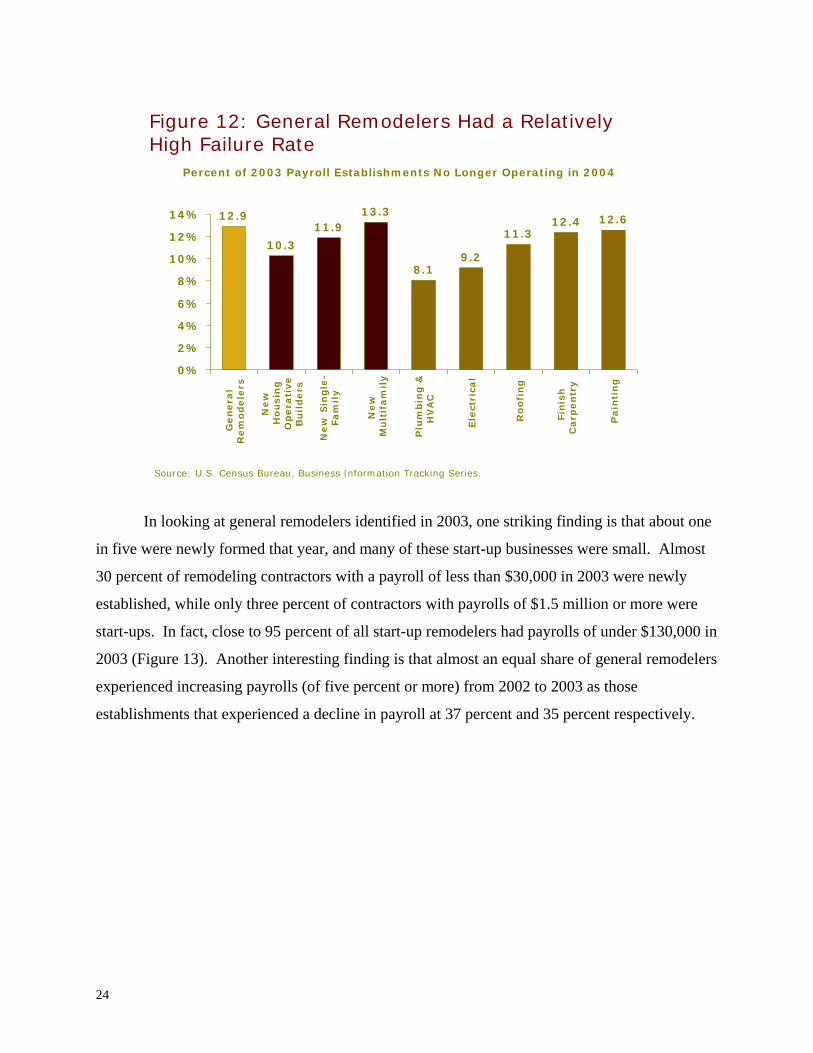
As seen in Figure 12, compared to new residential construction industries, general
remodelers had a higher one-year failure rate in 2004 than both new single-family contractors
and new housing operative builders, 21 while new multifamily construction contractors had a
slightly higher failure rate than general remodelers at 13.3 percent. One of the reasons for the
higher dissolution rate of multifamily builders may be because 2002-2004 was a difficult time
for multifamily builders with stable and then declining starts, which made multifamily
construction by far the weakest segment of new residential construction during that time.22 Also,
when compared to the failure rates of a selection of the largest special trades (in terms of number
of contractor establishments), none had failure rates quite as high as general remodelers. It
should be noted that the special trades in this analysis are defined much more broadly and
include contractors engaged in both new construction and remodeling, as well as both residential
and nonresidential construction. Consistent with previous findings, plumbing, electrical and
roofing contractors average considerably larger receipts than carpentry and painting contractors,
and also have lower dissolution rates, suggesting that the size of the business influences the
likelihood of staying in business.
21 Operative builders are also known as speculative or merchant builders that build either single- or multifamily homes for sale on their own account rather than as contractors. 22 U.S. Census Bureau, Table Q1. New Privately Owned Housing Units Started in the United States by Purpose and Design. See http://www.census.gov/const/www/quarterly_starts_completions.pdf.
24
Figure 12: General Remodelers Had a Relatively High Failure Rate
12.612.411.3
9.28.1
13.311.9
10.3
12.9
0%
2%
4%
6%
8%
10%
12%
14%G
en
era
lR
em
ode
lers
Ne
wH
ousi
ng
Op
era
tive
Bu
ilde
rs
Ne
w S
ingle
-Fa
mil
y
Ne
wM
ult
ifam
ily
Plu
mb
ing
&H
VA
C
Ele
ctri
cal
Ro
ofi
ng
Fin
ish
Carp
en
try
Pa
inti
ng
Percent of 2003 Payroll Establishments No Longer Operating in 2004
Source: U.S. Census Bureau, Business Information Tracking Series.
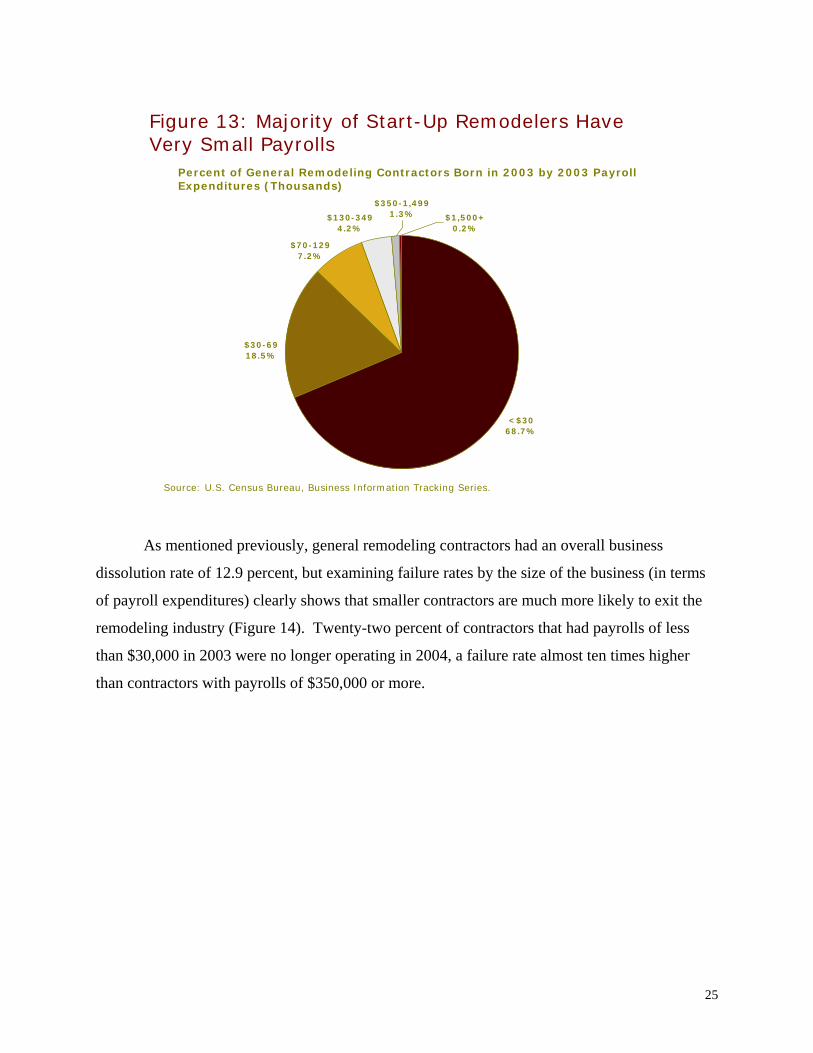
In looking at general remodelers identified in 2003, one striking finding is that about one
in five were newly formed that year, and many of these start-up businesses were small. Almost
30 percent of remodeling contractors with a payroll of less than $30,000 in 2003 were newly
established, while only three percent of contractors with payrolls of $1.5 million or more were
start-ups. In fact, close to 95 percent of all start-up remodelers had payrolls of under $130,000 in
2003 (Figure 13). Another interesting finding is that almost an equal share of general remodelers
experienced increasing payrolls (of five percent or more) from 2002 to 2003 as those
establishments that experienced a decline in payroll at 37 percent and 35 percent respectively.
25
Figure 13: Majority of Start-Up Remodelers Have Very Small Payrolls
<$3068.7%
$130-3494.2%
$1,500+0.2%
$350-1,4991.3%
$70-1297.2%
$30-6918.5%
Percent of General Remodeling Contractors Born in 2003 by 2003 Payroll Expenditures (Thousands)
Source: U.S. Census Bureau, Business Information Tracking Series.
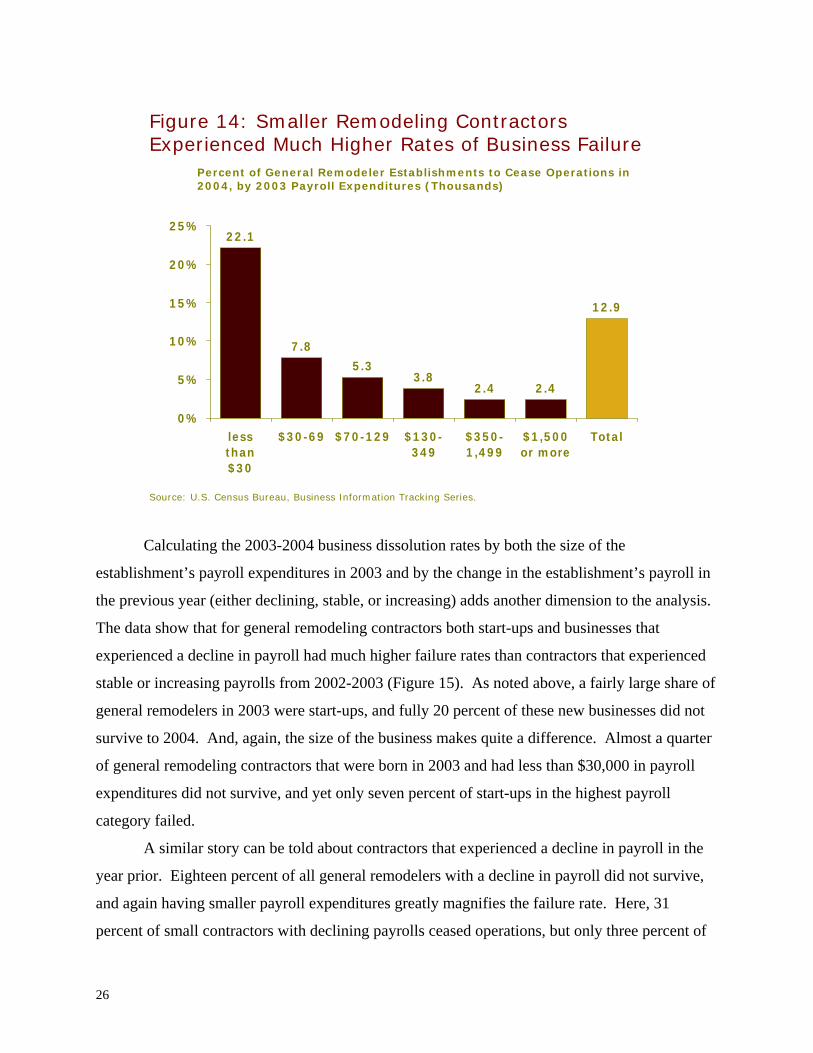
As mentioned previously, general remodeling contractors had an overall business
dissolution rate of 12.9 percent, but examining failure rates by the size of the business (in terms
of payroll expenditures) clearly shows that smaller contractors are much more likely to exit the
remodeling industry (Figure 14). Twenty-two percent of contractors that had payrolls of less
than $30,000 in 2003 were no longer operating in 2004, a failure rate almost ten times higher
than contractors with payrolls of $350,000 or more.
26
Figure 14: Smaller Remodeling Contractors Experienced Much Higher Rates of Business Failure
12.9
2.42.43.8
5.37.8
22.1
0%
5%
10%
15%
20%
25%
lessthan$30
$30-69 $70-129 $130-349
$350-1,499
$1,500or more
Total
Percent of General Remodeler Establishments to Cease Operations in 2004, by 2003 Payroll Expenditures (Thousands)
Source: U.S. Census Bureau, Business Information Tracking Series.
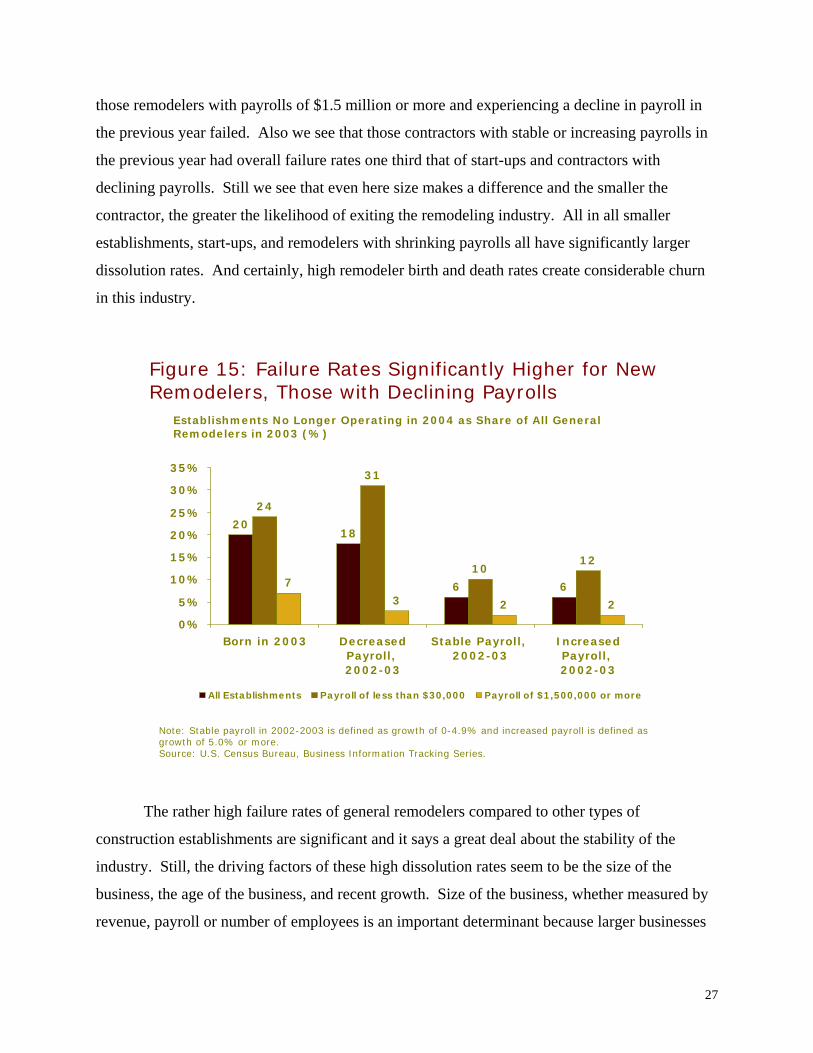
Calculating the 2003-2004 business dissolution rates by both the size of the
establishment’s payroll expenditures in 2003 and by the change in the establishment’s payroll in
the previous year (either declining, stable, or increasing) adds another dimension to the analysis.
The data show that for general remodeling contractors both start-ups and businesses that
experienced a decline in payroll had much higher failure rates than contractors that experienced
stable or increasing payrolls from 2002-2003 (Figure 15). As noted above, a fairly large share of
general remodelers in 2003 were start-ups, and fully 20 percent of these new businesses did not
survive to 2004. And, again, the size of the business makes quite a difference. Almost a quarter
of general remodeling contractors that were born in 2003 and had less than $30,000 in payroll
expenditures did not survive, and yet only seven percent of start-ups in the highest payroll
category failed.
A similar story can be told about contractors that experienced a decline in payroll in the
year prior. Eighteen percent of all general remodelers with a decline in payroll did not survive,
and again having smaller payroll expenditures greatly magnifies the failure rate. Here, 31
percent of small contractors with declining payrolls ceased operations, but only three percent of
27
those remodelers with payrolls of $1.5 million or more and experiencing a decline in payroll in
the previous year failed. Also we see that those contractors with stable or increasing payrolls in
the previous year had overall failure rates one third that of start-ups and contractors with
declining payrolls. Still we see that even here size makes a difference and the smaller the
contractor, the greater the likelihood of exiting the remodeling industry. All in all smaller
establishments, start-ups, and remodelers with shrinking payrolls all have significantly larger
dissolution rates. And certainly, high remodeler birth and death rates create considerable churn
in this industry.
Figure 15: Failure Rates Significantly Higher for New Remodelers, Those with Declining Payrolls
66
1820
1210
31
24
2237
0%
5%
10%
15%
20%
25%
30%
35%
Born in 2003 DecreasedPayroll, 2002-03
Stable Payroll, 2002-03
IncreasedPayroll, 2002-03
All Establishments Payroll of less than $30,000 Payroll of $1,500,000 or more
Establishments No Longer Operating in 2004 as Share of All General Remodelers in 2003 (%)
Note: Stable payroll in 2002-2003 is defined as growth of 0-4.9% and increased payroll is defined as growth of 5.0% or more.Source: U.S. Census Bureau, Business Information Tracking Series.
The rather high failure rates of general remodelers compared to other types of
construction establishments are significant and it says a great deal about the stability of the
industry. Still, the driving factors of these high dissolution rates seem to be the size of the
business, the age of the business, and recent growth. Size of the business, whether measured by
revenue, payroll or number of employees is an important determinant because larger businesses
28
with more capital and access to resources are better able to weather a weak market and declines
in revenue. The age of the business is also important because prior experience is helpful for
anticipating changes to the market and navigating the business through industry cycles with
greater skill and acumen. Of course, recent performance of the establishment is also a good
indicator of where the business is headed in the near term. Recognizing what factors most affect
contractor survivorship and failure is crucial if the industry is to evolve and grow over the long run.
The interaction of these three variables—size, age and recent growth—has considerable
consequence then for determining the likelihood of survival. Looking at opposite ends of the
spectrum, small remodeling businesses of less than $30,000 in payroll expenses that
experienced declining payrolls in 2003 had a one year failure rate 19 times higher than large
contractors ($1.5 million in payroll expenses) with increasing payrolls in 2003 (of five percent
or more) at 30.8 percent. Similarly, small remodeler start-ups in 2003 had a failure rate of 24.5
percent, which is almost 11 times greater than the failure rate for large remodelers that had
been in operation for at least one year. Even with the many limitations of the current BITS
database, the results of this analysis corroborate previous studies in indicating that, in
particular, size and age are important factors for predicting the exit of remodeling contractors.
Going forward, the BITS database will become much richer for analyzing the survival rates of
remodelers as more years of data are collected.
V. Summary and Conclusions
The most recent statistics available on professional contractors serving the remodeling
industry show that this industry continues to be dominated by many small businesses that are
consequently more susceptible to the whims of the business cycle. Self-employed remodelers
outnumber businesses with payrolls by 65 percent, and the vast majority of the self-employed
earn very small receipts. Even remodelers with payrolls are heavily distributed toward the lower
end of the revenue range.
Remodeling contractors are not experiencing much consolidation, but rather increasing
specialization both within the remodeling industry as well as with the range of services that they
offer to their clients. Specialization seems to be a strategy to allow smaller firms to achieve
similar efficiencies in their business practices as larger full-service firms. However, more
specialized firms risk greater levels of volatility in terms of annual revenue growth in such a
29
cyclical industry. More diversified remodeling firms, such as full-service firms or those that
specialize in several types of remodeling will likely achieve more stable growth over time.
The size of a remodeling business matters immensely for influencing the likelihood of
remaining in business. The overall one-year failure rate of general remodelers was found to be
somewhat higher than most of the new construction industries and a sampling of the largest
special trades (by number of establishments). Yet, when size of the establishment was taken into
account, failure rates for remodelers dropped off significantly with increases in payroll size,
which was used as a proxy for revenue. Not only size, but also age and recent growth were
found to be important factors influencing business failure. Start-up remodelers and those that
had experienced shrinking payrolls in the year prior were much more likely to exit the industry
than older establishments and those that had stable or increasing payrolls. Certainly, new and
small businesses are much more challenged by the strong cyclicality of remodeling activity.
Ultimately, specialization of remodeling contractors appears not to improve their business
performance. However, to the extent that specialization allows smaller firms to grow faster than
they would have without specializing, it may be a successful strategy to cope with the inevitable
industry volatility. In and of itself, though, specialization appears to open up firms to greater
exposure to industry volatility and therefore higher failure rates than more diversified businesses.
30
References Apgar, William C. and Kermit Baker. (2006). The Evolving Homebuilding Industry and
Implications for Consumers. Joint Center for Housing Studies, Harvard University. Arditi, David, Almula Koksal and Serdar Kale. (2000). “Business Failures in the Construction
Industry,” Engineering, Construction and Architectural Management, Vol. 7, No. 2, 120-132.
Belsky, Eric S., Mark A. Calabria and Alfred R. Nucci. (March 2001). “Survivorship and
Growth in the Residential Remodeling Industry: Evidence from the Census of Construction,” Joint Center for Housing Studies of Harvard University, W01-5.
Buzzelli, Michael and Richard Harris. (May 2003). “Small is Transient: Housebuilding Firms in
Ontario, Canada 1978–98,” Housing Studies, Vol. 18, No. 3, 369-386. Carliner, Michael. (August 2001). “Life and Death in the Construction Industry,” Housing
Economics, 5-8. Caves, Richard E. (December 1998). “Industrial Organization and New Findings on the
Turnover and Mobility of Firms,” Journal of Economic Literature, Vol. 36, No. 4, 1947-1982.
Davis, Steven J., John Haltiwanger, Ron S. Jarmin, C. J. Krizan, Javier Miranda, Alfred Nucci,
and Kristin Sandusky. (July 2007). “Measuring the Dynamics of Young and Small Businesses: Integrating the Employer and Nonemployer Universes,” NBER Working Paper No. 13226.
Headd, Brian. (2001). “Business Success: Factors Leading to Surviving and Closing
Successfully,” Center for Economic Studies, WP-01-01. Joint Center for Housing Studies. (2007). Foundations for Future Growth in the Remodeling
Industry. Harvard University. Jovanovic, Boyan. (May 1982). “Selection and the Evolution of Industry,” Econometrica, Vol.
50, No. 3, 649-670. Knaup, Amy E. (May 2005). “Survival and Longevity in the Business Employment Dynamics
Data,” Monthly Labor Review, 50-56. Nucci, Alfred R. (February 1999). “The Demography of Business Closings,”
Small Business Economics, Vol. 12, No. 1, 25-39. Qualified Remodeler. Top 500 Remodelers, 2000-2006. http://www.qualifiedremodeler.com/
31
U.S. Census Bureau. 2002 NAICS Codes and Titles. http://www.census.gov/epcd/naics02/naicod02.htm
U.S. Census Bureau. Residential Improvements and Repairs Statistics (C50), Expenditures for
Owner-Occupied One-Unit Properties by Payments to Contractors or Materials Purchased by Owner.
U.S. Census Bureau. Unpublished tabulations of the 1997 & 2002 Economic Census of
Construction. U.S. Census Bureau. Unpublished tabulations of the 2002 Nonemployer Statistics. U.S. Census Bureau, Statistics of U.S. Businesses. 1989-2004 Business Information Tracking
Series.
32
Appendix Tables
Table A-1: Residential Remodeling Establishments with Payrolls by Annual Receipts: 2002
Less than $100,000
$100-249,999
$250-499,999
$500-999,999
$1,000,000-4,999,999
$5,000,000 or more Total
General Contractors 17,555 27,470 16,289 11,559 9,093 884 82,851 Special Trade Contractors
Concrete and Structural Steel
1,069 1,038 774 464 229 17 3,592
Framing 440 812 607 224 112 8 2,203 Masonry 1,295 1,531 723 286 136 14 3,987 Building Exterior, Glazing and Foundation
371 701 488 212 105 6 1,882
Roofing 2,336 3,521 2,595 1,524 1,149 111 11,237 Siding 647 927 731 408 405 29 3,147 Plumbing, Heating, AC and Electrical
8,478 15,569 10,162 5,782 4,003 412 44,406
Drywall and Insulation 685 754 451 194 161 46 2,292 Painting 7,220 5,919 2,141 911 391 29 16,611 Flooring, Tile and Other Finishing
2,942 3,532 1,421 1,014 767 63 9,739
Finish Carpentry 5,141 4,872 2,410 1,711 930 52 15,116 Site Prep and Other 659 1,053 676 366 208 22 2,984 Total Special Trade 31,282 40,230 23,179 13,097 8,598 809 117,195
Total 48,837 67,700 39,469 24,656 17,692 1,694 200,047 Source: Unpublished tabulations of 2002 Economic Census of Construction, U.S. Census Bureau.
33
Table A-2: Self-Employed Residential Remodeling Contractors by Annual Receipts: 2002
$25-
49,999$50-
99,999$100-
199,999 $200-
299,999Over
$300,000 Total General Contractors 48,235 35,106 22,705 8,753 12,417 127,216 Special Trade Contractors
Concrete and Structural Steel
1,389 856 444 81 104 2,874
Framing 876 1,973 672 147 226 3,895Masonry 2,072 1,683 975 183 159 5,072Building Exterior, Glazing and Foundation
536 1,018 645 132 68 2,400
Roofing 4,490 3,654 2,502 862 808 12,315Siding 4,652 2,057 1,292 362 354 8,716Plumbing, Heating, AC and Electrical
15,011 13,288 7,715 1,492 997 38,503
Drywall and Insulation 1,776 1,978 692 255 175 4,875Painting 25,441 12,960 4,381 734 571 44,087Flooring, Tile and Other Finishing
16,811 10,086 5,089 1,120 843 33,950
Finish Carpentry 18,459 11,179 5,186 1,056 940 36,820Site Prep and Other 3,643 2,907 1,959 388 469 9,366Total Special Trade 95,156 63,638 31,553 6,812 5,715 202,873
Total 143,391 98,744 54,258 15,564 18,132 330,089 Notes: The Economic Census of Construction does not report on nonpayroll residential remodeling businesses. JCHS estimates assume that the distribution of remodeling receipts for nonpayroll businesses is comparable to that for payroll establishments in the same revenue category. The remodeling share of total receipts for payroll establishments was calculated and these shares were applied to nonpayroll businesses within each of the revenue categories to estimate the number of nonpayroll remodeling businesses. The estimate of 330,000 nonpayroll remodelers was calculated by eliminating the 383,000 nonpayroll remodelers who reported less than $25,000 in gross receipts in 2002. This procedure provides a conservative estimate of the number of businesses concentrating their activities in residential remodeling. Sources: JCHS tabulations using unpublished tabulations of the U.S. Census Bureau’s 2002 Economic Census of Construction and 2002 Nonpayroll Statistics.

34
Table A-3: Remodeling Contractor Establishments with Payrolls: 1997 and 2002
2002 1997
Percent Change
(1997-2002) General Contractors 82,851 62,405 32.8 Special Trade Contractors
Plumbing, Heating, and AC 32,671 32,030 A 2.0 Painting 16,611 16,766 -0.9 Electrical Work 11,412 B 11,485 -0.6 Masonry, Stone Work, Tile Setting, and Plastering
9,059 6,612 37.0
Carpentry and Floor Work 23,288 18,298 27.3 Roofing and Siding 14,384 15,142 C -5.0 Concrete Work 3,495 1,992 D 75.5 Miscellaneous 6,277 6,556 E -4.3 Total Special Trade 117,197 108,881 7.6
Total 200,048 171,286 16.8 Notes: Industry classifications (NAICS codes) for the construction sector were significantly revised in 2002, resulting in the following changes:
A. Includes environmental controls installation contractors and septic tank, cesspool, and dry well contractors. B. Includes environmental controls installation contractors. C. Includes metal ceiling, panel, and shelving Installation. D. Includes asphalt, brick and concrete paving. E. Includes indoor swimming pool contractors and anchored earth retention contractors. Sources: 1997 and 2002 Economic Census of Construction, U.S. Census Bureau.

35
Table A-4: Regional Distribution of Residential Remodeling Establishments and Revenue: 2002
Northeast Midwest
Number
Remodeling Receipts
($Mil)
Average Revenue ($000s) Number
Remodeling Receipts
($Mil)
Average Revenue ($000s)
General Contractors 17,596 9,361 532.0 20,641 9,560 463.1 Special Trade Contractors
Concrete and Structural Steel
538 101 188.6 1,113 343 307.8
Framing 502 155 308.6 651 186 284.9 Masonry 975 219 224.4 891 225 252.7 Building Exterior, Glazing and Foundation
298 89 299.5 384 132 343.6
Roofing 1,774 643 362.5 2,934 1,401 477.4 Siding 689 327 474.9 1,402 629 448.5 Plumbing, Heating, AC and Electrical
10,626 4,575 430.5 10,118 3,763 371.9
Drywall and Insulation 556 518 932.5 475 112 235.9 Painting 3,719 665 178.9 3,694 615 166.5 Flooring, Tile and Other Finishing
1,784 493 276.0 1,926 680 353.1
Finish Carpentry 4,561 1,447 317.2 3,615 1,077 298.1 Site Prep and Other 724 160 221.2 750 179 238.9 Total Special Trade 26,746 9,392 351.2 27,953 9,341 334.2
Total 44,342 18,753 422.9 48,594 18,901 388.9 Source: Unpublished tabulations of the 2002 Economic Census of Construction, U.S. Census Bureau.
36
Table A-4 Cont.: Regional Distribution of Residential Remodeling Establishments and Revenue: 2002
South West Total
Number
Remodeling Receipts
($Mil)
Average Revenue ($000s) Number
Remodeling Receipts
($Mil)
Average Revenue ($000s) Number
Remodeling Receipts
($Mil)
Average Revenue ($000s)
General Contractors 23,153 12,471 538.6 21,462 11,135 518.8 82,851 42,525 513.3 Special Trade Contractors
Concrete and Structural Steel
1,014 360 355.1 927 344 371.6 3,592 1,149 319.8
Framing 485 157 324.2 565 191 338.4 2,203 689 312.6 Masonry 1,231 245 199.0 890 207 232.7 3,987 896 224.7 Building Exterior, Glazing and Foundation
697 155 223.2 504 137 272.9 1,883 514 273.0
Roofing 3,309 1,668 504.0 3,220 1,415 439.3 11,237 5,126 456.2 Siding 602 376 624.1 454 200 440.2 3,147 1,531 486.6 Plumbing, Heating, AC and Electrical
15,483 6,271 405.1 8,180 3,599 440.0 44,406 18,208 410.0
Drywall and Insulation 651 368 565.3 609 232 381.1 2,292 1,231 537.0 Painting 4,458 1,119 250.9 4,741 863 182.0 16,611 3,262 196.4 Flooring, Tile and Other Finishing
2,897 817 281.9 3,132 1,098 350.5 9,739 3,087 316.9
Finish Carpentry 3,700 1,043 281.8 3,240 1,143 352.7 15,116 4,710 311.6 Site Prep and Other 782 354 453.0 729 199 272.6 2,984 892 298.9 Total Special Trade 35,307 12,933 366.3 27,189 9,628 354.1 117,197 41,294 352.3
Total 58,460 25,403 434.5 48,651 20,762 426.8 200,048 83,819 419.0 Source: Unpublished tabulations of the 2002 Economic Census of Construction, U.S. Census Bureau.
37
Table A-5: Composition of Spending, Residential Remodeler Establishments: 2002
Number of
Establishments
Total Construction
Receipts ($Millions)
Average Construction
Receipts ($Thousands)
Cost of WorkSubcontracted
($Millions)
Average Cost of Work
Subcontracted ($Thousands)
General Contractors 82,851 45,454 549 14,592 176.1 Special Trade Contractors
Concrete and Structural Steel
3,592 1,551 432 116 32.2
Framing 2,203 842 382 187 84.7
Masonry 3,987 1,173 294 60 14.9 Building Exterior, Glazing and Foundation
1,882 723 384 38 20.2
Roofing 11,237 6,490 578 642 57.2
Siding 3,147 1,706 542 190 60.5 Plumbing, Heating, AC and Electrical
44,406 23,885 538 1,302 29.3
Drywall and Insulation 2,292 1,871 816 270 117.9
Painting 16,611 3,841 231 412 24.8 Flooring, Tile and Other Finishing
9,739 4,213 433 387 39.7
Finish Carpentry 15,116 5,397 357 679 44.9 Site Prep and Other 2,984 1,234 414 108 36.1 Total Special Trade 117,195 52,925 452 4,390 37.5
Total 200,047 98,379 492 18,983 94.9
Source: Unpublished tabulations of the 2002 Economic Census of Construction, U.S. Census Bureau.
38
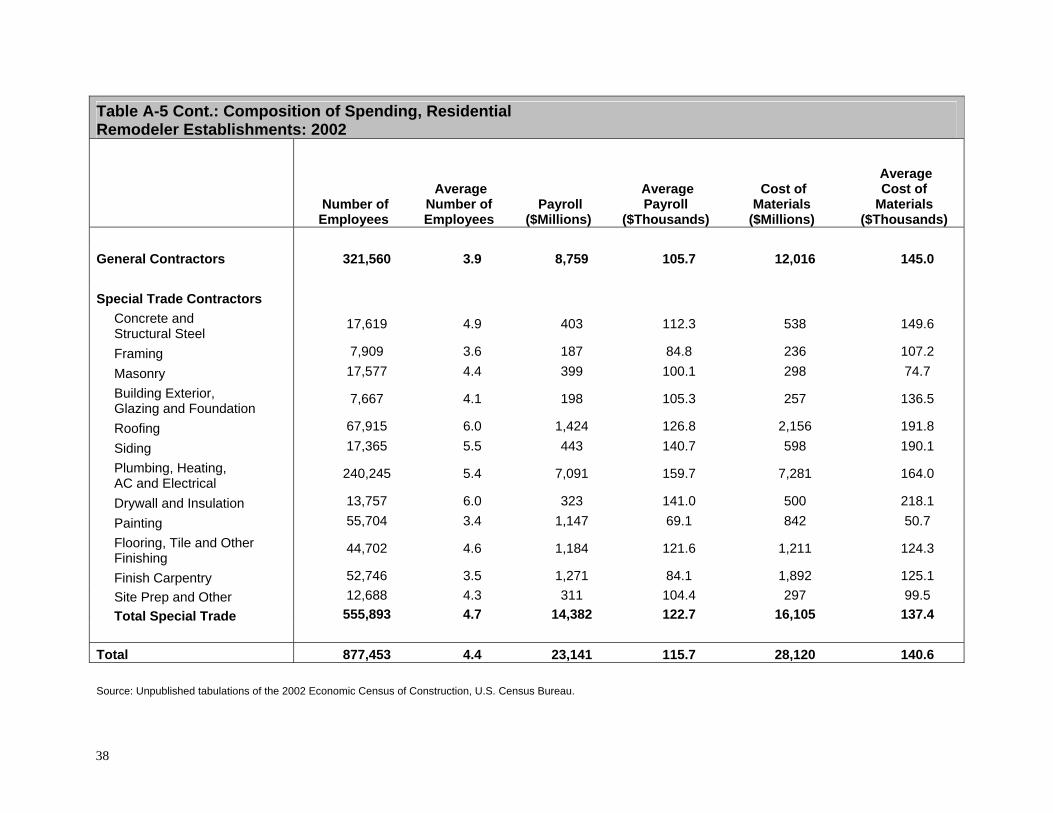
Table A-5 Cont.: Composition of Spending, Residential Remodeler Establishments: 2002
Number of Employees
Average Number of Employees
Payroll ($Millions)
Average Payroll
($Thousands)
Cost of Materials
($Millions)
Average Cost of
Materials ($Thousands)
General Contractors 321,560 3.9 8,759 105.7 12,016 145.0 Special Trade Contractors
Concrete and Structural Steel
17,619 4.9 403 112.3 538 149.6
Framing 7,909 3.6 187 84.8 236 107.2
Masonry 17,577 4.4 399 100.1 298 74.7 Building Exterior, Glazing and Foundation
7,667 4.1 198 105.3 257 136.5
Roofing 67,915 6.0 1,424 126.8 2,156 191.8
Siding 17,365 5.5 443 140.7 598 190.1 Plumbing, Heating, AC and Electrical
240,245 5.4 7,091 159.7 7,281 164.0
Drywall and Insulation 13,757 6.0 323 141.0 500 218.1
Painting 55,704 3.4 1,147 69.1 842 50.7 Flooring, Tile and Other Finishing
44,702 4.6 1,184 121.6 1,211 124.3
Finish Carpentry 52,746 3.5 1,271 84.1 1,892 125.1 Site Prep and Other 12,688 4.3 311 104.4 297 99.5 Total Special Trade 555,893 4.7 14,382 122.7 16,105 137.4
Total 877,453 4.4 23,141 115.7 28,120 140.6
Source: Unpublished tabulations of the 2002 Economic Census of Construction, U.S. Census Bureau.