An investigation into Performance Appraisal effectiveness from the perception of Employees
International Journal of Accounting Research (IJAR) Vol. 2, No. 11, 2016
1
THE PERCEPTION OF EMPLOYEES AND EXTERNAL CUSTOMERS ON THE TOTAL SERVICE QUALITY IN HEALTHCARE INSTITUTIONS
AS MEASURED BY THE 5Q MODEL
Mustafa Mahmood Mohammad Almansey PhD of Business Management, Faculty of Business and Economics,
Girne American University Asst. Prof. Dr. Okechukwu Lawrence Emeagwali
Email: [email protected] Contact no. 00903926502000
Affiliations: Strategic Management Society (SMS), Nigerian Institute of Management (NIM)
Abstract This study focused on evaluating the total service quality in the healthcare firms using 5Q model based on the perspectives of employees and external customers. The objectives and hypotheses for addressing this aim were also set. The sample included 798 respondents out of which the employees were 399 in number while the external customers were also 399 in number. Using 5Q model, the null hypothesis was that total service quality as measured by 5Q model does not impact on the overall customer satisfaction significantly. In the results, total quality was found to influence the customer satisfaction positively and significantly (F (1, 796) = 850.55, p < .01). The dimensions of process, object, infrastructure, atmosphere and interaction were found to be vital in influencing the customer satisfaction. Moreover, the test reveals that total quality accounted for 51.7 % of overall satisfaction variation (R2= .517, β = .719). Consequently, the results are important in addressing service improvements and maintaining high quality standards to enhance satisfaction level of patients and employees. Keywords: Healthcare Quality, 5Q model, Service Quality, external customers, total quality management.

International Journal of Accounting Research (IJAR) Vol. 2, No. 11, 2016
2
Chapter 1: Introduction 1.1 Introduction
Chapter one aimed at identifying the research problem which formed the basis for the development of research questions and objectives. The study background details important information about the introduction including the major concepts in the study. In addition, the problem statement has been stated and the purpose of the study provided. Other sections in this chapter concerns significance of the study, delimitations, conceptual framework and a summary of the chapter. 1.2 Background
In the liberalized and globalized business environment, the service sector has witnessed stiff competition in attaining profitability than ever before. Reports by Hanif et al. (2010) notes that this is mainly reflected in the survival of the organization in terms of customer retention, service acceptance, service quality and brand image development [1]. In particular, the healthcare marketplace has increasingly become aggressive and competitive. Research argued that because of high costs involved in running firms successfully, survival in the healthcare marketplace requires the retention of current customers and attraction of new customers. The inflow of new patients and patient loyalty results mainly from achieving satisfaction of the patients with the healthcare services received. Consequently, loyalty or disloyalty stems directly from dissatisfaction or satisfaction with a healthcare firm. Besides, study by Gupta et al. (2004) indicate that dissatisfied or satisfied consumers can generate negative or positive information about the service provider which may deter or affect potential patients[2]. Successful patient outcomes can also be influenced by patient satisfaction since patients who are satisfied are likely to conform and partake rehabilitation and treatment unlike dissatisfied patients.
Consequently, it seems that the main driving force in achieving business success is the provision of high service quality. Moreover, it was indicated by Barnes et al. (2004) that in this era of high competition, improvement of quality of services and measurement of service quality are some of the significant measures towards business growth and development of efficiency[3]. In manufacturing and service sectors, improvement of quality is a critical factor that influences customer purchase intention. It was also mentioned by Nusair et al. (2010) that a number of firms are focusing on quality issues to remain relevant in business[4].
Healthcare firms provide services such as treatment which are vital to the well being of the public and the economy of a country since healthy workforce are more productive. Hence, the hospital and healthcare sector are concerned mainly with service provision rather than the supply of physical goods. According to Boschoff and Gray (2004), services are highly intangible and characterised by interaction between the healthcare provider and the customers unlike the case of physical goods[5]. This implies that patients can only receive the healthcare service when they are present and involved in the service delivery process. Moreover, work of Zineldin et al. (2014) notes that successful service delivery in the healthcare firms requires the cooperation of the patient during the service encounter[6]. This is the reason why the quality of healthcare services is considered as a vital determinant of patient satisfaction.
According to Dagger et al. (2007), health systems have reported rapid changes to restructure and improve their functioning and systems in order to conform to the demographic changes, emerging diseases and changes in disease patterns coupled with high cost of medical services[7]. As governments evaluate their systems of health to adjust them to the new customer demands, the complexities and number of problems reported increases. Wu (2011) suggested that

International Journal of Accounting Research (IJAR) Vol. 2, No. 11, 2016
3
some of the health systems have not been successful in providing the services while some are constrained by inefficient resources[8]. Consequently, most of the issues including healthcare financing, health service quality, health governance, imbalances in healthcare staff and the impacts of healthcare reforms have affected the ability of healthcare firms to deliver services Ganguli and Roy 2010; Zineldin 2006) [9].
The important role of healthcare industry in the past decade has increased due to technical and medical progress and increasing population. Zavare et al. (2010) suggested that the increased demand in health services implicates the efficiency and quality of health services provided[10]. The health processes today are performed by different providers who act independent with different objectives. In particular, the processes include rescue services, rehabilitation, nursing care, inpatient treatment and outpatient treatment. Consequently, Manias (2010) concluded that this situation results in a major challenge in measuring and defining what constitutes the service quality and this is made more complicated by interfering objectives like the status of health of patients[11]. Furthermore, Lee et al. (2010) claimed that the healthcare outcomes are generally complex since they can be presented by discomfort, dissatisfaction, disability, death and disease[12]. Different outcomes are attributed to different illnesses. Nonetheless, even when people have the same disease, they differ by general health status, age and genetic makeup thus health outcomes cannot be predictable or the same. Therefore, the blend of process, structure and outcome measures are beneficial in the overall improvement of quality. In this regards, there have been increased focus on how the structure, process and outcome of health service delivery can be improved. 1.3 Internal and external customers
According to Rose and Yates (2013), there has been increased interest in understanding the perspectives of both external customer and employees about service quality in various markets[13]. However, most of the study in the past had mainly been concerning the perception of external customers about service quality while the perspectives of employees about service quality have not received much attention. Rajani et al. (2013) opines that to meet the demands of external customers effectively and maximally as possible, focusing on customer service to external customers and the products offered is not enough[14]. In this regards, ensuring the services and products offered to external customers are guaranteed requires the whole delivery process to be effective and in order. Interestingly, understanding of Kamimura et al. (2014) was that employees also form part of the process hence when employees are included in the entire process, the external customers will get the desired service and products that fulfil their expectations and meet their needs[15]. 1.4 Problem statement
The satisfaction of customers has been proven to be important in the survival of any business in a competitive environment. Consequently, a number of studies have recommended that service quality should be evaluated continuously by firms especially by those in the healthcare sector (Nguyen 2002; Chillingerian 2000) [16]. This is mainly because of the changing needs of patients and customers in general. A number of the studies in service industry have mainly focused on the relationship between satisfaction of external customers and service quality (Kuo-Hsien 2009; Desai 2011) [17]. However, there have been few studies which have focused on the link between the level of satisfaction of external customers and employee with service quality and the dimensions of process, object, infrastructure, atmosphere and interaction (Matsa 2011; Kang 2006) [18]. Similarly, few studies have investigated how functional and technical quality

International Journal of Accounting Research (IJAR) Vol. 2, No. 11, 2016
4
impact on the satisfaction and overall perception of quality among employees and external customers (Chu-Mei 2004; Zineldin 2005) [19]. From the studies in the background, it was clear that satisfaction and dimensions of service quality are related, however, these studies were based on the SERVQUAL model.
Most studies evaluating service quality have often used SERVQUAL model and assumed that perceptions of external customers about quality dimensions are similar to those of employees (Rahman 2012; Andreassen 2000) [20]. Consequently, there have been no studies which have compared perspectives of employees about service quality to those of external customers to identify the difference and address these differences. This gap in literature calls for further studies to accurately assess customer satisfaction and total quality using both employee and external customers to identify effective strategies that can prevent marginal or inefficient service provision. In this regards, this study was initiated to close this gap. In essence, a different model known as 5Q model was employed in this study to measure the total quality perception and investigates how this relates to the satisfaction in the perspectives of both employee and the external customers. The following section indicates the research questions addressed in this current study. 1.5.1 Research questions
i. What is the level object quality in the healthcare firms as perceived by employees and external customers?
ii. What is the level process quality in the healthcare firms as perceived by employees and external customers?
iii. What is the level interaction quality in the healthcare firms as perceived by employees and external customers?
iv. What is the level atmosphere quality in the healthcare firms as perceived by employees and external customers?
v. What is the level infrastructure quality in the healthcare firms as perceived by employees and external customers?
vi. What is the level of overall total service quality in the healthcare firms as perceived by employees and external customers?
vii. What is the level of employees’ and external customers’ satisfaction with in healthcare firms?
viii. How do total quality dimensions in the healthcare firms as measured by 5Q model affect the satisfaction of customers?
Chapter 2: Literature Review 2.1 Introduction
This chapter presents the literature review based on the study problem and the objectives hence the chapter attempts to provide insight into the concept under investigation. In essence, literature review begins with service delivery and service quality in the healthcare firms and the 5Q model illustrated including its various factors which impact on external and employee satisfaction. The chapter ends with a summary. 2.2 Literature review
Hanif et al. (2010) notes that healthcare providers and firms have developed increased interest in quality and initiated various strategies to improve service quality in the recent years[21]. This is mainly because competition has become stiff in the healthcare sector. Moreover,

International Journal of Accounting Research (IJAR) Vol. 2, No. 11, 2016
5
Uzun (2013) posited that service users have become loyal to firms and governments have minimised political interference and improved regulatory control in the healthcare sector[22]. In the past, the healthcare sector was dominated mainly by the public hospitals and the non-profit firms, however, healthcare today is increasingly being provided by the private firms. However, Kaldenberg (2010) argued that in the recent times there have been technological advancements and increased competition which have also dramatically changed the practices of healthcare providers[23]. In this regards, the increased competition has led to the patient satisfaction due to the increase in service quality improvements. Furthermore, Drèze and Nunes (2009) indicated that quality of services can be difficult and complex process to evaluate[24]. This is mainly because of the credibility of qualities and high-involvement relationships; however, there is no universal construct on what quality is composed of in a single sector.
Healthcare firms seek decreased staff turnover, cost reduction, increased risk management as well as decrease in litigation potential through service quality improvements which also enable them to gain good health outcomes. Study by Gupta et al. (2004) indicates that the evaluation of satisfaction of patients in healthcare firms is a precondition to improvement of healthcare quality and increase in budget allocation to health sector[25]. It also provides important information concerning the healthcare service quality and the healthcare needs of patients. In the opinion of Barnes et al. (2004), evaluation of satisfaction of patients in healthcare firms can also help the providers of healthcare and healthcare firms to effectively meet and fulfil the needs of patients, facilitate patient recovery, as well as promote the well-being of patients[26]. 2.3 Role of employees in service delivery
The successful firms in the service sector understand the significance of managing and carefully monitoring the satisfaction of customers. In essence, service encounter play a major role in affecting the satisfaction of customers with an organization. The concept of involving employees in determining service quality has gained prominence in recent years. In addition, Drèze and Nunes (2009) wrote that the consensus in literature is that success of firms can also be influenced by how satisfied the employees are with the services[27]. In healthcare firms, from the perspectives of external customers, a patient could report a poor service encounter in terms of scheduling of appointments, a positive service encounter with a doctor or nurse, and a very positive service encounter with radiologist, pathologist or other technicians (Desai 2011) [28]. Such mix of encounter experiences leave a patient undecided about the overall service quality and uncertain of what the next visit will be like. Joolaee et al. (2010) demonstrated that the internal suppliers and employees within healthcare firms are invisibly connected with regards to the output-input links in the service process[29]. These links tend to be formed through staff relationships which emerge from the process design of health services. Hence, internal networks in healthcare firms provide the service delivery network.
Given that there are different areas/disciplines which interact in healthcare firms to meet the needs of internal networks or patients, Ladha et al. (2014) pointed that the channels of internal service in hospitals can be described using a value chain[30]. Various scholars maintain that business must fulfil the needs of their employees before external customers’ needs can be fulfilled. This implies that external customers are satisfied after the employees have been satisfied. The main reasoning behind this argument is that when a firm satisfies its employees, then the employees will love their work and feel more relevant to the organization. In turn, this leads to the serving of external customers well. It was also argued by Piskar and Faganel (2009) that employees must be first valued in an organization before external customers[31]. This

International Journal of Accounting Research (IJAR) Vol. 2, No. 11, 2016
6
indication basically implies that when the employees in an organization perceive service quality processes to be poor, then the external customers will also be affected.
Sureshchandar et al. (2002) demonstrated that workers have certain impacts on external customers or patients; however, greater value tends to be attained through synergy of healthcare services given in other areas[32]. For instance, a doctor has overall responsibility for caring for a patient; however, the doctor also depends on nursing services or services by non-clinical staff in order for all the patient’s needs to be met. In addition, provision of good infrastructure and adequate resources or equipment are some of the measures that be used to achieve employee satisfaction. Bruhn and Georgi (2006) felt that this is because they directly impact on the ability of these employees to conduct their responsibilities[33]. Although the employees and external customer are similar in many aspects, there is one distinctive feature. Whereas the employees have no choice if they have low perspectives of service quality, the external customers can shift to other service providers. 2.4 Customer satisfaction
Sureshchandar et al. (2002) claimed that satisfaction of a customer occurs when the customers is happy or pleased with a service (or product) provided in a firm[34]. Hence, satisfaction represents the feelings of disappointment or happiness reported by a customer after comparing the perceived outcome (or performance) of service (or product) with expectations. However, satisfying all customers can be difficult to attain since people have different expectations and perceptions. According to the indications of Álvarez et al. (2011), customer satisfaction is a basic objective of any organization as they seek to minimize costs and increase profits[35]. A number of firms today are building strong customer relationships through provision of superior service or product value rather than service provision in order to attain customer loyalty. Drèze and Nunes (2009) also opined that satisfaction of patients is an important measure since it is fundamental in healthcare quality given that it provides the information on success of provider in meeting the client expectations[36].
Brady and Cronin (2001) revealed that eexpectations also form a basis for satisfaction level of service users[37]. This implies that higher expectations regarding actual service provider performance can lead to greater level of disconfirmation or lower satisfaction level. Similarly, Hosseinian et al. (2015) affirmed that lower expectations regarding actual service provider performance can lead to less disconfirmation levels and greater satisfaction levels[38]. Hence, when consumers have lower service expectations, they can be satisfied with a service even when its performance was poor. 2.4.1 Satisfaction of external customers
According to the reports by O’Connor et al. (2011), satisfaction of patients refers to the attitude of patients and their perceptions about the extent to which their expectations and preferences have been met by healthcare firms or providers[39]. However, there is no consensus on the best description of patient satisfaction given that is depends on various factors. Moreover, some patients tend to be satisfied to a great extent with certain factors while other patients are not. besides, Kamimura et al. (2014) provided that there are a number of factors which can determine satisfaction of patients some of which include the health care process, outcome and structure; and the patients’ psychological and physical status, socio-demographics, and their expectations and attitudes about the medical care[40]. Uddin and Ashrafun (2011) view was that as the competition increases in the healthcare sector among the providers, patient satisfaction has been achieved through continuous healthcare improvements, responsiveness to the needs and

International Journal of Accounting Research (IJAR) Vol. 2, No. 11, 2016
7
views of patients and the enhancement of patient-doctor relationships[41]. This implies that the healthcare firms are concerned about external customer satisfaction and have become more interested in the various dimensions affecting quality services.
In essence, studies on satisfaction with healthcare revealed that there are various aspects of overall organizational performance and patient satisfaction (Rahman 2012; Cannon 2002). These include the facilities, care outcomes, overall quality, competence, interaction, infrastructure, information and trust which can be important in making the necessary quality improvements and evaluations[42]. Moreover, affirmation by Nusair et al. (2010) was that quality care is attained when patients are satisfied[43]. Hence, the healthcare firms consider patient evaluations to complement their quality assurance and assessment methods. In addition, the healthcare processes can also be evaluated through patient satisfaction given that higher satisfaction can be associated with better outcomes, superior compliance, increased attendance and improved return visits to a health facility. In the reports by Zineldin et al. (2014), they noted that assessing patient satisfaction is essential not only to external customers but also to employee in a healthcare setting[44].
According to Piskar and Faganel (2009), patient satisfaction can be determined mainly by 5 psychological variables including occurrence, expectations, value, entitlement and interpersonal comparisons[45]. Patient satisfaction with healthcare services is a concept that is multidimensional and has increasingly become important in the healthcare sector. This is because it contributes to adherence to medication, recommendations as well as maintaining care. In the opinion of Dagger et al. (2007), satisfaction of patients is a combination of various constructs and facets of healthcare firms like infrastructure, atmosphere, technical, functional and interaction items[46]. 2.5 5Q model
The 5Q model combines SERVQUAL and quality of performance and technical attributes of services. Rose and Yates (2013) indicate that 5Q model is a subjective and perpetual model for measuring organizational performance and evaluating customer satisfaction[47]. Companies that use the 5Q model are better equipped to affect and measure quality, customer loyalty and satisfaction. In this regards, the model is also applicable to healthcare firms and provides them with the needed tools for improvement from the perspectives of customers. In essence, Zineldin (2006) indicates that the 5Q model contains 5 dimensions which result in quality of healthcare that impact on the patient satisfaction level[48]. The figure 2.3 below depicts the model.

International Journal of Accounting Research (IJAR) Vol. 2, No. 11, 2016
8
Figure 2.1: 5Q model Source: Zineldin (2006) [49]
Atmosphere concerns the interaction process and relationship between staff and how it is influenced by the atmosphere in the environment they operate and cooperate (Tahmasebi et al. 2015) [50]. Hence this quality dimension represents the communication and social space between staff members hence it indicates whether there is a closed or open atmosphere. In this regards, atmosphere indicators are important and critical because lack of a friendly and frank atmosphere results in poor healthcare quality.
Interaction as a dimension of service quality is used in measuring the social and information exchange among people such as the number of patients who get informed about the next schedule for check-ups or the time spent by physicians in understanding the needs of patients. Interaction among people can be difficult to maintain hence interaction quality identifies communication between hospital staff and the patient (Zineldin 2006) [51]. Generally, the perceived communication and interaction level represents the overall satisfaction level of patients.
Tahmasebi et al. (2015) indicates that infrastructure measures the basic and essential resources needed for healthcare services to be performed such as quality of skills and internal competence, technology, internal activities and resources, motivation, attitudes, experience, internal relationships and know-how as well as how such activities can be coordinated, cooperated and managed (Zineldin 2006) [52]. According to Rajani et al. (2013), technology infrastructure is very critical in satisfaction of patients in healthcare firms[53]. Given that the infrastructure concept is stable and relates with healthcare quality, it can hence affect the healthcare system performance including the perception of patients about the quality of healthcare service provided.
Processes refer to methods and activities involved in presentation of services to hospital patients from reception to discharge. Hence it concerns functional quality and how healthcare activities are practically implemented such as speed of conducting healthcare procedures and waiting time. Given that he healthcare sector is associated with a number of sensitive issues;
Q u a l i t y o f s e rv i c e s
S a t i s f a c t i o n o f p a t i e n t s
In f r a s tr u c tu re
P ro c e s s e s
O b j e c t
A t m o s p h e re
In te ra c t i o n
Q ua lit y o f…

International Journal of Accounting Research (IJAR) Vol. 2, No. 11, 2016
9
process indicators require more attention (Tahmasebi et al. 2015) [54]. In addition, these process indicators are important in identifying flaws in delivery of services and developing appropriate solutions. The hospital staff can employ various process indicators in monitoring healthcare activities at the facilities in order to improve the decision making process. Quality of object includes the physical facilitations, equipment, appearance of staff and the physical space hence is concerns technical quality and relates to the procedures conducted. It also helps to understand accuracy of the medical procedures and diagnosis and measures the actual treatment (Zineldin 2006) [55].
Chapter 3: Methods 3.1 Introduction
The methodological considerations are presented in this chapter including the appropriate tools of gathering data to address the hypothesis stated. In essence, all the methods involved have been explained in detail and some of the reasons why they were considered most applicable in this study have also been stated. Hence, this chapter indicates the philosophy adopted the approaches and research strategy to describe the study design. The particular instrument involved was the questionnaire and its design has also been discussed. Chapter three ends mainly with ethical consideration and the measures taken to ensure validity and reliability. 3.2 Research philosophy
The main research philosophies are positivist and interpretive philosophies as stated by Bogdan and Biklen (2006) [56]. This study holds interpretive philosophy because it tolerates objectivity rather than subjectivity. Moreover, positivist philosophy allows the investigator to adopt different statistical techniques in the data analysis which suits this study in describing the current problem and testing the hypotheses developed. In addition, by using objective reality attained through positivist philosophy, the investigator believed that the satisfaction level differs in various healthcare firms and customers as well hence worth investigating (Belk 2006) [57]. 3.3 Study design
A study design refers to the overall measures taken in conducting a research. It basically states the approaches and strategies that were used in the study (Cresswell 2006) [58]. In particular, (also known as quantitative approach) which was informed by the fact that this study was objective and tested the stated hypothesis based on obtained data. In this regards, conclusions were arrived at after thorough. Matthews and Ross 2010 also states that a quantitative research involves deductive approach where quantitative data are collected through instruments like questionnaires[59]. The basis behind using quantitative method was the philosophical position of positivism employed. The 5Q model that formed the basis of total quality can be best evaluated through quantitative methods like in the study by Zineldin (2006) involving the 5Q model.
On the other hand, the survey research strategy was adopted since it is normally suitable for a deductive or quantitative approach. According to Saunders et al. (2012), survey strategy has various benefits which informed the rationale of this study[60]. For instance, surveys enable a large number of individuals to be studied in a cost-effective way. People also consider surveys to be trustworthy and can be understood and explained very easily. Another importance of a survey strategy is that the investigator can easily collect data and code them numerically in surveys since the questionnaire is the research instrument that is commonly used in most surveys (Yin 2009; Urdan 2005) [61].

International Journal of Accounting Research (IJAR) Vol. 2, No. 11, 2016
10
Chapter 4: Results and Discussion 4.1 Demographics
A total of 798 respondents took part in this study out of which 399 were external customers (50 %) and 399 were employees (50 %) (Table 4.1). In total, the male respondents were 56.1 % while females were only 43.9 % (table 4.1). Table 4.1 : Gender of the respondents
Type of respondent * Gender Crosstabulation
Gender
Total Male Female Type of respondent
Employee Count 223 176 399 % within Type of respondent
55.9% 44.1% 100.0%
External customer
Count 225 174 399 % within Type of respondent
56.4% 43.6% 100.0%
Total Count 448 350 798 % within Type of respondent
56.1% 43.9% 100.0%
Among the employees, males accounted for majority 55.9 % while females were 44.1 % (table 4.1 and figure 4.1).
Figure 4.1 : Gender of employees Similarly, the males were the majority 56.4% among the external customers while the
females were 43.6% of the external customers (table 4.1 and figure 4.2).

International Journal of Accounting Research (IJAR) Vol. 2, No. 11, 2016
11
Figure 4.2 : Gender of external customers
The external customers who were involved in the study had mainly visited the hospitals
for medical related reasons 35.1% followed by surgical related reasons 31.8%, maternity related reasons 16.0% (table 4.2).
Table 4.2 : reasons why external customers were admitted or why they visited the hospital
For what reason were you admitted or why did you visit the hospital?
Frequency Percent Valid
Percent Cumulative Percent Valid Maternity related
reasons 64 16.0 16.0 16.0
Medical related reasons
140 35.1 35.1 51.1
Surgical related reasons
127 31.8 31.8 83.0
Other reasons 68 17.0 17.0 100.0 Total 399 100.0 100.0
However, a small proportion of the external customers 17.0% reported that they had visited the hospital for other reasons (table 4.2 and figure 4.3).

International Journal of Accounting Research (IJAR) Vol. 2, No. 11, 2016
12
Figure 4.2 : reasons why external customers were admitted or why they visited the hospital
The employees were mainly composed of the nurses 52.1% and doctors 36.1% while
those of other occupation were the least in number at 11.8% (table 4.3 and figure 4.4 below).
Table 4.3 : occupation of employees in the hospitals
What is your occupation in this hospital?
Frequency Percent Valid
Percent Cumulative
Percent Valid Nurse 208 52.1 52.1 52.1
Doctor 144 36.1 36.1 88.2 Other staff
47 11.8 11.8 100.0
Total 399 100.0 100.0
Figure 4.3 : occupation of employees in the hospitals
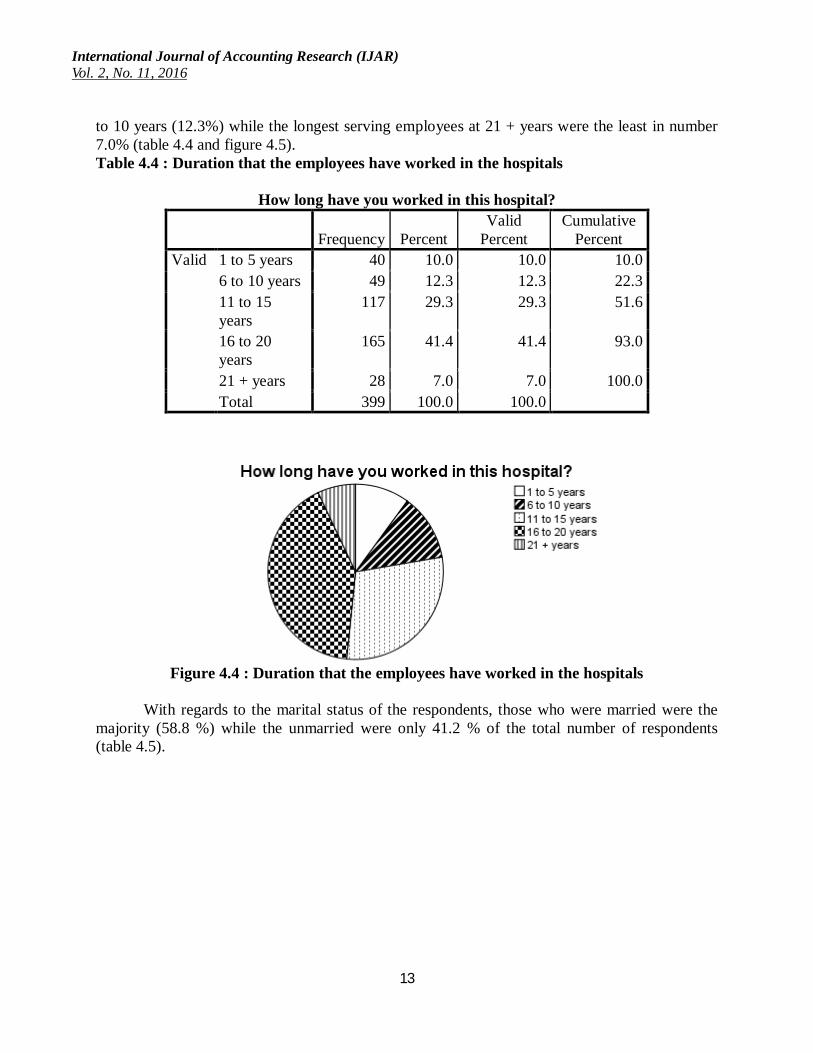
In particular, these employees had been working at the hospitals mainly for the last 16 to 20 years (41.4%), 1 to 5 years (10.0%) and 11 to 15 years (29.3%). Other had only worked for 6
International Journal of Accounting Research (IJAR) Vol. 2, No. 11, 2016
13
to 10 years (12.3%) while the longest serving employees at 21 + years were the least in number 7.0% (table 4.4 and figure 4.5). Table 4.4 : Duration that the employees have worked in the hospitals
How long have you worked in this hospital?
Frequency Percent Valid
Percent Cumulative
Percent Valid 1 to 5 years 40 10.0 10.0 10.0
6 to 10 years 49 12.3 12.3 22.3 11 to 15 years
117 29.3 29.3 51.6
16 to 20 years
165 41.4 41.4 93.0
21 + years 28 7.0 7.0 100.0 Total 399 100.0 100.0
Figure 4.4 : Duration that the employees have worked in the hospitals
With regards to the marital status of the respondents, those who were married were the
majority (58.8 %) while the unmarried were only 41.2 % of the total number of respondents (table 4.5).

International Journal of Accounting Research (IJAR) Vol. 2, No. 11, 2016
14
Table 4.5 : Marital status of the respondents Type of respondent * Marital status Crosstabulation
Marital status
Total Married Unmarried Type of respondent
Employee Count 246 153 399 % within Type of respondent
61.7% 38.3% 100.0%
External customer
Count 223 176 399 % within Type of respondent
55.9% 44.1% 100.0%
Total Count 469 329 798 % within Type of respondent
58.8% 41.2% 100.0%
Among the external customers, the individuals who noted that they are unmarried were 44.1% while those indicating that they are married accounted for 55.9% of total patients participating in the study (table 4.5 and figure 4.6).
Figure 4.5 : Marital status of external customers
On the other hand, the employees were mostly married 61.7% while less than a quarter
38.3% of them were unmarried (table 4.5 and figure 4.7).

International Journal of Accounting Research (IJAR) Vol. 2, No. 11, 2016
15
Figure 4.6 : marital status of employees
Age distribution among the respondents was also examined. In general, majority of
respondents were between 36 to 41 years (28.1%) and 30 to 35 years (27.2%). This was followed closely by the age groups 42 to 47 years (19.3%), 24 to 29 years (13.2%) while the least were aged 18 to 23 years (7.0 %) and 48 + years (5.3 %) (Table 4.6).
Table 4.6 : age of respondents
Type of respondent * Age Crosstabulation
Age
Total
18 to 23 years
24 to 29 years
30 to 35 years
36 to 41 years
42 to 47 years
48 + years
Type of respondent
Employee Count 26 47 114 112 78 22 399 % within Type of respondent
6.5% 11.8% 28.6% 28.1% 19.5% 5.5% 100.0%
External customer
Count 30 58 103 112 76 20 399 % within Type of respondent
7.5% 14.5% 25.8% 28.1% 19.0% 5.0% 100.0%
Total Count 56 105 217 224 154 42 798 % within Type of respondent
7.0% 13.2% 27.2% 28.1% 19.3% 5.3% 100.0%
With regards to the age of external customers, majority were 36 to 41 years (28.1%) followed by 30 to 35 years (25.8%), 42 to 47 years (19.0%), 24 to 29 years (14.5%) and 18 to 23 years (7.5%) while those aged 48 + years were 5.0% (table 4.6 and figure 4.8).

International Journal of Accounting Research (IJAR) Vol. 2, No. 11, 2016
16
Figure 4.7 : Age of external customers
Employees included mainly employees aged 30 to 35 years (28.6%), 36 to 41 years
(28.1%), 42 to 47 years (19.5%), 48 + years (5.5%), 24 to 29 years (11.8%) and 18 to 23 years (6.5%) (table 4.6 and figure 4.9).
Figure 4.8 : age of employees
The patients’ frequency of visiting the hospitals was also determined and the findings
indicate most of the external customers in the past 3 years had visited the hospitals about 2 to 3 times (33.3 %) followed by 4 to 5 times (22.6 %) and 6 to 7 times (29.1%). While those who were at the hospitals for the first times were (8.8%). The least (6.0%) were those visiting the hospitals 8 times or more in the past 3 years (table 4.7 and figure 4.10).

International Journal of Accounting Research (IJAR) Vol. 2, No. 11, 2016
17
Table 4.7 : Number of times the external customers have visited hospital in the past 3 years
In the past 3 years, what is the number of times you have been to this hospital?
Frequency Percent Valid
Percent Cumulative
Percent Valid First time 35 8.8 8.8 8.8
2 to 3 times 134 33.6 33.6 42.4 4 to 5 times 90 22.6 22.6 64.9 6 to 7 times 116 29.1 29.1 94.0 8 times or more
24 6.0 6.0 100.0
Total 399 100.0 100.0
Figure 4.9 : Number of times the external customers have visited hospital in the past 3
years 4.4 Total quality
Total quality of the services provided by the healthcare firms was measured based on the 5Q model hence the main dimensions assessed were object, process, infrastructure, interaction and atmosphere and the results have been presented in table 4.8. For object quality dimension, the mean ratings was 2.8787 (SD = .68) among external customers and 4.0381 (SD = .47) among employees. Similarly, independent t-test indicates that the employees rated the object quality in the healthcare firms to be higher than the external customers (t (796) = 27.963, p< .001). In terms of process, the mean ratings was 2.6007 (SD = (.43) among external customers and 4.1913 (SD = .94) among employees. Results of the independent t-test indicates that the employees rated the process quality in the healthcare firms to be higher than the external customers (t (796) = 30.778, p< .001).
The mean ratings for infrastructure was 2.5334 (SD = .38) among external customers and 4.1358 (SD = .43) among employees. In particular, independent t-test indicates that the

International Journal of Accounting Research (IJAR) Vol. 2, No. 11, 2016
18
employees rated the infrastructure quality in the healthcare firms to be higher than the external customers (t (796) = 55.653, p< .001). With regards to interaction mean ratings was 2.9660 (SD = .72) among external customers and 3.9692 (SD = .44) among employees. Further tests by independent t-test reveals that employees rated the interaction quality in the healthcare firms to be higher than the external customers (t (796) = 23.829, p< .001).
Atmosphere quality was also rated by the respondents and results show that the mean ratings was 3.2125 (SD = .73) among external customers and 3.9877 (SD = .50) among employees. Further tests by independent t-test reveals that employees rated the atmosphere quality in the healthcare firms to be higher than the external customers (t (796) = 17.449, p< .001). In general, total quality of the services in the healthcare firms as perceived by external customers had M = 2.8063 (SD = .44) while employee rating had M = 4.0882 (SD =.39). Independent t-test results also shows that employees rated the total quality in the healthcare firms to be higher than the external customers (t (796) = 43.291, p< .001). The detailed results of the independent t-test are in the table 4.9.
Table 4.8 : Mean ratings, standard deviations and mean difference for the 5Q dimensions Dimensions External customers M
(SD) Employees M
(SD) External customers – Employees (MD)
Object 2.8787 (.68) 4.0381 (.47) -1.15940 Process 2.6007 (.43) 4.1913 (.94) -1.59064 Infrastructure
2.5334 (.38) 4.1358 (.43) -1.60242
Interaction 2.9660 (.72) 3.9692 (.44) -1.00322 Atmosphere 3.2125 (.73) 3.9877 (.50) -.77527 Total Quality
2.8063 (.44) 4.0882 (.39) -1.28193
NB: M (SD) = mean (standard deviation); MD (mean difference) = External customers – Employees
The mean difference between external customers and employees in the ratings of the 5Q dimensions was mainly greater in atmosphere (MD = -1.43) and infrastructure (MD = -1.42) followed by interaction (MD = -1.29), process (MD = -1.08) and object (MD = -0.77) (table 4.8).

International Journal of Accounting Research (IJAR) Vol. 2, No. 11, 2016
19
Table 4.9 : Independent Samples Test summary for total quality dimensions Independent Samples Test
Levene's Test for Equality of Variances t-test for Equality of Means
F Sig. t df Sig. (2-tailed)
Mean Difference
Std. Error Difference
95% Confidence Interval of the
Difference Lower Upper
OBJECT Equal variances assumed 88.928 .000 27.963 796 .000 1.15940 .04146 1.07801 1.24079 Equal variances not assumed 27.963 707.76
5 .000 1.15940 .04146 1.07800 1.24080
PROCESS Equal variances assumed .091 .763 30.778 796 .000 1.59064 .05168 1.48919 1.69209 Equal variances not assumed 30.778 559.39
3 .000 1.59064 .05168 1.48913 1.69216
INFRASTRUCTURE
Equal variances assumed 20.399 .000 55.653 796 .000 1.60242 .02879 1.54590 1.65893 Equal variances not assumed 55.653 787.47
2 .000 1.60242 .02879 1.54590 1.65893
INTERACTION Equal variances assumed 28.290 .000 23.829 796 .000 1.00322 .04210 .92058 1.08586 Equal variances not assumed 23.829 655.51
0 .000 1.00322 .04210 .92055 1.08589
ATMOSPHERE Equal variances assumed 41.616 .000 17.449 796 .000 .77527 .04443 .68806 .86249 Equal variances not assumed 17.449 699.51
5 .000 .77527 .04443 .68804 .86251
QUALITY Equal variances assumed 39.539 .000 43.291 796 .000 1.28193 .02961 1.22381 1.34006 Equal variances not assumed 43.291 782.98
8 .000 1.28193 .02961 1.22380 1.34006

International Journal of Accounting Research (IJAR) Vol. 2, No. 11, 2016
20
4.4.1 Object quality Object quality was examined using four items as indicated in table 4.10. In essence,
81.20% of employees agreed that they had a feeling of wellbeing in this hospital (agree = 49.1%; strongly agree = 32.1%) while 53.80% of external customers agreed (agree = 39.8%; strongly agree = 14.0%). In addition, 67.00% of employees agreed that the hospital had the ability to treat patients as expected (agree = 40.9%; strongly agree = 26.1%) while 23.90% of external customers agreed (agree = 20.1%; strongly agree = 3.8%).
Results also shows that 77.00% of employees agreed that they have a feeling of security in this hospital from physical injury (agree = 45.4%; strongly agree = 31.6%) while 24.10% of external customers agreed (agree = 20.1%; strongly agree = 4.0%). It was also found that 87.20% of employees agreed that there was timely performance of services as expected (agree = 41.1%; strongly agree = 46.1%) while 26.10% of external customers agreed (agree = 22.1%; strongly agree = 4.0%). About 76.90% of employees agreed that the treatment received did not result in unexpected complications which required extra medication (agree = 37.3%; strongly agree = 39.6%) while 43.90% of external customers agreed (agree = 32.1%; strongly agree = 4.0%).
Table 4.10 : Measures of object quality Measures of object quality
Employees External customers 1 2 3 4 5 1 2 3 4 5
Feeling of wellbeing in this hospital
2.0%
8.0%
8.8%
49.1%
32.1%
8.0
%
8.0%
30.1%
39.8%
14.0%
The hospital’s ability to treat patients as expected
9.0%
8.8%
15.3%
40.9%
26.1%
6.0
%
14.0%
56.1%
20.1%
3.8%
Feeling of security in this hospital from physical injury
.0% 4.5%
18.5%
45.4%
31.6%
22.1%
33.8%
20.1%
20.1%
4.0%
Timely performance of services as expected
.0% .0% 12.8%
41.1%
46.1%
30.1%
28.1%
15.8%
22.1%
4.0%
The treatment received did not result in unexpected complications which required extra medication
.0% 2.3%
20.8%
37.3%
39.6%
8.0
%
22.1%
33.8%
32.1%
4.0%
NB: 1 = Strongly disagree; 2= Disagree; 3= Agree; and 4= Strongly agree 4.4.2 Process quality
Process quality was examined using four items as indicated in table 4.11. In essence, 78.70% of employees agreed that Medication waiting time was acceptable (agree = 48.6%; strongly agree = 30.1%) while 45.90% of external customers agreed (agree = 19.8%; strongly agree = 26.1%). In addition, 77.70% of employees agreed that Test waiting time was acceptable (agree = 40.9%; strongly agree = 36.8%) while 8.00% of external customers agreed (agree = 6.0%; strongly agree = 2.0%).

International Journal of Accounting Research (IJAR) Vol. 2, No. 11, 2016
21
It was also found that 84.70% of employees agreed that the speed of admission process is acceptable (agree = 44.9%; strongly agree = 39.8%) while 20.00% of external customers agreed (agree = 8.0%; strongly agree = 12.0%). Analysis also reveal that 86.50% of employees agreed that the ease of admission process is acceptable (agree = 44.6%; strongly agree = 41.9%) while 40.20% of external customers agreed (agree = 20.1%; strongly agree = 20.1%).It was also found that 73.40% of employees agreed that the time between settling in rooms and admission is acceptable (agree = 44.6%; strongly agree = 28.8%) while 30.10% of external customers agreed (agree = 20.1%; strongly agree = 10.0%). Results also shows that 85.90% of employees agreed that the waiting time for clinic appointments was acceptable is acceptable (agree = 50.1%; strongly agree = 35.8%) while 12.00% of external customers agreed (agree = 6.0%; strongly agree = 6.0%).
Table 4.11 : measures of process Measures of process Employees External customers
1 2 3 4 5 1 2 3 4 5 Medication waiting time .0% 5.8
% 15.5%
48.6%
30.1%
22.1%
20.1%
12.0%
19.8%
26.1%
Test waiting time .0% 8.3%
14.0%
40.9%
36.8%
24.1%
45.9%
22.1%
6.0%
2.0%
The speed of admission process
.0% 1.0%
14.3%
44.9%
39.8%
24.1%
36.1%
19.8%
8.0%
12.0%
Ease of admission process
6.8%
.0% 6.8%
44.6%
41.9%
19.8%
18.0%
22.1%
20.1%
20.1%
Time between settling in rooms and admission
2.3%
2.3%
22.1%
44.6%
28.8%
28.1%
23.8%
18.0%
20.1%
10.0%
Waiting time for clinic appointments was acceptable
.0% 2.3%
11.8%
50.1%
35.8%
18.0%
55.9%
14.0%
6.0%
6.0%
NB: 1 = Strongly disagree; 2= Disagree; 3= Agree; and 4= Strongly agree 4.4.3 Infrastructure quality
Infrastructure quality was examined using four items as indicated in table 4.12. In essence, 67.00% of employees agreed that nurses attending patients are skilled (agree = 45.4%; strongly agree = 21.6%) while 24.00% of external customers agreed (agree = 12.0%; strongly agree = 12.0%). About 86.70% of the employees agreed that the individuals performing tests are skilled (agree = 48.9%; strongly agree = 37.8%) while 18.00% of external customers agreed (agree = 8.0%; strongly agree = 10.0%). Similarly, 80.70% of employees agreed that the physicians attending patients are skilled (agree = 46.1%; strongly agree = 34.6%) while 28.00% of external customers agreed (agree = 16.0%; strongly agree = 12.0%).
International Journal of Accounting Research (IJAR) Vol. 2, No. 11, 2016
22
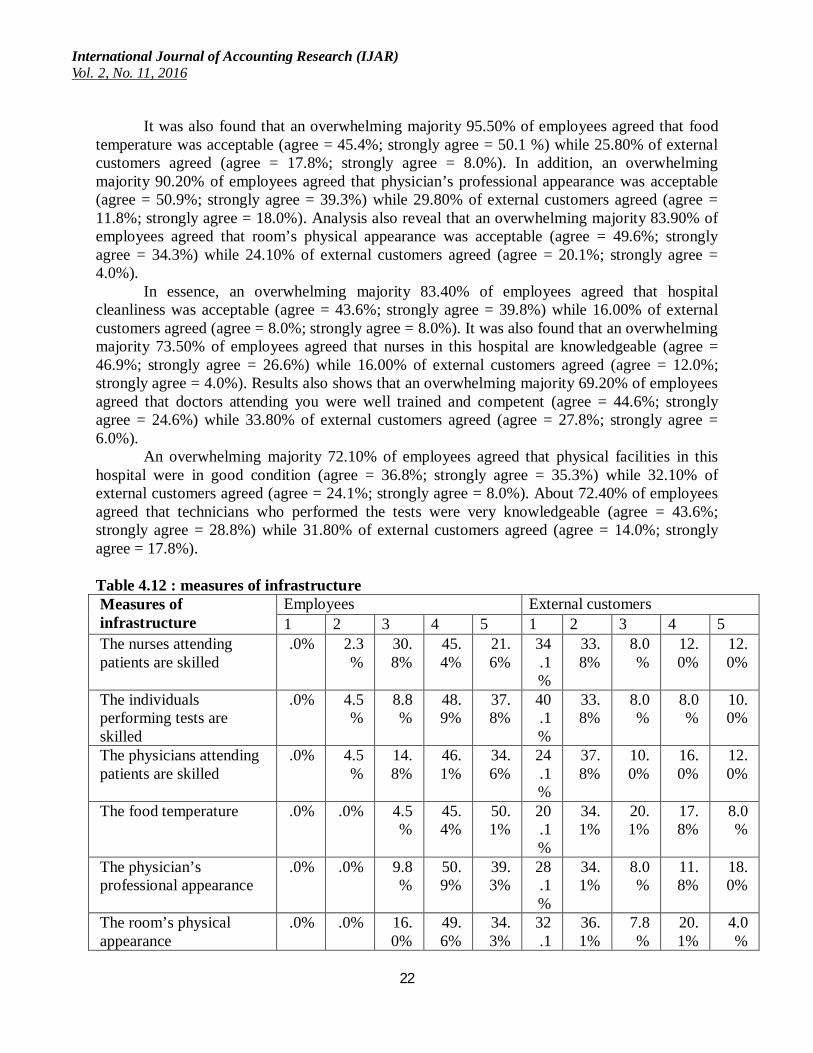
It was also found that an overwhelming majority 95.50% of employees agreed that food temperature was acceptable (agree = 45.4%; strongly agree = 50.1 %) while 25.80% of external customers agreed (agree = 17.8%; strongly agree = 8.0%). In addition, an overwhelming majority 90.20% of employees agreed that physician’s professional appearance was acceptable (agree = 50.9%; strongly agree = 39.3%) while 29.80% of external customers agreed (agree = 11.8%; strongly agree = 18.0%). Analysis also reveal that an overwhelming majority 83.90% of employees agreed that room’s physical appearance was acceptable (agree = 49.6%; strongly agree = 34.3%) while 24.10% of external customers agreed (agree = 20.1%; strongly agree = 4.0%).
In essence, an overwhelming majority 83.40% of employees agreed that hospital cleanliness was acceptable (agree = 43.6%; strongly agree = 39.8%) while 16.00% of external customers agreed (agree = 8.0%; strongly agree = 8.0%). It was also found that an overwhelming majority 73.50% of employees agreed that nurses in this hospital are knowledgeable (agree = 46.9%; strongly agree = 26.6%) while 16.00% of external customers agreed (agree = 12.0%; strongly agree = 4.0%). Results also shows that an overwhelming majority 69.20% of employees agreed that doctors attending you were well trained and competent (agree = 44.6%; strongly agree = 24.6%) while 33.80% of external customers agreed (agree = 27.8%; strongly agree = 6.0%).
An overwhelming majority 72.10% of employees agreed that physical facilities in this hospital were in good condition (agree = 36.8%; strongly agree = 35.3%) while 32.10% of external customers agreed (agree = 24.1%; strongly agree = 8.0%). About 72.40% of employees agreed that technicians who performed the tests were very knowledgeable (agree = 43.6%; strongly agree = 28.8%) while 31.80% of external customers agreed (agree = 14.0%; strongly agree = 17.8%).
Table 4.12 : measures of infrastructure Measures of infrastructure
Employees External customers 1 2 3 4 5 1 2 3 4 5
The nurses attending patients are skilled
.0% 2.3%
30.8%
45.4%
21.6%
34.1%
33.8%
8.0%
12.0%
12.0%
The individuals performing tests are skilled
.0% 4.5%
8.8%
48.9%
37.8%
40.1%
33.8%
8.0%
8.0%
10.0%
The physicians attending patients are skilled
.0% 4.5%
14.8%
46.1%
34.6%
24.1%
37.8%
10.0%
16.0%
12.0%
The food temperature .0% .0% 4.5%
45.4%
50.1%
20.1%
34.1%
20.1%
17.8%
8.0%
The physician’s professional appearance
.0% .0% 9.8%
50.9%
39.3%
28.1%
34.1%
8.0%
11.8%
18.0%
The room’s physical appearance
.0% .0% 16.0%
49.6%
34.3%
32.1
36.1%
7.8%
20.1%
4.0%

International Journal of Accounting Research (IJAR) Vol. 2, No. 11, 2016
23
% The hospital cleanliness .0% .0% 16.
5% 43.6%
39.8%
30.1%
28.1%
25.8%
8.0%
8.0%
The nurses in this hospital are knowledgeable
2.3%
1.0%
23.3%
46.9%
26.6%
25.8%
40.1%
18.0%
12.0%
4.0%
The doctors attending you were well trained and competent
.0% 2.0%
28.8%
44.6%
24.6%
16.0%
16.0%
34.1%
27.8%
6.0%
The physical facilities in this hospital were in good condition
1.8%
2.0%
24.1%
36.8%
35.3%
14.0%
34.1%
19.8%
24.1%
8.0%
The technicians who performed the tests were very knowledgeable
2.0%
10.0%
15.5%
43.6%
28.8%
6.0
%
32.1%
30.1%
14.0%
17.8%
NB: 1 = Strongly disagree; 2= Disagree; 3= Agree; and 4= Strongly agree 4.4.4 Interaction quality
Interaction quality was also examined using four items as indicated in table 4.13. According to the results, 68.10%of employees agreed that Adequacy of treatment explanation was acceptable (agree = 38.3%; strongly agree = 29.8%) while 26.00% of external customers agreed (agree = 12.0%; strongly agree = 14.0%). Also, 81.40% of employees agreed that Adequate instruction after patient leaves hospital was acceptable (agree = 42.1%; strongly agree = 39.3%) while 38.10% of external customers agreed (agree = 22.1%; strongly agree = 16.0%). About 72.60% of employees agreed that What is promised by hospital in advertising is provided (agree = 36.3%; strongly agree = 36.3%) while 38.10% of external customers agreed (agree = 12.0%; strongly agree = 26.1%).
Besides, a considerable number of employees 65.70% agreed that Getting hospital staff on phone is easy (agree = 41.1%; strongly agree = 24.6%) while 34.10% of external customers agreed (agree = 28.1%; strongly agree = 6.0%). Analysis also reveal that a considerable number of employees 72.90% agreed that Staff spends adequate time understanding patient needs (agree = 39.1%; strongly agree = 33.8%) while 33.80% of external customers agreed (agree = 25.8%; strongly agree = 8.0%). According to the results, a considerable number of employees 69.60% agreed that refund waiting time is acceptable (agree = 31.3%; strongly agree = 38.3%) while 21.80% of external customers agreed (agree = 19.8%; strongly agree = 2.0%).
Results also shows that a considerable number of employees 69.60% agreed that Instructions given to patients on billing procedures (agree = 38.3%; strongly agree = 31.3%) while 40.10% of external customers agreed (agree = 30.1%; strongly agree = 10.0%).

International Journal of Accounting Research (IJAR) Vol. 2, No. 11, 2016
24
Table 4.13 : measures of interaction Measures of interaction Employees External customers
1 2 3 4 5 1 2 3 4 5 Adequacy of treatment explanation
.0% 8.3%
23.6%
38.3%
29.8%
12.0%
33.8%
28.1%
12.0%
14.0%
Adequate instruction after patient leaves hospital
.0% 2.3%
16.3%
42.1%
39.3%
10.0%
35.8%
16.0%
22.1%
16.0%
What is promised by hospital in advertising is provided
1.8%
8.3%
17.3%
36.3%
36.3%
6.0
%
27.8%
28.1%
12.0%
26.1%
Getting hospital staff on phone is easy
.0% 9.0%
25.3%
41.1%
24.6%
12.0%
14.0%
39.8%
28.1%
6.0%
Staff spends adequate time understanding patient needs
.0% .0% 27.1%
39.1%
33.8%
12.0%
16.0%
38.1%
25.8%
8.0%
The refund waiting time is acceptable
.0% 6.0%
24.3%
31.3%
38.3%
20.1%
28.1%
30.1%
19.8%
2.0%
Instructions given to patients on billing procedures
6.8%
4.5%
19.0%
38.3%
31.3%
14.0%
10.0%
35.8%
30.1%
10.0%
NB: 1 = Strongly disagree; 2= Disagree; 3= Agree; and 4= Strongly agree 4.4.5 Atmosphere quality
In terms of the quality of atmosphere, the results in table 4.14 shows that 74.90% of employees agreed that nurse responsiveness to patient needs was acceptable (agree = 36.6%; strongly agree = 38.3%) while 41.90% of external customers agreed (agree = 30.1%; strongly agree = 11.8%). In addition, almost all the employees 81.40% agreed that information provided about the condition of patients is acceptable (agree = 43.6%; strongly agree = 37.8%) while 43.90% of external customers agreed (agree = 30.1%; strongly agree = 13.8%). Similarly, almost all the employees 77.50% agreed that politeness of hospital nurses is acceptable (agree = 44.4%; strongly agree = 33.1%) while 36.10% of external customers agreed (agree = 20.1%; strongly agree = 16.0%).
In essence, 56.60% of employees agreed that politeness of hospital physicians is acceptable (agree = 32.8%; strongly agree = 23.8%) while 48.20% of external customers agreed (agree = 22.1%; strongly agree = 26.1%). It was also found that 82.70% of employees agreed that politeness of other staff in the hospital is acceptable (agree = 34.8%; strongly agree = 47.9%) while 51.80% of external customers agreed (agree = 39.8%; strongly agree = 12.0%).
About 82.20% of employees agreed that physician’s responsiveness to needs of patients is acceptable (agree = 53.6%; strongly agree = 28.6%) while 52.10% of external customers agreed (agree = 34.1%; strongly agree = 18.0%).Results also shows that 80.70% of employees agreed that nurses’ responsiveness to needs of patients is acceptable (agree = 42.6%; strongly

International Journal of Accounting Research (IJAR) Vol. 2, No. 11, 2016
25
agree = 38.1%) while 42.10% of external customers agreed (agree = 30.1%; strongly agree = 12.0%).
In addition, 86.70% of employees agreed that hospital is concerned about the visitors and family (agree = 51.1%; strongly agree = 35.6%) while 18.00% of external customers agreed (agree = 18.0%; strongly agree = .0%). Also, 64.40% of employees agreed that sleeping accommodation available for a patient’s family (agree = 43.1%; strongly agree = 21.3%) while 59.90% of external customers agreed (agree = 33.8%; strongly agree = 26.1%).
Table 4.14 : measures of atmosphere Measures of atmosphere
Employees External customers 1 2 3 4 5 1 2 3 4 5
Nurse responsiveness to patient needs
2.3%
4.3%
18.5%
36.6%
38.3%
14.0%
20.1%
24.1%
30.1%
11.8%
Information provided about the condition of patients
6.3%
4.0%
8.3%
43.6%
37.8%
6.0
%
10.0%
40.1%
30.1%
13.8%
Politeness of hospital nurses
4.0%
2.0%
16.5%
44.4%
33.1%
12.0%
14.0%
37.8%
20.1%
16.0%
Politeness of hospital physicians
.0% 8.0%
35.3%
32.8%
23.8%
16.0%
8.0%
27.8%
22.1%
26.1%
Politeness of other staff in the hospital
4.3%
4.3%
8.8%
34.8%
47.9%
8.0
%
12.0%
28.1%
39.8%
12.0%
Physician’s responsiveness to needs of patients
2.3%
2.3%
13.3%
53.6%
28.6%
8.0
%
16.0%
23.8%
34.1%
18.0%
Nurses’ responsiveness to needs of patients
2.3%
2.3%
14.8%
42.6%
38.1%
14.0%
20.1%
23.8%
30.1%
12.0%
Hospital is concerned about the visitors and family
2.3%
4.5%
6.5%
51.1%
35.6%
12.0%
23.8%
46.1%
18.0%
.0%
Sleeping accommodation available for a patient’s family
8.0%
8.0%
19.5%
43.1%
21.3%
12.0%
10.0%
18.0%
33.8%
26.1%
NB: 1 = Strongly disagree; 2= Disagree; 3= Agree; and 4= Strongly agree 4.5 Overall satisfaction
Overall satisfaction among the employees and external customers was also assessed and the findings of analysis have been presented in table 4.15. For overall satisfaction, the mean was 2.84 (SD = .41) among external customers and 4.20 (SD = (.48) among employees. The

International Journal of Accounting Research (IJAR) Vol. 2, No. 11, 2016
26
independent t-test indicates that the employees were more satisfied overall than the external customers t (796) = 42.678, p< .001. Refer to table 4.16 for the results of independent t-test.
Table 4.15 : Mean ratings, standard deviations and mean difference for the overall satisfaction External customers
(SD) Employees M(SD)
MD
OVERAL SATISFACTION
2.84 (.41) 4.20 (.48) -1.36090
NB: M(SD) = mean (standard deviation); MD (mean difference) = mean of external customers – mean of employees

International Journal of Accounting Research (IJAR) Vol. 2, No. 11, 2016
27
Table 4.16 : Independent Samples Test for overall satisfaction Independent Samples Test
Levene's Test for Equality of
Variances t-test for Equality of Means
F Sig. t df Sig.
(2-tailed) Mean
Difference Std. Error Difference
95% Confidence Interval of the
Difference Lower Upper
OVERAL_SATISFACTION
Equal variances assumed
3.491 .062 42.678
796 .000 1.36090 .03189 1.29831 1.42350
Equal variances not assumed
42.678
776.544 .000 1.36090 .03189 1.29831 1.42350

International Journal of Accounting Research (IJAR) Vol. 2, No. 11, 2016
28
In particular, the overall satisfaction was measured using three items and findings are presented in table 4.17. According to the findings, 89.00% of employees agreed that their level of satisfaction with medical care services in this hospital (agree = 46.9%; strongly agree = 42.1%) while 24.10% of external customers agreed (agree = 20.1%; strongly agree = 4.0%). In addition, almost all employees 84.00% agreed that their level of satisfaction with nursing care services in this hospital (agree = 40.4%; strongly agree = 43.6%) while 29.80% of external customers agreed (agree = 27.8%; strongly agree 2.0%). A considerable number 73.40% of employees agreed that their level of satisfaction with hospital staff members (agree = 33.8%; strongly agree = 39.6%) while 30.10% of external customers agreed (agree = 24.1%; strongly agree = 6.0%). Table 4.17 : measures of overall satisfaction
OVERAL SATISFACTION Measures of Employees External customers
1 2 3 4 5 1 2 3 4 5 Rate your level of satisfaction with medical care services in this hospital
1.8%
2.0%
7.3%
46.9%
42.1%
12.0%
33.8%
30.1%
20.1%
4.0%
Rate your level of satisfaction with nursing care services in this hospital
.0% .0% 16.0%
40.4%
43.6%
8.0
%
28.1%
34.1%
27.8%
2.0%
Rate your level of satisfaction with hospital staff members
2.0%
2.0%
22.6%
33.8%
39.6%
10.0%
22.1%
37.8%
24.1%
6.0%
NB: 1 = Strongly disagree; 2= Disagree; 3= Agree; and 4= Strongly agree 4.6 Effect of total quality on satisfaction
Regression analysis tested the impact of total quality on the customer satisfaction. The test reveals that total quality accounted for 51.7 % of overall satisfaction variation (R2= .517, β = .719). In addition, total quality was found to influence the customer satisfaction positively and significantly (F (1, 796) = 850.55, p < .01) hence the null hypothesis that total service quality as measured by 5Q model does not impact on the overall customer satisfaction was rejected (table 4.18). Table 4.18: Total quality regression summary Variables
Overall satisfaction B SE B β
Total Service Quality .766 .026 .719 R .719 R2 .517 F(1, 796) 850.55**
*p < .05. **p < .01. 4.7 Discussion
The main purpose of conducting the study was to evaluate the total service quality in the healthcare firms and examined the influence on satisfaction level among customers. Consequently, the factors that were found in literature review to be considered important by

International Journal of Accounting Research (IJAR) Vol. 2, No. 11, 2016
29
patients in healthcare services were examined, that is, the dimension of service quality (based on the 5Q model). This study used the 5Q model (including quality dimensions of object, process, infrastructure, atmosphere and infrastructure) to assess total quality in the healthcare firms and how they influenced the satisfaction with services based on the perspectives of both external customers and employees. It was found that the external customers were satisfied with some of the service quality dimensions in the healthcare firms but not others. This can be explained by the fact that consumers (external customers) in most cases are attracted towards certain services by quality attributes.
The study has revealed that the difference between perception of external customers and employees about the quality of services was negative in all the 5 dimensions of quality. This revelation implies that perception of service quality among the employees was significantly higher than the perception of quality among the external customers which were also confirmed by the independent t-test results. In addition, these findings can be interpreted to imply that the efforts by top management of the healthcare firms to improve the quality dimensions did not meet expectations of external customers and employees equally. This was the reason why there was a difference between perception of external customers and employees.
Despite the fact that both external customers and employees established the smallest mean difference in object dimension, their ranking order of quality dimensions differed. For instance, atmosphere quality dimension was ranked the 1st in importance by the external customers; however, it was ranked the 4th most important quality dimension by the employees. This implies that both external customers and employees were able to differentiate the various service qualities of 5Q model. However, object was ranked 3rd by both external customers and employees in order of importance. In this regards, it can be indicated that service delivered to consumers is composed of different attributes since the customers have ranked the dimensions of 5Q model differently. This finding supports Zineldin (2006)’s indications that satisfaction of patients is a combination of cumulative constructs, that sums patient satisfaction with different facets of the hospital, like interaction, process, object, infrastructure and atmosphere items or variables[62]. Therefore, it can be deduced from these results that quality of healthcare services provided by the hospitals can still be improved.
Analysis of the responses by external customers shows clearly that atmosphere, interaction and object, had a higher mean rating compared to the other quality dimensions of process and infrastructure in the healthcare firms studied. Majority of the external customers disagreed that they have a feeling of security in this hospital from physical injury and they also disagreed that there was timely performance of services as expected. However, majority of external customers agreed that they have a feeling of wellbeing in the hospital but they disagreed that test waiting time was acceptable. The results also suggest that external customers expect instructions given to patients on billing procedures to be acceptable. These are prerequisite to patient-oriented, knowledgeable and service-minded healthcare professionals.
From the perception of the employees, this study revealed that process quality was the most important quality dimension. This result conforms to those of Hosseinian et al. (2015) and Scrimgeour and Barnef (2013). Based on the fact that infrastructure concerns basic and essential resources needed for healthcare services to be performed, hence it was understandable to find that the perception of employees was higher compared to that of external customers and accounted for the largest mean difference in this quality dimension. It was not surprising that some of the employees also somewhat recognize that not all the technicians who performed the

International Journal of Accounting Research (IJAR) Vol. 2, No. 11, 2016
30
tests were very knowledgeable. This was mainly because they believed the healthcare firms could provide additional training to the staff.
The external customers rated the quality of process as low; therefore it is vital for the top management of healthcare firms to recognize the various behavioural aspects in process quality to ensure the quality of this dimension becomes very high. For instance, the results reveal that less than a quarter of external customers believe that time taken for test to be conducted in the healthcare firms studied was acceptable and slightly over quarter of external customers believed that the ease of admission process was acceptable. The managers in the hospitals must take appropriate measures towards improvement of their processes and procedures.
Besides, some of the employees and external customers strongly disagreed that time between settling in rooms and admission was acceptable which implies that there is still room and common basis for improvement or enhancement of process quality levels. However, if the employees who are the healthcare providers were not aware of this failure in the process quality, then the chances of improvement would have been poor. Moreover, efforts by doctors or nurses to spend adequate time understanding patient needs have a vital role in influencing the perceptions of external customers about the healthcare service quality in the sampled hospitals. Consequently, it was reported by Uddin and Ashrafun (2011) that being polite and courteous when interacting with patients has minimal costs; however they can result into greater benefits[63].
Chapter 5: Conclusion and Recommendations
5.1 Introduction The conclusions and recommendations are presented in this chapter and the limitations
that were encountered during the study re-examined to provide a basis for recommendations to future research. Policy makers and other interested parties or players in the healthcare sector can also borrow from the results when making decisions that are important to external customers and employees. Specifically, this chapter begins with the section on conclusion them recommendations, limitations and suggestions for other studies. 5.2 Conclusion
The focus of this study on evaluating service quality in healthcare firms was based on the 5Q model to discover the areas that require improvements based on the perspectives of both employees and external customers. A number of total quality attributes were covered by this study given that total quality was measured using 5 dimensions (5Q model) each of which had different measurement items that were rated by the internal and external customers. In essence, it was found that the overall satisfaction among the employees and external customers was influenced significantly by the total quality of services and this significant relationship was also positive. According to the results presented and the discussion provided in the previous chapter, it can be deduced that all the research questions were addressed hence the study aim was attained.
The inclusion of employees in the evaluation of service quality besides the external customers was based on the findings in literature review that employees can influence the satisfaction outcome in organizations. Consequently, satisfaction of patients in the healthcare firms also depends on how employees perceive the services provided in order to develop effective strategies in meeting external customer needs. This study has a unique contribution to existing literature on customer satisfaction in that it compares the perception of external

International Journal of Accounting Research (IJAR) Vol. 2, No. 11, 2016
31
customers about quality dimensions with those of employees. In this regards, the study was able to identify the quality dimensions with largest gap and recommends ways of closing such difference in perceptions between external customers and employees.
Interestingly, the findings have indicated that external customers were similar to the employees with regards to the general service behaviours associated with service encounter quality. It is believed that 5Q model provide appropriate quality dimensions that can be used to determine the overall total quality of healthcare services. Similarly, past studies by Tahmasebi et al. (2015) and Zineldin (2006) also indicated that healthcare sector services can be best evaluated using 5Q model[64].
This study acknowledges that quality of health service delivery does not only include providing technical and professional treatment to external customers (patients) but also quality interaction between external customers and the healthcare providers. In addition, the external customers must be given clear information about treatments, next schedules or their conditions, and the healthcare providers must be very responsive to all the needs of patients. Improving interaction quality in healthcare firms implies that delivery of healthcare should be understood as a mutual relationship where the external customers have rights which must be considered in the treatment delivery process. The satisfaction of customers depends largely on the total quality of services including the human relation of employees and how employees explain concerns for external customers to understand. Hence, being polite and courteous, and addressing all questions by patients about the treatment adequately during the consultation time are essential in healthcare delivery.
One area that required more improvement efforts by the hospital managers was the atmosphere quality. The external customers see the atmosphere quality in the hospitals as low while employees believed that atmosphere quality was high. This could imply that the employees were providing treatment on professional and technical basis while disregarding the concerns of external customers about privacy and comfort in the change rooms, ventilation and cleanliness of recovery room, and the peacefulness and quietness of the hospital which impact restfulness. Generally, the results have shown that ratings of object, process, infrastructure, interaction and atmosphere quality by employees (healthcare providers such as doctors and nurses) were higher than whatever the external customers confirmed. Hence majority of employees were satisfied and believed that the overall service quality was high. Although the overall total quality among employees was found to be high, the overall total quality perception of external customers was low hence measures must be taken to address these revelations.
The situation that most external customers disagreed that the speed and ease of admission process was good requires process quality to be improved. This is based on the fact that the process of providing healthcare if perceived negatively will affect the overall perception of total quality and thus lead to decrease overall satisfaction with the services. Moreover, when the waiting time for clinic appointments and the time taken before tests are conducted are long, then it is an appalling situation that aggravates sickness. Thus, it is imperative for urgent measures to be taken by the hospital management to adopt strategies that can minimize delays in the process of healthcare delivery. A major reason given by Zineldin et al. (2014) on why the ratings of patients about quality dimension is low in healthcare firms is because of inadequate resources which can may not be adequate to provide services that are more efficient[65]. These indications of past studies and the current study suggests that employees (hospital staff) themselves and top

International Journal of Accounting Research (IJAR) Vol. 2, No. 11, 2016
32
management of healthcare firms should undertake major efforts in improving the dimensions to enhance satisfaction of external customers.
Interaction quality is a very important quality dimension in healthcare delivery as revealed in this study. In this regards, the human relations of healthcare providers with regards to courtesies and politeness when handling external customers must be improved if the hospital managers want to achieve a customer-friendly service. Due to increased competition in the healthcare sector and the entry of private hospitals, more focus has been diverted to health service delivery. The findings of this study provide important evidence that can contribute to improving quality of healthcare provided in hospitals and gain higher satisfaction of customers. It is also essential for hospital managers to understand that the failure to address these concerns on the quality dimensions can lead to customer disloyalty.
In conclusion, expectations of external customers about quality services have been increasing and more healthcare firms are shifting towards satisfaction of customers by providing high quality services. The study findings have shown that although the ratings by employees were high for all the five quality dimensions, the external customer perception about provision of these dimensions in the healthcare firms was low. Besides, object quality should also be improved given that it was rated as high rather than very high by external customers. In this regards, there is need for hospital managers to upgrade and update their healthcare services by implementing the various measures of quality dimensions reported in this study. Based on the priorities of external customers, it can be suggested in this study that there is need for improvement to be made particularly in quality dimensions of atmosphere, interaction, infrastructure and process. 5.3 Implications
This study has provided the perceptions of both employees and external customers regarding quality of the care in healthcare firms. From an organizational viewpoint, the results are important in addressing service improvements and maintaining high quality standards to enhance satisfaction level of patients and employees. Although most of the past studies focused on external customers, this study included the perspectives of employees as well to evaluate service quality. Hence management should consider developing a culture where the needs of employees are also addressed besides that of external customers.
The hospital managers and other stakeholders can gain from this research by understanding how employees evaluate the total quality of service. By understanding the dimensions used by employees in total service evaluation, better tools and strategies can be created to incorporate the true employee evaluation of total quality of the services. Strategically, being able to understand external perceptions can also lead to better results for the external customers. Moreover, having insights into the wants and needs of customers have been reported to increase the overall customer satisfaction levels. Besides, given that quality is associated with satisfaction levels and the quality dimensions are perceived differently, understanding the particular quality measures requiring improvement is of great value to the hospital firms. 5.4 Recommendations
Since employees generally rate the service quality to be higher than external customer ratings as revealed in the results, it can be recommended to managers that they need to conduct regular evaluation of service quality based on the perspectives of external customers. However, the perspectives of employees should also be obtained to determine the areas that employees want to be addressed first by the management.

International Journal of Accounting Research (IJAR) Vol. 2, No. 11, 2016
33
Another recommendation is that managers should ensure quality improvements are continuous in order to have greater effectiveness and efficiency in provision of services. Furthermore, based on the fact that consumer needs and perceptions change rapidly as they become more informed or as competition increases, continuous evaluations are vital. Such evaluations should capture perspectives of employees and external customers concerning service quality so that the mean difference in their perceptions can be understood. In this regards, appropriate strategies will be developed.
From the study findings, it appeared that the healthcare sector is where interaction quality is also a contributor towards the total quality. For this dimension to be incorporated by managers in the service quality, then good relation between employees and external customers must be established. Besides interaction, the quality of other dimensions like process, object, infrastructure and atmosphere must also be improved by the managers. 5.5 Limitations
The study mainly employed convenience sampling as the method for recruiting the samples. Despite the fact that convenience sampling is beneficial in terms of high response rate and other advantages, it also has a limitation. For instance, convenience sampling may not provide a representative study population since the sample units are recruited based on their proximity or availability during the process of data collection.
Time was also another limitation which also influences the type of research strategy. In essence, because of limited time, data was collected at a single point in time hence the strategy was cross sectional study. However, other strategies could have been used such as longitudinal study in which samples are followed over long period of time to provide more accurate and valid results. Nonetheless, time constrain could not allow such research strategies to be adopted. Using longitudinal studies also require massive resources which was also inadequate in this study.
The number of hospitals sampled was also small, hence. If there was more resources and time, then all healthcare firms could have been targeted or healthcare firms from other countries could have also been included in the study. But this was not necessary given that sampling a few units can be used to represent the target population. 5.6 Future studies
Further research would be necessary in this area given that there were limitations that affected these study findings to some extent. For instance, the study only gathered the perception of employees and the external customers about service quality, however, the perceptions of the hospital management were not considered. In this regards, future studies can incorporate the top management of hospitals in their assessments to examine how their perspectives differ from those of customers. In addition, further studies can also b conducted in assess the impacts of total quality on the job satisfaction of employees based on the dimensions of 5Q model. In addition, they may also incorporate reputation and trust as independent variables alongside total quality. This study was quantitative hence the methods were quantitative and involved survey questionnaires. In this regards, the future studies may include other research approaches such as qualitative technique involving interviews to add more insight into the findings.

International Journal of Accounting Research (IJAR) Vol. 2, No. 11, 2016
34
References 1. Hanif, M, Hafeez, S and Riaz, A 2010, ‘Factors Affecting Customer Satisfaction’,
International Research Journal of Finance and Economics, vol. 60, no.9, pp. 44-52. 2. Gupta, A, McDaniel, JC, Herath, S and Kanthi, T 2004, ‘Quality management in service firms:
sustaining structures of total quality service’, Managing Service Quality, vol. 15, no.4, pp. 389-402
3. Barnes, BR, Fox, M T and Morris, D S 2004, ‘Exploring the linkage between internal marketing, relationship marketing and service quality: a case study of a consulting organization’, Total Quality Management, vol. 15, no.5, pp. 593-601.
4. Nusair, K, Yoon, H J , Naipaul, S and Parsa, H G 2010, ‘Effect of price discount frames and levels on consumers’ perceptions in low-end service industries’, International Journal of Contemporary Hospitality Management, vol. 22, no.6, pp. 814-835.
5. Boschoff, C and Gray, B 2004, ‘The relationship between service quality, customer satisfaction and buying intentions in the private hospital sector’, South African Journal of Business Management, vol. 35, no.4, pp. 27-37.
6. Zineldin, M 2006, ‘The quality of health care and patient satisfaction: an exploratory investigation of the 5Qs model at some Egyptian and Jordanian’, International journal of health care quality assurance, vol. 11, no.12, pp. 60-92.
7. Dagger, TS, Sweeney, JC and Johnson, LW 2007, ‘A Hierarchical Model of Health Service Quality Scale Development and Investigation of an Integrated Model’, Journal of Service quality, vol. 10, no.8, pp. 123-42.
8. Wu, CC 2011, ‘The impact of hospital brand image on service quality, patient satisfaction and loyalty’, African Journal of Business Management, vol. 5, no.12, pp. 4873-4882.
9. Ganguli, S and Roy, S K 2010, ‘Service quality dimensions of hybrid services’, Managing Service Quality, vol. 20, no.5, pp. 404-424.
10. Zavare. MA, Abdullah, MY, Hassan. STS, Said, SB and Kamali, M 2010, ‘Patient Satisfaction: Evaluating Nursing Care for Patients Hospitalized with Cancer in Tehran Teaching Hospitals, Iran’, Global Journal of Health Science, vol. 2, no.1, pp.23-45
11. Manias, E 2010, ‘Medication communication: a concept analysis’, Journal of Advanced Nursing, vol. 66, no.4, pp. 933–943.
12. Lee, W I, Chen, CW, Chen, TH and Chen, CY 2010, ‘The relationship between consumer orientation, service value, medical care service quality and patient satisfaction: The case of a medical center in Southern Taiwan’, Afr. J. Bus. Manage, vol. 4, no.4, pp. 448-458.
13. Rose, P and Yates, P 2013, ‘Person centred nursing care in radiation oncology: A case study’, Eur J Oncol Nurs, vol. 17, no.5, pp. 554–62.
14. Rajani, S, Sawyer, J, Shirton, L, DeHaan, G, Kluthe, C and Persad, R 2013, ‘Patient and parent satisfaction with a dietitian-and nurse- led celiac disease clinic for children at the Stollery Children's Hospital, Edmonton, Alberta’, Can J Gastroenterol, vol. 27, no.8, pp. 463–6.
15. Kamimura, A, Ashby, J, Myers, K, Nourian, MM and Christensen, N 2014, ‘Satisfaction with healthcare services among free clinic patients’, J Community Health.;40, no.8, pp. 62–72.

International Journal of Accounting Research (IJAR) Vol. 2, No. 11, 2016
35
16. Nguyen, T 2002, ‘Factors determining inpatient satisfaction with care. Social Science & Medicine, vol. 54, no.9, pp. 493–504.
17. Kuo-Hsien, H 2009, ‘The effects of the healthcare quality on patient satisfaction: In terms of rehabilitation services. Master Thesis at National Sun yet-sen University-China.
18. Matsa, D 2011, ‘Competition and Product Quality in the Supermarket Industry’, Quarterny J Eco, vol. 126, no.23, pp. 1539–1591.
19. Chu-Mei, L 2004, ‘The Multidimensional and Hierarchical Structure of Perceived Quality and Customer Satisfaction’, International Journal of Management, vol. 22, no.8, pp. 42-35
20. Rahman, M S 2012, ‘Service quality, corporate image and customer’s satisfaction towards customers perception: an exploratory study on telecom customers in Bangladesh’, Business Intelligence Journal, vol. 5, no.1, pp.34-67.
21. Hanif, M, Hafeez, S and Riaz, A 2010, ‘Factors Affecting Customer Satisfaction’, International Research Journal of Finance and Economics, vol. 60, no.9, pp. 44-52.
22. Uzun, O 2013, ‘Patient satisfaction with nursing care at a university hospital in Turkey’, Journal nurse care qual, vol. 15, no.10, pp. 79-96.
23. Kaldenberg, D 2010, ‘Patient' satisfaction and health status’, Health mark quarterly, vol.18, no.6, pp. 81-101.
24. Drèze, X and Nunes, JC 2009, ‘Feeling superior: The impact of loyalty program structure on consumers’ perceptions of status’, J Consum Res, vol. 35, no.7, pp. 890−905.
25. Gupta, A, McDaniel, JC, Herath, S and Kanthi, T 2004, ‘Quality management in service firms: sustaining structures of total quality service’, Managing Service Quality, vol. 15, no.4, pp. 389-402
26. Barnes, BR, Fox, M T and Morris, D S 2004, ‘Exploring the linkage between internal marketing, relationship marketing and service quality: a case study of a consulting organization’, Total Quality Management, vol. 15, no.5, pp. 593-601.
27. Drèze, X and Nunes, JC 2009, ‘Feeling superior: The impact of loyalty program structure on consumers’ perceptions of status’, J Consum Res, vol. 35, no.7, pp. 890−905.
28. Desai, VV 2011, ‘Patient Satisfaction and Service Quality Dimensions Advances’, Management, vol. 4, no.7, pp. 40-45.
29. Joolaee, S, Haji, F, Peyravi, H and Haghani, H 2010, ‘Nursing medication errors and its relationship with work condition in Iran University of Medical Sciences’, Iran J Med Ethics Hist Med, vol. 3, no.1, pp. 65–76.
30. Ladha, K, Gupta, R, Gill, S and Verma, M 2014, ‘Patient satisfaction with complete dentures fabricated using two neutral zone techniques: a within-subject cross-over pilot study’, J Indian Prosthodont Soc, vol. 14, no.2, pp. 161–8.
31. Piskar, F and Faganel A 2009, ‘A successful CRM implementation project in a service company’, Journal Organizacija, vol. 42, no.8, pp. 199-208.
32. Sureshchandar, GS, Rajendran, C and Anantharaman, RN 2002, ‘Determinants of customer-perceived service quality: a confirmatory factor analysis approach’, Journal of Service Marketing, vol. 16, no.6, pp. 9-34.
33. Bruhn, M and Georgi, D 2006, ‘Services marketing: Managing the service value chain, Prentice Hall, Harlow, England.
34. Sureshchandar, GS, Rajendran, C and Anantharaman, RN 2002, ‘Determinants of customer-perceived service quality: a confirmatory factor analysis approach’, Journal of Service Marketing, vol. 16, no.6, pp. 9-34.

International Journal of Accounting Research (IJAR) Vol. 2, No. 11, 2016
36
35. Álvarez, SL, Casielles, VR and Diaz Martin, MA 2011, ‘Analysis of the role of complaint management in the context of relationship marketing’, J Market Manage, vol. 27, no.1, pp. 143-164.
36. Drèze, X and Nunes, JC 2009, ‘Feeling superior: The impact of loyalty program structure on consumers’ perceptions of status’, J Consum Res, vol. 35, no.7, pp. 890−905.
37. Brady, M and Cronin, J 2001, ‘Some new thoughts on conceptualising perceived service quality: a hierarchical approach’, Journal of Marketing, vol. 65, no.4, pp. 34-39.
38. Hosseinian, M, Ajorpaz, NM and Manesh SE 2015, ‘Mothers’ Satisfaction With Two Systems of Providing Care to Their Hospitalized Children’, Iran Red Crescent Med J, vol. 17, no.2, pp. 23-33.
39. O’Connor, SJ, Trinh, H and Shewchuk, RM 2011, ‘Perceptual gaps in understanding patient expectations for care service quality’, J Health care management review, vol. 25, no.3, pp. 7-23.
40. Kamimura, A, Ashby, J, Myers, K, Nourian, MM and Christensen, N 2014, ‘Satisfaction with healthcare services among free clinic patients’, J Community Health.;40, no.8, pp. 62–72.
41. Uddin, MJ and Ashrafun L 2011, ‘Factors Determining Inpatient Satisfaction with Hospital Care in Bangladesh’, Asian Social Science, vol.7, no.6, pp.56-78
42. Rahman, M S 2012, ‘Service quality, corporate image and customer’s satisfaction towards customers perception: an exploratory study on telecom customers in Bangladesh’, Business Intelligence Journal, vol. 5, no.1, pp.34-67.
43. Nusair, K, Yoon, H J , Naipaul, S and Parsa, H G 2010, ‘Effect of price discount frames and levels on consumers’ perceptions in low-end service industries’, International Journal of Contemporary Hospitality Management, vol. 22, no.6, pp. 814-835.
44. Ziviani, J, Darlington, Y, Feeney, R, Rodger, S and Watter, P 2014, ‘Early intervention services of children with physical disabilities: complexity of child and family needs’, Aust Occup Ther J. , vol. 61, no.2, pp. 67–75.
45. Piskar, F and Faganel A 2009, ‘A successful CRM implementation project in a service company’, Journal Organizacija, vol. 42, no.8, pp. 199-208.
46. Dagger, TS, Sweeney, JC and Johnson, LW 2007, ‘A Hierarchical Model of Health Service Quality Scale Development and Investigation of an Integrated Model’, Journal of Service quality, vol. 10, no.8, pp. 123-42.
47. Rose, P and Yates, P 2013, ‘Person centred nursing care in radiation oncology: A case study’, Eur J Oncol Nurs, vol. 17, no.5, pp. 554–62.
48. Zineldin, M 2006, ‘The quality of health care and patient satisfaction: an exploratory investigation of the 5Qs model at some Egyptian and Jordanian’, International journal of health care quality assurance, vol. 11, no.12, pp. 60-92.
49. Zineldin, M 2006, ‘The quality of health care and patient satisfaction: an exploratory investigation of the 5Qs model at some Egyptian and Jordanian’, International journal of health care quality assurance, vol. 11, no.12, pp. 60-92.
50. Tahmasebi, F, Abdi, J M and Ansarian, Z 2015, ‘Evaluation and analysis of qualitative indicators of patient satisfaction with the quality of health care services based on the 5Qs model’, Gazi Univertesi Gazi Egitim Fakultesi Dergisi, vol. 04, no.4, pp. 12-25.
International Journal of Accounting Research (IJAR) Vol. 2, No. 11, 2016
37
51. Zineldin, M 2006, ‘The quality of health care and patient satisfaction: an exploratory investigation of the 5Qs model at some Egyptian and Jordanian medical clinics’, International journal of health care Quality Assurance, vol. 19, no.23, pp. 60-92.
52. Zineldin, M 2006, ‘The quality of health care and patient satisfaction: an exploratory investigation of the 5Qs model at some Egyptian and Jordanian medical clinics’, International journal of health care Quality Assurance, vol. 19, no.23, pp. 60-92.
53. Rajani, S, Sawyer, J, Shirton, L, DeHaan, G, Kluthe, C and Persad, R 2013, ‘Patient and parent satisfaction with a dietitian-and nurse- led celiac disease clinic for children at the Stollery Children's Hospital, Edmonton, Alberta’, Can J Gastroenterol, vol. 27, no.8, pp. 463–6.
54. Tahmasebi, F, Abdi, J M and Ansarian, Z 2015, ‘Evaluation and analysis of qualitative indicators of patient satisfaction with the quality of health care services based on the 5Qs model’, Gazi Univertesi Gazi Egitim Fakultesi Dergisi, vol. 04, no.4, pp. 12-25.
55. Zineldin, M 2006, ‘The quality of health care and patient satisfaction: an exploratory investigation of the 5Qs model at some Egyptian and Jordanian’, International journal of health care quality assurance, vol. 11, no.12, pp. 60-92.
56. Bogdan, RC and Biklen, SK 2006, Qualitative research in education: An introduction to theory and methods, Allyn & Bac, NY.
57. Belk, RW 2006, Handbook of qualitative research methods in marketing, Edward Elgar, Cheltenham.
58. Cresswell, JW 2006, Mixed method research, Sage Publications, Thousand Oaks 59. Matthews, B and Ross L 2010, Research Methods: A Practical Guide for the Social Sciences,
Longman, Bristol. 60. Saunders, M, Lewis, P and Thornhill, A 2012, Research Methods for Business students (6th
Ed), Financial Times , London 61. Yin, RK 2009, Case Study Research. Design and Methods (4th Ed), Sage Publications,
Thousand Oaks 62. Zineldin, M 2006, ‘The quality of health care and patient satisfaction: an exploratory
investigation of the 5Qs model at some Egyptian and Jordanian’, International journal of health care quality assurance, vol. 11, no.12, pp. 60-92.
63. Uddin, MJ and Ashrafun L 2011, ‘Factors Determining Inpatient Satisfaction with Hospital Care in Bangladesh’, Asian Social Science, vol.7, no.6, pp.56-78
64. Tahmasebi, F, Abdi, J M and Ansarian, Z 2015, ‘Evaluation and analysis of qualitative indicators of patient satisfaction with the quality of health care services based on the 5Qs model’, Gazi Univertesi Gazi Egitim Fakultesi Dergisi, vol. 04, no.4, pp. 12-25.
65. Zineldin, M, Nessim, KS, Thurn, E and Gustafsson, D 2014, ‘Loyalty, Quality and Satisfaction in FMCG Retail Market does Loyalty in Retailing Exist? ’, J Bus Fin Aff, vol. 3, no.3, pp. 122 -56