the perceived quality of healthcare service and patients - R-Cube
151
THE PERCEIVED QUALITY OF HEALTHCARE SERVICE AND PATIENTS’ SATISFACTION IN DISTRICT HOSPITALS, ULAANBAATAR CITY, MONGOLIA By: Chimed-Ochir Odgerel 2010.05.01 Thesis Presented to the Higher Degree Committee of Ritsumeikan Asia Pacific University, in Partial Fulfillment of the Requirements for the Degree of Master of Public Health Management, International Cooperation Policy
Transcript of the perceived quality of healthcare service and patients - R-Cube
THE PERCEIVED QUALITY OF HEALTHCARE
SERVICE AND PATIENTS’ SATISFACTION IN
DISTRICT HOSPITALS, ULAANBAATAR CITY,
MONGOLIA
By:
Chimed-Ochir Odgerel
2010.05.01
Thesis Presented to the Higher Degree Committee of
Ritsumeikan Asia Pacific University, in
Partial Fulfillment of the Requirements for the Degree of
Master of Public Health Management, International Cooperation
Policy

i
ACKNOWLEDGEMENT
First and foremost, I would like to give my most gratitude to my supervisor,
Professor Nader Ghotbi, MD, PhD, for his tremendous support and valuable
guidance. I will always be sincerely grateful for all his kindness, understanding
and great inspiration for my work and student life in Japan. I will remember all
his valuable advice in my future career as I certainly value his professional skill in
the research field.
I also would like to thank Professor Uchida Yasuo for his valuable opinions on
my research and great encouragement.
My wholehearted gratitude goes to JICE (Japanese International Cooperation
Center) because I would not have been here without JICE who selected me as one
of fellowships and provided this opportunity to study in Japan. I would like to
especially thank our JDS (Japanese Development Scholarship) coordinators for
their great support and attentiveness to manage my life in Japan. I am very much
indebted to them.
My honorable appreciation goes to Chimedsuren Ochir, Dean of School of Public
Health, Health Sciences University of Mongolia, and for her valuable opinions on
my research and all her kind support to conduct my research. She supported me to
start my career in the research field.

ii
Last but not least, for my friend Suvdmaa.Ts and my beloved brother
Chinzorig.Ch, thank you very much for help in data collection.
Odgerel Chimed-Ochir
iii
TABLE OF CONTENTS Acknowledgement ............................................................................................................. i
List of tables ..................................................................................................................... vi
List of figures ................................................................................................................... viii
List of abbreviations ........................................................................................................... ix
Abstract ............................................................................................................................... x
Chapter one ......................................................................................................................... 1
Introduction to the study ..................................................................................................... 1
The goal of the study ....................................................................................................... 4
The objective of the study ............................................................................................... 4
The research questions of the study ................................................................................ 5
The significance of the study .......................................................................................... 6
The limitations of the study............................................................................................. 7
The general structure of the thesis .................................................................................. 7
Chapter two ......................................................................................................................... 9
The health system in Mongolia ........................................................................................... 9
The structure of the current health system ...................................................................... 9
The financing of health sector in Mongolia .................................................................. 15
The state budget ........................................................................................................ 16
Social health insurance .............................................................................................. 17
Out of pocket expenses ............................................................................................. 19
Chapter three ..................................................................................................................... 21
Literature review ............................................................................................................... 21
The service quality ........................................................................................................ 21
The quality of healthcare service .................................................................................. 22
How to measure the quality of healthcare services? ..................................................... 30
SERVQUAL instrument ............................................................................................... 33
Chapter 4 ........................................................................................................................... 37
Methodology of the study ................................................................................................. 37
Research design ............................................................................................................. 37
The study area ............................................................................................................... 38
Sampling and data collection ........................................................................................ 38
The validity and reliability of questionnaire ................................................................. 40

iv
Chapter five ....................................................................................................................... 49
The results of the study ..................................................................................................... 49
Description of the sample.............................................................................................. 49
The analysis of SERVQUAL instrument ...................................................................... 53
The analysis of patients‘ overall satisfaction ................................................................ 78
Chapter six ...................................................................................................................... 102
Discussion of the findings ............................................................................................... 102
Chapter seven .................................................................................................................. 111
Conclusions and recommendations ................................................................................. 111
Conclusions of the study ............................................................................................. 111
Recommendations ....................................................................................................... 113
Appendix ......................................................................................................................... 115
References ....................................................................................................................... 120

v
LIST OF TABLES
2.1 Relationship of the Type of Care; and Type of Facilities and Referral level
3.1 Definitions on the service quality
4.1 The estimation of sample sizes
4.2 KMO and Bartlett's Test
4.3 Total Variance Explained
4.4 Rotated Component Matrix
4.5 Factor loading
5.1 Education level of participants
5.2 Occupational status of participants
5.3 Descriptive statistics of Expectations (E) of patients/ Descriptive statistics
of Perceptions (P) of patients
5.4 Mean of SERVQUAL scores
5.5 The first five largest/smallest mean of SERVQUAL scores
5.6 Paired Samples Statistics (total expectations and perceptions of patients)
5.7 Paired Samples Test (total expectations and perceptions of patients)
5.8 Paired Samples Test (difference between expectations and perceptions by
dimensions)
5.9 ANOVA for SERVQUAL scores (by gender)
5.10 Correlations between age and SERVQUAL scores
5.11 ANOVA for SERVQUAL scores (by occupation)
5.12 ANOVA for SERVQUAL scores (by education level)
5.13 ANOVA for SERVQUAL scores (by hospital admitted)
vi
5.14 ANOVA for gap score (by admitted hospital)
5.15 Multiple Comparisons of gap scores (by admitted hospitals)
5.16 ANOVA for SERVQUAL scores (by number of admission)
5.17 ANOVA for perception of patients (by number of admission)
5.18 ANOVA for SERVQUAL scores (by self reported health status)
5.19 Correlations between overall satisfaction and age
5.20 Descriptive of overall satisfaction (by age group)
5.21 Test Statistic for overall satisfaction (by age group)
5.22 Test Statistics for overall satisfaction (by gender)
5.23 Test Statistics for overall satisfaction of patients (by occupation)
5.24 Test Statistics for overall satisfaction of patients
5.25 Test Statistics for overall satisfaction of patients (by admitted hospitals)
5.26 Correlations between number of admission and overall satisfaction
5.27 Test Statistics for overall satisfaction of patients (by number of admission)
5.28 Test Statistics for overall satisfaction of patients (by self reported health
status)
5.29 Correlations between length of stay and overall satisfaction
5.30 Test Statistics for overall satisfaction of patients (by length of stay)
5.31 Test of Parallel Lines (Logit link of Ordinal regression analysis for
complete model)
5.32 Model Fitting Information (Clog-log link of Ordinal regression analysis
for complete model)
vii
5.33 Test of Parallel Lines (Clog-log link of Ordinal regression analysis for
complete model)
5.34 Pseudo R-Square (Clog-log link of Ordinal regression analysis for
complete model)
5.35 Parameter Estimates (Clog-log link of Ordinal regression analysis for
complete model)
5.36 Predicted Response Category * OVSAT Crosstabulation (complete model)
5.37 Model Fitting Information (Clog-log link of Ordinal regression analysis
for parsimonious model)
5.38 Pseudo R-Square (Clog-log link of Ordinal regression analysis for
parsimonious model)
5.39 Test of Parallel Lines (Clog-log link of Ordinal regression analysis for
parsimonious model)
5.40 Parameter Estimates (Clog-log link of Ordinal regression analysis for
parsimonious model)
5.41 Predicted Response Category * OVSAT Crosstabulation (parsimonious
model)
5.42 Correlations between intention to recommend hospitals and overall
satisfaction
viii
LIST OF FIGURES
2.1 Administrative levels of Mongolia
2.2 Sources of health expenditure
3.1 Theoretical framework of study
5.1 Age structure of the participants (by percent)
5.2 Number of admission to the hospital
5.3 Self reported health status at admission (by percent)
5.4 The mean of gap scores
5.5 Q-Q plots of variables on expectations and perceptions of the patients
5.6 Means of expectations and perceptions (by dimensions)
5.7 Gap Score (by dimensions)
5.8 Mean of SERVQUAL scores (by gender)
5.9 Means of SERVQUAL scores (by occupation)
5.10 Means of SERVQUAL scores (by education level)
5.11 Mean of SERVQUAL scores (by hospital admitted)
5.12 Means of SERVQUAL scores (by number of admission)
5.13 Mean of SERVQUAL scores (by self reported health status)
5.14 Frequency of overall patient satisfaction (by percentage)
5.15 Overall satisfaction of patients by gender (by percentage)
5.16 The means of overall satisfaction of patients (by occupation)
5.17 The means of satisfaction (by educational level)
5.18 The means of satisfaction (by hospital admitted)
5.19 Means of satisfaction (by group of number of admission)

ix
LIST OF ABBREVIATIONS
ADB- Asian Development Bank
ANOVA- Analysis of Variance
FGP- Family Group Practice
GDP- Gross Domestic Product
HSDP- Health Sector Development Project
JDS- Japanese Development Scholarship
JICE- Japanese International Cooperation Center
KMO- Kaiser-Meyer-Olkin
MoH- Ministry of Health
SD- Standard Deviation
SERVQUAL- Service Quality
UB- Ulaanbaatar
USA- United States of America

x
ABSTRACT
The perceived quality is defined as ―a gap between patient‘s expectation and
perception of service along the quality dimensions‖ (Parasuraman et al., 1985).
The patients‘ perceptions seem to be largely ignored by healthcare providers in
Mongolia. Thefore, this study is a patient-centered one and focuses on examining
service quality indicated by differences of patients‘ expectations and perceptions
in the district hospitals of Ulaanbaatar city, Mongolia. It also examines the link
between patients‘ perception and their overall satisfaction with healthcare services.
A hundred and fifty seven (157) patients were interviewed using a SERVQUAL
(Service quality) questionnaire proposed by Parasuraman (1985; 1991).
According to the factor analysis, all questions were loaded into seven dimensions
including tangible, reliability, responsiveness, communication, empathy,
accountability and assurance.
The perceived service quality was measured by the following equation:
Q= Px-Ex
Where: Q – is Perceived quality of service; and Px and Ex – are ratings
corresponding to perceptions and expectations of ―x‖ statement. The ordinal
regression model was used to examine significant elements influencing patients‘
overall satisfaction.
The analysis shows that expectations of the patients are higher than their
perceptions and it suggests that there is a room for quality improvement initiatives
in all seven dimensions. The largest quality gaps are in the empathy dimension
including elements on nursing care, and respect shown by doctors and nurses

xi
towards patients. The neat appearance of doctors and staff presents a less
problematic element of the service quality in district hospitals.
Generally, patients have high expectations on all dimensions of quality of
healthcare services. Among the seven quality dimensions, assurance factor
including the competency of the doctors and nurses‘ skill shows the highest
expectation and perception.
Patients‘ evaluations also suggest that they are disappointed regarding the quality
of healthcare services in relation to care provided by nurses and respect shown by
doctors and nurses. These elements are also included in the empathy dimension.
The patients have low perceptions on comfortableness of patients‘ rooms and
availability of modern equipment in district hospitals.
Patients who had been admitted in hospital for the first time were less satisfied
with services while those who had been admitted more than 12 times were more
satisfied. Any other background factors of patients were not found to be
significantly related to their satisfaction. The overall satisfaction of the patients
was significantly associated with six explanatory variables regarding perception
of patients: comfortableness of patients‘ room (p=0.007), explanation of
procedure done by nurses (p=0.003), helpfulness of nurses (p<0.001),
respectfulness of nurses (p=0.008), nurses‘ care (p=0.004), and attentiveness of
doctors to listen to patients (p=0.016).
In the discussion on the findings of the study, it is suggested that the level of
doctors‘ competence and nurses‘ skill should not be neglected by hospital
managers solely relying on the patients‘ high perception because patients‘
xii
judgment might not be objective due to their lack of knowledge on medical issues
and unfamiliarity with medical service. However, healthcare providers need to
pay attention to more patient-centered empathetic service. The regular feedback
from patients can be integrated in the healthcare delivery system and the quality
of healthcare service can be effectively monitored through patients‘ voice to bring
improvements in behaviors of the doctor and nurses.
The current findings provide a guideline for the healthcare provider in the
allocation of efforts to maximize patient satisfaction and to improve the perceived
quality of healthcare services.
1
CHAPTER ONE
INTRODUCTION TO THE STUDY
Keeping pace with current technological advances, people today are choosing a
new approach to healthcare services; they are well informed and eager to take
responsibility for their own health. Therefore, the consumers of healthcare
services have exceptionally higher expectations and demand a high level of
accuracy, reliability, responsiveness and empathy. In short, they demand overall
better healthcare services than in the past. They are also becoming more critical of
the quality of healthcare service they are provided with (Lim & Nelson, 2000).
Due to this new paradigm in healthcare services, hospital administrators need to
take into consideration patients‘ expectations and perceptions, and must address
the issue of improving the perceived quality of healthcare services they provide.
In general, providing good quality healthcare is an ethical obligation of all
healthcare providers (Zineldin, 2006) and receiving good quality care is a right of
all patients (Pickering, 1991).
Until 1990 Mongolia was under a central planned economy and healthcare
expenditure was fully financed by the government. In the central budget
dependent health system, the technical aspects of quality such as appropriateness
of diagnoses and treatments was the priority issue of quality of healthcare service.
In other words, the quality of healthcare services was solely defined by provider
based approach. However, upon the reform of the health system in late 1990s, the
concept of patient oriented services was incorporated. In spite of this change, the
quality assurance system still focuses its attention on the technical aspects of care
2
rather than aspects of interpersonal quality such as communication with patients,
willingness to help patients, timeliness and accuracy of services. For instance, a
government agency, State Professional Inspection Agency, is in a charge of the
monitoring and implementation of regulations and standards related to health
system and is responsible for ensuring whether or not the health facilities and staff
follow the standards (Bolormaa et al., 2007). The Agency audits hospitals every
six months and is entitled to give penalties, even to revoke a license, if there is
evidence that medical personnel at a hospital do not follow standards; however,
no incentives are given to good interpersonal care provided by healthcare
providers. Thus the medical staffs are more cautious about not making technical
mistakes in their duties instead of being cautious about improving their
interpersonal relationship with patients.
According to the report of the Ministry of Health of Mongolia (MoH) (2006),
―Traditional patient complaint modes, such as phone calls and letters, still
predominate in the health sector‖. Although these arrangements tend to be
considered effective, in fact, patients‘ perceptions were ignored by health
administrators as well as health providers and the quality of day-to-day care
remains very low; bureaucracy of medical staff, poor communication and other
aspects of interpersonal care are widely criticized (Bolormaa et al., 2007). In late
1990s, patient satisfaction was considered as a major criterion of the quality,
although, the findings have not been reflected in improving the quality of
healthcare service. Moreover, neither clear guidelines nor sector-wide approaches
for this issue have been developed. Misunderstanding of patients‘ needs leads to

3
the underutilization of existing facilities and hinders the overall development of
the health system. Therefore, it is important to consider the patients‘ opinion to
assess the quality of healthcare services.
The district hospitals which are the target hospitals of my study provide healthcare
services to the whole population of Ulaanbaatar city, the capital city of Mongolia;
however, district hospitals can‘t play a gate keeping role in inpatients service.
Thus, it results in an overload of the next higher level hospitals.
In 2008, 81.7% of health expenditure was spent for inpatient service. Even though
the rate of bypassing district hospitals is high, the average occupancy rate in
district hospital is still very high. It might show that many unnecessary cases
which can be treated at home are admitted in district hospitals in order to fully
occupy the beds. If we can pay more attention towards the quality of healthcare
services provided in district hospital, the bypassing rate might be decreased and
following that, the number of unnecessary cases admitted in district hospital also
can be decreased. Consequently, the health expenditure on inpatient services can
be reduced and overall, the hospital system can be managed effectively.
Taking into account of situations which have been previously mentioned, an
examination of the quality of healthcare services provided in district hospitals
could be a good start for an effective management of the admission system and
patient oriented service. Therefore, my study focused in examining the perceived
quality of healthcare services provided in the district hospitals of UB city,
Mongolia,

4
The goal of the study
The main goal of this research is to study the perceived quality of healthcare
services and the relationship between the perception and satisfaction of patients
with healthcare services provided at the district hospitals of Ulaanbaatar city,
Mongolia
The objective of the study
In order to achieve the goal of the study the following objectives were developed:
1. To assess the patients‘ perceptions and expectations on the quality of
healthcare services provided by the district hospitals of UB city, Mongolia
2. To examine how closely patients‘ perceptions and expectations match
(quality gap) in each quality dimensions; and to study if there are any
factors influencing patients‘ perceptions and expectations.
3. To examine the significant elements of patients‘ perceptions influencing
the patients‘ overall satisfaction with healthcare services provided at
district hospitals
4. To assure about the relationship between the patients‘ satisfaction and
their intention on recommendation of the hospital to others

5
Within the goal of the study, three main hypotheses can be proposed as follows:
1. In general, patients have high expectations and lower perceptions
regarding healthcare services, however, large variation can be found in
terms of quality dimensions.
2. The quality gaps exist in all quality dimensions in district hospitals;
however, size of gaps can differ.
3. Generally, patients are satisfied with inpatient care provided in district
hospitals; however, a certain number of elements can significantly
influence their overall satisfaction.
The research questions of the study
In order to achieve the research objectives and check proposed hypotheses the
following research questions were raised:
1. Which elements of quality of healthcare services are highly/lowly
expected by patients who were admitted in district hospitals?
2. Which elements of quality of healthcare services are highly/lowly
perceived by patients admitted in district hospitals?
3. Is there any difference between patients‘ expectations and perceptions on
all dimensions (tangibility, reliability, responsiveness, communication,
empathy, accountability and assurance) of quality of healthcare service
offered by district hospitals?
6
4. Which elements and dimensions of quality of healthcare services showed
the largest/smallest gap between the patients‘ perceptions and expectations?
5. How far do patients‘ expectations and perceptions depend on their
background factors including age, gender, occupation and other factors
such as the number of admissions, length of stay and self reported health
status?
6. Which elements of patients‘ perceptions significantly influence the
patients‘ overall satisfaction?
7. How far does patients‘ satisfaction depend on their background factors
including age, gender, occupation and other factors such as the number of
admissions, length of stay and self reported health status?
8. Is there any relationship between patients‘ overall satisfaction and their
intention on recommendation of hospital to others?
The significance of the study
The current research may help healthcare providers to understand customer‘s
preferences by measuring the service quality through its dimensions. The
hospitals could use this instrument to collect data about their patients‘ perceptions
in order to make strategic decisions.
This research also will share the gathered information with healthcare providers
and stakeholders in health sector as an input for the improvement of perceived
quality of healthcare services offered in the district hospitals of Ulaanbaatar city,
Mongolia.
7
The limitations of the study
-Given the time constraint, the study covered only 3 district hospitals out of 9;
however, they might be good representatives of district hospitals in Ulaanbaatar
city in terms of the socio-economic status of the population in catchment areas.
-The study is mainly based on a quantitative analysis of the results. A qualitative
study such as focus group discussion and individual interview was not conducted
due to the time limitation.
The general structure of the thesis
The thesis consists of seven chapters and the first part of this study, chapter 1,
Introduction of the study, provides a rationale for the study. It also includes the
goal and objectives of the study as well as the research questions. Furthermore,
this chapter explains the limitations and the significance of the research.
Chapter 2, the health system of Mongolia, briefly introduces the current health
system of Mongolia and financing of health system. This information helps with a
better understanding of the context of the study and its purpose.
Chapter 3, Literature review, provides the theories and concepts used by the
researcher as references, tools or models to explain the main issues regarding the
quality of healthcare services. It also provides the conceptual framework of the
study.
Chapter 4, Methodology of the study, explains and describes the methodology
including selection of the study area, sampling, data collection and structure of the
questionnaire.

8
Chapter 5, Results of the study, introduces the results of data analysis.
Chapter 6, Discussion of findings, discusses the findings of the study based on
results of data analysis.
Chapter 7, the last chapter, provides a conclusion to this study and offers
recommendations to help solve the problems identified in the study.
9
CHAPTER TWO
THE HEALTH SYSTEM IN MONGOLIA
This chapter briefly introduces the health system of Mongolia including the current
structure and financing of health system.
Until 1990, Mongolia had a Semashko system1 in which the health system was
fully financed and delivered by the government. Most of the health facilities and
services were maintained from the state budgets and supported by the Soviet Union.
In the early 1990s, the Semashko system was becoming unsustainable because of
the collapse of the Soviet Union and it was obvious that the government was not
able to be fully responsible for the health expenditure by itself. During this process,
the percentage of health expenditure for GDP dramatically decreased from 6.7% in
1990 to 4% in 1992. Moreover, health expenditure per capita decreased from
62.4$ in 1990 to 18.9 $ in 1992. During this period, international organizations and
other donors assisted Mongolia to help compensate for the cease of financial and
social support from the Soviet Union and to establish the current health system of
Mongolia.
The structure of the current health system
Currently, the healthcare service system in Mongolia is characterized by three
levels of healthcare services built on the principle of delivering equitable,
1 A uniform model of organizing health services introduced in CEE/CIS countries after the Second
World War, and abolished in the early 1990s. Financing of health services was entirely through the
state budget, with publicly owned healthcare facilities and publicly provided services. Different
levels of state administration—central, regional, and local—were responsible for planning,
allocation of resources and managing capital expenditures.( Saltman et al., 1998)
10
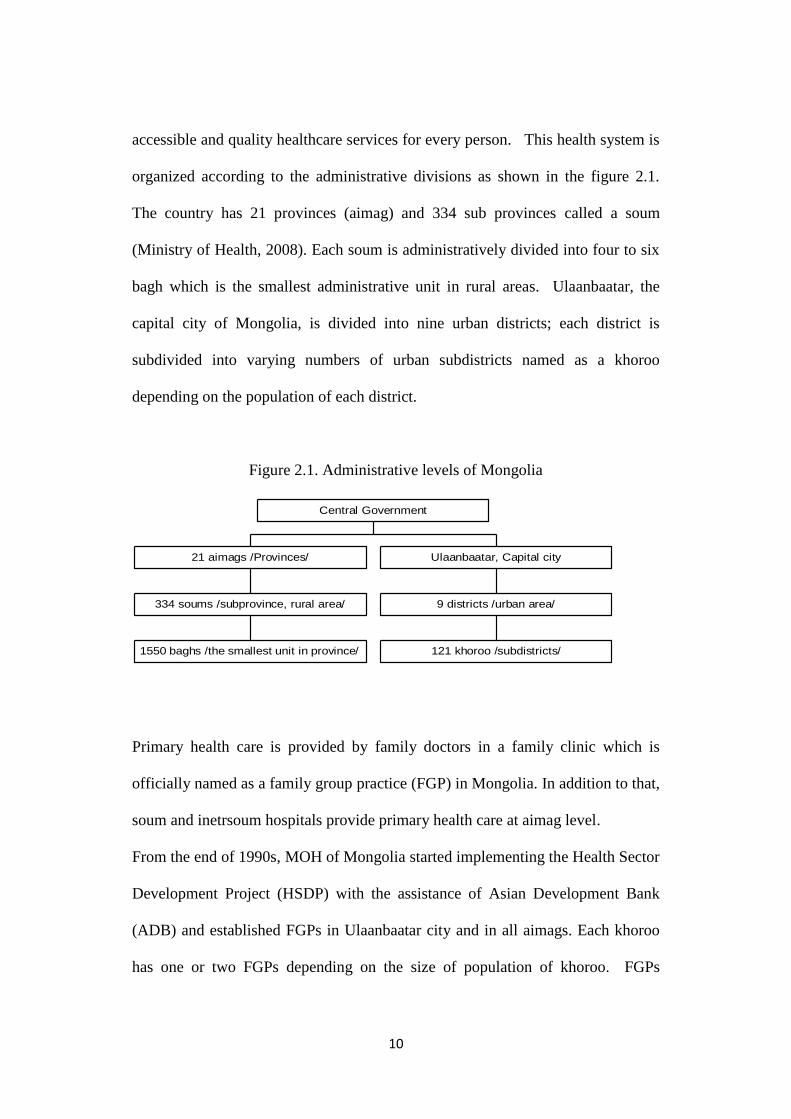
accessible and quality healthcare services for every person. This health system is
organized according to the administrative divisions as shown in the figure 2.1.
The country has 21 provinces (aimag) and 334 sub provinces called a soum
(Ministry of Health, 2008). Each soum is administratively divided into four to six
bagh which is the smallest administrative unit in rural areas. Ulaanbaatar, the
capital city of Mongolia, is divided into nine urban districts; each district is
subdivided into varying numbers of urban subdistricts named as a khoroo
depending on the population of each district.
Figure 2.1. Administrative levels of Mongolia
1550 baghs /the smallest unit in province/
334 soums /subprovince, rural area/
21 aimags /Provinces/
121 khoroo /subdistricts/
9 districts /urban area/
Ulaanbaatar, Capital city
Central Government
Primary health care is provided by family doctors in a family clinic which is
officially named as a family group practice (FGP) in Mongolia. In addition to that,
soum and inetrsoum hospitals provide primary health care at aimag level.
From the end of 1990s, MOH of Mongolia started implementing the Health Sector
Development Project (HSDP) with the assistance of Asian Development Bank
(ADB) and established FGPs in Ulaanbaatar city and in all aimags. Each khoroo
has one or two FGPs depending on the size of population of khoroo. FGPs
11
usually consist of three to six family doctors and totally, as of 2008, there were
228 FGPs, 125 of them provided primary healthcare services to 1,034,700
residents in UB city and 103 served residents of 21 aimag centers. 2142 health
professionals including 794 doctors and 748 nurses and other health workers were
providing primary healthcare to residents in country (Ministry of Health &
National Center for Health Development, 2008). On average, each FGP provides
primary healthcare for 6375 residents and the number of residents per family
doctor ranges from 1200-1500 (Ministry of Health & National Center for Health
Development, 2006). The Ministry of Health set up a package of services called
the essential package of service to be provided at FGPs in 2002 in accordance
with Order N 306 of Minister of Health. The services provided by family
physicians include outpatient exams, antenatal care, the prescription of essential
drugs, counseling, home visits, palliative care and public health activities such as
family planning and health education for population.
They should serve a critical gate-keeping role. As a part of the gate-keeping
function, FGPs is the first contact with health service and they refer patients to the
next higher-level facilities (district hospital) for specialised care. However, there
is a problem of bypassing the FGPs and patients are going to a higher level of
healthcare facilities by themselves.
According to the study of Orgil.B (2003) (as cited in Bolormaa, 2007), the
primary health care utilization by the registered population reached 71-82 percent
in the urban area; however, the effectiveness of primary healthcare is still
problematic.
12
There are some differences between the provision of primary care services in
urban and rural areas in terms of funding, functions and types of provider. Soum
and inetrsoum hospitals are responsible for the provision of primary healthcare in
soum level while in bagh level, services are provided by physician assistants
called feldsher. In rural areas, the population is sparsely distributed over a large
area and therefore, in order to improve access to healthcare services the primary
healthcare facilities (soum and intersoum hospitals) also provide some inpatient
service apart from outpatient service. Soum and intersoum hospitals have an
average of 15-30 beds. The antenatal and postnatal care, normal deliveries, minor
surgeries, and immunization activities are included in services provided by
primary healthcare facilities in rural area.
In aimag level, the FGPs provide primary healthcare.
Generally, the establishment of FGP was the foundation of the development of
sustainable primary healthcare in Mongolia; however, there are still issues
including improvement of the quality of services and reducing the high level of
self referrals to the next higher level of healthcare facilities.
At the secondary level, healthcare is provided by district hospitals in UB city.
There are 9 district hospitals in UB city and the average number of beds in district
hospitals is 225. The district hospitals provide all specialized care through the
outpatient services. They also provide inpatient services for some specialties
including internal medicine, pediatrics, neurology and emergency care. Moreover,
maternity services are delivered by three Maternity hospitals in UB city and are

13
included in the secondary level of health facilities (Ulaanbaatar Health
Department, 2005).
The aimag hospital is the central health facility that provides the aimag population
with secondary healthcare. Aimag general hospitals provide a bigger variety of
services than district hospitals because patients from rural areas are not often able
to commute to the tertiary level health care facilities in UB city.
The structure of the aimag hospital may vary depending on the grading of the
hospital, its staffing and service mix in accordance with the Standards Document
(Bolormaa et al., 2007). Generally, an aimag hospital can have from 105-405 beds
and the average bed occupancy rate is 70.94%. The total number of beds at the
aimag level is 3670 (Ministry of Health & National Center for Health
Development, 2008).
At the tertiary level of healthcare, the group of facilities and institutions provide
tertiary level inpatient and outpatient services, which is advanced specialized
professional care. They are the highest level of referral within the country. A
tertiary level health facility is defined as follows:
“A legal institution to provide country wide tertiary level specialized care,
conduct medical research and training and professional advice to
referring health and related institutions” (Health Care Standards on
Tertiary Level Hospitals MNS 2002 as cited in Bolormaa, 2007).
Generally, a tertiary level health facility can have from 90-662 beds. The bed
occupancy rate in 2008 was 95.63% for tertiary health facilities in UB city. In
14
aimag level, there are three regional diagnostic and treatment centers which are
considered as a tertiary level health facility and provide certain specialized and
professional care.
There is a referral system which was established to link these primary, secondary
and tertiary level facilities. The lower level facility acts as a gatekeeper for a
higher level. In UB city, according to the referral system, the family doctor
should refer patients to district hospitals and from district hospitals the patients
should be referred to the next higher level hospital which is the tertiary level
hospital. According to law, patients have no right to choose district hospitals and
they should be referred to a certain district hospital in accordance with their
residential status. Patients also should be referred to tertiary level hospitals by
doctors working in district hospitals. It means that patients officially have a
limited choice for health institution and service providers; however, it is permitted
by law to make self referral to tertiary level hospital through paying a penalty fee.
In addition, the district hospitals and other three tertiary level hospitals in UB city
provide same inpatient services in internal medicine. Therefore, the anomaly of
law on referral system and the structure of current health system cause a
bypassing of the district hospitals and results in an overload of the tertiary level
healthcare hospitals.
Table 2.1 shows the relationship of the type of healthcare with type of facilities
and referral levels.

15
Table 2.1: Relationship of the Type of Care with Type of Facilities and Referral
Level
Level of
health care
Type of health
care
Type of health organization
Referral level UB City
Province and
sub province
Primary General care FGP
Bagh feldsher post,
FGP, Soum / Inter-
soum hospital
-
Secondary
Specialized
professional
care
Ambulatory and
branches,
District Hospitals
Inter-soum hospitals,
Aimag ambulatory
Aimag hospital,
Referred by
family physician
Tertiary
Advanced
specialized
professional
care
Specialized
hospitals and other
health organizations
Regional Diagnostic
and Treatment Center
Referred from
secondary level
health
organization
Source: Minister‘s order #A/361, 2000 as cited in Bolormaa, 2007.
The financing of health sector in Mongolia
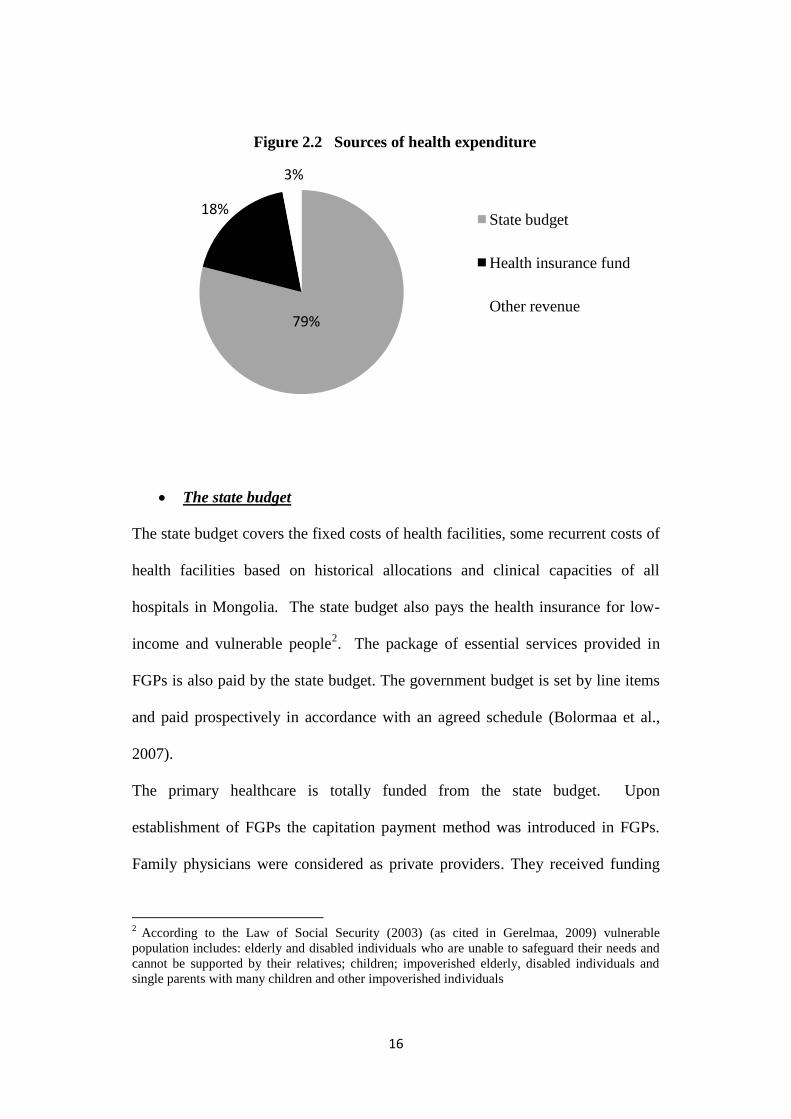
There are four sources of revenue for the health sector: state budget, health
insurance fund, out-of-pocket payments and international aid and loan. As of
2008, 79% of total health expenditure was financed from state budget, 18% from
health insurance fund, 3% from other revenues such as out of pocket expenses and
international loans (See figure 2.2) (Ministry of Health & National Center for
Health Development, 2008).
16
The state budget
The state budget covers the fixed costs of health facilities, some recurrent costs of
health facilities based on historical allocations and clinical capacities of all
hospitals in Mongolia. The state budget also pays the health insurance for low-
income and vulnerable people2. The package of essential services provided in
FGPs is also paid by the state budget. The government budget is set by line items
and paid prospectively in accordance with an agreed schedule (Bolormaa et al.,
2007).
The primary healthcare is totally funded from the state budget. Upon
establishment of FGPs the capitation payment method was introduced in FGPs.
Family physicians were considered as private providers. They received funding
2 According to the Law of Social Security (2003) (as cited in Gerelmaa, 2009) vulnerable
population includes: elderly and disabled individuals who are unable to safeguard their needs and
cannot be supported by their relatives; children; impoverished elderly, disabled individuals and
single parents with many children and other impoverished individuals
79%
18%
3%
Figure 2.2 Sources of health expenditure
State budget
Health insurance fund
Other revenue
17
from the state budget for salaries and operating costs which make up 40 % of their
budget; and health insurance fund on a per capita basis for the number of insured
people in their target area. 60% of their budget comes from the health insurance
fund based on capitation rates.
With the cessation of the support from the ADB soft loan, almost all of the FGPs
are on a deficit due to irregular and untimely funding from the health insurance
fund. Moreover, the health insurance coverage had fallen from 95.3% in 1998 to
77.6% in 2005 and the number of internal migrants who are not officially
registered had increased (State Social Insurance General Office, 2006). Those
unregistered and uninsured people couldn‘t receive health services and many
FGPs faced a financial deficit because of the low rate of health insurance coverage.
Therefore since 2006, according to the amendment to the Health Law, the primary
care services are fully financed from the state budget on the basis of the listed
population in a target area not depending on whether the target population are
insured or not. Unspent funds are transferred back to the state treasury at the end
of the fiscal year.
Social health insurance
After the collapse of the Soviet Union, the financial shortage in the health sector
led to an informal user fee and patients were asked to pay for some medical goods
which should otherwise be free. Such kind of informal payment was a burden for
most people as not all people were able to afford this payment. Thus, there was a
need to find an appropriate way to finance the health system without creating an
18
excessive financial burden on individual households. In this situation, the social
health insurance based on the concept of social solidarity through risk sharing and
fund pooling principles was considered as the solution to this problem
(Bayarsaikhan & Kwon, 2005). As a consequence, health insurance was
introduced as an alternative to the state budget for financing health services in
1994 in order to ensure the sustainable funding for the health sector after cessation
of financial support from the Soviet Union. While the state budget pays a package
of essential services, package of complementary services is funded by the health
insurance fund. The package of complementary services includes all kinds of
inpatient and outpatient services except for some chronic illnesses and infectious
diseases.
Revenue collection for the health insurance fund is based on a certain amount of
contribution from income earning groups. Employees and employers together
should pay a contribution of 6% of the payroll (3% each). The self employed
including herders, students and unemployed are responsible for their own health
insurance and are obliged to pay a monthly flat rate of 50cents. The government is
responsible for the payment of the health insurance of certain groups of people
such as children under 16, pensioners, registered disabled, as well as prisoners and
military personnel. The flat rate for those groups is 0.4 $ per month (Bayarsaikhan
& Kwon, 2005).
The State Social Insurance General Office sets the prospective budget for each
hospital in accordance with calculations which assume that beds set by Ministry
of Health are used at full capacity. In other words, the State Social Insurance

19
General Office calculates a maximum number of inpatient treatments and
multiplies it by a single fixed rate. The single fixed rate varies by health facilities
depending on the level of care. Unspent funds are transferred to the State Social
Insurance General Office at the end of the fiscal year. Therefore, it leads to some
negative results such as an interest in increasing approved beds and unnecessary
admissions.
Outpatient services at hospitals are funded in accordance with the number of
patients rather than the number of visits. It is assumed that each patient visits four
times on average and the total number of visits is divided by four and is multiplied
by outpatient fee per insured person in order to set the budget for outpatient
services (Bolormaa et al., 2007).
As of 2008, the revenue of health insurance fund was 62.6 billion tugrug3. The
expenditure was 53.2 billion tugrug, and surplus was about 15%. (Ministry of
Health & National Center for Health Development, 2008)
Out of pocket expenses
User fees and co-payments used in public health facilities have been officially
permitted since the early 1990s (Bolormaa et al., 2007). All co-payments and user
fees are supposed to be revenue for the health facilities and are considered as
government revenue. Therefore, in the case of co-payments, all reported revenue
is deducted from the health insurance fund. The revenue collected from user fees,
3 Tugrug- official currency of Mongolia. 1US$ = 1372 MNT (Bank of Mongolia, April 2010)
20
other auxiliary activities and secondary income generating activities are deducted
from the state budget (Ministry of Health, 2005).
According to the Health law, 10% of the secondary care level hospital insurance
fee and 15% of tertiary care level hospital insurance fee are charged to patients as
a co-payment.
However, certain groups such as children under 16, high school students under 18,
pensioners, mothers looking after children under the age of two and military
personnel are exempt from co-payments.
21
CHAPTER THREE
LITERATURE REVIEW
This chapter provides the theories and concepts extracted from the literature and
used by the researcher as references to explain the main issues regarding the
quality of healthcare services. It also provides tools or models to assess the quality
of healthcare services.
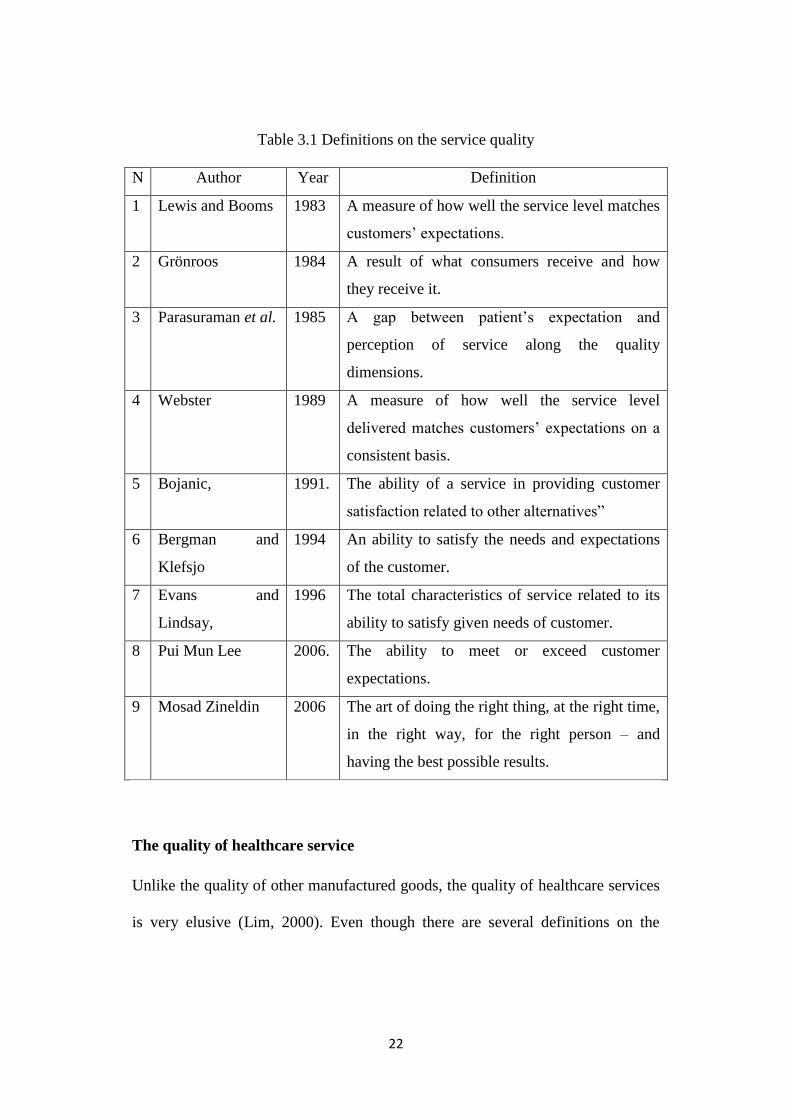
The service quality
There is no single universal definition for the service quality in the literature
(Zineldin, 2006); however, many researchers have defined the service quality in
their own point of view. Several definitions on service quality are shown in table
3.1.
According to their definitions, the service quality seems to be a disconfirmation
paradigm. The outcome of this process might be: negative disconfirmation
(expectations are higher than perceptions), positive disconfirmation (perceptions
are higher than expectations) or confirmation (perceptions are equal to
expectations level) (Sasser at al., 1978; Gummesson & Gronroos, 1988; Brown et
al., 1989; Grönroos, 1990; Parasuraman et al.,1994).
―Expectations‖ are the wants of consumers and their feeling regarding what a
service provider should offer. ―Perceptions‖ refer to the consumers‘ evaluation of
the service and service provider (Parasuraman et al., 1985).
22
Table 3.1 Definitions on the service quality
N Author Year Definition
1 Lewis and Booms 1983 A measure of how well the service level matches
customers‘ expectations.
2 Grönroos 1984 A result of what consumers receive and how
they receive it.
3 Parasuraman et al. 1985 A gap between patient‘s expectation and
perception of service along the quality
dimensions.
4 Webster 1989 A measure of how well the service level
delivered matches customers‘ expectations on a
consistent basis.
5 Bojanic, 1991. The ability of a service in providing customer
satisfaction related to other alternatives‖
6 Bergman and
Klefsjo
1994 An ability to satisfy the needs and expectations
of the customer.
7 Evans and
Lindsay,
1996 The total characteristics of service related to its
ability to satisfy given needs of customer.
8 Pui Mun Lee 2006. The ability to meet or exceed customer
expectations.
9 Mosad Zineldin 2006 The art of doing the right thing, at the right time,
in the right way, for the right person – and
having the best possible results.
The quality of healthcare service
Unlike the quality of other manufactured goods, the quality of healthcare services
is very elusive (Lim, 2000). Even though there are several definitions on the

23
quality of healthcare service in the literature, it is still a complicated and indistinct
concept (Grönroos, 2000).
According to Martinez Fuentes (1999), the quality of healthcare service is a
―multidimensional concept which reflects a judgment about whether services
provided for patients were appropriate and whether the relationship between
doctor and patient was proper‖. The researchers have different opinions on
dimensionality of quality of healthcare services. Parasuraman (1988) indicated
that elements of quality of healthcare services can be divided into five dimensions
including tangible, reliability, responsiveness, empathy and assurance. Some
others mentioned that affordability and accessibility also can be important
dimensions of quality of healthcare services; however, most researchers classify
the elements of quality of healthcare services into different dimensions based on
their own opinion and experience in this field.
There are two approaches towards conceptualization of the quality of healthcare
service. One is the traditional medical approach which focuses on the outcome of
healthcare services and is defined by the point of providers‘ view (what is
provided). Another one is user based approach and emphasizes the process of
healthcare from the patient's perspective (how the service is provided) (Newcome,
1997). In general, the researchers have defined the quality of healthcare service in
terms of the technical aspect and interpersonal care of service (Kane et al., 1997;
Cleary & McNeil, 1988; O‘Connor & Shewchuk, 1989; Li & Collier, 2000;
Sower et al., 2001; Goldstein & Schweikhart, 2002). Accordingly, the quality of
healthcare service is classified as a technical quality and a client quality. In the

24
healthcare sector, the technical quality is also referred to as a clinical or
professional quality while the client quality is an interpersonal care quality.
Institute of Medicine of USA defined the quality of healthcare in terms of
technical aspects as ―the degree to which health services for individuals and
populations increase the likelihood of desired health outcomes and are consistent
with current professional knowledge‖ (McGlynn, 1995) and it is a great consensus
on the definition of quality of healthcare service among healthcare researchers.
Brook and Williams (1975) also defined the technical quality as ―the ability of
hospitals to achieve high standards of patient health through medical diagnosis,
procedures and treatment, and ultimately creating physical or physiological effects
on patients‖. It is essentially ―what‖ the customer receives from the service
provider and how well the diagnostic and therapeutic processes are applied. In
other words, the technical quality includes the competence and clinical skills of
the doctors and nurses, the laboratory technicians‘ expertise in conducting tests
and so on (Tomes and Ng, 1995).
Donabedian (1982) also indicated that the most important aspects of clinical
quality include ―the qualifications of the provider using the proper diagnostic
equipment, and the selection, timing, and sequencing of the medical diagnosis and
treatment‖.
Regarding client quality, there are also many definitions. Brook and Williams
(1975) defined the client quality as ―how‖ service is delivered and the interactive
relationship between the service provider and the patient. This definition is
consistent with the statement by Øvretveit (1992) ―client quality relates to the

25
patients perceptions of the service regarding friendliness of service provider,
timely delivery and information given by service provider, etc‖.
There are three core themes to assess the patient provider interaction: manner,
communication, and relationship. The manner describes the attitude and behavior
of a service provider (Dagger at al., 2007). For example: ―The staffs are
supportive‖ and ―They are caring and they‘re empathetic.‖
Communication reflects the ―interactive nature of the interpersonal process‖
(Wiggers et al., 1990). Communication includes the ―transfer of information
between a provider and a customer and the degree of interaction‖. For instance,
―They have good communication skills‖ and ―They listen to me attentively.‖
The final theme, relationship, refers to the ―closeness and strength of the
relationship developed between a provider and a customer‖ (Beatty et al., 1996).
Zeithaml and Bitner (2000) and Weitzman (1995) suggested that besides the
technical aspects of healthcare and the interpersonal relationship between
healthcare providers and patients, the amenities of care also need to be taken into
account to define the quality of healthcare service. Some others consider that
administrative issues are also important in the assessment of the quality of
healthcare service (Duggirila et al., 2008).
Furthermore, Donabedian (1982) identified three approaches for defining the
quality of health care as structure, process, and outcome, which include both
aspects of technical and client quality. This three element model remains as a gold
standard for defining quality measurement (Harrington & Pigman, 2008).
26
Structural measures are features related to the healthcare setting including its
design, management and procedures (Campbell et al, 2000). Two domains of
structure have been defined: physical and staff characteristics. Physical
characteristics include resources such as personnel, equipment and buildings,
organization of resources and management. Opening hours and the existence of a
booking system for appointment is a part of management. Staff skill-mix and
team working can be included in staff characteristics. For instance, education,
certification, and experience of doctors are part of dimensions of staff
characteristics (Campbell et al, 2000). Generally, healthcare organizations that
have the necessary quantity and quality of human and material resources and other
structural supports are well prepared to deliver health services with good quality
(Campbell et al, 2000).
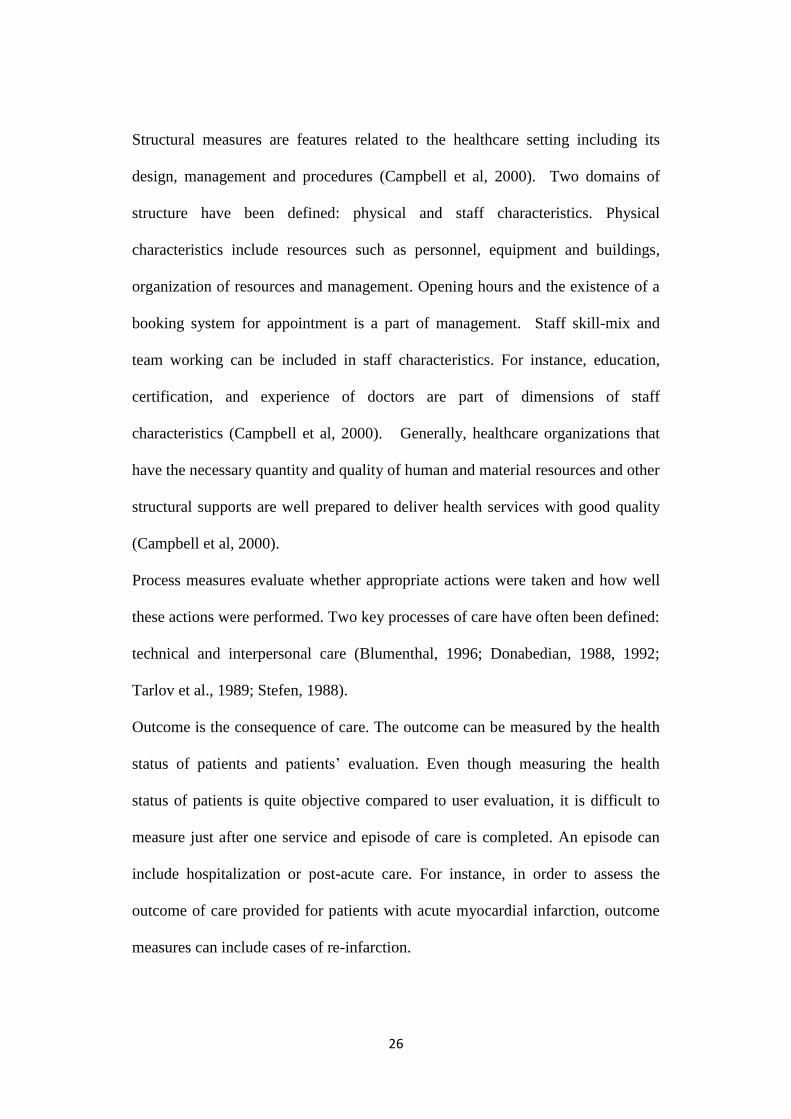
Process measures evaluate whether appropriate actions were taken and how well
these actions were performed. Two key processes of care have often been defined:
technical and interpersonal care (Blumenthal, 1996; Donabedian, 1988, 1992;
Tarlov et al., 1989; Stefen, 1988).
Outcome is the consequence of care. The outcome can be measured by the health
status of patients and patients‘ evaluation. Even though measuring the health
status of patients is quite objective compared to user evaluation, it is difficult to
measure just after one service and episode of care is completed. An episode can
include hospitalization or post-acute care. For instance, in order to assess the
outcome of care provided for patients with acute myocardial infarction, outcome
measures can include cases of re-infarction.
27
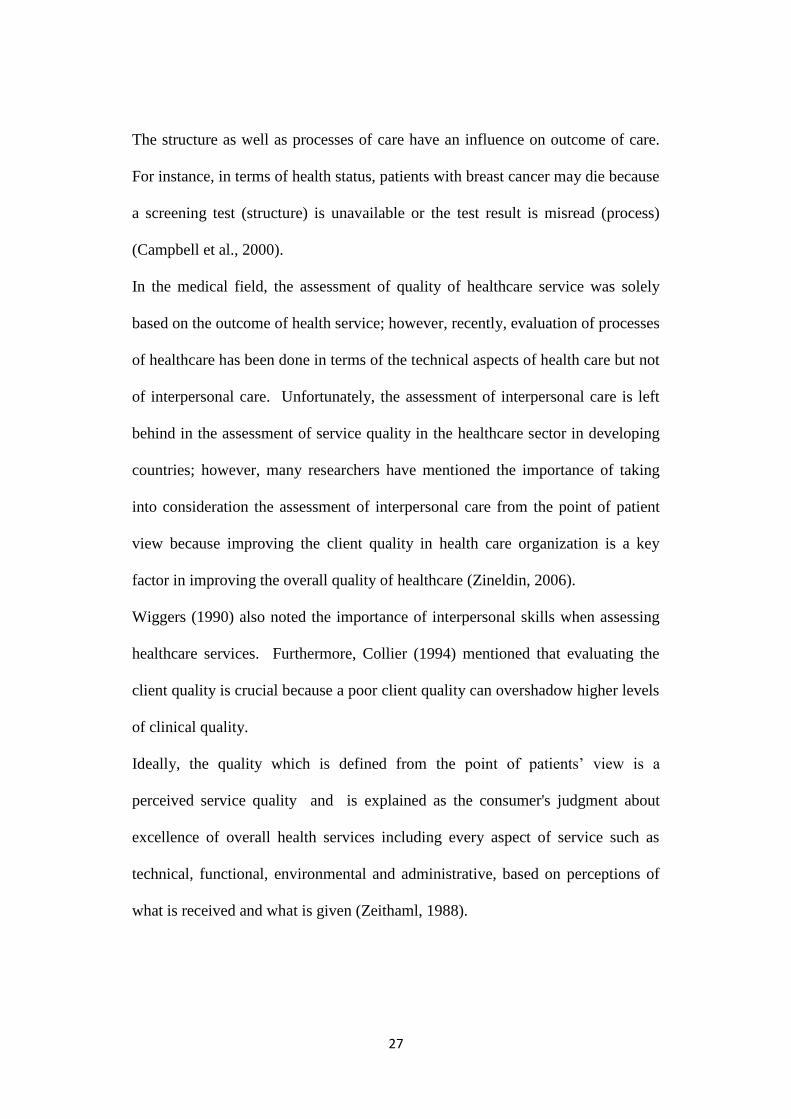
The structure as well as processes of care have an influence on outcome of care.
For instance, in terms of health status, patients with breast cancer may die because
a screening test (structure) is unavailable or the test result is misread (process)
(Campbell et al., 2000).
In the medical field, the assessment of quality of healthcare service was solely
based on the outcome of health service; however, recently, evaluation of processes
of healthcare has been done in terms of the technical aspects of health care but not
of interpersonal care. Unfortunately, the assessment of interpersonal care is left
behind in the assessment of service quality in the healthcare sector in developing
countries; however, many researchers have mentioned the importance of taking
into consideration the assessment of interpersonal care from the point of patient
view because improving the client quality in health care organization is a key
factor in improving the overall quality of healthcare (Zineldin, 2006).
Wiggers (1990) also noted the importance of interpersonal skills when assessing
healthcare services. Furthermore, Collier (1994) mentioned that evaluating the
client quality is crucial because a poor client quality can overshadow higher levels
of clinical quality.
Ideally, the quality which is defined from the point of patients‘ view is a
perceived service quality and is explained as the consumer's judgment about
excellence of overall health services including every aspect of service such as
technical, functional, environmental and administrative, based on perceptions of
what is received and what is given (Zeithaml, 1988).
28
In another word, the perceived service quality can be defined as a difference
between patients‘ expectation and perception on health services including every
aspect of service such as technical, interpersonal, environmental and
administrative (Zeithaml, 1988). However, the technical quality can‘t be evaluated
by patients due to their lack of expertise (Newcome, 1997) in the medical field,
while the client (interpersonal) quality can be assessed by patients.
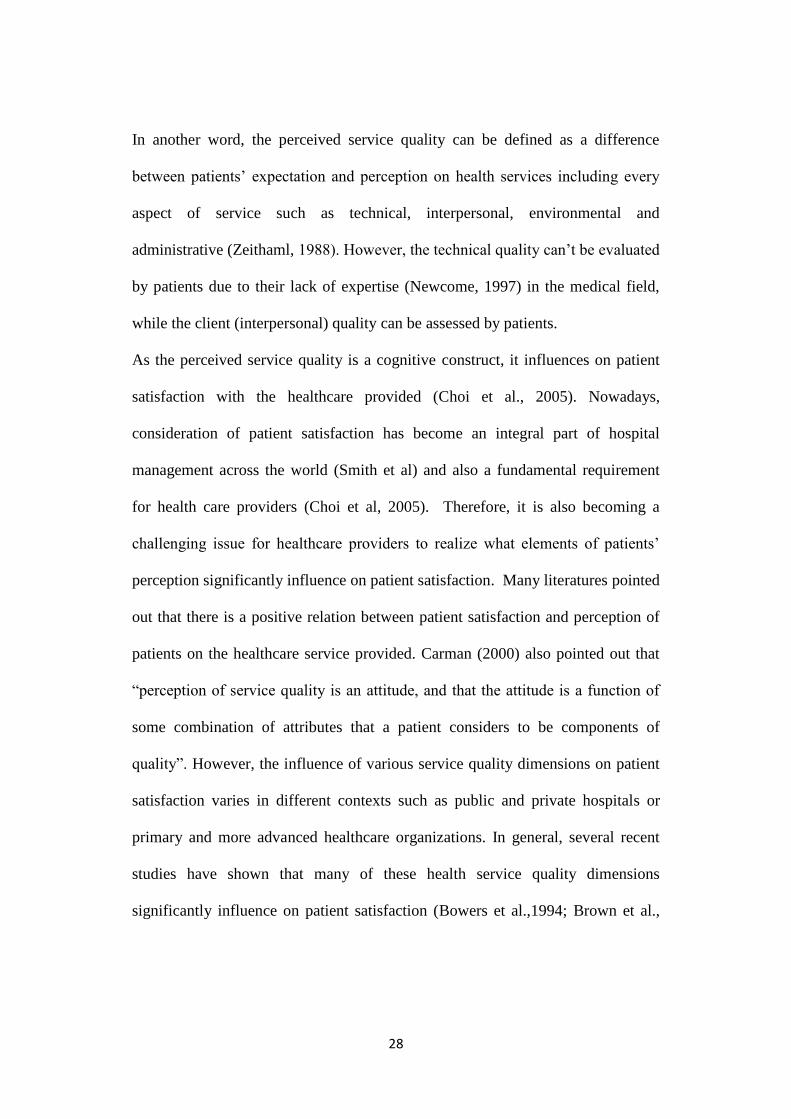
As the perceived service quality is a cognitive construct, it influences on patient
satisfaction with the healthcare provided (Choi et al., 2005). Nowadays,
consideration of patient satisfaction has become an integral part of hospital
management across the world (Smith et al) and also a fundamental requirement
for health care providers (Choi et al, 2005). Therefore, it is also becoming a
challenging issue for healthcare providers to realize what elements of patients‘
perception significantly influence on patient satisfaction. Many literatures pointed
out that there is a positive relation between patient satisfaction and perception of
patients on the healthcare service provided. Carman (2000) also pointed out that
―perception of service quality is an attitude, and that the attitude is a function of
some combination of attributes that a patient considers to be components of
quality‖. However, the influence of various service quality dimensions on patient
satisfaction varies in different contexts such as public and private hospitals or
primary and more advanced healthcare organizations. In general, several recent
studies have shown that many of these health service quality dimensions
significantly influence on patient satisfaction (Bowers et al.,1994; Brown et al.,

29
1989; Gooding, 1995; Reidenbach & Sandifer-Smallwood, 1990; Woodsie &
Shinn, 1989).
Moreover, patient satisfaction has a positive relationship with purchase intentions.
Hall and Dornan (1990) found that satisfied patients earned more medical
recommendations instantly than those who were less satisfied. Accordingly, I
developed the theoretical framework of my study and it is shown in figure 3.1.
Figure 3.1 Theoretical framework
Patient Patient
Perceived quality
Expectation Perceptionof patient of patient
Reliability Empathy Assurance
Patient satisfaction
Behavioral intention of patient
ResponsivenessTangible
Health outcomeBackground characteristics
Technical/Clinical quality Client quality
Quality of healthcare service

30
How to measure the quality of healthcare services?
In the past two decades, the service management literature has focused on the
conceptualization and modeling of perceived service quality and has offered
several tools for its measurement which can be applicable to healthcare services
(Silvestro, 2005).
Several researchers mentioned the necessity and importance of measuring quality
of healthcare services and indicated that the quality of healthcare doesn‘t improve
unless it is measured. It has to be measured to effectively manage healthcare
services (Mejabi & Olujide, 2008).
However, the quality of healthcare service is difficult to evaluate due to its
abstractness, the high degree of intangibility and high professionalism demanded.
On the other hand, patients are quite unique as customers compared to other
customers in different services. They are worried about the outcome of the
treatment and the process of being treated. These characteristics make the
measurement of the quality of healthcare service more complex (Taner and
Antony, 2006). Up to date, two major concerns exist regarding the assessment of
the quality of health care service. First, who will assess the quality and second, on
what criteria? Regarding the first concern, as briefly mentioned previously, the
patients cannot judge the technical competence of the hospital and its staff due to
a lack of expertise in healthcare field (Bopp, 1990). In such cases, patients would
evaluate the technical quality of care in different ways, even if the same services
were delivered to them (Bopp, 1990; Parasuraman, 1994). Øvretveit (1992) also
emphasized that technical quality must be assessed by clinical peers.
31
But the patients can make a judgment on the manner in which medical care is
delivered to them; in short, they can evaluate the client quality of healthcare
(Pendleton, 1984). The assessment of the perception of patients is part of an
approach to improve the quality of healthcare (Smith, 2001). In another word,
the patients‘ evaluation can be utilized to evaluate and continuously monitor
quality by focusing on the weaker aspects of the healthcare delivery system.
However, in recent years the patient perceptions are increasingly used to measure
the quality of healthcare services. In reality, the healthcare sector has been slow to
move from a provider-based approach to user-based approach to assess the quality
of healthcare services. As a consequence, service providers and researchers are
trying to implement meaningful customer-oriented quality assessment measures
(Michael et al., 2001; Murfin et al., 1995).
Many researchers have emphasized the importance of patients‘ perspective in
assessing the quality of healthcare; however, some object that patients can be
good judges of quality. According to O‘Connor (1994), ‗‗It‘s the patient‘s
perspective that increasingly is being viewed as a meaningful indicator of health
services quality and may, in fact, represent the most important perspective‘‘.
Moreover, Peterson (1988) indicated that it is not important whether patients are
right or wrong; what is the most important in assessing the quality of health care
is how patients felt about the service provided.
Some authors stated that the quality of healthcare can be most effectively
evaluated by observation and interview with patients during the process of service
delivery (Harrington, 2008). Donabedian also mentioned that from the point of
32
user evaluation, patients can evaluate interpersonal care/process/ and some
structural elements.
Obtaining patient perceptions may also be less expensive (Davies, 1988) and more
reliable than other methods of assessing quality, such as physician peer review
(Brook & Appel, 1973) and it does not depend on the completeness of medical
records, which rarely capture information on inter personal aspects of care or the
health status (Davies, 1988). Therefore, patients can evaluate the quality of
healthcare services in terms of interpersonal aspects of quality.
Regarding the second concern on criteria to evaluate the quality of health care,
the quality of medical care has traditionally been measured using objective criteria
such as mortality and morbidity. Therefore, quality was defined by only clinicians
in terms of the technical delivery of care (Dagger et al., 2007). Criteria to evaluate
the technical quality of care can be standard guidelines on diagnosis and treatment.
Concerning the criteria to evaluate client quality, there is no universal criteria and
many researchers are struggling to establish criteria to evaluate
client/interpersonal quality.
In 1985, Parasuraman proposed the SERVQUAL (SERVICE QUALITY)
instrument which was later refined in 1988 and was reviewed in 1991 to evaluate
the perceived quality of healthcare services. It has been extensively accepted and
utilized as a generic instrument that captures the multidimensionality of healthcare
service quality.
Since it was developed, the SERVQUAL model has been used in numerous
studies across different countries such as in the USA (Babakus & Mangold, 1992),

33
Hong Kong (Lam, 1997), Spain (Fuentes, 1999), Singapore (Lim & Nelson, 2000),
UEA (Jabnoun & Chaker, 2003), Malaysia (Sohail, 2003) and in Egypt (Mostafa,
2005) even though all dimensions of this model originally haven‘t been referred in
all studies. Many researchers expanded and adapted this model in accordance
with their own situation and system; and evaluated the quality of healthcare in
various health settings in different countries.
SERVQUAL instrument
SERVQUAL is an instrument ―for assessing customer perceptions and
expectations of service quality in service organizations. In short, it is based on the
gap measures of expectation and perception of patients regarding the quality of
health care services (Parasuraman et al., 1988).
Perhaps it is the most widely tested and evaluated instrument for the generic
measurement of perceived quality (Davies et al., 1999). This instrument was
frequently applied in for-profit services in developed countries. However, a
number of researchers have evaluated the quality of health care using this tool in
public hospitals. Babakus and Mangold (1992) and Taylor and Cronin (1994)
tested the SERVQUAL in healthcare services and concluded these dimensions
were appropriate and transferable to hospital services, although Taylor and Cronin
commented that health service managers should adapt the SERVQUAL model in
accordance with their own environments rather than automatically adopt it.
Youssef (1996) and Curry & Sinclair (2002), who empirically tested the
34
SERVQUAL model in UK hospitals, also mentioned that this survey instrument
was broadly transferable to health services in both public and private sector.
Exploratory research conducted in 1985 showed that clients judge the service
quality by using this instrument regardless of type of service, even though the
importance of dimensions varies from service to service (Luke, 2007).
The SERVQUAL instrument consists of 22 pairs of statements that measure
consumer‘s expectations and perceptions of service performance; and these
statements are loaded into 5 dimensions of service quality including reliability,
responsiveness, assurance, empathy and tangibles.
Reliability is the ability to perform the promised service accurately and
dependably. It means that the service is accomplished on time without any errors
(Parasuraman, 1991).
Responsiveness is the willingness to assist patients and provide prompt service
(Parasuraman, 1991). Keeping customers waiting with no apparent reason can
create a low perception of quality.
Assurance is the ability to be knowledgeable, to show courtesy and to convey
trust and confidence (Parasuraman, 1991). It includes the following features:
competence to perform service, politeness and respect for customers and effective
communication with the customer.
Empathy is provision of care and the ability to show compassion towards
customers. It includes approachability, sensitivity, and understanding patients‘
needs (Parasuraman, 1991).

35
Tangibles refer to the appearance of physical facilities, equipment, personnel and
communication materials. The conditions of physical surroundings such as
cleanliness and noisiness are also tangible features of care (Parasuraman, 1991).
Parasuraman (1988) used these five dimensions to form an assessment of service
quality based on the comparison between expected and perceived services.
The evaluation of these 22 statements is expressed using a 7 point Likert scale,
labeled from ―Strongly Disagree‖ (value 1) to ―Strongly Agree‖ (value 7). The
score for the quality of service is calculated by computing the difference between
perception and expectation scores. Consequently, the gap score (difference
between perception and expectations) results in a value ranging from -6 (lowest
quality) to +6 (highest quality).
By summing the gap scores for each of the items, the perceived service quality is
measured by the following equation:
22
Q=∑ (Px-Ex) /22
x=1
Where: Q – is the perceived service quality; and Px and Ex – are ratings
corresponding to perception and expectations of the ―x‖ statement (Parasuraman
et al., 1985)
Although the SERVQUAL instrument has faced many critics, several authors
(Rohini & Mahadevappa, 2006) listed the advantages of SERVQUAL as follows:
It is accepted as a standard for assessing different dimensions of service
quality.

36
It has been shown to be valid for a number of service situations.
It has been known to be reliable.
The instrument is parsimonious in that it has a limited number of items.
This means that customers and employers can fill it out quickly.
It has a standardized analysis procedure to aid interpretation and results.
Despite its critics, the SERVQUAL has been widely used in many service
industries including hotels, travel agencies, higher education, real states,
accountancy, architecture, construction services, hospitals, dentistry, call centers
(Foster, 2001).
Therefore, I decided to use this instrument for my study.

37
CHAPTER 4
METHODOLOGY OF THE STUDY
This chapter explains the methodology for this research, including the research
design, rationale for the sample selection, sampling method, and the process of
data collection and the structure of the questionnaire.
Research design
This study is designed as a cross sectional and quantitative study. The research is
done by following steps:
o Studying the current situation of Mongolian health system especially
regarding hospital system
o Defining research goals and objectives
o Reviewing literature in similar fields
o Defining the research method
o Developing the questionnaire
o Conducting a pilot study to test the comprehensibility of the questionnaire
o Refining the questionnaire based on the results of the pilot study
o Interviewing patients
o Entering and analyzing data
o Drawing conclusions
38
The study area
The study covered three district hospitals which are Chingeltei District Hospital,
Sukhbaatar District Hospital and Bayanzurkh District Hospital.
Sampling and data collection
In the framework of this study, only primary data were collected from in-patients
of the three previously mentioned district hospitals between 1 August, 2009 and 1
November, 2009. The data collectors visited the hospitals with an interval of ten
days in order to fill questionnaires from newly admitted patients because the
average length of stay in the district hospital is 9-10 days (Ministry of Mongolia,
2007). Totally, each hospital took 9 days of data collection work and the in-
patients were individually asked to answer the questionnaires. During each visit,
patients were randomly chosen to participate in the study from the list of patients.
The number of patients was divided into groups which consisted of five patients
and every 5th
patient of each group was asked to participate in the study. In cases
in which the approached patients were not interested in participating in the study,
the data collectors moved to the next patient according to our method. Due to the
time constraints, it was not possible to interview more than 6 or 7 patients per day.
Patients eligible for responding to the questionnaires were adults between 18-75
years old, who stayed more than 3 days in hospital and were admitted in the
department of internal medicine and neurology. The questionnaire consisted of
29 questions which were divided into 5 dimensions. My plan was to include a
sample of approximately 155 patients, given an alpha error rate of 0.05, power of
39
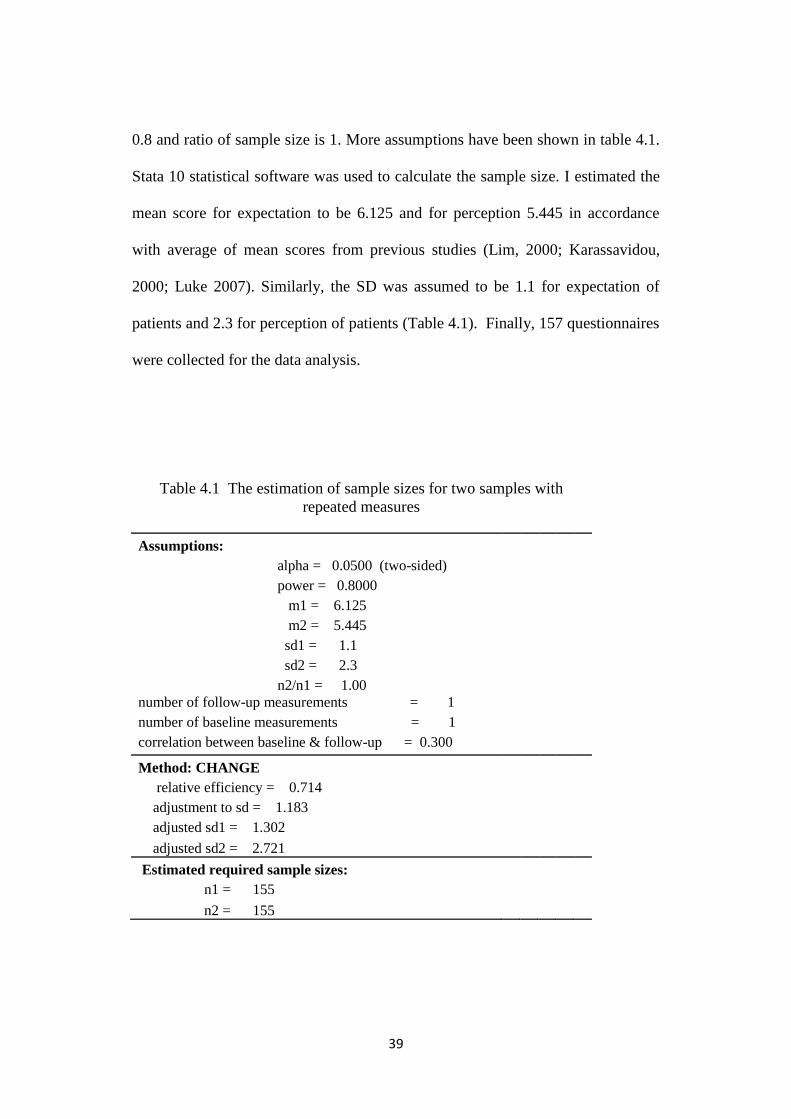
0.8 and ratio of sample size is 1. More assumptions have been shown in table 4.1.
Stata 10 statistical software was used to calculate the sample size. I estimated the
mean score for expectation to be 6.125 and for perception 5.445 in accordance
with average of mean scores from previous studies (Lim, 2000; Karassavidou,
2000; Luke 2007). Similarly, the SD was assumed to be 1.1 for expectation of
patients and 2.3 for perception of patients (Table 4.1). Finally, 157 questionnaires
were collected for the data analysis.
Table 4.1 The estimation of sample sizes for two samples with
repeated measures
Assumptions:
alpha = 0.0500 (two-sided)
power = 0.8000
m1 = 6.125
m2 = 5.445
sd1 = 1.1
sd2 = 2.3
n2/n1 = 1.00
number of follow-up measurements = 1
number of baseline measurements = 1
correlation between baseline & follow-up = 0.300
Method: CHANGE
relative efficiency = 0.714
adjustment to sd = 1.183
adjusted sd1 = 1.302
adjusted sd2 = 2.721
Estimated required sample sizes:
n1 = 155
n2 = 155
40
The validity and reliability of questionnaire
The SERVQUAL questionnaire was used in this study. The preliminary study was
conducted and the original standard SERVQUAL questionnaire with 22 questions
was used in order to clarify how understandable the questionnaire was and how it
would be answered by patients. 29 patients participated in the preliminary study
and there were several questions which made patients confused. Therefore,
according to the patients‘ suggestion it was decided to adapt it to the current
situation and 29 questions allocated into 5 dimensions were used in my study.
(See Appendix).
In order to assess the discriminant validity of dimensionality of the instrument
used to measure the perceived quality of healthcare services, the data was
subjected to exploratory factor analysis. The data used for the factor analysis was
the expected values of the hospital service quality because the dimensionality of
the quality of service should be based on what customers expect but not what
customers perceive (Luke, 2007).
Prior to presenting the result of factor analysis, the factorability of variables was
checked using the Bartlett‘s test of sphericity. The Bartlett‘s test of sphericity
showed that the variables could be grouped into certain factors/dimensions. (Chi
square 2380.179, df=406, and p<0.001). KMO (Kaiser-Meyer-Olkin) value was
0.718 and it indicated that the degree of common variance among the 29 variables
is middling. (see table 4.2)

41
Table 4.2. KMO and Bartlett's Test
Kaiser-Meyer-Olkin Measure of Sampling Adequacy. .718
Bartlett's Test of Sphericity Approx. Chi-Square 2380.179
df 406
Sig. .000
In the initial solution of factor analysis, each variable is standardized to have a
mean of 0.0 and a standard deviation of 1.0. Thus the variance of each variable is
equal to 1.0 and the total variance to be explained is 29 referring to the number of
questions. Since a single variable can account for 1.0 unit of variance, a useful
factor must account for more than 1.0 unit of variance, or have an eigenvalue
1.0, otherwise the factor extracted explains no more variance than a single
variable. Interestingly, in this study, several variables loaded heavily into different
factors from the prior dimensions proposed by Parasuramen (1988). As shown in
table 4.3, variables are loaded into 7 factors and eigenvalue is between 1.393
and 4.994 for 7 factors/dimensions which are extracted after factor analysis. After
varimax rotation, eigenvalue ranged from 1.649 to 3.383. In other words, the
factor pattern was not heavily changed when data was rotated. Therefore, the
dimensionality of variables into 7 factors could be considered as valid.
The cumulative percentage of variance extracted by the 7 factors was 60.712%.
Total variance explained (60.712%) by these seven components exceeds the 60%
threshold usually accepted in social sciences to support the solution (Hair et al.,
1995).
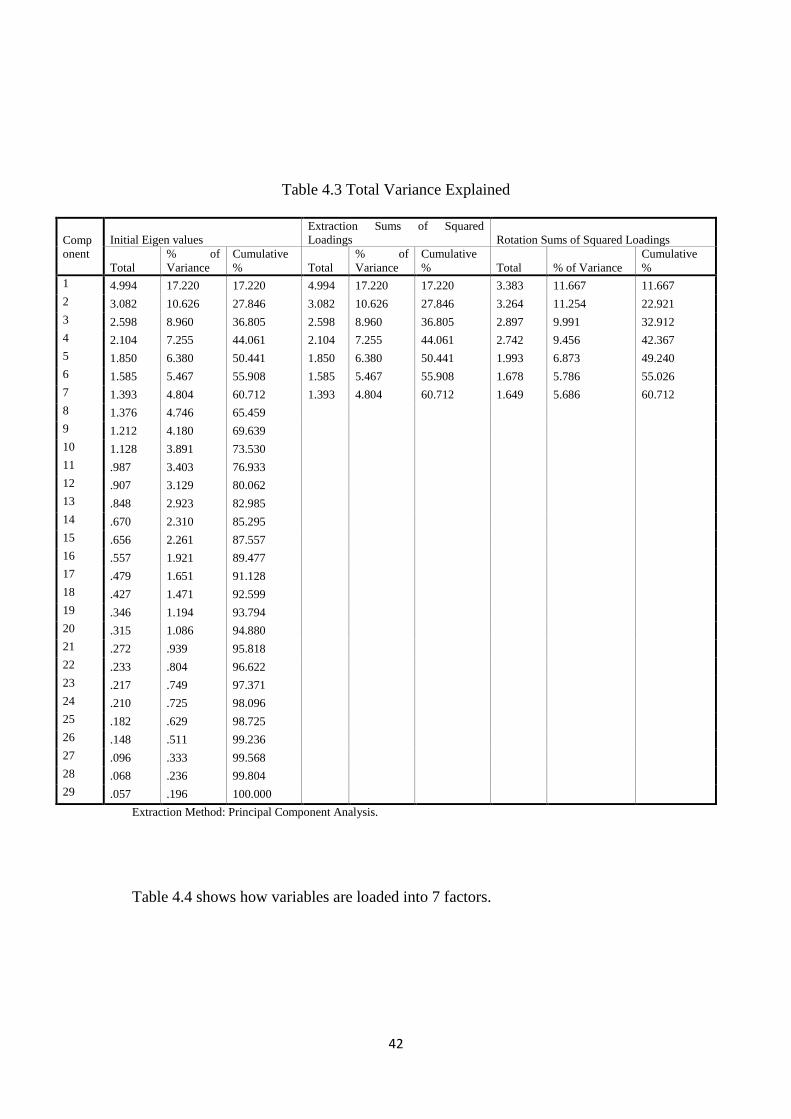
42
Table 4.3 Total Variance Explained
Comp
onent
Initial Eigen values
Extraction Sums of Squared
Loadings Rotation Sums of Squared Loadings
Total
% of
Variance
Cumulative
% Total
% of
Variance
Cumulative
% Total % of Variance
Cumulative
%
1 4.994 17.220 17.220 4.994 17.220 17.220 3.383 11.667 11.667
2 3.082 10.626 27.846 3.082 10.626 27.846 3.264 11.254 22.921
3 2.598 8.960 36.805 2.598 8.960 36.805 2.897 9.991 32.912
4 2.104 7.255 44.061 2.104 7.255 44.061 2.742 9.456 42.367
5 1.850 6.380 50.441 1.850 6.380 50.441 1.993 6.873 49.240
6 1.585 5.467 55.908 1.585 5.467 55.908 1.678 5.786 55.026
7 1.393 4.804 60.712 1.393 4.804 60.712 1.649 5.686 60.712
8 1.376 4.746 65.459
9 1.212 4.180 69.639
10 1.128 3.891 73.530
11 .987 3.403 76.933
12 .907 3.129 80.062
13 .848 2.923 82.985
14 .670 2.310 85.295
15 .656 2.261 87.557
16 .557 1.921 89.477
17 .479 1.651 91.128
18 .427 1.471 92.599
19 .346 1.194 93.794
20 .315 1.086 94.880
21 .272 .939 95.818
22 .233 .804 96.622
23 .217 .749 97.371
24 .210 .725 98.096
25 .182 .629 98.725
26 .148 .511 99.236
27 .096 .333 99.568
28 .068 .236 99.804
29 .057 .196 100.000
Extraction Method: Principal Component Analysis.
Table 4.4 shows how variables are loaded into 7 factors.

43
Table 4.4 Rotated Component Matrix
Component
1 2 3 4 5 6 7
E1 .666 .041 .137 -.062 .050 .051 .008
E2 .818 -.096 .131 -.063 -.020 -.188 .017
E3 .765 .161 .043 .130 -.044 -.046 -.026
E4 .854 .216 -.149 .033 -.061 -.010 .084
E5 .841 .109 -.009 .100 .017 .146 .110
E6 .038 .035 .030 -.134 .928 .013 .095
E7 -.004 -.007 .036 -.138 .940 -.031 .087
E8 .114 .901 .021 .157 -.006 -.063 -.021
E9 .149 .870 -.028 .108 .003 -.086 -.052
E10 .144 .233 -.112 .126 .045 .398 -.115
E11 .162 .118 .458 .070 -.083 .164 -.017
E12 -.218 .017 .610 .058 .012 .061 .234
E13 .026 .278 .056 .548 .135 .051 -.191
E14 -.038 -.020 .064 .699 -.203 .042 .019
E15 .004 .205 .447 .192 .063 -.080 -.184
E16 .094 .071 .853 .046 .052 -.081 -.033
E17 .081 -.065 .060 -.022 .134 -.118 .818
E18 .082 .169 -.030 -.065 .072 .009 .865
E19 -.065 -.190 .005 -.011 -.015 .798 -.004
E20 -.036 -.131 .081 -.084 .042 .809 -.027
E21 -.093 .065 .228 .798 .026 .069 -.032
E22 .092 -.152 -.274 .638 .045 -.102 -.047
E23 .123 .758 .362 .028 -.033 -.109 .108
E24 .038 .781 .346 .056 -.075 -.012 .154
E25 .022 .145 -.268 .308 .035 -.118 -.039
E26 .050 .139 .281 .656 -.172 -.013 .089
E27 .166 .162 .246 .408 -.082 .037 .011
E28 -.110 -.156 -.095 .160 .302 .192 .047
E29 .110 .126 .834 .072 -.005 -.114 .006
Extraction Method: Principal Component Analysis.
Rotation Method: Varimax with Kaiser Normalization.
a Rotation converged in 6 iterations.
In order to make it more visible, it is described in table 4.5 in accordance with
factors.

44
Table 4.5. Factor loading
Factors
Variables 1 2 3 4 5 6 7
E1 .666
E2 .818
E3 .765
E4 .854
E5 .841
E8
.901
E9
.870
E23
.758
E24
.781
E11
.458
E12
.610
E15
.447
E16
.853
E29
.834
E13
.548
E14
.699
E21
.798
E22
.638
E25
.308
E26
E27
.656
.408
E6
E7
E28
.928
.940
.302
E10
E19
E20
.398
.798
.809
E17
.818
E18
.865
Cronbach
alpha 0.849 0.896 0.724 0.703 0.720
0.760
0.7
Extraction method: Principle Component Analysis (N=157)
45
Cronbach alpha for each factor was greater than 0.7 and it indicates that all 7
dimensions are reliable. Since all variables are loaded into 7 dimensions/factors, I
named them based on the statements loaded into factors.
Factor 1 –Tangibility
E1. DH should have up to date and well maintained equipment
E2. Cleanliness and hygiene in district hospitals should be excellent
E3. The nurses and doctors should be clean and well-groomed.
E4. The DH should thoroughly provide information on hospital service
E5. The patient room should be comfortable enough
The first factor, which explained 11.7% of the total variance, was labeled - the
tangibility of the healthcare service quality. Factor 1 contains 5 items the same as
in original questionnaire.
Factor 2- Communication
E8. Doctors should explain to patients about their health conditions, diagnosis and
treatment in an understandable way.
E9. Nurses should explain to patients exactly when and what they are going to do.
E23. Doctors should have good knowledge to answer patient‘s questions
E24. Nurses should have good knowledge to answer patient‘s questions
The second factor explained 11.3% of the total variation and was labeled –
communication factor. This factor includes 4 items and these 4 variables loaded
differently from our original questionnaire. The question 8 and 9 can reflect the

46
communication between patients and doctors. Moreover, having good knowledge
to answer patients‘ questions greatly influences good communication between
them.
Factor 3 – Responsiveness
E11- Doctors should respond immediately when called by patients.
E12. Nurses should respond immediately when called by patients
E15. Waiting time for admission shouldn‘t be so long /more than a week/
E16. Waiting time for daily service shouldn‘t be so long /more than 45 min/
E29. Operating hours in district hospital should be convenient to patients.
The third factor explained 10% of total variance and was labeled as
responsiveness factor. It includes 5 items and 4 of them except question 29 were
included in responsiveness factor in our initial questionnaire. However, item 29
can reflect the good responsiveness of service if customers can have the wanted
service in time.
Factor 4 – Empathy
E13. Doctors should be willing to help patients
E14. Nurses should be willing to help patients.
E21. Doctors should be respectful to patients
E22. Nurses should be respectful to patients
E25. Nurses in district hospital should be caring
E26. Doctors in district hospital should listen to patients attentively

47
E27. Nurses in district hospital should listen to patients attentively
The forth factor explained 9.4% of total variance and was labeled as empathy
factor. It includes 7 items and even though variables reflecting the empathy factor
were loaded with responsiveness variables proposed by Parasuraman (1988), this
loading deemed to make sense: being helpful for patients and respecting patients
are also ways in which patients want compassion from doctors and nurses towards
them.
Factor 5- Reliability
E6. DH should provide treatment, diagnostic tests and other services in a certain
time
E7. When patient has a problem, DH should show sincere interest to solve it.
E28. Doctors should spend enough time for patients.
The fifth factor explained 6.9% of total variance and was labeled as reliability
factor. It includes 3 items and item 28 also loaded differently from initial
dimensionality, however, it makes sense that if doctors spend enough time for
patients then doctors may deem more dependable. Therefore, it might also be a
reliability factor.
Factor 6- Accountability
E10. Doctors should monitor your health status regularly/daily.
E19. Patients should feel confident when receiving medical treatment.
E20. District hospitals should provide privacy during treatment.

48
The sixth factor explained 5.8% of total variance and was labeled as
accountability factor. It includes 3 items.
Factor 7 –Assurance
E17. Doctors should be competent
E18. Nurses should be skillful
The last, seventh, factor explained 5.7% of total variance and was labeled as
assurance factor. It includes 2 items.
According to this factor loading, I considered that it makes sense to load all
variables into the 7 dimensions which I named and the value of the alpha
coefficient ranged from .700 to .896 ( alpha > .70, see Table 4.5 ) indicating that
these seven dimensions are reliable measures of service quality (Nunnaly, 1978).
The full questionnaire was reliable for analyzing data considering Cronbach's
Alpha=0.759.
The validity of the dimensionality of these groups supports the suggestions made
by Barakus and Boller (1992) and Cronin and Taylor (1992) that the dimensions
of SERVQUAL may depend on the type of the industry being studied even
though the questionnaire was adapted in current situation. Therefore, it was
decided to keep these dimensions and analyze the data accordingly.
49
CHAPTER FIVE
THE RESULTS OF THE STUDY
This chapter introduces the results of the study and is divided into the following
parts:
5.1 Description of the sample
5.2 The analysis of SERVQUAL instrument
5.3 The analysis of patients‘ overall satisfaction in relation to their perception
of patients regarding healthcare services offered at district hospitals.
5.1 Description of the sample
Totally 157 patients who had been admitted in 3 district hospitals, namely
Chingeltei, Bayanzurkh and Sukhbaatar, in Ulaanbaatar city between August-
November, 2009 were involved in this study.
Gender: Distribution of respondents by gender shows that females make up 54.8
per cent (86 patients) and males make up 45.2 (71 patients) percent of all
participants.
Age: 14 percent of participants were between 20-30 years old, 22.9 percent were
between 31-40, 23.6 were 41-50, 25.5 were 51-60, 8.3 were 61-70 and 5.7 percent
were older than 71 years old.

50
The figure 5.1 shows the age structure of participants of the study.
Figure 5.1 Age structure of the participants (by percent)
Education level: 80 (51%) of all participants had high school education and the
rest of participants had college or university education (Table 5.1).
Occupational status: Of all participants, 5 patients (3.2%) were university student,
72 /45.9%/ patients worked in either the public or private sector and 80
participants /51%/ were either unemployed or retired (Table 5.2).
Table 5.1 Education level of participants
Education level Number of patients
High school 80 /51%/
College 11 /7%/
University 66 /42%/
Total 157 /100%/
14
22.9 23.625.5
8.35.7
0
5
10
15
20
25
30
20-30 31-40 41-50 51-60 61-70 71 and over
Per
cent
Age group
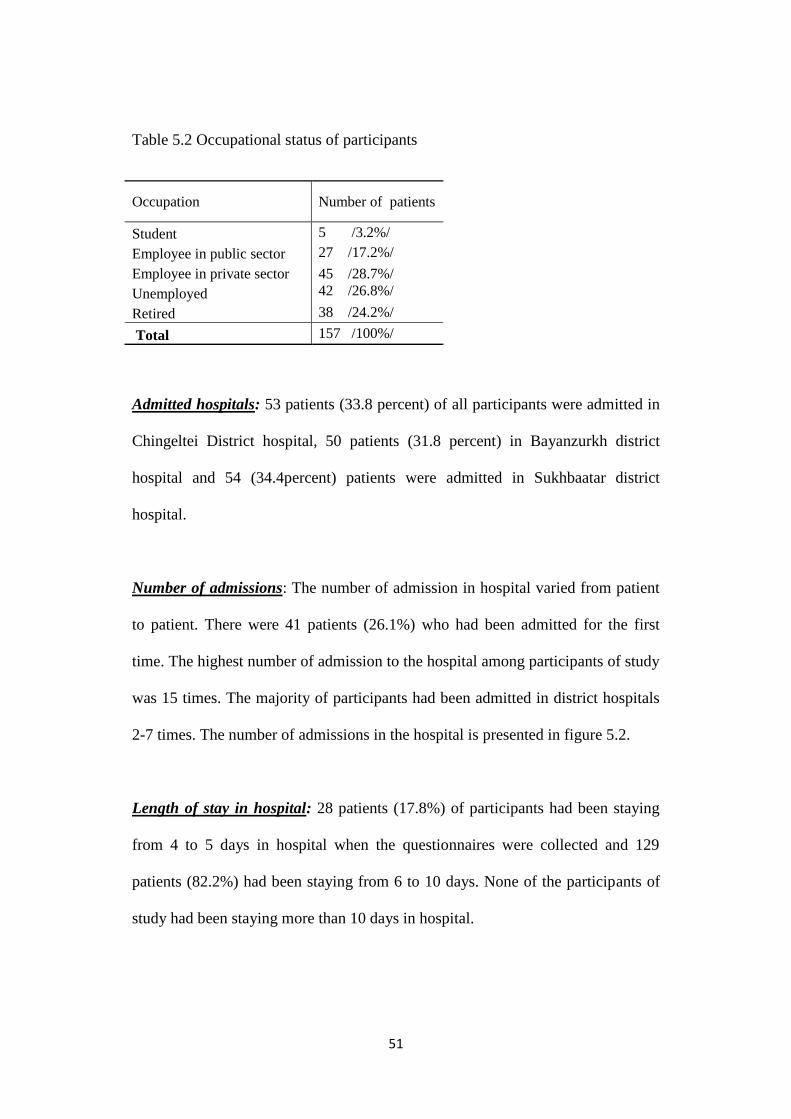
51
Table 5.2 Occupational status of participants
Occupation Number of patients
Student 5 /3.2%/
Employee in public sector 27 /17.2%/
Employee in private sector 45 /28.7%/
42 /26.8%/ Unemployed
Retired 38 /24.2%/
Total 157 /100%/
Admitted hospitals: 53 patients (33.8 percent) of all participants were admitted in
Chingeltei District hospital, 50 patients (31.8 percent) in Bayanzurkh district
hospital and 54 (34.4percent) patients were admitted in Sukhbaatar district
hospital.
Number of admissions: The number of admission in hospital varied from patient
to patient. There were 41 patients (26.1%) who had been admitted for the first
time. The highest number of admission to the hospital among participants of study
was 15 times. The majority of participants had been admitted in district hospitals
2-7 times. The number of admissions in the hospital is presented in figure 5.2.
Length of stay in hospital: 28 patients (17.8%) of participants had been staying
from 4 to 5 days in hospital when the questionnaires were collected and 129
patients (82.2%) had been staying from 6 to 10 days. None of the participants of
study had been staying more than 10 days in hospital.
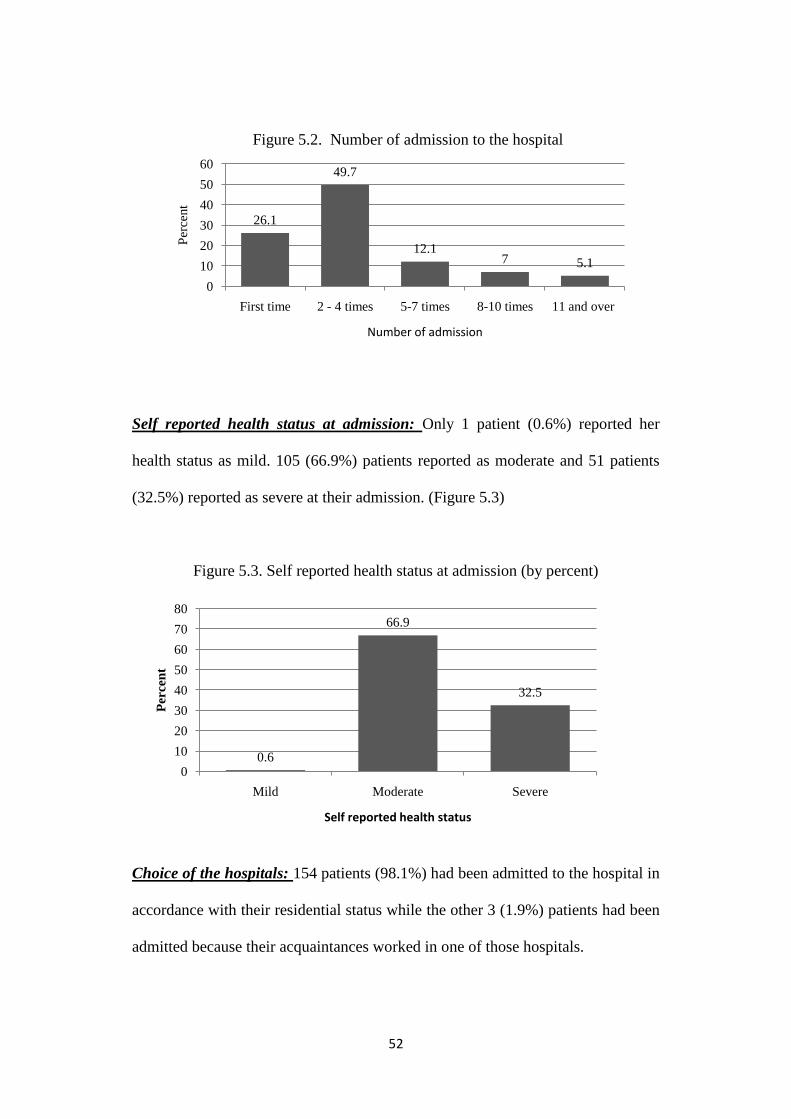
52
Figure 5.2. Number of admission to the hospital
Self reported health status at admission: Only 1 patient (0.6%) reported her
health status as mild. 105 (66.9%) patients reported as moderate and 51 patients
(32.5%) reported as severe at their admission. (Figure 5.3)
Figure 5.3. Self reported health status at admission (by percent)
Choice of the hospitals: 154 patients (98.1%) had been admitted to the hospital in
accordance with their residential status while the other 3 (1.9%) patients had been
admitted because their acquaintances worked in one of those hospitals.
26.1
49.7
12.17 5.1
0
10
20
30
40
50
60
First time 2 - 4 times 5-7 times 8-10 times 11 and over
Per
cent
Number of admission
0.6
66.9
32.5
0
10
20
30
40
50
60
70
80
Mild Moderate Severe
Per
cen
t
Self reported health status
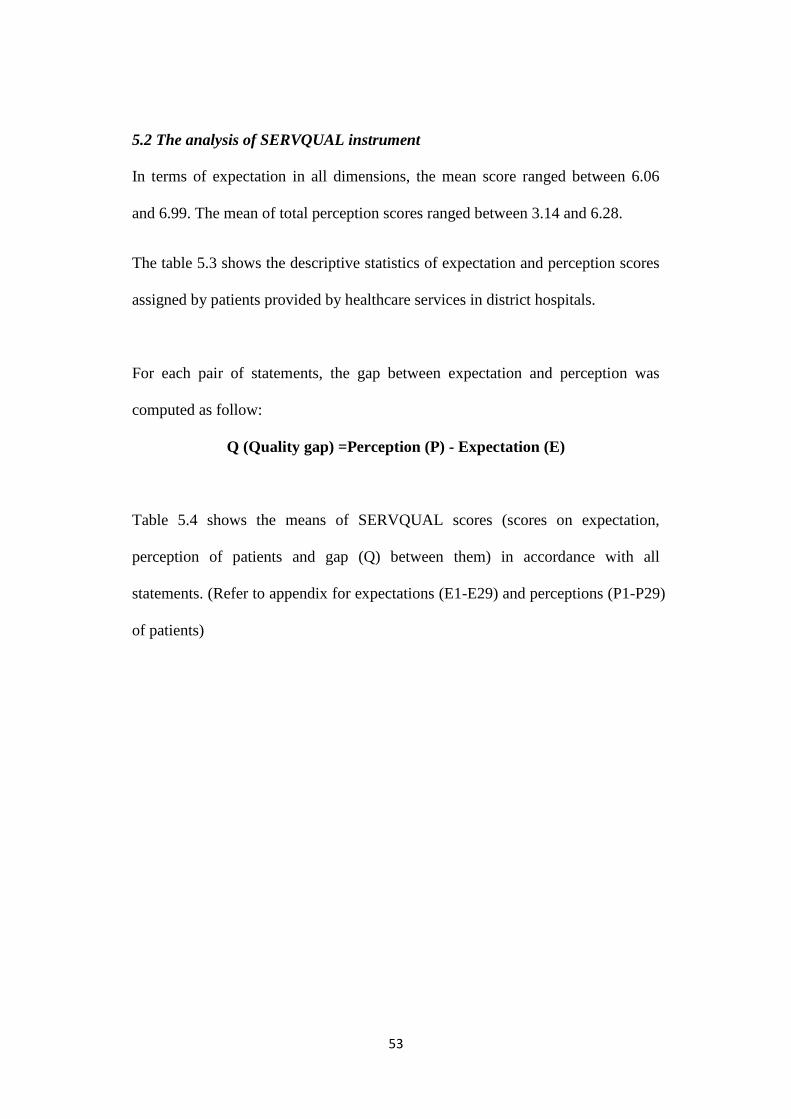
53
5.2 The analysis of SERVQUAL instrument
In terms of expectation in all dimensions, the mean score ranged between 6.06
and 6.99. The mean of total perception scores ranged between 3.14 and 6.28.
The table 5.3 shows the descriptive statistics of expectation and perception scores
assigned by patients provided by healthcare services in district hospitals.
For each pair of statements, the gap between expectation and perception was
computed as follow:
Q (Quality gap) =Perception (P) - Expectation (E)
Table 5.4 shows the means of SERVQUAL scores (scores on expectation,
perception of patients and gap (Q) between them) in accordance with all
statements. (Refer to appendix for expectations (E1-E29) and perceptions (P1-P29)
of patients)
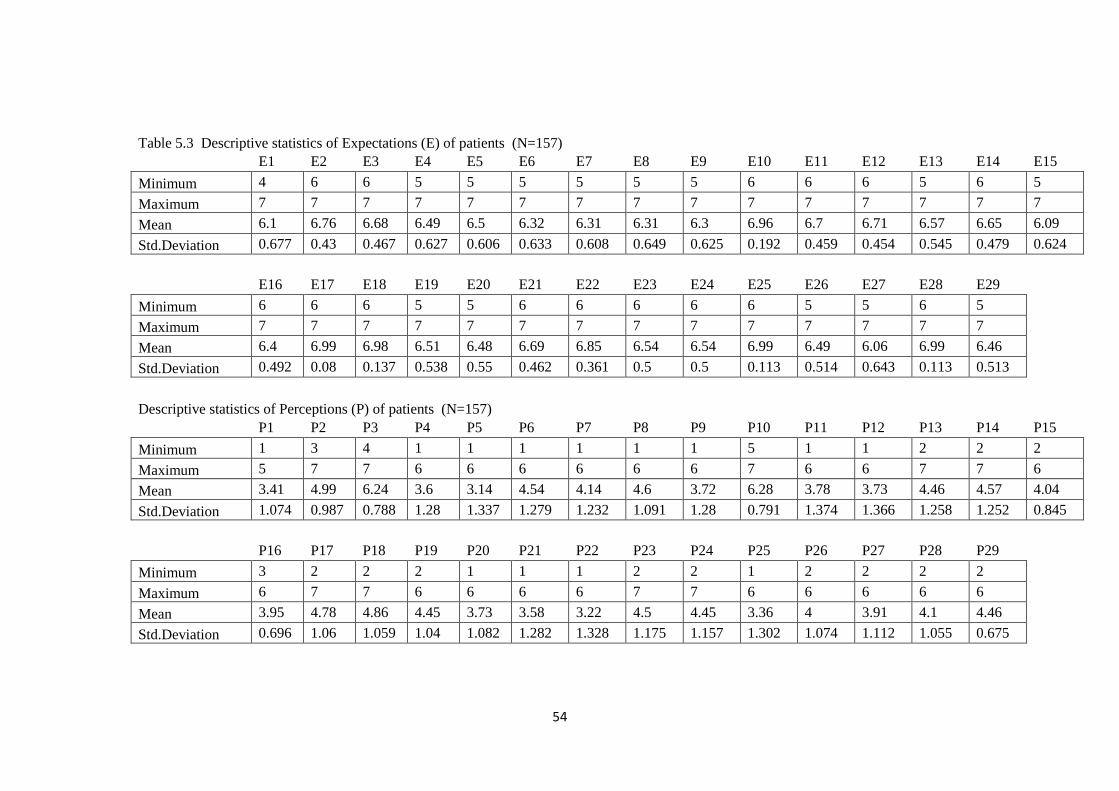
54
Table 5.3 Descriptive statistics of Expectations (E) of patients (N=157)
E1 E2 E3 E4 E5 E6 E7 E8 E9 E10 E11 E12 E13 E14 E15
Minimum 4 6 6 5 5 5 5 5 5 6 6 6 5 6 5
Maximum 7 7 7 7 7 7 7 7 7 7 7 7 7 7 7
Mean 6.1 6.76 6.68 6.49 6.5 6.32 6.31 6.31 6.3 6.96 6.7 6.71 6.57 6.65 6.09
Std.Deviation 0.677 0.43 0.467 0.627 0.606 0.633 0.608 0.649 0.625 0.192 0.459 0.454 0.545 0.479 0.624
E16 E17 E18 E19 E20 E21 E22 E23 E24 E25 E26 E27 E28 E29
Minimum 6 6 6 5 5 6 6 6 6 6 5 5 6 5
Maximum 7 7 7 7 7 7 7 7 7 7 7 7 7 7
Mean 6.4 6.99 6.98 6.51 6.48 6.69 6.85 6.54 6.54 6.99 6.49 6.06 6.99 6.46
Std.Deviation 0.492 0.08 0.137 0.538 0.55 0.462 0.361 0.5 0.5 0.113 0.514 0.643 0.113 0.513
Descriptive statistics of Perceptions (P) of patients (N=157)
P1 P2 P3 P4 P5 P6 P7 P8 P9 P10 P11 P12 P13 P14 P15
Minimum 1 3 4 1 1 1 1 1 1 5 1 1 2 2 2
Maximum 5 7 7 6 6 6 6 6 6 7 6 6 7 7 6
Mean 3.41 4.99 6.24 3.6 3.14 4.54 4.14 4.6 3.72 6.28 3.78 3.73 4.46 4.57 4.04
Std.Deviation 1.074 0.987 0.788 1.28 1.337 1.279 1.232 1.091 1.28 0.791 1.374 1.366 1.258 1.252 0.845
P16 P17 P18 P19 P20 P21 P22 P23 P24 P25 P26 P27 P28 P29
Minimum 3 2 2 2 1 1 1 2 2 1 2 2 2 2
Maximum 6 7 7 6 6 6 6 7 7 6 6 6 6 6
Mean 3.95 4.78 4.86 4.45 3.73 3.58 3.22 4.5 4.45 3.36 4 3.91 4.1 4.46
Std.Deviation 0.696 1.06 1.059 1.04 1.082 1.282 1.328 1.175 1.157 1.302 1.074 1.112 1.055 0.675

55
Table 5.4. Mean of SERVQUAL scores
Statements Expectations Perceptions
SERVQUAL
Score
Tangibles
Q1 DH has up to date and well maintained equipment. 6.1 3.41 -2.69
Q2 Cleanliness and hygiene in district hospitals are excellent. 6.76 4.99 -1.77
Q3 The nurses and doctors are clean and well-groomed. 6.68 6.24 -0.44
Q4 The DH thoroughly provide information on hospital service 6.49 3.6 -2.89
Q5 The patient room is comfortable enough
6.5 3.14 -3.36
Communication
Q8
Doctors explain to me about my health conditions, diagnosis and treatment
in understandable way. 6.31 4.6 -1.71
Q9 Nurses explain to me exactly when and what they are going to do. 6.3 3.72 -2.58
Q23 Doctors have good knowledge to answer my question 6.54 4.5 -2.04
Q24 Nurses have good knowledge to answer my questions 6.54 4.45 -2.09
Responsiveness
Q11 Doctors respond immediately when called by me. 6.96 3.78 -3.18
Q12 Nurses respond immediately when called by me. 6.7 3.73 -2.97
Q15 Waiting time for admission is not so long /more than a week/ 6.09 4.04 -2.05
Q16 Waiting time for daily service is not so long /more than 45 min/ 6.4 3.95 -2.45
Q29 Operating hours in district hospital is convenient to patients. 6.46 4.46 -2
Empathy
Q13 Doctors are helpful for me
6.57 4.46 -2.11
Q14 Nurses are helpful for me.
6.65 4.57 -2.08
Q21 Doctors are respectful to me
6.69 3.58 -3.11
Q22 Nurses are respectful to me.
6.85 3.22 -3.63
Q25 Nurses in district hospital are caring
6.98 3.36 -3.63
Q26 Doctors in district hospital listen to me attentively 6.49 4 -2.49
Q27 Nurses in district hospital listen to me attentively 6.06 3.91 -2.15
Reliability
Q6 DH provide treatment, diagnostic tests and other services in a certain time 6.32 4.54 -1.78
Q7 When I have a problem, DH shows willingness to solve it. 6.31 4.14 -2.17
Q28 Doctor spend enough time to check and to advice to me 6.99 4.1 -2.89
Accountability
Q10 Doctor monitors my health status regularly/everyday. 6.96 6.28 -0.68
Q19 I feel confident when receiving medical treatment. 6.51 4.45 -2.06
Q20 District hospitals provide privacy during treatment 6.48 3.73 -2.75
Assurance
Q17 Doctors are competent
6.99 4.78 -2.21
Q18 Nurses are skillful 6.98 4.86 -2.12
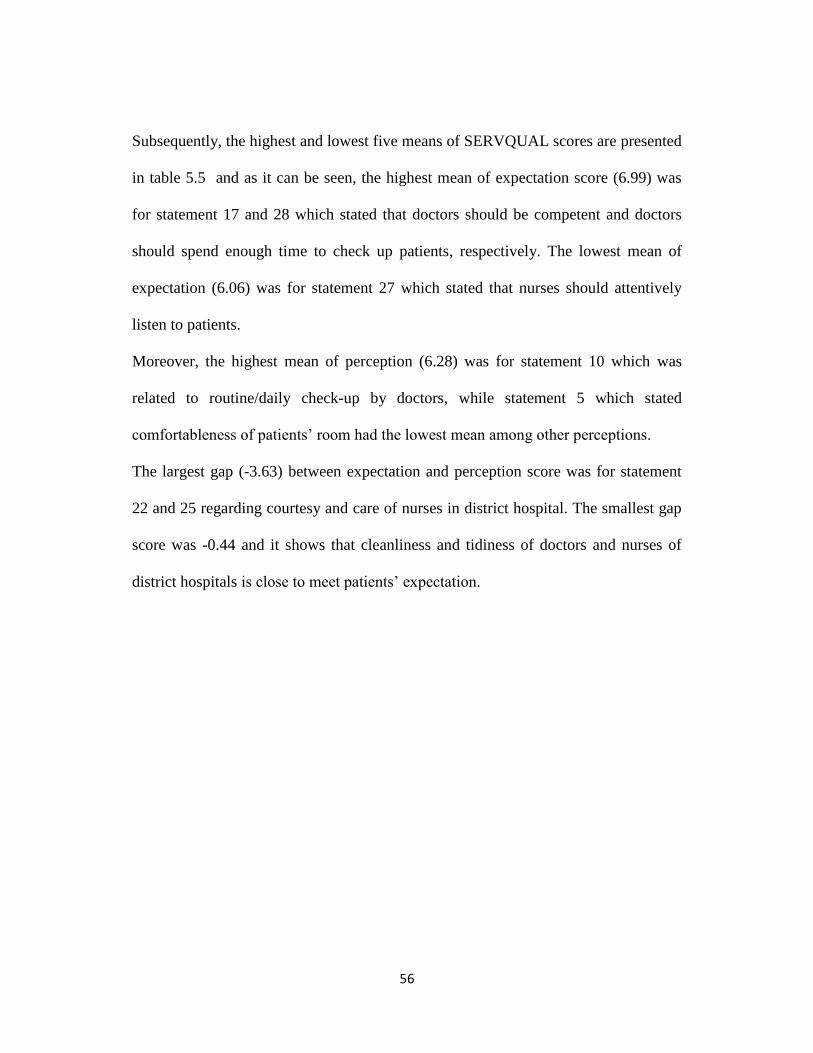
56
Subsequently, the highest and lowest five means of SERVQUAL scores are presented
in table 5.5 and as it can be seen, the highest mean of expectation score (6.99) was
for statement 17 and 28 which stated that doctors should be competent and doctors
should spend enough time to check up patients, respectively. The lowest mean of
expectation (6.06) was for statement 27 which stated that nurses should attentively
listen to patients.
Moreover, the highest mean of perception (6.28) was for statement 10 which was
related to routine/daily check-up by doctors, while statement 5 which stated
comfortableness of patients‘ room had the lowest mean among other perceptions.
The largest gap (-3.63) between expectation and perception score was for statement
22 and 25 regarding courtesy and care of nurses in district hospital. The smallest gap
score was -0.44 and it shows that cleanliness and tidiness of doctors and nurses of
district hospitals is close to meet patients‘ expectation.
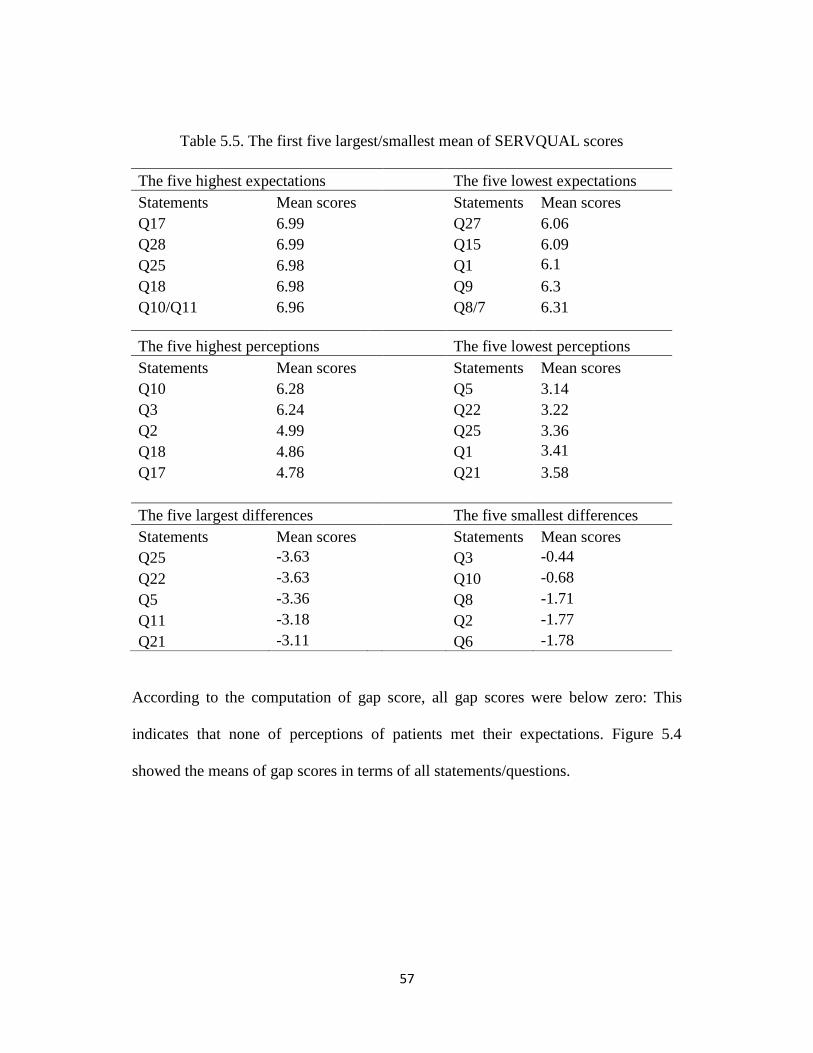
57
Table 5.5. The first five largest/smallest mean of SERVQUAL scores
The five highest expectations
The five lowest expectations
Statements Mean scores
Statements Mean scores
Q17 6.99
Q27 6.06
Q28 6.99
Q15 6.09
Q25 6.98
Q1 6.1
Q18 6.98
Q9 6.3
Q10/Q11 6.96
Q8/7 6.31
The five highest perceptions
The five lowest perceptions
Statements Mean scores
Statements Mean scores
Q10 6.28
Q5 3.14
Q3 6.24
Q22 3.22
Q2 4.99
Q25 3.36
Q18 4.86
Q1 3.41
Q17 4.78
Q21 3.58
The five largest differences
The five smallest differences
Statements Mean scores
Statements Mean scores
Q25 -3.63
Q3 -0.44
Q22 -3.63
Q10 -0.68
Q5 -3.36
Q8 -1.71
Q11 -3.18
Q2 -1.77
Q21 -3.11
Q6 -1.78
According to the computation of gap score, all gap scores were below zero: This
indicates that none of perceptions of patients met their expectations. Figure 5.4
showed the means of gap scores in terms of all statements/questions.

58
Figure 5.4. The mean of gap scores
However, the mean of the gap between expectation and perception scores ranged
between -3.63 and -0.44. The paired sample t-test was used to clarify whether or not
the difference in the means of total expectation and perception score assigned by
patients is statistically significant. In order to run the paired sample t test, the
following assumptions required for t test were checked.
- Normality
- Independence of observations
Normality - The assumption which refers to whether the two sets of variables
(expectation and perception of patients) are normally distributed was checked using
the Q-Q plot and two sets of variables were shown to be normally distributed. It is
shown in figure 5.5.
-4
-3.5
-3
-2.5
-2
-1.5
-1
-0.5
0
1 2 3 4 5 6 7 8 9 1011121314151617181920212223242526272829
S
c
o
r
e
Questions

59
Figure 5.5 Q-Q plots of variables on expectations and perceptions of the patients
Independence of observations –The Durbin-Watson coefficient which is used to test
the independence of observations was 1.8 (it should be between 1.5 and 2.5 for
independent observations) and this assumption met for paired sample t test.
The result of the paired sample t test is shown in table 5.6 and 5.7.
The results presented in table 5.6 shows that difference between two sets of mean is
6.57-4.07=2.5.
Table 5.6 Paired Samples Statistics (total expectations and perceptions of patients)
Mean N Std. Deviation
Std. Error
Mean
Pair 1 Expectation 6.5667 157 .17944 .01432
Perception 4.0727 157 .75557 .06030
7.27.06.86.66.46.26.0
Observed Value
7.2
7.0
6.8
6.6
6.4
6.2
6.0
Ex
pe
cte
d N
orm
al V
alu
e
Normal Q-Q Plot of Expectation
65432
Observed Value
6
5
4
3
2
Ex
pe
cte
d N
orm
al
Valu
e
Normal Q-Q Plot of Perception

60
Table 5.7 Paired Samples Test (total expectations and perceptions of patients)
Paired Differences
t
df
Sig. (2-
tailed)
Mean
Std.
Deviation
Std.
Error
Mean
95% Confidence Interval
of the Difference
Lower Upper
Pair 1 Expectation –
Perception 2.49396 .72177 .05760 2.38018 2.60774 43.295 156 .000
Moreover, the table 5.7 shows a statistically significant difference in the mean of
expectation and perception scores (t (156) =43.295, p<0.001); therefore, the paired
sample t-test concluded that there is a statistically significant difference in the means
of total perceptions and expectations of patients regarding healthcare services offered
at district hospitals. (t (156)=41.194, p<0.05 two-tailed).
However, the results do not report the size of difference between expectation and
perception scores. Therefore, in order to assess the magnitude of the difference I
calculated the effect size since the 'effect size' is a simple way of quantifying the size of
the difference between two groups (Coe, 2000). The effect size conveys whether an
observed difference is substantively important. The effect size is calculated as follows:
r (effect size)=t2/(t
2+df)=43.3
2/(43.3
2+156)=0.92
According to Cohen (1988), the size effect is interpreted as followings:
r=0.1-0.3 – small effect
r=0.3-0.5 – middle effect
r>0.6 – large effect
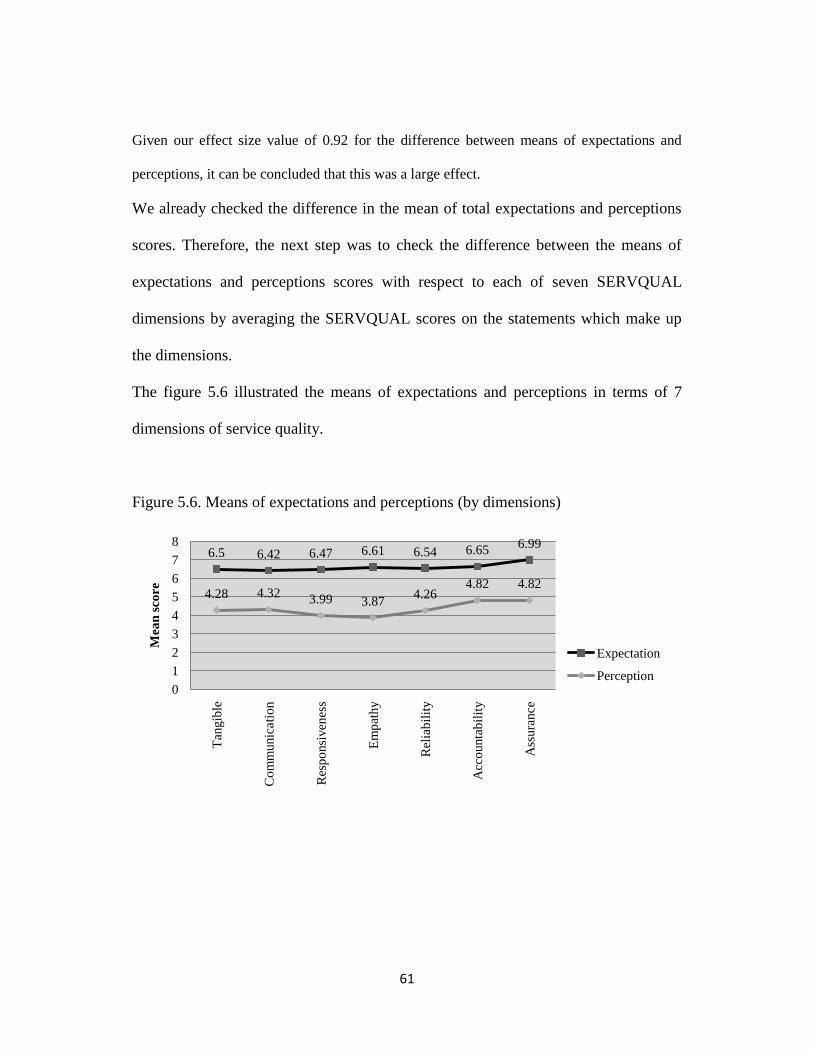
61
Given our effect size value of 0.92 for the difference between means of expectations and
perceptions, it can be concluded that this was a large effect.
We already checked the difference in the mean of total expectations and perceptions
scores. Therefore, the next step was to check the difference between the means of
expectations and perceptions scores with respect to each of seven SERVQUAL
dimensions by averaging the SERVQUAL scores on the statements which make up
the dimensions.
The figure 5.6 illustrated the means of expectations and perceptions in terms of 7
dimensions of service quality.
Figure 5.6. Means of expectations and perceptions (by dimensions)
6.5 6.42 6.47 6.61 6.54 6.656.99
4.28 4.323.99 3.87
4.264.82 4.82
0
1
2
3
4
5
6
7
8
Tan
gib
le
Co
mm
unic
ati
on
Res
po
nsi
ven
ess
Em
pat
hy
Rel
iab
ilit
y
Acc
ounta
bil
ity
Ass
ura
nce
Mea
n s
core
Expectation
Perception

62
As shown in figure 5.6, the means of expectation scores seemed to be greater than the
respective means of perception. In order to check whether these differences are
statistically significant or not, the paired sample t-test was applied for each pair of the
7 dimensions. The result of t-test is shown in table 5.8.
Table 5.8. Paired Samples Test (difference between expectations and perceptions by
dimensions)
Paired Differences
t
df
Sig. (2-
tailed)
Mean
Std.
Deviation
Std.
Error
Mean
95% Confidence
Interval of the
Difference
Lower Upper
Pair 1 Tangible Exp –
Tangible Perc 2.22803 .68029 .05429 2.12078 2.33527 41.037 156 .000
Pair 2 Communication Exp –
Communication Perc 2.10669 .98799 .07885 1.95094 2.26244 26.718 156 .000
Pair 3 Responsiveness Exp –
Responsiveness Perc 2.48408 .80228 .06403 2.35760 2.61055 38.796 156 .000
Pair 4 Empathy Exp –
Empathy Perc 2.74158 1.06329 .08486 2.57396 2.90921 32.307 156 .000
Pair 5 Reliability Exp –
Reliability Perc 2.28450 1.08329 .08646 2.11373 2.45528 26.424 156 .000
Pair 6 Accountability Exp –
Accountability Perc 1.83015 .88483 .07062 1.69066 1.96964 25.916 156 .000
Pair 7 Assurance Exp –
Assurance Perc 2.16879 1.02930 .08215 2.00652 2.33105 26.401 156 .000
Exp-Expectation; Perc-Perception
According to the results presented in table 5.8, the mean in the difference between
expectations and perceptions in tangible scores is 2.23 with 95% confidence interval
ranging from 2.12 to 2.34. The test result shows that there is a statistically significant

63
difference between the mean of expectation scores (M=6.5, SD=0.45) and perception
scores (M=4.28, SD=0.67) in terms of tangible dimension. (t (156)=41.037, p<0.0001)
The calculation of size effect for tangible scores (r=412/ (41
2+156) =0.92) shows the
large effect size.
The mean in the difference in ―communication‖ dimension scores is 2.1 with 95%
confidence interval ranging from 1.95 to 2.26. The test result shows the statistically
significant difference between the mean of expectation scores (M=6.42, SD=0.5) and
perception scores (M=4.3, SD=0.9) in terms of communication dimension. (t
(156)=26.7, p<0.0001)
The calculation of effect size for communication scores (r=26.72/ (26.7
2+156) =0.82)
shows also the large effect size.
The mean in the difference in ―responsiveness‖ scores is 2.48 with 95% confidence
interval ranging from 2.36 to 2.6. The test result also shows a statistically significant
difference in the mean of expectation scores (M=6.47, SD=0.35) and perception
scores (M=3.99, SD=0.7) in terms of responsiveness dimension (t (156)=38.8,
p<0.0001).
The calculation of effect size for responsiveness scores (r=38.82/ (38.8
2+156) =0.91)
shows also a large effect size.
The mean in the difference in ―empathy‖ scores is 2.74 with 95% confidence interval
ranging from 2.57 to 2.91. The test result also showed a statistically significant
64
difference in the mean of expectation scores (M=6.61, SD=0.28) and perception
scores (M=3.87, SD=1.03) in terms of empathy dimension. (t (156)=32.3, p<0.0001)
The calculation of effect size for ―empathy‖ scores (r=32.32/ (32.3
2+156) =0.87)
shows also the large effect size.
The mean in the difference in ―reliability‖ scores is 2.28 with 95% confidence
interval ranging from 2.11 to 2.46. The test result also shows a statistically significant
difference in the mean of expectation scores (M=6.54, SD=0.41) and perception
scores (M=4.26, SD=1) in terms of reliability dimension. (t (156)=26.4, p<0.0001)
The calculation of effect size for reliability scores (r=26.42/ (26.4
2+156) =0.82)
shows also the large effect size.
The mean difference in ―accountability‖ scores is 1.83 with 95% confidence interval
ranging from 1.69 to 1.97. The test result also shows a statistically significant
difference between the mean score of expectations (M=6.65, SD=0.33) and
perceptions (M=4.82, SD=0.81) in terms of reliability dimension. (t (156)=25.9,
p<0.0001)
The calculation of effect size for accountability scores (r=25.92/ (25.9
2+156) =0.81)
shows also the large effect size.
The mean in the difference in ―assurance‖ scores is 2.17 with 95% confidence
interval ranging from 2 to 2.33. The difference in the mean of expectation (M=6.99,
SD=0.1) and perception (M=4.82, SD=1.03) scores is statistically significant in

65
accordance with the test result in terms of assurance dimension. (t (156)=25.9,
p<0.0001)
The calculation of effect size for accountability scores (r=25.92/ (25.9
2+156) =0.81)
shows also the large effect size.
According to the above results, there are statistically significant differences in the
mean of expectation and perception scores assigned by patients along each of 7
dimensions.
Figure 5.7 shows the means of the gap scores for seven SERVQUAL dimensions.
The mean of gap scores for seven dimensions ranges from -2.74 to -1.83. The
empathy dimension of healthcare services provided by district hospital has the
highest gap score (-2.74) and accountability of staff shows the lowest gap (-1.83).
Figure 5.7 Gap Score (by dimensions)
-2.228-2.1067
-2.4841
-2.7416
-2.2845
-1.8301
-2.1688
-3
-2.5
-2
-1.5
-1
-0.5
0
Me
an G
ap S
core
s
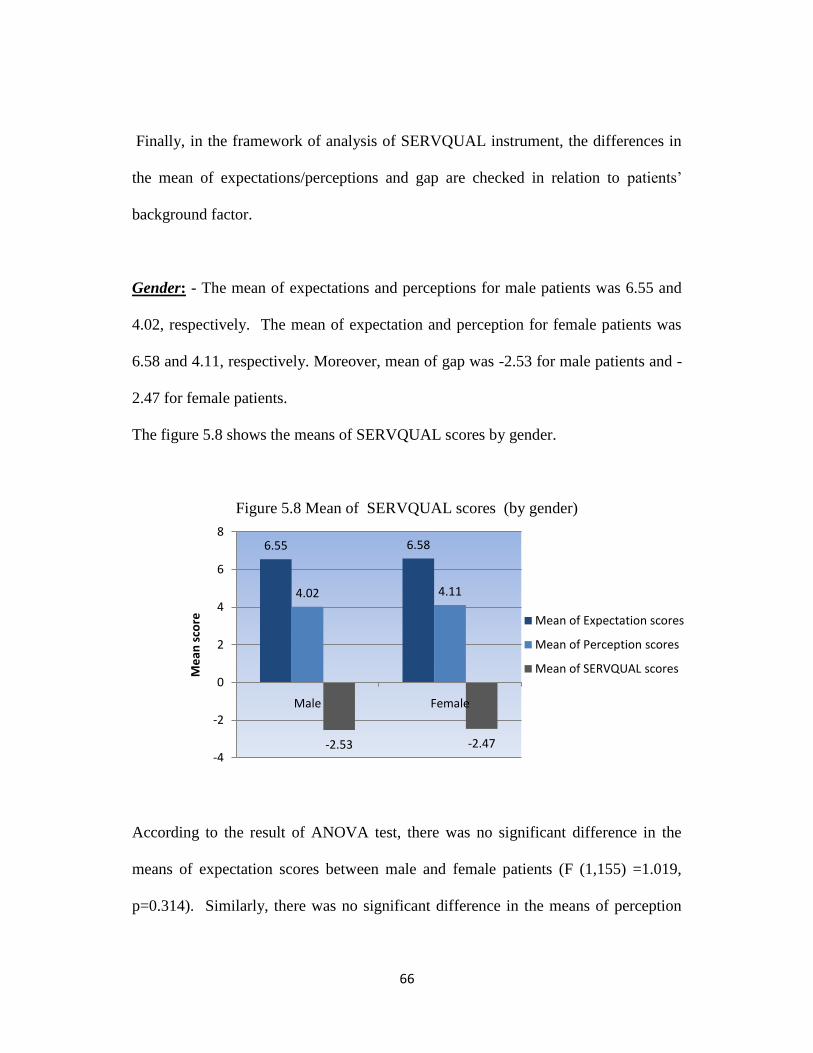
66
Finally, in the framework of analysis of SERVQUAL instrument, the differences in
the mean of expectations/perceptions and gap are checked in relation to patients‘
background factor.
Gender: - The mean of expectations and perceptions for male patients was 6.55 and
4.02, respectively. The mean of expectation and perception for female patients was
6.58 and 4.11, respectively. Moreover, mean of gap was -2.53 for male patients and -
2.47 for female patients.
The figure 5.8 shows the means of SERVQUAL scores by gender.
Figure 5.8 Mean of SERVQUAL scores (by gender)
According to the result of ANOVA test, there was no significant difference in the
means of expectation scores between male and female patients (F (1,155) =1.019,
p=0.314). Similarly, there was no significant difference in the means of perception
6.55 6.58
4.02 4.11
-2.53 -2.47-4
-2
0
2
4
6
8
Male Female
Me
an s
core Mean of Expectation scores
Mean of Perception scores
Mean of SERVQUAL scores
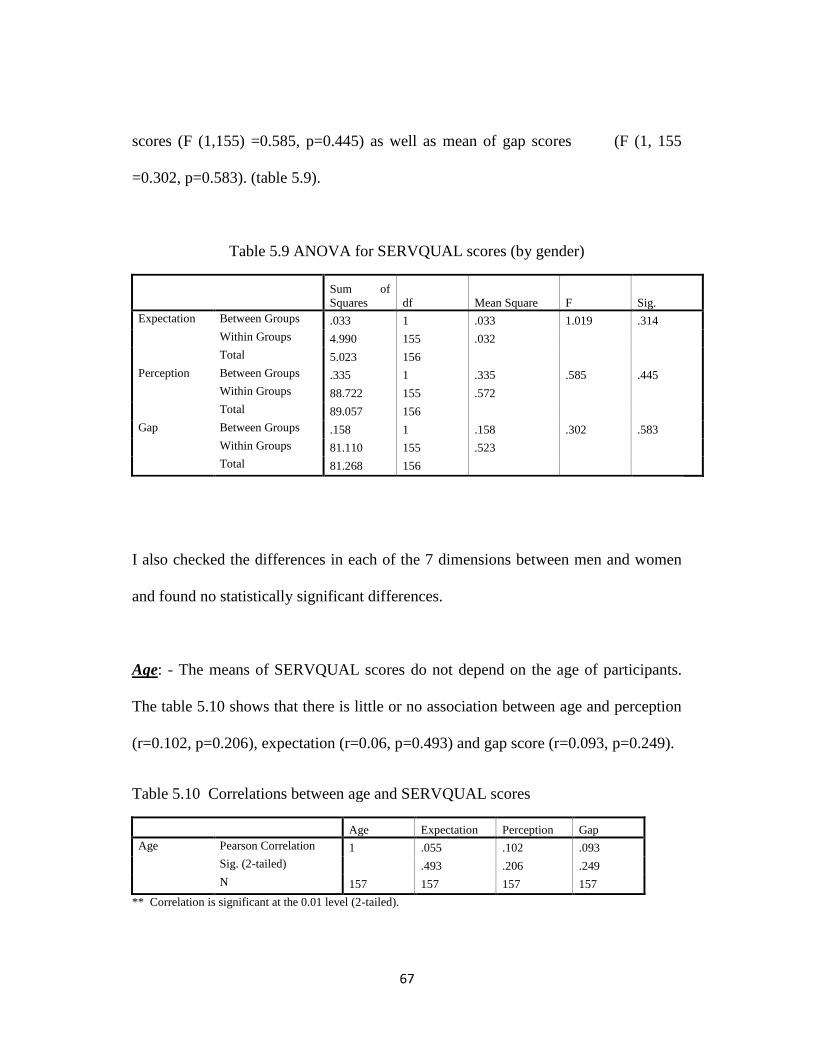
67
scores (F (1,155) =0.585, p=0.445) as well as mean of gap scores (F (1, 155
=0.302, p=0.583). (table 5.9).
Table 5.9 ANOVA for SERVQUAL scores (by gender)
Sum of
Squares df Mean Square F Sig.
Expectation Between Groups .033 1 .033 1.019 .314
Within Groups 4.990 155 .032
Total 5.023 156
Perception Between Groups .335 1 .335 .585 .445
Within Groups 88.722 155 .572
Total 89.057 156
Gap Between Groups .158 1 .158 .302 .583
Within Groups 81.110 155 .523
Total 81.268 156
I also checked the differences in each of the 7 dimensions between men and women
and found no statistically significant differences.
Age: - The means of SERVQUAL scores do not depend on the age of participants.
The table 5.10 shows that there is little or no association between age and perception
(r=0.102, p=0.206), expectation (r=0.06, p=0.493) and gap score (r=0.093, p=0.249).
Table 5.10 Correlations between age and SERVQUAL scores
Age Expectation Perception Gap
Age Pearson Correlation 1 .055 .102 .093
Sig. (2-tailed) .493 .206 .249
N 157 157 157 157
** Correlation is significant at the 0.01 level (2-tailed).
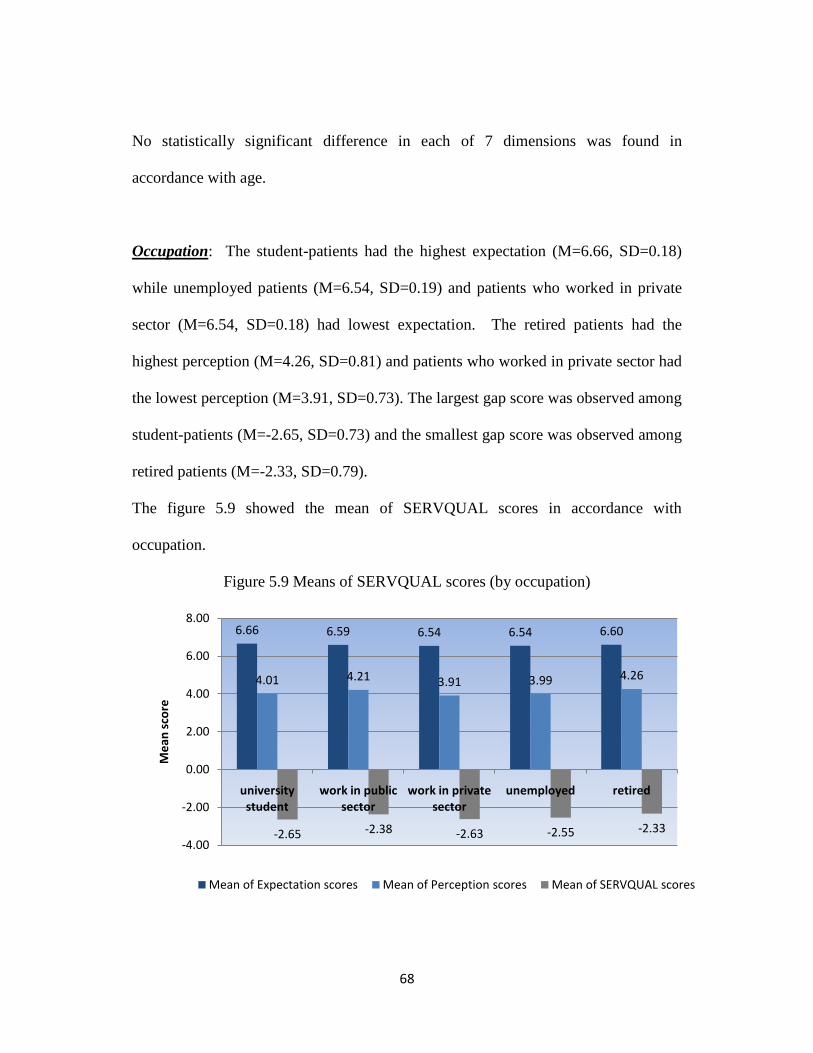
68
No statistically significant difference in each of 7 dimensions was found in
accordance with age.
Occupation: The student-patients had the highest expectation (M=6.66, SD=0.18)
while unemployed patients (M=6.54, SD=0.19) and patients who worked in private
sector (M=6.54, SD=0.18) had lowest expectation. The retired patients had the
highest perception (M=4.26, SD=0.81) and patients who worked in private sector had
the lowest perception (M=3.91, SD=0.73). The largest gap score was observed among
student-patients (M=-2.65, SD=0.73) and the smallest gap score was observed among
retired patients (M=-2.33, SD=0.79).
The figure 5.9 showed the mean of SERVQUAL scores in accordance with
occupation.
Figure 5.9 Means of SERVQUAL scores (by occupation)
6.66 6.59 6.54 6.54 6.60
4.01 4.21 3.91 3.99 4.26
-2.65 -2.38 -2.63 -2.55 -2.33
-4.00
-2.00
0.00
2.00
4.00
6.00
8.00
university student
work in public sector
work in private sector
unemployed retired
Me
an s
core
Mean of Expectation scores Mean of Perception scores Mean of SERVQUAL scores

69
However, result of ANOVA test showed that there were no significant differences in
mean of expectation scores in terms of occupation (F (4,152) =1.064, p=0.376).
Similarly, there were no significant differences in the mean of perception scores (F
(4,152) =1.469, p=0.214) as well as mean of gap scores (F (4, 152 =1.157, p=0.332).
(Table 5.11)
Table 5.11 ANOVA for SERVQUAL scores (by occupation)
Sum of Squares df Mean Square F Sig.
Expectation Between Groups .137 4 .034 1.064 .376
Within Groups 4.886 152 .032
Total 5.023 156
Perception Between Groups 3.314 4 .829 1.469 .214
Within Groups 85.743 152 .564
Total 89.057 156
Gap Between Groups 2.401 4 .600 1.157 .332
Within Groups 78.867 152 .519
Total 81.268 156
Moreover, statistically significant differences in the each of 7 dimensions were not
found in relation to occupational status of patients.
Education: The patients who had college education had the highest expectation
(M=6.60, SD=0.21) and patients having university education had the lowest
perception compared to other patients (M=3.94, SD=0.7). The figure 5.10 showed
the means of SERVQUAL scores by education level.
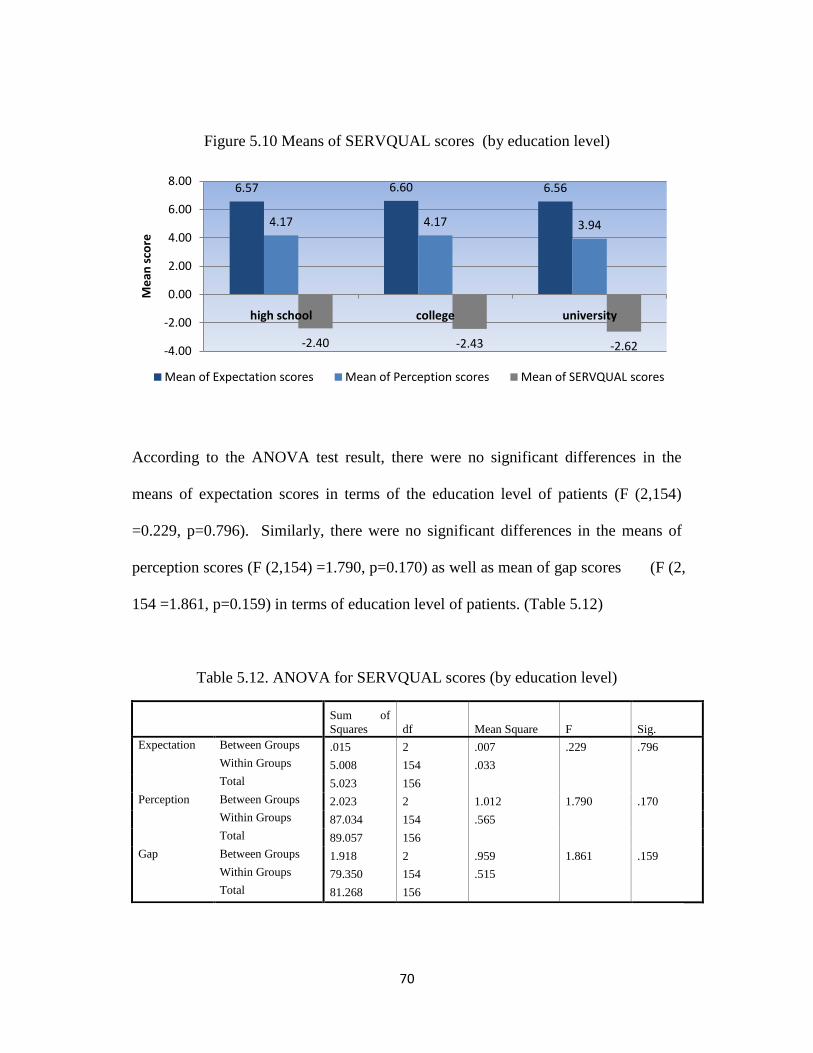
70
Figure 5.10 Means of SERVQUAL scores (by education level)
According to the ANOVA test result, there were no significant differences in the
means of expectation scores in terms of the education level of patients (F (2,154)
=0.229, p=0.796). Similarly, there were no significant differences in the means of
perception scores (F (2,154) =1.790, p=0.170) as well as mean of gap scores (F (2,
154 =1.861, p=0.159) in terms of education level of patients. (Table 5.12)
Table 5.12. ANOVA for SERVQUAL scores (by education level)
Sum of
Squares df Mean Square F Sig.
Expectation Between Groups .015 2 .007 .229 .796
Within Groups 5.008 154 .033
Total 5.023 156
Perception Between Groups 2.023 2 1.012 1.790 .170
Within Groups 87.034 154 .565
Total 89.057 156
Gap Between Groups 1.918 2 .959 1.861 .159
Within Groups 79.350 154 .515
Total 81.268 156
6.57 6.60 6.56
4.17 4.17 3.94
-2.40 -2.43 -2.62-4.00
-2.00
0.00
2.00
4.00
6.00
8.00
high school college university
Me
an s
core
Mean of Expectation scores Mean of Perception scores Mean of SERVQUAL scores

71
No statistically significant differences in the each of 7 dimensions were found in
relation to educational status of patients.
Admitted hospitals: The patients admitted in Bayanzurkh district hospital had the
highest perception (M=4.29, SD=0.86) while patients admitted in Sukhbaatar district
hospital had the lowest perception (M=3.83, SD=0.64) regarding the healthcare
services. The smallest gap score was observed among patients admitted in
Bayanzurkh district hospital (M=-2.27, SD=0.83) while the largest gap score was
observed among patients admitted in Sukhbaatar district hospital (M=-2.7, SD=0.62)
The figure 5.11 showed means of SERVQUAL scores by hospital admitted.
Figure 5.11 Mean of SERVQUAL scores (by hospital admitted)
The result of the ANOVA test showed no significant difference in the means of
expectation scores in terms of hospital admitted (F (2,154) =1.591, p=0.207),
6.60 6.54 6.56
4.08 3.83 4.29
-2.52 -2.70 -2.27-4.00
-2.00
0.00
2.00
4.00
6.00
8.00
Chingeltei DH Sukhbaatar DH Bayanzurkh DH
Me
an s
core
Mean of Expectation scores Mean of Perception scores
Mean of SERVQUAL scores
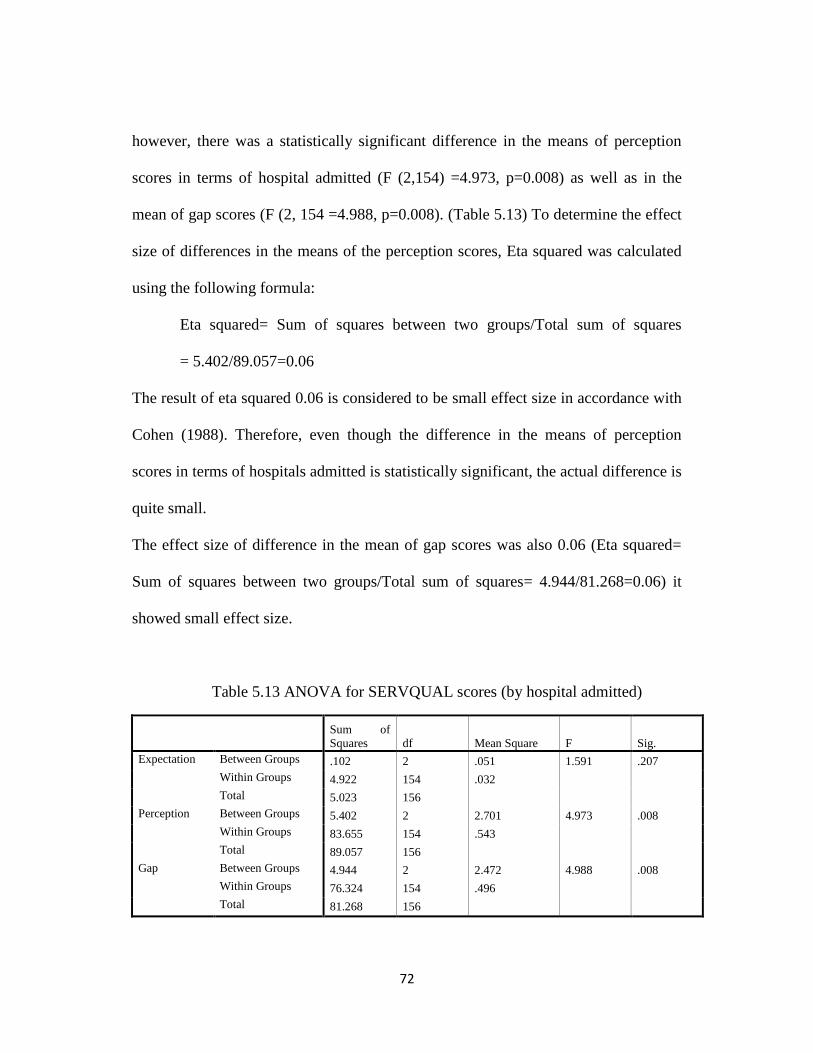
72
however, there was a statistically significant difference in the means of perception
scores in terms of hospital admitted (F (2,154) =4.973, p=0.008) as well as in the
mean of gap scores (F (2, 154 =4.988, p=0.008). (Table 5.13) To determine the effect
size of differences in the means of the perception scores, Eta squared was calculated
using the following formula:
Eta squared= Sum of squares between two groups/Total sum of squares
= 5.402/89.057=0.06
The result of eta squared 0.06 is considered to be small effect size in accordance with
Cohen (1988). Therefore, even though the difference in the means of perception
scores in terms of hospitals admitted is statistically significant, the actual difference is
quite small.
The effect size of difference in the mean of gap scores was also 0.06 (Eta squared=
Sum of squares between two groups/Total sum of squares= 4.944/81.268=0.06) it
showed small effect size.
Table 5.13 ANOVA for SERVQUAL scores (by hospital admitted)
Sum of
Squares df Mean Square F Sig.
Expectation Between Groups .102 2 .051 1.591 .207
Within Groups 4.922 154 .032
Total 5.023 156
Perception Between Groups 5.402 2 2.701 4.973 .008
Within Groups 83.655 154 .543
Total 89.057 156
Gap Between Groups 4.944 2 2.472 4.988 .008
Within Groups 76.324 154 .496
Total 81.268 156
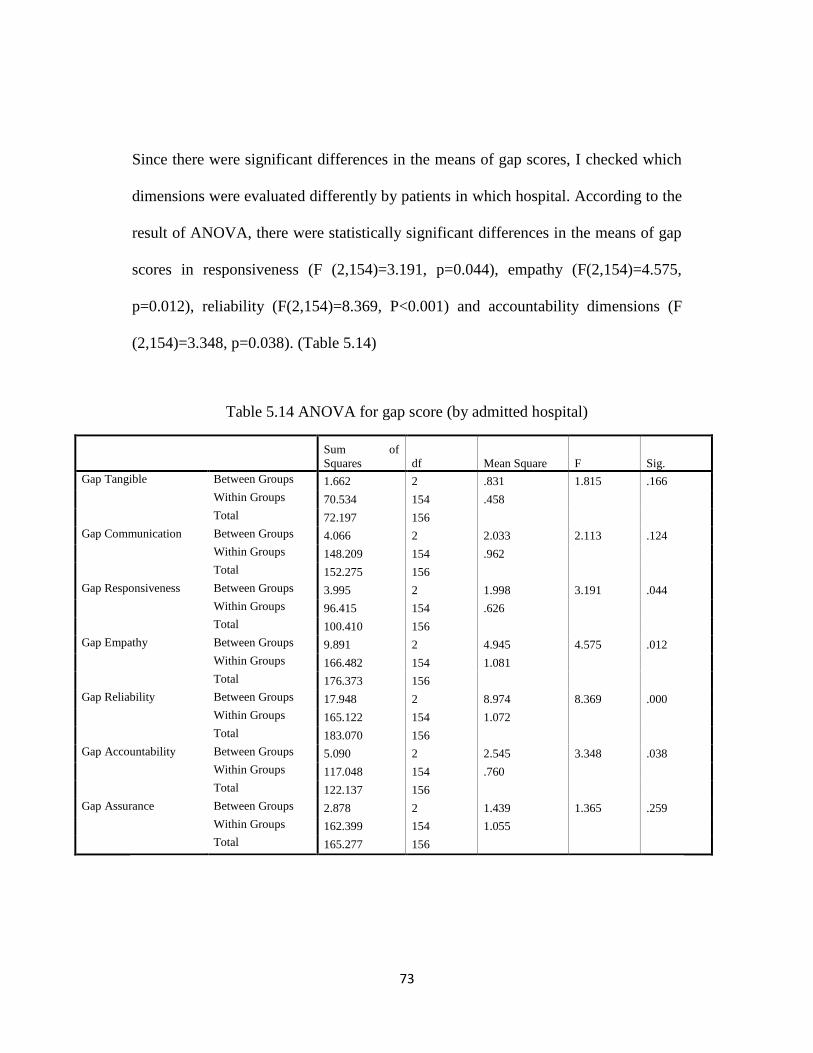
73
Since there were significant differences in the means of gap scores, I checked which
dimensions were evaluated differently by patients in which hospital. According to the
result of ANOVA, there were statistically significant differences in the means of gap
scores in responsiveness (F (2,154)=3.191, p=0.044), empathy (F(2,154)=4.575,
p=0.012), reliability (F(2,154)=8.369, P<0.001) and accountability dimensions (F
(2,154)=3.348, p=0.038). (Table 5.14)
Table 5.14 ANOVA for gap score (by admitted hospital)
Sum of
Squares df Mean Square F Sig.
Gap Tangible Between Groups 1.662 2 .831 1.815 .166
Within Groups 70.534 154 .458
Total 72.197 156
Gap Communication Between Groups 4.066 2 2.033 2.113 .124
Within Groups 148.209 154 .962
Total 152.275 156
Gap Responsiveness Between Groups 3.995 2 1.998 3.191 .044
Within Groups 96.415 154 .626
Total 100.410 156
Gap Empathy Between Groups 9.891 2 4.945 4.575 .012
Within Groups 166.482 154 1.081
Total 176.373 156
Gap Reliability Between Groups 17.948 2 8.974 8.369 .000
Within Groups 165.122 154 1.072
Total 183.070 156
Gap Accountability Between Groups 5.090 2 2.545 3.348 .038
Within Groups 117.048 154 .760
Total 122.137 156
Gap Assurance Between Groups 2.878 2 1.439 1.365 .259
Within Groups 162.399 154 1.055
Total 165.277 156
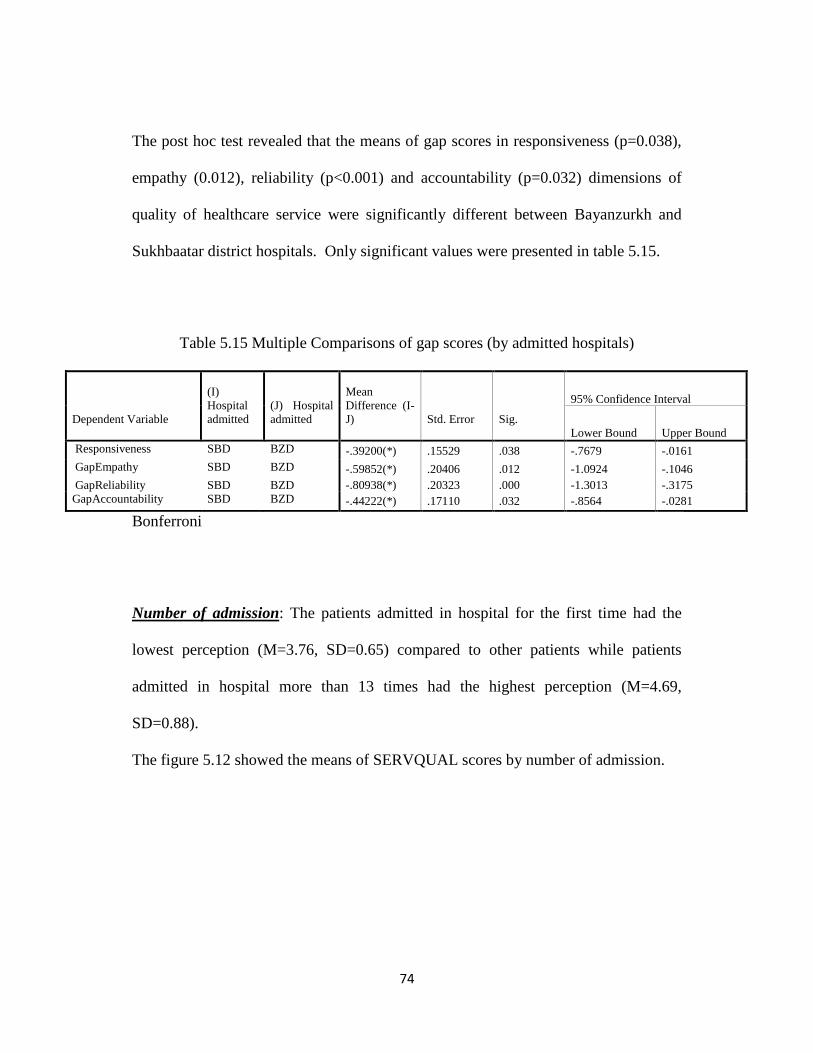
74
The post hoc test revealed that the means of gap scores in responsiveness (p=0.038),
empathy (0.012), reliability (p<0.001) and accountability (p=0.032) dimensions of
quality of healthcare service were significantly different between Bayanzurkh and
Sukhbaatar district hospitals. Only significant values were presented in table 5.15.
Table 5.15 Multiple Comparisons of gap scores (by admitted hospitals)
Dependent Variable
(I)
Hospital
admitted
(J) Hospital
admitted
Mean
Difference (I-
J)
Std. Error
Sig.
95% Confidence Interval
Lower Bound Upper Bound
Responsiveness SBD BZD -.39200(*) .15529 .038 -.7679 -.0161
GapEmpathy SBD BZD -.59852(*) .20406 .012 -1.0924 -.1046
GapReliability SBD BZD -.80938(*) .20323 .000 -1.3013 -.3175
GapAccountability SBD BZD -.44222(*) .17110 .032 -.8564 -.0281
Bonferroni
Number of admission: The patients admitted in hospital for the first time had the
lowest perception (M=3.76, SD=0.65) compared to other patients while patients
admitted in hospital more than 13 times had the highest perception (M=4.69,
SD=0.88).
The figure 5.12 showed the means of SERVQUAL scores by number of admission.
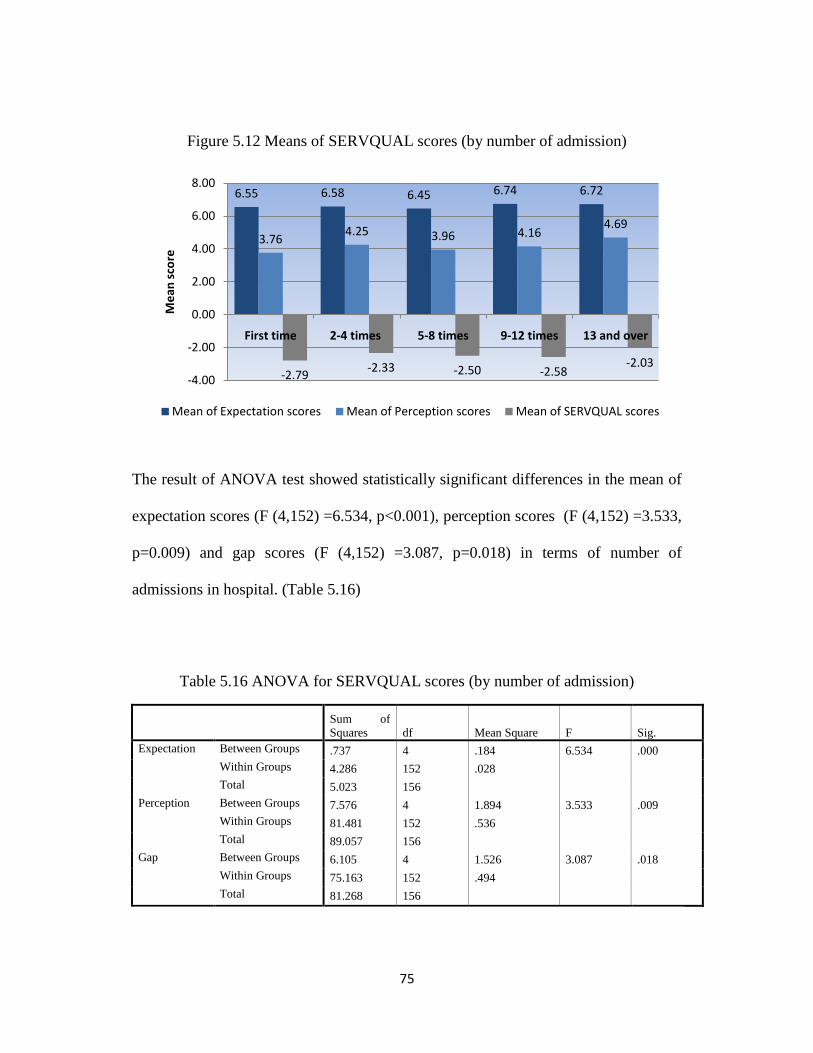
75
Figure 5.12 Means of SERVQUAL scores (by number of admission)
The result of ANOVA test showed statistically significant differences in the mean of
expectation scores (F (4,152) =6.534, p<0.001), perception scores (F (4,152) =3.533,
p=0.009) and gap scores (F (4,152) =3.087, p=0.018) in terms of number of
admissions in hospital. (Table 5.16)
Table 5.16 ANOVA for SERVQUAL scores (by number of admission)
Sum of
Squares df Mean Square F Sig.
Expectation Between Groups .737 4 .184 6.534 .000
Within Groups 4.286 152 .028
Total 5.023 156
Perception Between Groups 7.576 4 1.894 3.533 .009
Within Groups 81.481 152 .536
Total 89.057 156
Gap Between Groups 6.105 4 1.526 3.087 .018
Within Groups 75.163 152 .494
Total 81.268 156
6.55 6.58 6.45 6.74 6.72
3.764.25 3.96 4.16
4.69
-2.79-2.33 -2.50 -2.58
-2.03
-4.00
-2.00
0.00
2.00
4.00
6.00
8.00
First time 2-4 times 5-8 times 9-12 times 13 and over
Me
an s
core
Mean of Expectation scores Mean of Perception scores Mean of SERVQUAL scores
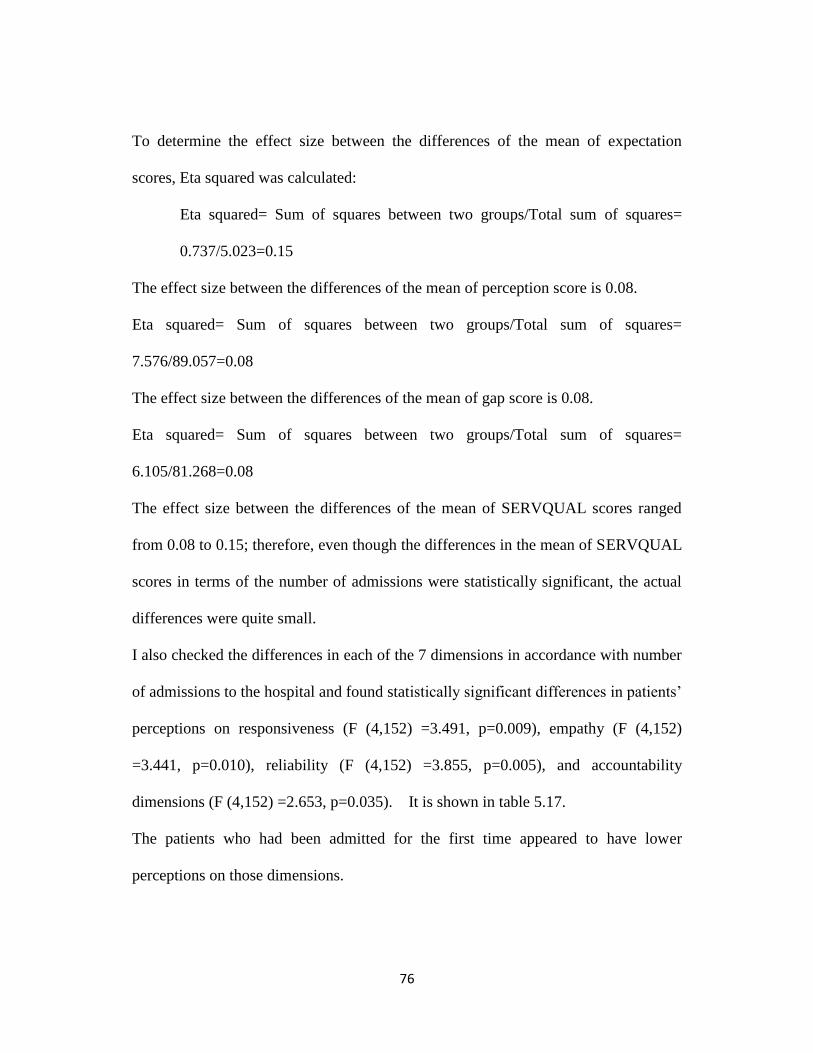
76
To determine the effect size between the differences of the mean of expectation
scores, Eta squared was calculated:
Eta squared= Sum of squares between two groups/Total sum of squares=
0.737/5.023=0.15
The effect size between the differences of the mean of perception score is 0.08.
Eta squared= Sum of squares between two groups/Total sum of squares=
7.576/89.057=0.08
The effect size between the differences of the mean of gap score is 0.08.
Eta squared= Sum of squares between two groups/Total sum of squares=
6.105/81.268=0.08
The effect size between the differences of the mean of SERVQUAL scores ranged
from 0.08 to 0.15; therefore, even though the differences in the mean of SERVQUAL
scores in terms of the number of admissions were statistically significant, the actual
differences were quite small.
I also checked the differences in each of the 7 dimensions in accordance with number
of admissions to the hospital and found statistically significant differences in patients‘
perceptions on responsiveness (F (4,152) =3.491, p=0.009), empathy (F (4,152)
=3.441, p=0.010), reliability (F (4,152) =3.855, p=0.005), and accountability
dimensions (F (4,152) =2.653, p=0.035). It is shown in table 5.17.
The patients who had been admitted for the first time appeared to have lower
perceptions on those dimensions.
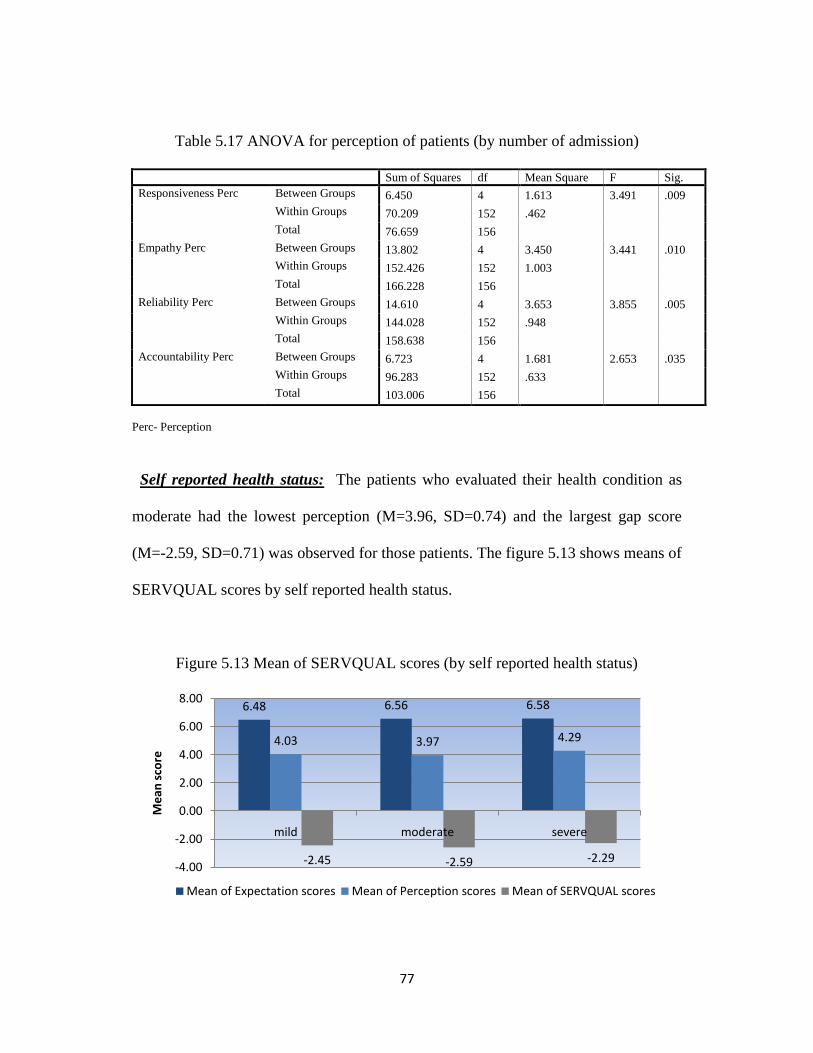
77
Table 5.17 ANOVA for perception of patients (by number of admission)
Sum of Squares df Mean Square F Sig.
Responsiveness Perc Between Groups 6.450 4 1.613 3.491 .009
Within Groups 70.209 152 .462
Total 76.659 156
Empathy Perc Between Groups 13.802 4 3.450 3.441 .010
Within Groups 152.426 152 1.003
Total 166.228 156
Reliability Perc Between Groups 14.610 4 3.653 3.855 .005
Within Groups 144.028 152 .948
Total 158.638 156
Accountability Perc Between Groups 6.723 4 1.681 2.653 .035
Within Groups 96.283 152 .633
Total 103.006 156
Perc- Perception
Self reported health status: The patients who evaluated their health condition as
moderate had the lowest perception (M=3.96, SD=0.74) and the largest gap score
(M=-2.59, SD=0.71) was observed for those patients. The figure 5.13 shows means of
SERVQUAL scores by self reported health status.
Figure 5.13 Mean of SERVQUAL scores (by self reported health status)
6.48 6.56 6.58
4.03 3.97 4.29
-2.45 -2.59 -2.29-4.00
-2.00
0.00
2.00
4.00
6.00
8.00
mild moderate severe
Me
an s
core
Mean of Expectation scores Mean of Perception scores Mean of SERVQUAL scores
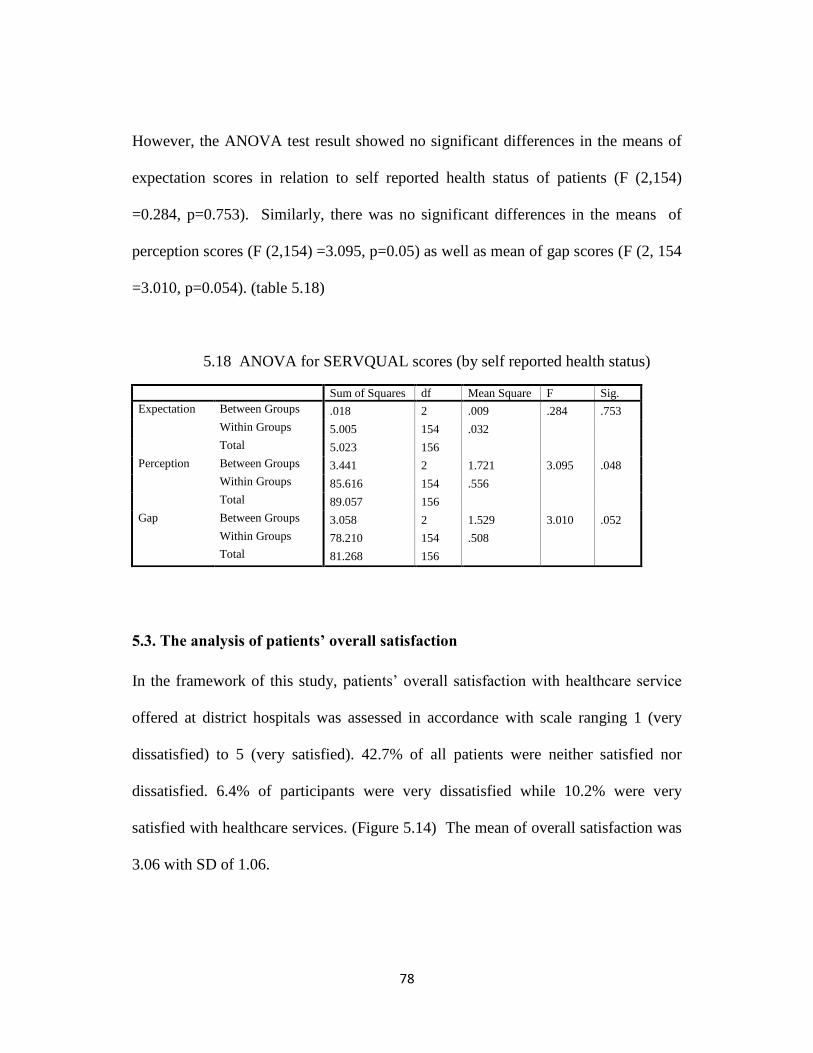
78
However, the ANOVA test result showed no significant differences in the means of
expectation scores in relation to self reported health status of patients (F (2,154)
=0.284, p=0.753). Similarly, there was no significant differences in the means of
perception scores (F (2,154) =3.095, p=0.05) as well as mean of gap scores (F (2, 154
=3.010, p=0.054). (table 5.18)
5.18 ANOVA for SERVQUAL scores (by self reported health status)
Sum of Squares df Mean Square F Sig.
Expectation Between Groups .018 2 .009 .284 .753
Within Groups 5.005 154 .032
Total 5.023 156
Perception Between Groups 3.441 2 1.721 3.095 .048
Within Groups 85.616 154 .556
Total 89.057 156
Gap Between Groups 3.058 2 1.529 3.010 .052
Within Groups 78.210 154 .508
Total 81.268 156
5.3. The analysis of patients’ overall satisfaction
In the framework of this study, patients‘ overall satisfaction with healthcare service
offered at district hospitals was assessed in accordance with scale ranging 1 (very
dissatisfied) to 5 (very satisfied). 42.7% of all patients were neither satisfied nor
dissatisfied. 6.4% of participants were very dissatisfied while 10.2% were very
satisfied with healthcare services. (Figure 5.14) The mean of overall satisfaction was
3.06 with SD of 1.06.
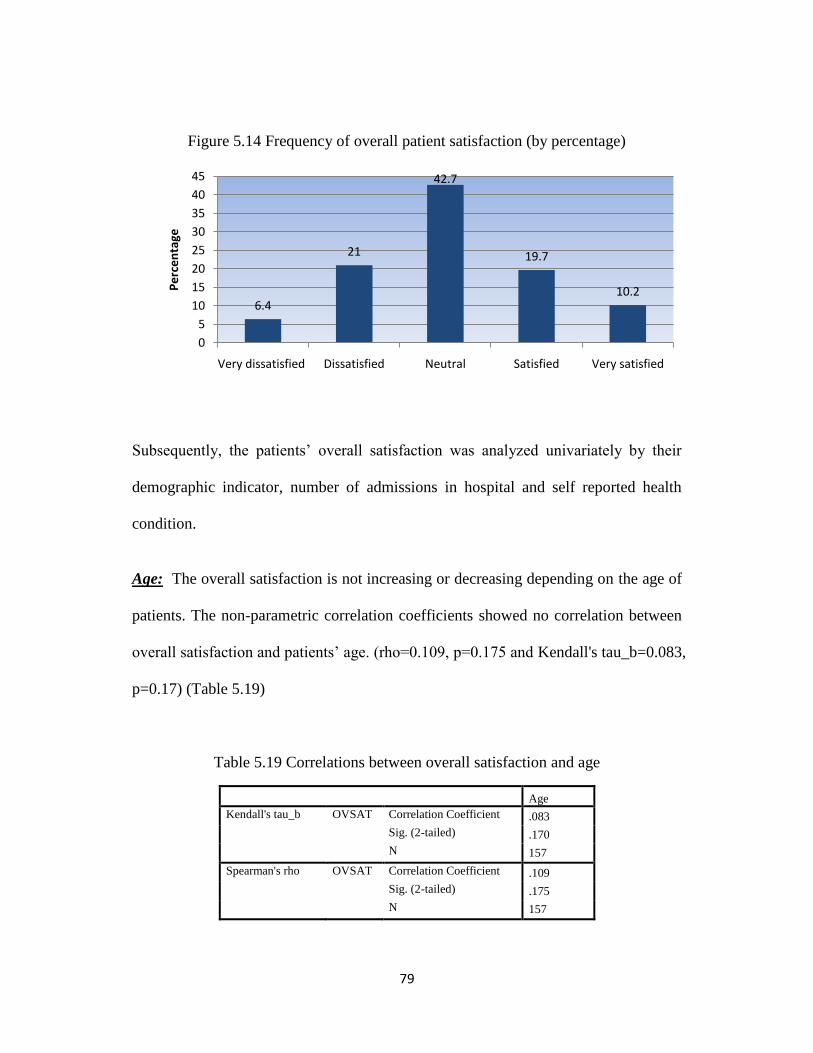
79
Figure 5.14 Frequency of overall patient satisfaction (by percentage)
Subsequently, the patients‘ overall satisfaction was analyzed univariately by their
demographic indicator, number of admissions in hospital and self reported health
condition.
Age: The overall satisfaction is not increasing or decreasing depending on the age of
patients. The non-parametric correlation coefficients showed no correlation between
overall satisfaction and patients‘ age. (rho=0.109, p=0.175 and Kendall's tau_b=0.083,
p=0.17) (Table 5.19)
Table 5.19 Correlations between overall satisfaction and age
Age
Kendall's tau_b OVSAT Correlation Coefficient .083
Sig. (2-tailed) .170
N 157
Spearman's rho OVSAT Correlation Coefficient .109
Sig. (2-tailed) .175
N 157
6.4
21
42.7
19.7
10.2
0
5
10
15
20
25
30
35
40
45
Very dissatisfied Dissatisfied Neutral Satisfied Very satisfied
Pe
rce
nta
ge
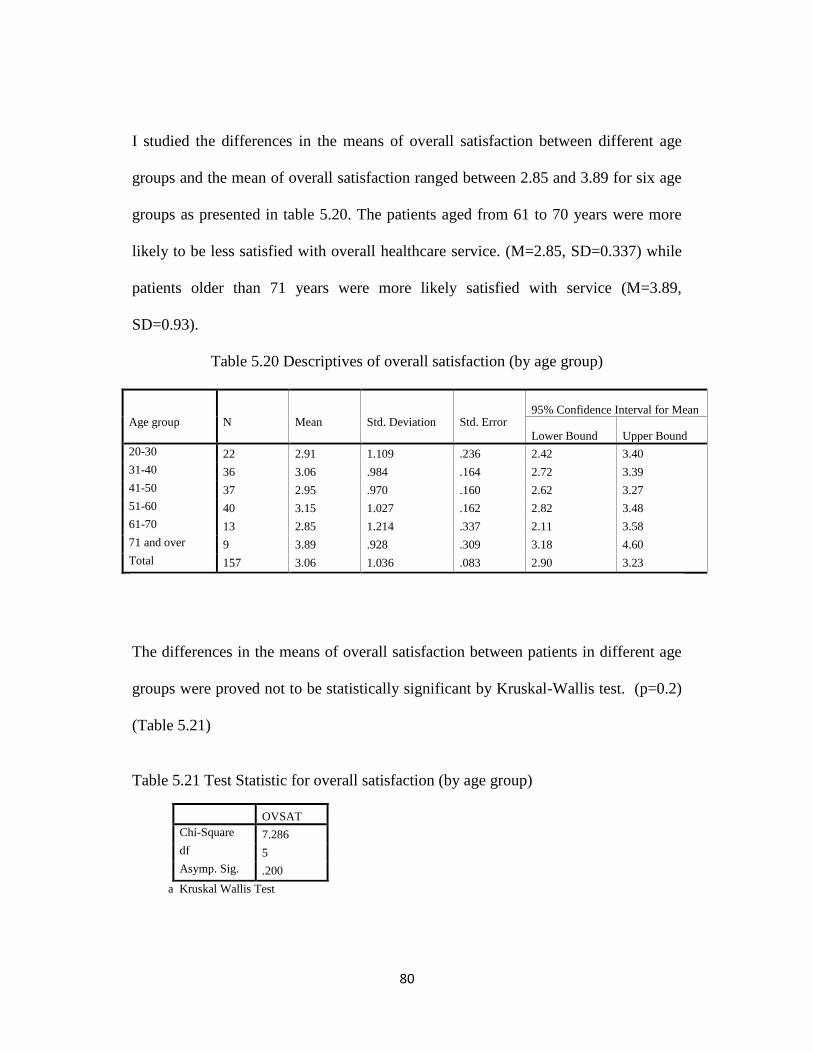
80
I studied the differences in the means of overall satisfaction between different age
groups and the mean of overall satisfaction ranged between 2.85 and 3.89 for six age
groups as presented in table 5.20. The patients aged from 61 to 70 years were more
likely to be less satisfied with overall healthcare service. (M=2.85, SD=0.337) while
patients older than 71 years were more likely satisfied with service (M=3.89,
SD=0.93).
Table 5.20 Descriptives of overall satisfaction (by age group)
Age group
N
Mean
Std. Deviation
Std. Error
95% Confidence Interval for Mean
Lower Bound Upper Bound
20-30 22 2.91 1.109 .236 2.42 3.40
31-40 36 3.06 .984 .164 2.72 3.39
41-50 37 2.95 .970 .160 2.62 3.27
51-60 40 3.15 1.027 .162 2.82 3.48
61-70 13 2.85 1.214 .337 2.11 3.58
71 and over 9 3.89 .928 .309 3.18 4.60
Total 157 3.06 1.036 .083 2.90 3.23
The differences in the means of overall satisfaction between patients in different age
groups were proved not to be statistically significant by Kruskal-Wallis test. (p=0.2)
(Table 5.21)
Table 5.21 Test Statistic for overall satisfaction (by age group)
OVSAT
Chi-Square 7.286
df 5
Asymp. Sig. .200
a Kruskal Wallis Test

81
Gender: The means of overall satisfaction of male patients and female patients were
2.99 with SD of 0.978 and 3.13 with SD of 1.082, respectively. The figure 5.15
showed that how differently male and female patients were satisfied with healthcare
services offered at district hospital.
Figure 5.15 Overall satisfaction of patients by gender (by percentage)
As shown in figure 5.15, 47.89% of all male patients and 38.37% of all female
patients are neither satisfied nor dissatisfied. Percentage of female patients (13.95%)
who are very satisfied with service is higher than percentage of male patients (5.63)
who are very satisfied. However, female patients are more likely to be dissatisfied
rather than male patients. The Mann-Whitney U test tested that whether these
differences were statistically significant or not. The result of Mann-Whitney U test
8.45
16.90
47.89
21.13
5.634.65
24.42
38.37
18.6013.95
0.00
10.00
20.00
30.00
40.00
50.00
60.00
Very dissatisfied
Dissatisfied Neutral Satisfied Very satisfied
Pe
rce
nta
ge
Male
Female

82
showed no significance differences in the mean of overall satisfaction between male
and female patients. (p=0.589) (Table 5.22)
Table 5.22 Test Statistics for overall satisfaction (by gender)
OVSAT
Mann-Whitney U 2907.000
Wilcoxon W 5463.000
Z -.542
Asymp. Sig. (2-tailed) .588
Point Probability .000
a Grouping Variable: Gender
Occupation: The patients who worked in public sector were more likely to be
satisfied (M=3.26, SD= 0.22) compared to other participants. Patients who worked in
private sector were less satisfied (M=2.87, SD=0.14) with healthcare services.
Mean of satisfaction was 3 for both student-patients (SD=0.55) and unemployed
patients (SD=0.14). In addition, the mean of satisfaction for patients working in
public sector was 3.26 with SD of 0.22. (Figure 5.16)
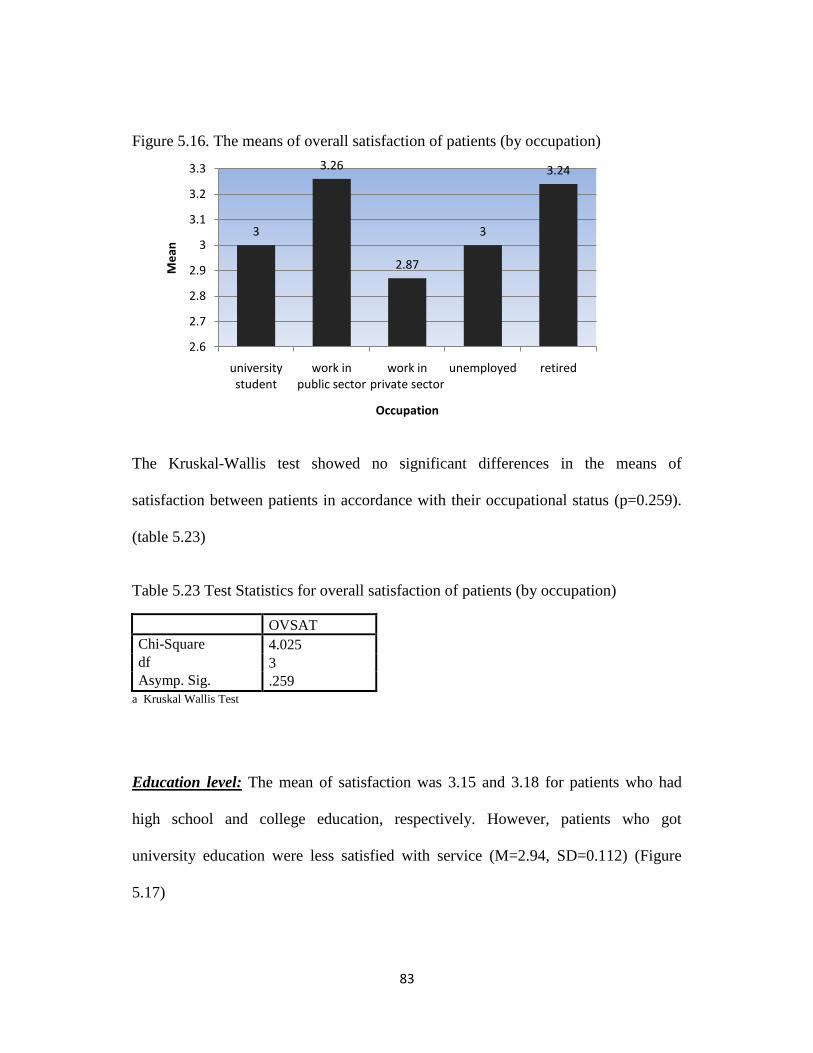
83
Figure 5.16. The means of overall satisfaction of patients (by occupation)
The Kruskal-Wallis test showed no significant differences in the means of
satisfaction between patients in accordance with their occupational status (p=0.259).
(table 5.23)
Table 5.23 Test Statistics for overall satisfaction of patients (by occupation)
OVSAT
Chi-Square 4.025
df 3
Asymp. Sig. .259
a Kruskal Wallis Test
Education level: The mean of satisfaction was 3.15 and 3.18 for patients who had
high school and college education, respectively. However, patients who got
university education were less satisfied with service (M=2.94, SD=0.112) (Figure
5.17)
3
3.26
2.87
3
3.24
2.6
2.7
2.8
2.9
3
3.1
3.2
3.3
university student
work in public sector
work in private sector
unemployed retired
Me
an
Occupation

84
Figure 5.17. The means of satisfaction (by educational level)
The result of Kruskall-Wallis test showed no significance difference in the means of
satisfaction between patients with different education levels. (p=0.503) (Table 5.24)
Table 5.24. Test Statistics for overall satisfaction of patients
OVSAT
Chi-Square 1.372
df 2
Asymp. Sig. .503
a Kruskal Wallis Test
b Grouping Variable: education
Admitted hospitals: The patients admitted in Bayanzurkh district hospital were more
likely to be satisfied (M=3.33, SD=0.156) with healthcare service offered at
Bayanzurkh district hospital. The patients admitted in Chingeltei district hospital
were less satisfied. The figure 5.18 showed the means of satisfaction by hospitals
admitted.
3.153.18
2.94
2.8
2.85
2.9
2.95
3
3.05
3.1
3.15
3.2
high school college university
Me
an
Education level
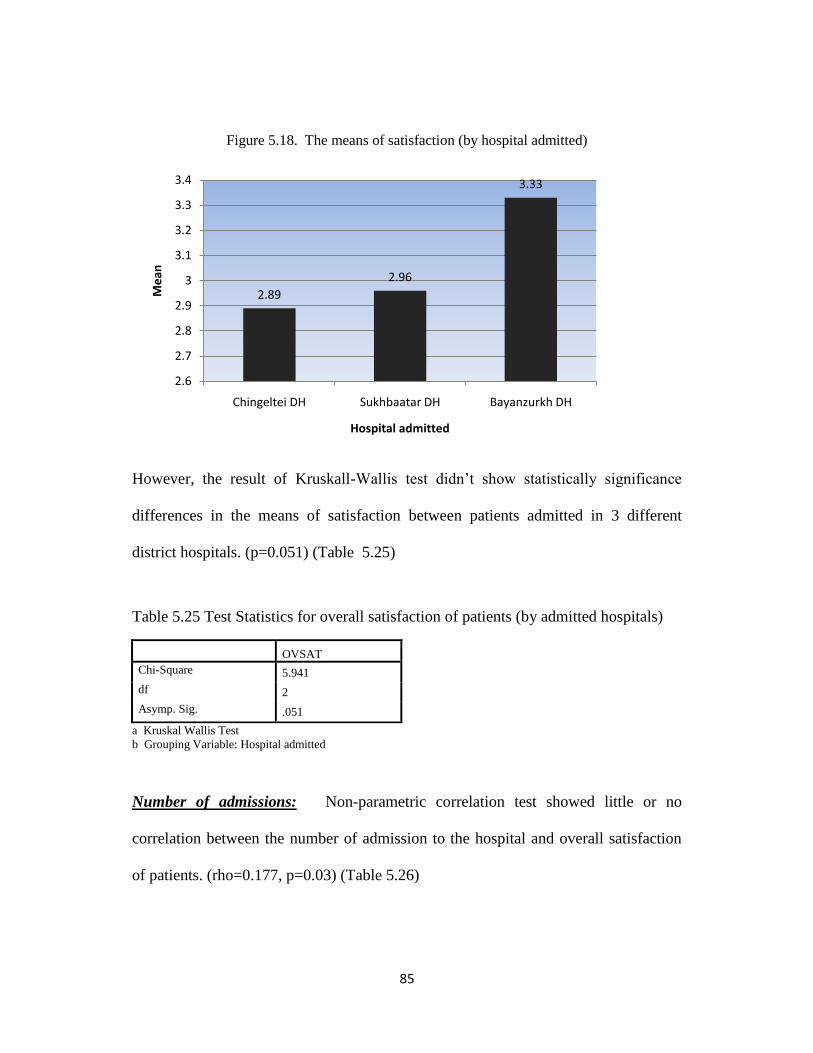
85
Figure 5.18. The means of satisfaction (by hospital admitted)
However, the result of Kruskall-Wallis test didn‘t show statistically significance
differences in the means of satisfaction between patients admitted in 3 different
district hospitals. (p=0.051) (Table 5.25)
Table 5.25 Test Statistics for overall satisfaction of patients (by admitted hospitals)
OVSAT
Chi-Square 5.941
df 2
Asymp. Sig. .051
a Kruskal Wallis Test
b Grouping Variable: Hospital admitted
Number of admissions: Non-parametric correlation test showed little or no
correlation between the number of admission to the hospital and overall satisfaction
of patients. (rho=0.177, p=0.03) (Table 5.26)
2.89
2.96
3.33
2.6
2.7
2.8
2.9
3
3.1
3.2
3.3
3.4
Chingeltei DH Sukhbaatar DH Bayanzurkh DH
Me
an
Hospital admitted

86
Table 5.26 Correlations between number of admission and overall satisfaction
number of
admission OVSAT
Spearman's rho OVSAT Correlation Coefficient .177(*) 1.000
Sig. (2-tailed) .027 .
N 157 157
However, as shown in figure 5.19, the patients admitted for the first time were less
satisfied (M=2.56, SD=0.838) compared to other patients. Patients admitted in
hospital more than 12 times were more satisfied. (M=3.5, SD=0.707).
Figure 5.19 Means of satisfaction (by group of number of admission)
Kruskal-Wallis test showed (table 5.27) that there was a statistically significance
difference in the means of satisfaction between patients who were admitted in
2.56
3.273.08
3.333.5
0
0.5
1
1.5
2
2.5
3
3.5
4
First time 2-4 times 5-8 times 9-12 times 13 and over
Me
an
Number of admission

87
hospital for a different number of times. (p=0.005); however, it is not possible to
know which groups significantly differed from each other since Kruskal-Wallis test is
limited for post hoc test. Chi square test couldn‘t be applied for post hoc test because
assumption indicating no cells with an expected count less than 5 for chi square test
was violated. There were 15 cells which had an expected count less than 5 and the
results would be misleading. Therefore, our interpretation is limited concluding that
at least one group differed from one group in terms of mean of satisfaction.
Table 5.27 Test Statistics for overall satisfaction of patients (by number of admission)
OVSAT
Chi-Square 14.670
df 4
Asymp. Sig. .005 Kruskal Wallis Test
Self reported health status: Patients who rated their health status as severe deemed
more likely to be satisfied (M=3.25, SD=0.145) whereas patients rated as moderate
were less satisfied (M=2.97, SD=0.101). Since we have only one patient who rated
his health status as mild, the mean couldn‘t be calculated. The Kruskal Wallis test
also showed that mean of satisfaction did not differ within patients rating their health
as mild, moderate and severe. (p=0.184) (Table 5.28)
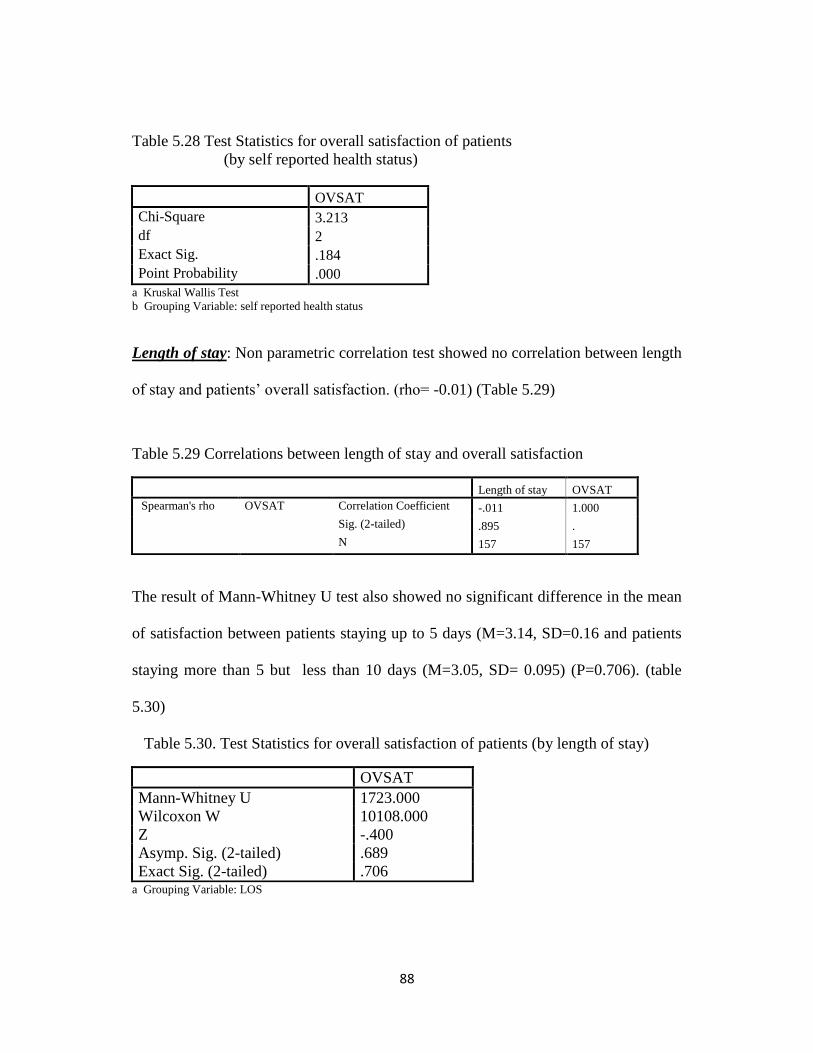
88
Table 5.28 Test Statistics for overall satisfaction of patients
(by self reported health status)
OVSAT
Chi-Square 3.213
df 2
Exact Sig. .184
Point Probability .000
a Kruskal Wallis Test
b Grouping Variable: self reported health status
Length of stay: Non parametric correlation test showed no correlation between length
of stay and patients‘ overall satisfaction. (rho= -0.01) (Table 5.29)
Table 5.29 Correlations between length of stay and overall satisfaction
Length of stay OVSAT
Spearman's rho OVSAT Correlation Coefficient -.011 1.000
Sig. (2-tailed) .895 .
N 157 157
The result of Mann-Whitney U test also showed no significant difference in the mean
of satisfaction between patients staying up to 5 days (M=3.14, SD=0.16 and patients
staying more than 5 but less than 10 days (M=3.05, SD= 0.095) (P=0.706). (table
5.30)
Table 5.30. Test Statistics for overall satisfaction of patients (by length of stay)
OVSAT
Mann-Whitney U 1723.000
Wilcoxon W 10108.000
Z -.400
Asymp. Sig. (2-tailed) .689
Exact Sig. (2-tailed) .706 a Grouping Variable: LOS
89
Since we finished the univariate analysis, in the next step the ordinal regression method
was used to model the relationship between overall patient satisfaction and perception
of patients concerning the healthcare services provided in district hospitals. In this
study, the overall patient satisfaction is a response variable and measured in an
ordered, categorical, five- point Likert scale. Explanatory variables included
background factors of patients such as age, gender, occupation and educational status,
the number of admissions, length of stay, the admitted hospital, self reported health
status and 29 items related to perception of dimensions of healthcare services
including tangibility, communication, responsiveness, reliability, empathy,
accountability and assurance. Regression methods such as linear, logistic, and ordinal
regression are useful tools to analyze the relationship between multiple explanatory
variables and satisfaction results (Chen, 2004). However, the ordinal regression
method must be chosen to obtain valid results in order to study the effect of
explanatory variables on all levels of the categorical response variable (Chen, 2004).
Therefore, the ordinal regression model was chosen in the data analysis of my study.
In ordinal regression analysis, the two major link functions, logit and complementary
log log (clog log), are commonly used to build specific models. There is no clear cut
method to distinguish the preference of using different link functions. Researchers
suggested that if one link function didn‘t provide a good fit to the data, then the other
link function might be a viable alternative. As a result, it was worth trying the
alternative link function to see if the model turned out to be the better one (Chen,
2004). Therefore, I used both link functions to build the best model.
90
In the first model, totally 23 explanatory variables, namely, the number of admission,
hospital admitted and 21 explanatory variables on perception of patients were
included to be analyzed. The variable on number of admission was included because
it was significantly associated with overall satisfaction in univariate analysis. The
variable on admitted hospital was also included as an interesting variable. Even
though there were originally 29 explanatory variables in the study, eight of them were
excluded from the model because of collinearity and it can cause a loss in power and
it might make interpretation more difficult. The tolerance and VIF, which stands for
variance inflation factor, should be tested to check collinearity. The "tolerance" is
―an indication of the percent of variance in the predictor that cannot be accounted for
by the other predictors, hence very small values indicate that a predictor is redundant,
and values that are less than 0.10 may merit further investigation‖ (Chen, 2003). The
VIF is 1 / tolerance and as a rule of thumb, a variable whose VIF values is greater
than 10 may merit further investigation (Chen, 2003).
In the study, the collinearity diagnostic showed that VIF values for these eight
variables ranged between 10.454 and 24.418 which are greater than 10. Tolerance
ranged between 0.041 and 0.096.
The result of the study for the first candidate model with logit function showed that
there was significant difference for the corresponding regression coefficients across
the response categories, suggesting that the model assumption of parallel lines was
violated. (X2=222.431 with df of 72, p<0.001). (Table 5.31) Link functions are used
to form the ordinal regression models under a strong assumption of parallel lines, any
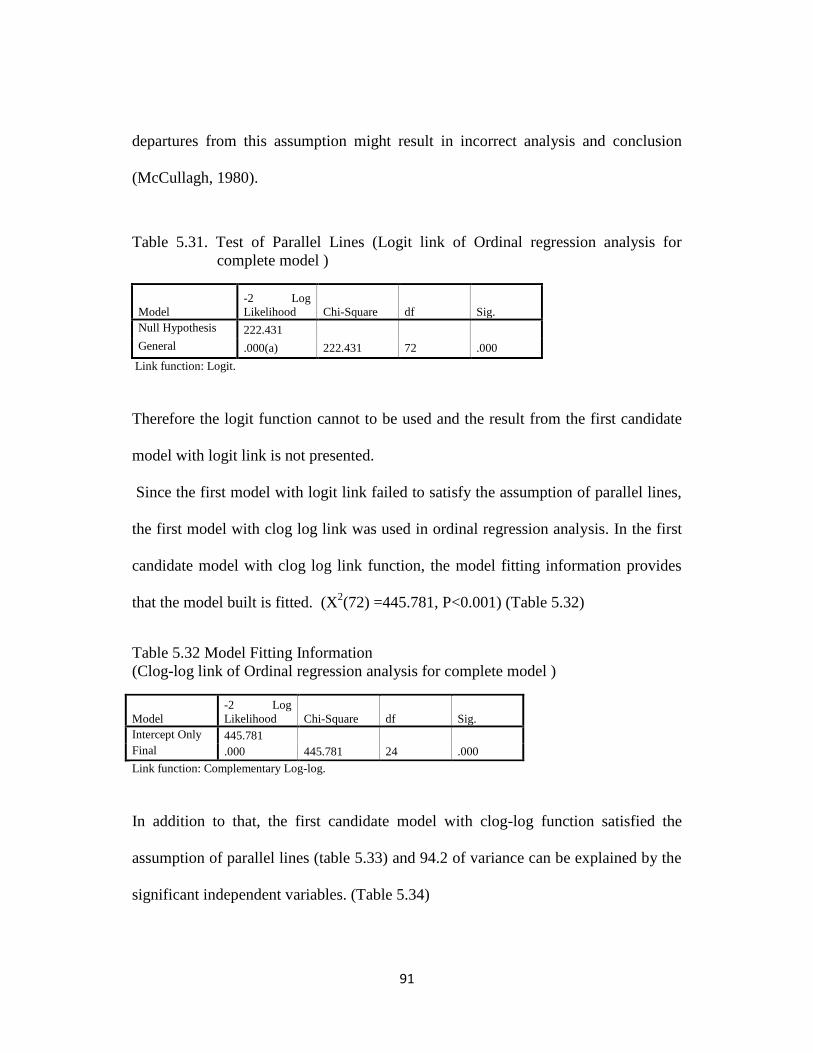
91
departures from this assumption might result in incorrect analysis and conclusion
(McCullagh, 1980).
Table 5.31. Test of Parallel Lines (Logit link of Ordinal regression analysis for
complete model )
Model
-2 Log
Likelihood Chi-Square df Sig.
Null Hypothesis 222.431
General .000(a) 222.431 72 .000
Link function: Logit.
Therefore the logit function cannot to be used and the result from the first candidate
model with logit link is not presented.
Since the first model with logit link failed to satisfy the assumption of parallel lines,
the first model with clog log link was used in ordinal regression analysis. In the first
candidate model with clog log link function, the model fitting information provides
that the model built is fitted. (X2(72) =445.781, P<0.001) (Table 5.32)
Table 5.32 Model Fitting Information
(Clog-log link of Ordinal regression analysis for complete model )
Model
-2 Log
Likelihood Chi-Square df Sig.
Intercept Only 445.781
Final .000 445.781 24 .000
Link function: Complementary Log-log.
In addition to that, the first candidate model with clog-log function satisfied the
assumption of parallel lines (table 5.33) and 94.2 of variance can be explained by the
significant independent variables. (Table 5.34)
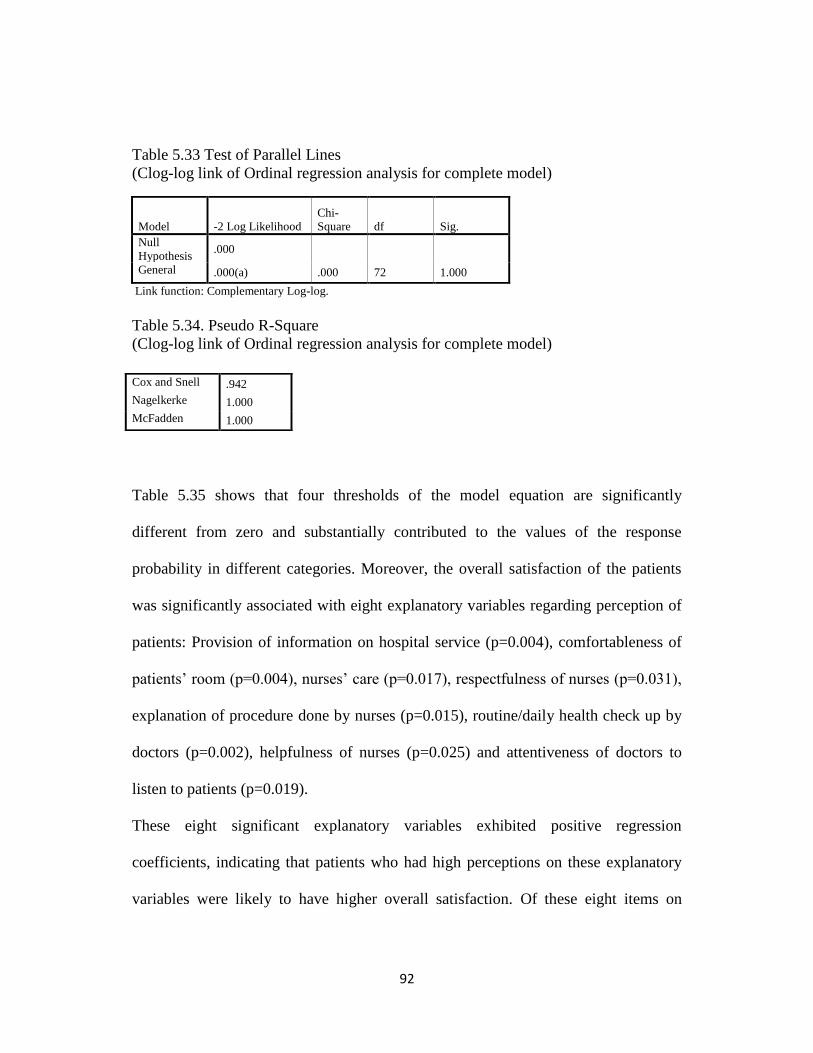
92
Table 5.33 Test of Parallel Lines
(Clog-log link of Ordinal regression analysis for complete model)
Model -2 Log Likelihood
Chi-
Square df Sig.
Null
Hypothesis .000
General .000(a) .000 72 1.000
Link function: Complementary Log-log.
Table 5.34. Pseudo R-Square
(Clog-log link of Ordinal regression analysis for complete model)
Table 5.35 shows that four thresholds of the model equation are significantly
different from zero and substantially contributed to the values of the response
probability in different categories. Moreover, the overall satisfaction of the patients
was significantly associated with eight explanatory variables regarding perception of
patients: Provision of information on hospital service (p=0.004), comfortableness of
patients‘ room (p=0.004), nurses‘ care (p=0.017), respectfulness of nurses (p=0.031),
explanation of procedure done by nurses (p=0.015), routine/daily health check up by
doctors (p=0.002), helpfulness of nurses (p=0.025) and attentiveness of doctors to
listen to patients (p=0.019).
These eight significant explanatory variables exhibited positive regression
coefficients, indicating that patients who had high perceptions on these explanatory
variables were likely to have higher overall satisfaction. Of these eight items on
Cox and Snell .942
Nagelkerke 1.000
McFadden 1.000

93
perception of patients regarding health service offered at the district hospital, 50
percent or four perception items were related to empathy, 25 percent or two
perception items were related to tangible and 12.5 percent were related to
communication and accountability dimensions, respectively.
Table 5.35 Parameter Estimates
(Clog-log link of Ordinal regression analysis for complete model )
Estimate
Std. Error
Wald
df
Sig.
95% Confidence Interval
Lower Bound
Upper
Bound
Threshold [OVSAT = 1] 7.113 1.732 16.871 1 .000 3.719 10.507
[OVSAT = 2] 9.121 1.758 26.915 1 .000 5.675 12.567
[OVSAT = 3] 11.402 1.840 38.397 1 .000 7.796 15.008
[OVSAT = 4] 13.283 1.957 46.060 1 .000 9.447 17.119
Location admission .048 .039 1.510 1 .219 -.028 .123
P1 .176 .151 1.357 1 .244 -.120 .473
P2 -.362 .222 2.649 1 .104 -.798 .074
P3 -.019 .200 .009 1 .925 -.410 .372
P4 .358 .124 8.369 1 .004 .116 .601
P5 .434 .152 8.177 1 .004 .137 .732
P7 -.067 .194 .120 1 .729 -.448 .314
P8 -.192 .162 1.408 1 .235 -.508 .125
P9 .388 .160 5.902 1 .015 .075 .702
P10 .707 .229 9.551 1 .002 .258 1.155
P11 -.032 .158 .041 1 .839 -.342 .277
P12 .008 .152 .003 1 .956 -.289 .305
P 14 .503 .224 5.025 1 .025 .063 .942
P15 -.226 .183 1.525 1 .217 -.586 .133
P16 .529 .289 3.346 1 .067 -.038 1.096
P19 -.128 .204 .393 1 .531 -.528 .272
P21 .262 .161 2.638 1 .104 -.054 .578
P22 .374 .173 4.652 1 .031 .034 .714
P25 .476 .199 5.689 1 .017 -.867 -.085
P26 .445 .190 5.499 1 .019 .073 .816
P28 -.008 .169 .002 1 .960 -.340 .323
P29 .014 .245 .003 1 .955 -.466 .493
[Hospital=1] -.397 .273 2.115 1 .146 -.932 .138
[Hospital=2] -.135 .304 .198 1 .657 -.731 .461
[Hospital=3] 0(a) . . 0 . . .
Link function: Complementary Log-log. a This parameter is set to zero because it is redundant.
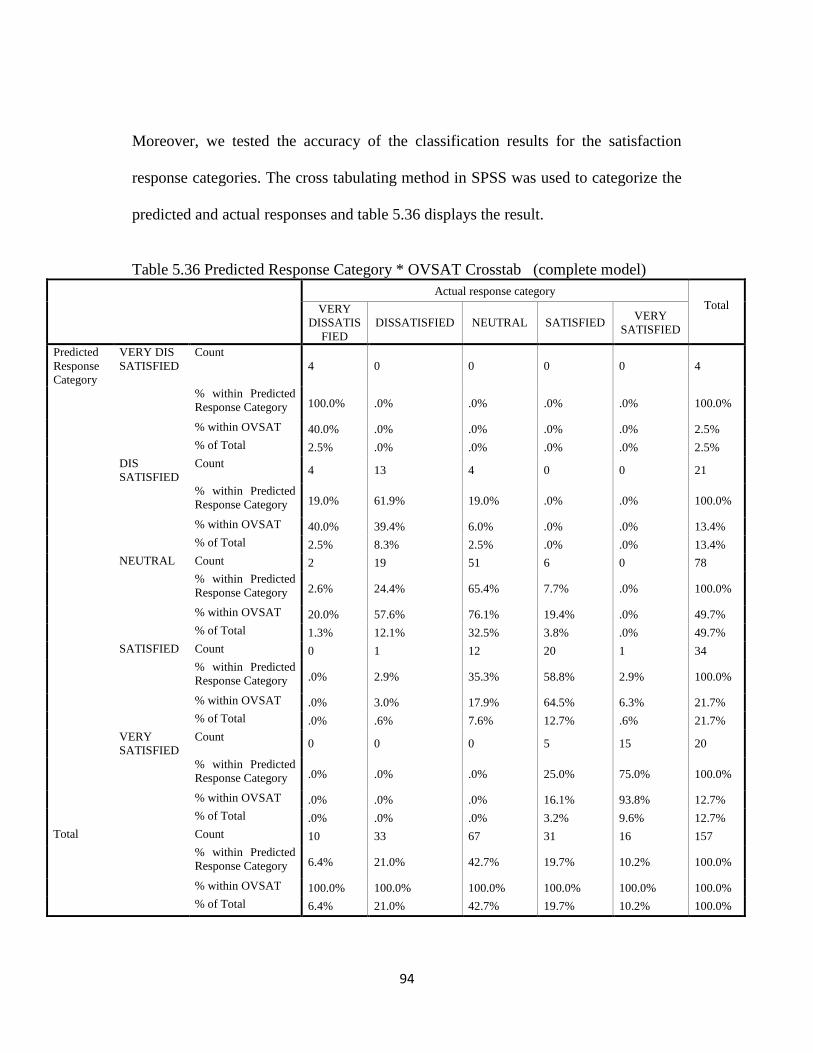
94
Moreover, we tested the accuracy of the classification results for the satisfaction
response categories. The cross tabulating method in SPSS was used to categorize the
predicted and actual responses and table 5.36 displays the result.
Table 5.36 Predicted Response Category * OVSAT Crosstab (complete model)
Actual response category
Total
VERY
DISSATIS
FIED
DISSATISFIED NEUTRAL SATISFIED VERY
SATISFIED
Predicted
Response
Category
VERY DIS
SATISFIED
Count
4 0 0 0 0 4
% within Predicted
Response Category 100.0% .0% .0% .0% .0% 100.0%
% within OVSAT 40.0% .0% .0% .0% .0% 2.5%
% of Total 2.5% .0% .0% .0% .0% 2.5%
DIS
SATISFIED
Count 4 13 4 0 0 21
% within Predicted
Response Category 19.0% 61.9% 19.0% .0% .0% 100.0%
% within OVSAT 40.0% 39.4% 6.0% .0% .0% 13.4%
% of Total 2.5% 8.3% 2.5% .0% .0% 13.4%
NEUTRAL Count 2 19 51 6 0 78
% within Predicted
Response Category 2.6% 24.4% 65.4% 7.7% .0% 100.0%
% within OVSAT 20.0% 57.6% 76.1% 19.4% .0% 49.7%
% of Total 1.3% 12.1% 32.5% 3.8% .0% 49.7%
SATISFIED Count 0 1 12 20 1 34
% within Predicted
Response Category .0% 2.9% 35.3% 58.8% 2.9% 100.0%
% within OVSAT .0% 3.0% 17.9% 64.5% 6.3% 21.7%
% of Total .0% .6% 7.6% 12.7% .6% 21.7%
VERY
SATISFIED
Count 0 0 0 5 15 20
% within Predicted
Response Category .0% .0% .0% 25.0% 75.0% 100.0%
% within OVSAT .0% .0% .0% 16.1% 93.8% 12.7%
% of Total .0% .0% .0% 3.2% 9.6% 12.7%
Total Count 10 33 67 31 16 157
% within Predicted
Response Category 6.4% 21.0% 42.7% 19.7% 10.2% 100.0%
% within OVSAT 100.0% 100.0% 100.0% 100.0% 100.0% 100.0%
% of Total 6.4% 21.0% 42.7% 19.7% 10.2% 100.0%
95
The model demonstrated high prediction accuracy
(2.5%+8.3%+32.5%+12.7%+6.9%=62.9%) for all five categories combined.
In the first model built for ordinal regression, the model was fitted (X2(72) =445.781,
P<0.001), pseudo R square was 94.2%, the assumption of parallel lines were satisfied
and accuracy of classification of response categories was 62.9%.
In the data analysis of my study, the principle of parsimony was followed. The
principle of parsimony should be applied to the model construction (Chen, 2004) and
Webster‘s dictionary defines the parsimony as ―stinginess, meaning that if fewer
explanatory variables are sufficient to explain the effects of the explanatory variables,
the regression model doesn‘t need to include unnecessary variables‖. If models
contain many explanatory variables, it could show inaccurate results and result in
instability of model structure. Based on the principle of parsimony, the reduced
model that met the screening criteria such as assumption of parallel lines, goodness of
fit of the model, higher pseudo R square and higher accuracy of classification of
response categories should be considered as the ideal model. Therefore, stepwise
ordinal regression model is used to apply the principle of parsimony to the model.
Since all perception items were univarietely associated with overall satisfaction score,
the variables which had the least effect to univarietly explain the response variable
were excluded one by one from the first model until exclusion of variable decreased
the amount of variation explained by model. At the same time, model fitting and
violation of assumption of parallel lines were tested for each model.

96
In the process of model building, totally 11 the perception items (15, 3, 10, 4, 29, 16,
8, 2, 28, 1 and 11) were excluded from the first model.
Finally, the most parsimonious model was constructed with 12 explanatory variables.
The final model with complementary clog log link function satisfies the assumption
of parallel lines (p=1.0) (table 5.39) and the model fitting information provides that
the model built is fitted. (X2(13) =445.781, P<0.001) (Table 5.37) Upon exclusion of
several variables, 94.2 of variance were still explained by the significant independent
variables. (table 5.38).
Table 5.37. Model Fitting Information
(Clog-log link of Ordinal regression analysis for parsimonious model)
Model
-2 Log
Likelihood Chi-Square df Sig.
Intercept Only 445.781
Final .000 445.781 13 .000
Link function: Complementary Log-log.
Table 5.38 Pseudo R-Square
Table 5.39 Test of Parallel Lines
(Clog-log link of Ordinal regression analysis for parsimonious model)
Model
-2 Log
Likelihood Chi-Square df Sig.
Null Hypothesis .000
General .000(a) .000 39 1.000
The null hypothesis states that the location parameters (slope coefficients) are the same across response categories.
b Link function: Complementary Log-log.
Cox and Snell .942
Nagelkerke 1.000
McFadden 1.000
97
In the final model, the overall satisfaction of the patients was significantly associated
with six explanatory variables regarding perception of patients: comfortableness of
patients‘ room (p=0.007), explanation of procedure done by nurses (p=0.003),
helpfulness of nurses (p<0.001), respectfulness of nurses (p=0.008), nurses‘ care
(p=0.004), and attentiveness of doctors to listen to patients (p=0.016).
These six significant explanatory variables showed positive regression coefficients,
indicating that patients who had higher perceptions on these explanatory variables
were likely to have higher overall satisfaction. The estimates are in ordered log odd
scale and for instance, for comfortableness of the patients‘ room, it can be said that
for one unit increase in perception score on comfortableness of room, we would
expect a 0.331 increase in the expected value of overall satisfaction in the log odds
scale, given that all of the other variables in the model are held constant. (Table 5.40)
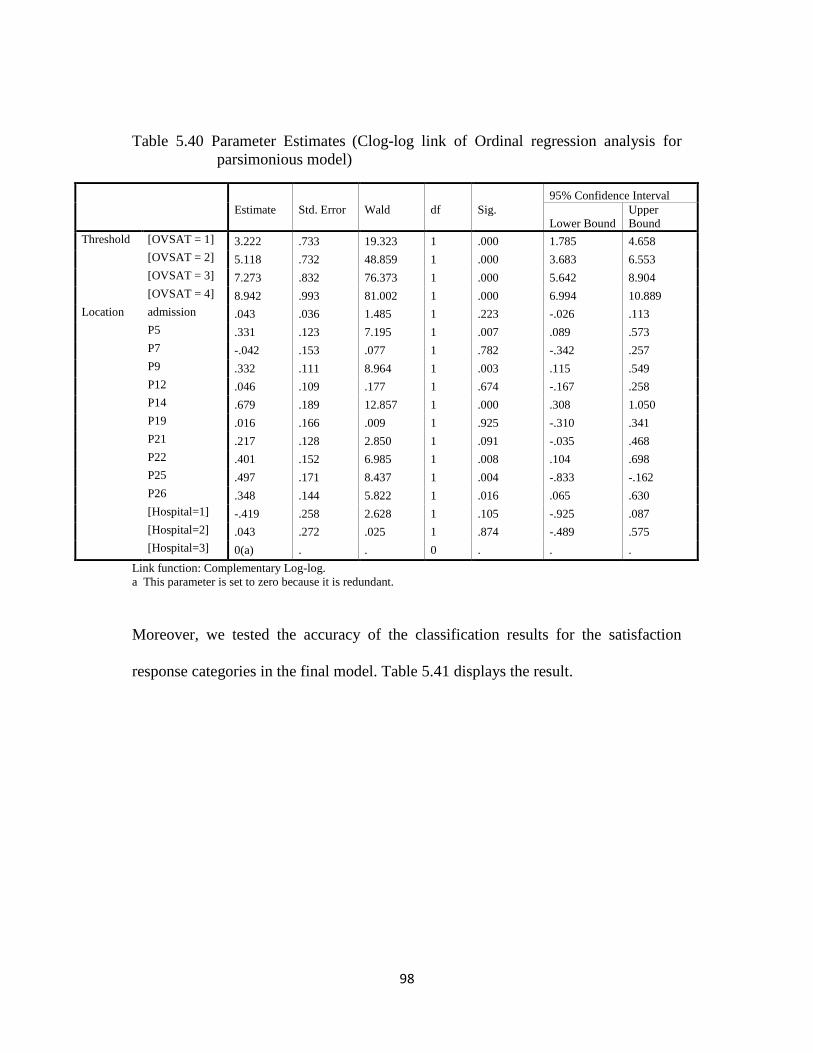
98
Table 5.40 Parameter Estimates (Clog-log link of Ordinal regression analysis for
parsimonious model)
Estimate
Std. Error
Wald
df
Sig.
95% Confidence Interval
Lower Bound
Upper
Bound
Threshold [OVSAT = 1] 3.222 .733 19.323 1 .000 1.785 4.658
[OVSAT = 2] 5.118 .732 48.859 1 .000 3.683 6.553
[OVSAT = 3] 7.273 .832 76.373 1 .000 5.642 8.904
[OVSAT = 4] 8.942 .993 81.002 1 .000 6.994 10.889
Location admission .043 .036 1.485 1 .223 -.026 .113
P5 .331 .123 7.195 1 .007 .089 .573
P7 -.042 .153 .077 1 .782 -.342 .257
P9 .332 .111 8.964 1 .003 .115 .549
P12 .046 .109 .177 1 .674 -.167 .258
P14 .679 .189 12.857 1 .000 .308 1.050
P19 .016 .166 .009 1 .925 -.310 .341
P21 .217 .128 2.850 1 .091 -.035 .468
P22 .401 .152 6.985 1 .008 .104 .698
P25 .497 .171 8.437 1 .004 -.833 -.162
P26 .348 .144 5.822 1 .016 .065 .630
[Hospital=1] -.419 .258 2.628 1 .105 -.925 .087
[Hospital=2] .043 .272 .025 1 .874 -.489 .575
[Hospital=3] 0(a) . . 0 . . .
Link function: Complementary Log-log.
a This parameter is set to zero because it is redundant.
Moreover, we tested the accuracy of the classification results for the satisfaction
response categories in the final model. Table 5.41 displays the result.
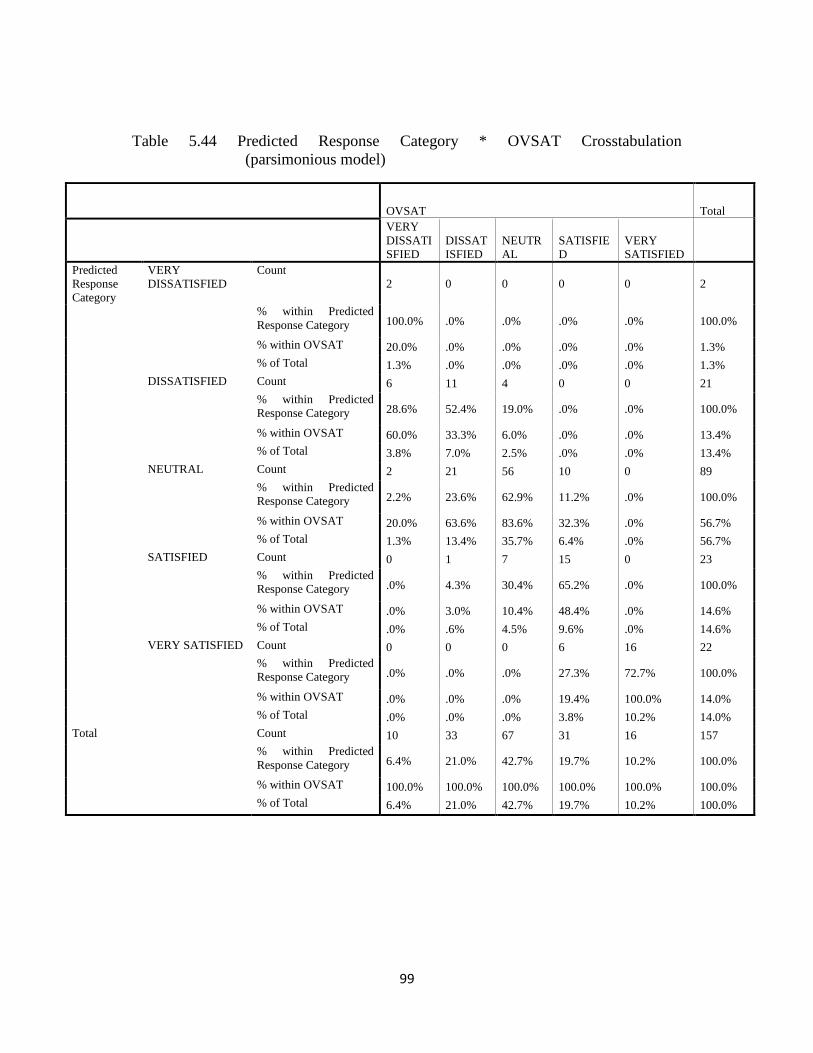
99
Table 5.44 Predicted Response Category * OVSAT Crosstabulation
(parsimonious model)
OVSAT Total
VERY
DISSATI
SFIED
DISSAT
ISFIED
NEUTR
AL
SATISFIE
D
VERY
SATISFIED
Predicted
Response
Category
VERY
DISSATISFIED
Count
2 0 0 0 0 2
% within Predicted
Response Category 100.0% .0% .0% .0% .0% 100.0%
% within OVSAT 20.0% .0% .0% .0% .0% 1.3%
% of Total 1.3% .0% .0% .0% .0% 1.3%
DISSATISFIED Count 6 11 4 0 0 21
% within Predicted
Response Category 28.6% 52.4% 19.0% .0% .0% 100.0%
% within OVSAT 60.0% 33.3% 6.0% .0% .0% 13.4%
% of Total 3.8% 7.0% 2.5% .0% .0% 13.4%
NEUTRAL Count 2 21 56 10 0 89
% within Predicted
Response Category 2.2% 23.6% 62.9% 11.2% .0% 100.0%
% within OVSAT 20.0% 63.6% 83.6% 32.3% .0% 56.7%
% of Total 1.3% 13.4% 35.7% 6.4% .0% 56.7%
SATISFIED Count 0 1 7 15 0 23
% within Predicted
Response Category .0% 4.3% 30.4% 65.2% .0% 100.0%
% within OVSAT .0% 3.0% 10.4% 48.4% .0% 14.6%
% of Total .0% .6% 4.5% 9.6% .0% 14.6%
VERY SATISFIED Count 0 0 0 6 16 22
% within Predicted
Response Category .0% .0% .0% 27.3% 72.7% 100.0%
% within OVSAT .0% .0% .0% 19.4% 100.0% 14.0%
% of Total .0% .0% .0% 3.8% 10.2% 14.0%
Total Count 10 33 67 31 16 157
% within Predicted
Response Category 6.4% 21.0% 42.7% 19.7% 10.2% 100.0%
% within OVSAT 100.0% 100.0% 100.0% 100.0% 100.0% 100.0%
% of Total 6.4% 21.0% 42.7% 19.7% 10.2% 100.0%

100
The model demonstrated high prediction accuracy
(1.3%+7%+35.7%+9.6%+10.2%=63.8%) for all five categories combined and it has
higher accuracy than in the first model.
The reduced model with complementary log log link appeared to be the best model in
my study and based on the model fitting statistics, the accuracy of classification
results and the principle of parsimony. Therefore the result of study was presented
within the best model.
Finally, I tested the association between overall satisfaction of the patients and their
willingness to recommend the district hospital to others.
Non-parametric correlation (table 5.41) test showed that there was a strong
correlation between overall satisfaction of the patients and their willingness to
recommend the district hospital to others. (r=0.753)
Table 5.41 Correlations between intention to recommend hospitals and overall
satisfaction
OVSAT RECCOM
Spearman's rho OVSAT Correlation Coefficient 1.000 .753(**)
Sig. (2-tailed) . .000
N 157 157
** Correlation is significant at the 0.01 level (2-tailed).
In the framework of the whole data analysis of the study, firstly I presented the
characteristics of sample; secondly, I analyzed the SERVQUAL instrument and

101
finally searched what perception items on healthcare services offered at hospital were
significantly associated with overall patients‘ satisfaction and patients‘ intention to
recommend the district hospital to others depending on their overall satisfaction.

102
CHAPTER SIX
DISCUSSION OF THE FINDINGS
The current study examined the perceived quality of healthcare services as indicated
by the difference between patients‘ expectations and actual experience. This study
also addressed the significant elements of patient perception influencing their overall
satisfaction with healthcare services provided at district hospitals in Ulaanbaatar city,
Mongolia.
The result of this study provides insights to both health care providers and hospital
managers to improve service quality and patient satisfaction in the hospital
environment in Mongolia.
Theoretically, the model identifies several quality elements influencing patients‘
satisfaction in district hospitals in Mongolia and the factor analysis of SERVQUAL
instrument identified seven dimensions which represent patient-centered service
quality indicators in the hospital setting.
Additional research is needed, however, replication and refinement of model is
necessary. Over time and with identification of additional variables, it might be
possible to introduce patient-driven quality standards to enable service providers to
better address patients‘ needs. However, it should be kept in mind that patients'
beliefs, perceptions and expectations cannot be fully captured in a questionnaire.
Therefore, the use of qualitative research along quantitative methods in future studies
103
would provide a better understanding of the complex issue of quality in the health
care sector.
The current analysis revealed areas in which hospitals were close to meeting patients'
expectations and areas in which hospitals fall far short of expectations.
First, the descriptive measures of expectations and perceptions of patients as well as
quality gap in district hospitals require some attention.
Patients had the highest expectation from the assurance factor which covers the issues
of doctors‘ competence and nurses‘ skill. It clearly shows that doctors' competence,
nurses‘ skill, and their ability to show confidence and security in their patients turned
out to be the most critical services.
Patients also highly evaluated doctors‘ competence and nurses‘ skills. On the
contrary, the result of the study done by Health Department of Ulaanbaatar city in
2009 showed that doctor‘s and nurses‘ of district hospitals have lack of theoretical
knowledge on area in which they are working. Therefore, hospital managers
shouldn‘t be satisfied with result of the current study and need to pay attention to
doctors‘ and nurses‘ competence and knowledge through conducting frequent
external and internal audit because patients‘ judgment on that concern might not be
objective due to unfamiliarity of patients with most of the medical procedures they
are receiving.

104
Accountability, which refers to daily/routine health check-up, privacy and
confidentiality, follows. The third highest expectation is for the dimension of
empathy issues which is related to helpfulness, respectfulness, and attentiveness of
doctors and nurses.
Generally, patients have high expectations (Minimum mean score is 6.06 when 7
point Likert scale is used where 4 represents a neutral point) on all dimensions of
quality of healthcare services. However, the high expectations of patients have been
anticipated and it is also in line with previous studies in the field (Taner & Antony,
2006). A possible explanation is that there is a difficulty defining the adequate and
the desired level of expectations on service quality due to the distinctive
characteristics of the health care services, and its complex and risky nature.
Patients also appear to have high perceptions on the subject of doctor‘s routine health
check up and tidiness of staff. It might be because the routine health check-up is a
part of doctor‘s duty and doctors are monitored on whether or not they carry out their
duties. Keeping personal hygiene is also their responsibility. Therefore, routine
check-up and tidiness of staff might show high perceptions.
On the contrary, patients‘ evaluations suggest that they are disappointed regarding the
quality of healthcare services in relation to care provided by nurse and respect shown
by doctors and nurses which are included in empathy dimension. Particularly,
patients of the district hospital are more sensitive to nursing elements especially
nursing care and they graded their service low. It can be explained that the number of
patients per nurse is greater than per doctor and nurses are overworked because beds
105
in district hospitals are mostly fully occupied. Moreover, patients more frequently
experience nursing care rather than doctor‘s care in daily healthcare service. This
might be another reason that nursing care and respectfulness of nurses are lowly
perceived by patients.
The patients have low perceptions on comfortableness of patients‘ rooms and
availability of modern equipment in district hospital. The study conducted by the
Health Department of UB city also showed that most of the equipment was outdated
in hospitals. Patients pointed out that patients influence each other‘s comfort because
there are many patients (six to eight patients) in one room. Once there are six to eight
patients in one room, it is clear that patients complain about their discomfort because
patients are heterogeneous in terms of their lifestyle and behavior. For example,
some patients go to bed early while others are used to sleeping late. In addition to that,
food amount, quality and service in district hospitals are poor. Thus, almost every
patient brings food from their home. There are no certain schedules for visit and a
specific place to have a meal, and patients tend to eat their meal in their room. It leads
to some difficulties and discomfort for other patients. First, Mongolians usually share
their food with others and they feel inconvenient to have a meal alone. It is also
complicated for visitors to decide how much food to prepare. Second, Mongolian
food is mostly prepared with meat and the smell is quite strong. Therefore, patients‘
rooms sometimes would turn into a canteen not a hospital because of the smell.
In general, expectations of patients were higher than their perceptions and it shows
that there is room for quality improvement initiatives in all seven dimensions. The
106
largest quality gaps are in the empathy dimension including elements on nursing care,
respectfulness of doctors and nurses. Doctors‘ and staffs' neat appearance present the
less problematic elements of the service quality in district hospital.
Second, it appears that the patients‘ perception and their satisfaction might depend on
their age, gender, self reported health status, length of the stay, number of admissions
to the hospital and types of hospital.
However, the result of the study showed no significant relationship between age,
gender, occupation, education, self reported health status and length of stay in
hospital. Our result is consistent with some studies; however, other studies found a
significant relationship between age (Williams & Calnan, 1991), gender (Cooper-
Patrick et al., 1999), education (Zemenchuk et al., 1996; Kareem, 1996) and patients‘
satisfaction as well as perceptions. (Mummalaneni & Gopalakrishna,1995). This
disparity between studies might be explained by the fact that patients‘ needs and
desires (or wishes) are shaped by their socio-cultural system in which the health care
system is founded (Calnan, 1988) and it is conceivable that health care consumer
behavior may also vary from one culture/nation to another.
Service satisfaction and dissatisfaction are indeed subject to cultural and personal
issues. Thus, studies in different contexts can vary.
107
The number of admissions into the hospital has a great influence on patients‘
satisfaction and perceptions. Patients who were admitted for the first time have lower
perception and less satisfaction with their hospital experience than those who had
been admitted more than 12 times. A possible reason is that patients who were
admitted for the first time might be more critical of the healthcare services than those
who had been admitted several times. Moreover, these patients who had been
admitted several times might be accustomed to healthcare services provided by
district hospitals. This may reflect the more realistic opinion of people who had been
admitted many times and how they feel toward the health care system based on their
accumulated experiences with healthcare services. Or perhaps as people experience
the healthcare services many times, they may just become less critical of healthcare
services. Other surveys have also suggested that people accustomed to staying in
hospitals might have different opinions compared to patients who are previously
unfamiliar with a hospital service (Carman, 2000).
Patients‘ perceptions differed across the three district hospitals. However, the patients‘
expectations of the healthcare services provided by district hospitals were similar.
Four out of seven quality dimensions were highly perceived by patients who were
admitted into the Bayanzurkh district hospital compared to patients admitted into the
other district hospitals. It can be explained that in the framework of privatization
reform, under a management contract with Ulaanbaatar Health Department, some
financial authorizations such as spending out of pocket expenses was given to
108
Bayanzurkh hospital for the first time among the district hospitals. Therefore, more
attention might have been paid to patient oriented services.
Third, our final parsimonious regression model revealed six significant elements
influencing patients‘ satisfaction. The comfort of the patients‘ room significantly
influences their overall satisfaction. It is consistent with other studies, for instance,
the study by Andaleeb (2001) found that tangibles such as comfort and clean
environment played a crucial role in patient satisfaction. Many other studies indicated
the importance of tangible dimension as a critical indicator of the customer
satisfaction (Parasuraman et al., 1985: 1988; Carr-Hill 1992).
It is also noteworthy that the results of the studies in developing countries such as
Bangladesh and Vietnam found the importance of tangible dimension for satisfaction
with healthcare services, while patients of developed countries such as Singapore,
Taiwan, South Korea, and USA are less sensitive for tangible elements such as
comfort of the room, clean hospital environment, and modern equipment. Our study
results might be no exception for this. Generally speaking, it is true that a comfortable
environment helps them relax and deal better with their anxieties.
According to the result, explanation of procedure done by nurses has great influence
on patient satisfaction. During service process, patients have a high degree of
uncertainty and an insufficient knowledge about medical care and detailed
explanation by service providers will also help customers to better understand how

109
the service operates. Therefore, importance of improvement in information efficiency
shouldn‘t be neglected in hospital service setting.
Further, empathetic service such as nursing care, respectfulness and helpfulness of
nurses had a significant influence on patients‘ overall satisfaction. However, doctors‘
attentiveness had an enormous positive impact on satisfaction. Unfortunately, many
healthcare providers in district hospitals seem to forget how important these issues
can be to patients. Even though patients require doctors to pay attention to them,
considering the estimates/parameters of the model their satisfaction depends more on
nursing elements. Estimate coefficient is higher (0.401-0.679) for nursing elements.
As previously mentioned in this chapter, a significant relationship between those
nursing elements and patients‘ satisfaction can be explained by the fact that patients
might experience more with nurses rather than doctors in daily service.
Other studies also agree that the relationship between staff and patients could lead to
a greater customer satisfaction. (Zifko-Baliga & Krampf, 1997; Polluste et al., 2000;
Ramsey & Sohi, 1997; Kim et al., 2001).
Interestingly, even though the patients considered that the professional skills of
doctors and nurses were crucial in the delivery of medical care and rated it as high,
this factor did not have a strong influence on patient satisfaction. Patients could
probably not evaluate technical skills and made their judgments based on their own
impressions.
110
Forth, our study results discovered that patients who were satisfied with the hospital
service have strong inclination to recommend that hospital to other patients. This
makes our results to be in-line with some other studies (Elleuch, 2008).
Finally, similar research is suggested to be carried out among patients who get
admitted in tertiary level hospitals by themselves and those who have been admitted
in both secondary and tertiary level hospitals to reveal whether or not there is any
disparity in perceived quality of healthcare services between secondary and tertiary
level hospitals. Although many patients are bypassing the secondary level hospital
(district hospital) and are admitted to tertiary level hospital by paying certain penalty
fee, occupancy rate is still high in secondary level hospitals. Taking into account of
this situation, it is possible that the cases which should be treated in district hospitals
are admitted to tertiary level hospitals and many unnecessary cases are admitted in
district hospitals to fully occupy beds in order to get full budget because the budget is
allocated according to bed occupancy in district hospital. If district hospitals can play
a gate keeping role in inpatient service, it is not only possible to decrease workload in
tertiary level hospitals but also health expenditure in hospital care will be decreased.
111
CHAPTER SEVEN
CONCLUSIONS AND RECOMMENDATIONS
Conclusions of the study
The main goal of this research is to study the perceived quality of healthcare services
and the relationship between the perception and satisfaction of patients with
healthcare services provided at district hospitals of Ulaanbaatar city, Mongolia. Based
on finding of the study, the following conclusions are drawn:
1. Expectations of patients regarding healthcare services provided by district
hospitals are generally high. Most importantly, patients expect to be provided
with healthcare services by competent doctors and skillful nurses in district
hospital. On the other hand, waiting time for admission and availability of
modern equipment were among lesser concerns by patients of district hospital.
2. Routine health check-up of patients obtained the highest perception.
Assurance factor including doctors‘ competence and nurses‘ skill also
obtained high perceptions from patients. Patients also had high perceptions
regarding cleanliness of hospital and tidiness of staff.
3. Patients lowly evaluated tangible elements such as comfortableness of
patients‘ room and availability of modern equipment. Empathy dimensions
including nursing care, respectfulness of doctors and nurses also obtained the
lowest perceptions of patients in district hospital.
112
4. Service quality gaps in all dimensions including tangible, responsiveness,
reliability, empathy, communication, assurance and accountability exist in
district hospitals of Ulaanbaatar city, Mongolia. Especially, the respectfulness
of doctors/nurses, nursing care and comfort of the patients‘ room indicated the
largest quality gaps in district hospital. On the other hand, cleanliness of
hospital and tidiness of staff almost match patients‘ expectations and
perceptions. Daily health check up of doctors also had a small quality gap.
5. Patients who had been admitted in hospital for the first time had lower
perceptions on and are less satisfied with overall healthcare services than
others. Patients who had been admitted more than 12 times had higher
perceptions regarding overall healthcare services as well as they are more
satisfied with service. No other background factors such as age, gender
education and occupation appeared to influence perception and satisfaction of
patients.
6. Patients‘ satisfaction significantly depend on empathetic services such as
nursing care, respectfulness of nurses, helpfulness of nurses and attentiveness
of doctors to patients. The level of comfort in the patients‘ room also has a
great influence on patient satisfaction.
7. Patients who were satisfied with healthcare services were more likely to
recommend district hospitals to others.
113
Recommendations
The current findings provide a guideline for healthcare provider and hospital
managers for the allocation of efforts to maximize patient satisfaction and to improve
the perceived quality of healthcare services. Based on the findings of the study, a
number of reccomendations have been suggested.
1. Considering that empathy dimension shows large quality gap and significantly
influences patient satisfaction, employee satisfaction in concert with patient
satisfaction might be crucial because satisfied employees provide more
empathetic service (Zeithaml & Bitner, 2000). In this regard, even though,
low salary and work overload are creating less job satisfaction, it is suggested
that hospitals could improve satisfaction among the healthcare providers
within hospitals‘ capacity. For example, providing patients with opportunity
to anonymously share their opinion and complain about service provided by
their healthcare providers‘ can be a good method to collect information on
behavior and attitude healthcare providers. Then incentives can be given to
healthcare providers who didn‘t receive any complain regarding their
behavior and attitude.
2. The regular feedback from patients (or their caregivers) can be integrated in
the healthcare delivery system and the quality of healthcare service can be
effectively monitored through patients‘ voice to bring improvements in

114
behaviors reflected in the doctor and nurse composites. It is also suggested
that the satisfaction scores can be used in performance appraisal.
3. Concerning the comfort of patients‘ room, establishing one room as a canteen
to have a meal or to meet visitors in district hospitals might be an optimal
solution since it is not possible to reconstruct patients‘ room.

115
APPENDIX
The questionnaire:
We are assessing the quality of healthcare provided at district hospitals of
Ulaanbaatar city, Mongolia. This study will greatly contribute to defining the ways
how to improve the quality of healthcare services in district hospitals. We would like
to ask you to share your opinions about healthcare service you received in this
hospital.
The questionnaire is anonymous and information you provided here will be kept
confidentially.
Part 1. General Information
1. The admitted hospital
a. Chingeltei District Hospital
b. Bayanzurkh District Hospital
c. Nalaikh District Hospital
d. SBDH
2. Age…………
3. Gender
a. Male
b. Female
4. Occupation
a. Student in high school
b. Student in University
c. Work in Public Sector
d. Work in Private sector
e. Unemployed
f. Retired
g. Others…………………

116
5. Education level
a. High school
b. College
c. University
6. How many times have you been admitted in this hospital? ……
7. How many days have you been staying in hospital? ……………
8. Self reported health status
a. Mild
b. Moderate
c. Severe
9. Is your health condition improved?
a. Yes
b. No
c. Worsened
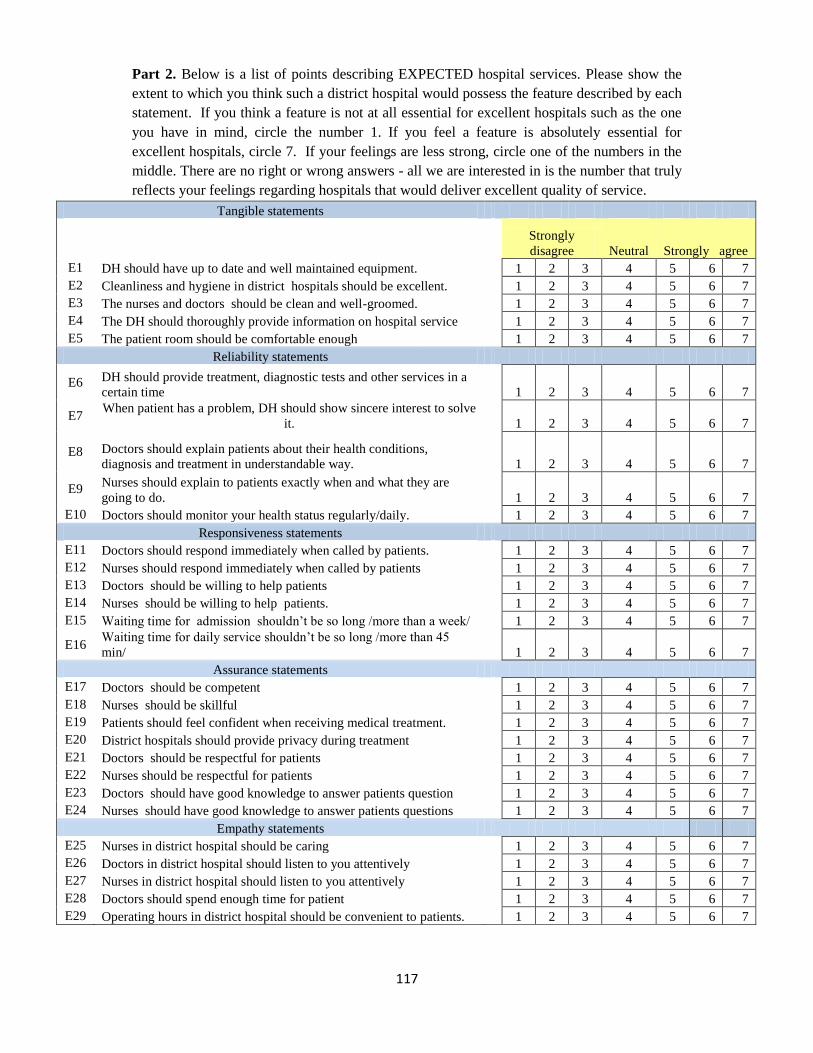
117
Part 2. Below is a list of points describing EXPECTED hospital services. Please show the
extent to which you think such a district hospital would possess the feature described by each
statement. If you think a feature is not at all essential for excellent hospitals such as the one
you have in mind, circle the number 1. If you feel a feature is absolutely essential for
excellent hospitals, circle 7. If your feelings are less strong, circle one of the numbers in the
middle. There are no right or wrong answers - all we are interested in is the number that truly
reflects your feelings regarding hospitals that would deliver excellent quality of service.
Tangible statements
Strongly
disagree Neutral Strongly agree
E1 DH should have up to date and well maintained equipment.
1 2 3 4 5 6 7
E2 Cleanliness and hygiene in district hospitals should be excellent.
1 2 3 4 5 6 7
E3 The nurses and doctors should be clean and well-groomed.
1 2 3 4 5 6 7
E4 The DH should thoroughly provide information on hospital service
1 2 3 4 5 6 7
E5 The patient room should be comfortable enough
1 2 3 4 5 6 7
Reliability statements
E6 DH should provide treatment, diagnostic tests and other services in a
certain time
1 2 3 4 5 6 7
E7 When patient has a problem, DH should show sincere interest to solve
it.
1 2 3 4 5 6 7
E8 Doctors should explain patients about their health conditions,
diagnosis and treatment in understandable way. 1 2 3 4 5 6 7
E9 Nurses should explain to patients exactly when and what they are
going to do. 1 2 3 4 5 6 7
E10 Doctors should monitor your health status regularly/daily.
1 2 3 4 5 6 7
Responsiveness statements
E11 Doctors should respond immediately when called by patients.
1 2 3 4 5 6 7
E12 Nurses should respond immediately when called by patients
1 2 3 4 5 6 7
E13 Doctors should be willing to help patients
1 2 3 4 5 6 7
E14 Nurses should be willing to help patients.
1 2 3 4 5 6 7
E15 Waiting time for admission shouldn‘t be so long /more than a week/
1 2 3 4 5 6 7
E16 Waiting time for daily service shouldn‘t be so long /more than 45
min/
1 2 3 4 5 6 7
Assurance statements
E17 Doctors should be competent
1 2 3 4 5 6 7
E18 Nurses should be skillful
1 2 3 4 5 6 7
E19 Patients should feel confident when receiving medical treatment.
1 2 3 4 5 6 7
E20 District hospitals should provide privacy during treatment
1 2 3 4 5 6 7
E21 Doctors should be respectful for patients
1 2 3 4 5 6 7
E22 Nurses should be respectful for patients
1 2 3 4 5 6 7
E23 Doctors should have good knowledge to answer patients question
1 2 3 4 5 6 7
E24 Nurses should have good knowledge to answer patients questions
1 2 3 4 5 6 7
Empathy statements
E25 Nurses in district hospital should be caring
1 2 3 4 5 6 7
E26 Doctors in district hospital should listen to you attentively
1 2 3 4 5 6 7
E27 Nurses in district hospital should listen to you attentively
1 2 3 4 5 6 7
E28 Doctors should spend enough time for patient
1 2 3 4 5 6 7
E29 Operating hours in district hospital should be convenient to patients. 1 2 3 4 5 6 7
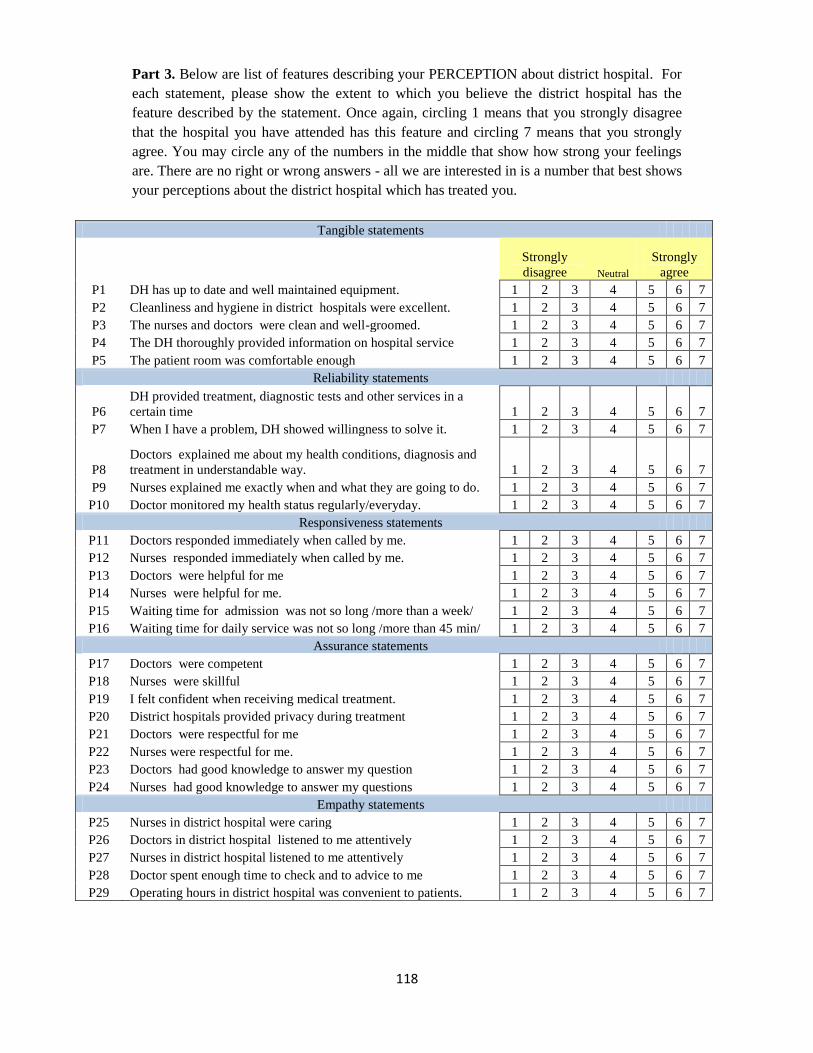
118
Part 3. Below are list of features describing your PERCEPTION about district hospital. For
each statement, please show the extent to which you believe the district hospital has the
feature described by the statement. Once again, circling 1 means that you strongly disagree
that the hospital you have attended has this feature and circling 7 means that you strongly
agree. You may circle any of the numbers in the middle that show how strong your feelings
are. There are no right or wrong answers - all we are interested in is a number that best shows
your perceptions about the district hospital which has treated you.
Tangible statements
Strongly
disagree Neutral
Strongly
agree
P1 DH has up to date and well maintained equipment. 1 2 3 4 5 6 7
P2 Cleanliness and hygiene in district hospitals were excellent. 1 2 3 4 5 6 7
P3 The nurses and doctors were clean and well-groomed. 1 2 3 4 5 6 7
P4 The DH thoroughly provided information on hospital service 1 2 3 4 5 6 7
P5 The patient room was comfortable enough 1 2 3 4 5 6 7
Reliability statements
P6
DH provided treatment, diagnostic tests and other services in a
certain time 1 2 3 4 5 6 7
P7 When I have a problem, DH showed willingness to solve it. 1 2 3 4 5 6 7
P8
Doctors explained me about my health conditions, diagnosis and
treatment in understandable way. 1 2 3 4 5 6 7
P9 Nurses explained me exactly when and what they are going to do. 1 2 3 4 5 6 7
P10 Doctor monitored my health status regularly/everyday. 1 2 3 4 5 6 7
Responsiveness statements
P11 Doctors responded immediately when called by me. 1 2 3 4 5 6 7
P12 Nurses responded immediately when called by me. 1 2 3 4 5 6 7
P13 Doctors were helpful for me 1 2 3 4 5 6 7
P14 Nurses were helpful for me. 1 2 3 4 5 6 7
P15 Waiting time for admission was not so long /more than a week/ 1 2 3 4 5 6 7
P16 Waiting time for daily service was not so long /more than 45 min/ 1 2 3 4 5 6 7
Assurance statements
P17 Doctors were competent 1 2 3 4 5 6 7
P18 Nurses were skillful 1 2 3 4 5 6 7
P19 I felt confident when receiving medical treatment. 1 2 3 4 5 6 7
P20 District hospitals provided privacy during treatment 1 2 3 4 5 6 7
P21 Doctors were respectful for me 1 2 3 4 5 6 7
P22 Nurses were respectful for me. 1 2 3 4 5 6 7
P23 Doctors had good knowledge to answer my question 1 2 3 4 5 6 7
P24 Nurses had good knowledge to answer my questions 1 2 3 4 5 6 7
Empathy statements
P25 Nurses in district hospital were caring 1 2 3 4 5 6 7
P26 Doctors in district hospital listened to me attentively 1 2 3 4 5 6 7
P27 Nurses in district hospital listened to me attentively 1 2 3 4 5 6 7
P28 Doctor spent enough time to check and to advice to me 1 2 3 4 5 6 7
P29 Operating hours in district hospital was convenient to patients. 1 2 3 4 5 6 7

119
Part 4.
Generally, how are you satisfied with healthcare services provided at
district hospitals?
1 Very dissatisfied
2 Dissatisfied
3 Neutral
4 Satisfied
5 Very satisfied
Thank you for your participation in our study.
120
References
1. Andaleeb, S.S. (2001). Service quality perceptions and patient satisfaction: a
study of hospitals in a developing country. Journal of Social Science & Medicine,
Vol 52 (9), pp.1359-1370
2. Babakus, E., & Mangold, W.G. (1992). Adapting the SERVQUAL scale to
hospital services: an empirical investigation. Health Services Research, Vol. 26
(6), pp.767-86.
3. Bayarsaikhan, D., & Kwon, S. (2005). Development of social health insurance in
Mongolia: Successes, challenges and lessons. International Social Security
Review, Vol 58 (4), pp.27-44.
4. Beatty, Sharon E., Morris Mayer, James E. Coleman, Kirsty E. Ellis, and Jungki
Lee (1996), Customer-Sales Associate Retail Relationships. Journal of Retailing,
Vol 72 (3), pp.223-247.
5. Bergman, B; & Klefsjo, B. (1994). Quality: from Customer Needs to Customer
Satisfaction. NY: McGraw-Hill.
121
6. Blumenthal, D. (1996). Quality of care-What is it? New England Journal of
Medicine, Vol 335, pp.891-894.
7. Bojanic, D.C. (1991). Quality Measurement in Professional Services Firms.
Journal of Professional Services Marketing, Vol 7 (2), pp.27-36.
8. Bolormaa,T., et al. (2007). Mongolia: Health system review. Health Systems in
Transition. 9(4), pp 1–151.
9. Bopp, K.D. (1990). How patients evaluate the quality of ambulatory medical
encounters: a marketing perspective. Journal of Health Care Marketing, Vol. 10
(1), pp. 6-15.
10. Bowers, M.R., & Swan, J.E., Koehler, W. (1994). What attributes determine
quality and satisfaction with health care delivery? Health Care Management
Review, Vol. 19 (4), pp.49-55.
11. Brook, R.H.,& Appel, F.A. (1973). Quality-of-care assessment: Choosing a
method for peer review. New England Journal of Medicine Vol 288 (25),
pp.1323-1329.

122
12. Brown, S.W., & Swartz, Teresa A. A. (1989). Gap Analysis of Professional
Service Quality. Journal of Marketing, Vol 53 (2), pp.92-98.
13. Calnan, (1988). Towards a conceptual framework of lay evaluation of health care.
Journal of Social Science & Medicine, Vol 27 (9), pp.927-933
14. Campbell, S.M., Roland, S.O., & Buetow, S.A. (2000). Defining quality of care.
Journal of Social Science & Medicine, Vol. 51, pp 1611-1625.
15. Carman, J.M. (2000). Patient perceptions of service quality: combining the
dimensions. Journal of Services Marketing, Vol 14 (4), pp.337-352
16. Carr-Hill, R.A. (1992). The measurement of patient satisfaction. Journal of
Public Health, Vol 14 (3), pp. 236-249
17. Chen, C.K., & John, H.Jr. (2004). Using Ordinal Regression Model to Analyze
Student Satisfaction Questionnaires. IR applications, Vol 1, pp 1-12
18. Chen, X., Ender, P., Mitchell, M. & Wells, C. (2003). Regression with SPSS,
Retrieved from http://www.ats.ucla.edu/stat/spss/webbooks/reg/default.htm.
19. Choi, K.S., Hanjoon Lee., Chankon Kim., & Sunhee Lee. (2005). The service
quality dimensions and patient satisfaction relationships in South Korea:
123
comparisons across gender, age and types of service. Journal of Services
Marketing, Vol. 19 (3), pp 140-149.
20. Cleary, P. D., & McNeil, B. J. (1988). Patient satisfaction as an indicator of
quality care. Inquiry, Vol 25, pp.25–36.
21. Coe Robert, (2000). What is an ‗Effect Size‘?. Retreived from:
http://www.cemcentre.org/renderpage.asp?linkid=30325016
22. Cohen, J.W. (1988). Statistical power analysis for the behavioral sciences (2nd
ed). New York: Erlbaum
23. Collier, D. A. (1994). The service quality solution. Milwaukee, WI: Irwin
Professional Publishing.
24. Cooper-Patrick, L. et al. (1999). Race, Gender, and Partnership in the Patient-
Physician Relationship. JAMA, Vol 282 (6), 583-589.
25. Cronin, J. Joseph. & Taylor, Steven. A. (1992). Measuring Service Quality: A
Reexamination and Extension. Journal of Marketing, Vol 56(3), pp.55-68.

124
26. Curry, A., & Sinclair, E. (2002). Assessing the quality of physiotherapy services
using SERVQUAL. International Journal of Health Care Quality Assurance,
Vol. 15 (4/5), pp.197-204.
27. Dagger, T.S, Jillian, C. S., & Lester, W. J. (2007). A Hierarchical Model of
Health Service Quality: Scale Development and Investigation of an Integrated
Model. Journal of Service Research, Vol 10 (2), pp.123-142.
28. Davies, A.R., & Ware, J.E. (1988) Involving consumers in quality of care
assessment. Journal Health Affairs, Vol 7, pp.33-46.
29. Davies, B., Baron, S., Gear, T., & Read, M. (1999). Measuring and managing
service quality, Marketing Intelligence & Planning, Vol. 17 (1), pp.33-40.
30. Donabedian, A. (1982). Explorations in quality assessment and monitoring: The
criteria and standards of quality, Vol. 2. MI: Health Administration Press
31. Donabedian, A. (1988). The quality of care: How can it be assessed? JAMA, Vol
260, p.1743-1748.
32. Donabedian, A. (1992). Quality assurance in health care: a consumers' role.
Quality of Health Care, Vol 1, pp.247-251.
125
33. Duggirala, D., Rajendran, C., & Anantharaman, R.N. (2008). Patient perceived
dimensions of total quality service in healthcare. Benchmarking: An International
Journal, Vol. 15 (5), pp.560-83.
34. Elleuch, A. (2008). Patient satisfaction in Japan. International Journal of Health
Care Quality Assurance, Vol 21 (7), 692-705.
35. Evans, J.R; & Lindsay, W.M. (1996). The Management and Control of Quality,
Cincinnati: West Publishing Company.
36. Foster, T. (2001), Managing Quality: An Integrative Approach, Prentice - Hall,
Upper Saddle River, NJ: An-Najah Libraries
37. Fuentes, M. C. (1999), Measuring hospital service quality: a methodological
study. Managing Service Quality, Vol. 9 (4), pp.230-40.
38. Gerelmaa, L. (2009). Study of patient satisfaction: Comparative analysis between
public and private hospitals of Ulaanbaatar city (Master‘s thesis, Ritsumeikan
Asia Pacific University, 2009).
126
39. Goldstein, S. M., & Schweikhart, S. B. (2002). Empirical support for the Baldrige
award framework in U.S. hospitals. Health Care Management Review, Vol 27(1),
pp.62–75.
40. Gooding, S.K.S. (1995). Quality, sacrifice, and value in hospital choice. Journal
of Health Care Marketing, Vol. 15 (4), pp.24-31.
41. Grönroos, C. (1984). A service quality model and its implications. European
Journal of Marketing, Vol. 8, pp.36-44.
42. Gronroos, C. (1990). Service Management and Marketing: managing the
moments of truth in service competition. Lexington: Lexington Books
43. Grönroos, C. (2000), Service Management and Marketing – A Customer
Relationship Management Approach, Wiley: Chichester.
44. Gummesson, E; & Gronroos, C. (1988). Quality of Services: Lessons From the
Product Sector. In: Surprenant, C. Add Value to Your Service: the key to success
(pp 35-39). Chicago: American Marketing Association.
127
45. Hair, J.F., Anderson, R.E., Tatham, R.L., & Black, W.C. (1995). Multivariate
data analysis (4th ed.): with readings. Upper Saddle River, NJ, USA: Prentice-
Hall, Inc
46. Hall, J. A. & M. C. Dornan. (1990). Patient socio-demographic characteristics as
predictors of satisfaction with medical care: a meta-analysis. Social Science and
Medicine, Vol 30, pp. 811-818.
47. Harrington, L., & Pigman, H. (2008). Quality Measurement. In Prathibha
Varkey, Medical Quality Management: Theory and Practice (29-40). USA:Jones
and Bartlett Publishers, LLC, and American College of Medical Quality.
48. Jabnoun, N., & Chaker, M. (2003). Comparing the quality of private and public
hospitals. Managing Service Quality, Vol. 13 (4), pp.290-300.
49. Kane, R. L., Maceijewski, M., & Finch, M. (1997). The relationship of patient
satisfaction with care and clinical outcomes. Medical Care, Vol 35(7), pp. 714–
730.
50. Karassavidou, E.(ND). Health Care Quality in Greek NHS Hospitals: No one
knows better than patients.

128
Retrieved from: http://www.ep.liu.se/ecp/033/039/ecp0803339.pdf
51. Kareem, A. A., Aday, A., & Walker, G. (1996). Patient satisfaction in
government health facilities in the state of Qatar. Journal of community health,
Vol 21, pp.349–58.
52. Kim, W.G., Han, J.S., Lee, E. (2001). Effects of relationship marketing on repeat
purchase and word of mouth. Journal of Hospitality & Tourism Research, Vol. 25
(3), pp.272-88
53. Lam, S.S.K. (1997). SERVQUAL: a tool for measuring patients' opinions of
hospital service quality in Hong Kong. Total Quality Management, Vol. 8 (4),
pp.145-53.
54. Lewis, R.C. & Booms, B.H. The Marketing Aspects of Service Quality. (1983) In:
Berry, L.L.; Shostack, G.L; & Upah, G.D. Emerging Perspectives on Service
Marketing (pp 99-107). Chicago: American Marketing Association.
55. Li, L. X.,& Collier, D. A. (2000). The role of technology and quality on hospital
financial performance. International Journal of Service Industry Management,
Vol 11(3), pp.202–224.

129
56. Lim, P.C., & Nelson, K.H. (2000). A study of patients‘ expectations and
satisfaction in Singapore hospitals. International Journal of Health Care Quality
Assurance, Vol. 13 (7), pp. 290-299.
57. Luke, G. J. (2007). An assessment of the service quality expectations and
perceptions of the Awali Hospital in the Kingdom of Bahrain. (Master‘s thesis,
Rhodes Investec Business School, 2008) Retrieved from
http://eprints.ru.ac.za/1177/1/MBA_Dissertation_2008_Final_Document_Submit
ed.pdf
58. Martinez Fuentes, C. (1999). Measuring hospital service quality: a
methodological study. Managing Service Quality, Vol. 9 (4), pp.230-40.
59. McCullagh, P. (1980). Regression Models for Ordinal Data. Journal of the Royal
Statistical Society, Vol 42, pp. 109-142
60. McGlynn, E.A. (1995), Quality assessment of reproductive health services.
Western Journal of Medicine, Vol. 163 (3), pp.19-37.
61. Mejabi, O.V., & Olujide, J.O. (2008). Dimensions of Hospital Service Quality in
Nigeria. European Journal of Social Sciences, Vol. 5 (4), pp 141-159.
130
62. Michael, C. L., Lucie K. O., & Walter, L. L. (2001). Patients‘ Perceptions of
Service Quality Dimensions: An Empirical Examination of Health Care in New
Zealand. Health Marketing Quarterly, Vol 19 (1), pp.3-22.
63. Ministry of Health and National Center for Health Development. (2006). Annual
health report 2005. Ulaanbaatar, Mongolia
64. Ministry of Health and National Center for Health Development. (2008), Health
Indicators 2008, Ulaanbaatar, Mongolia
65. MoH. (2005). Health sector strategic master plan 2006–2015. Ulaanbaatar: Core
Group, Ministry of Health.
66. Mostafa, M.M. (2005). An empirical stud of patients' expectations and
satisfactions in Egyptian hospitals. International Journal of Health Care Quality
Assurance, Vol. 18 (6), pp.516-531
67. Mummalaneni, V., & Gopalakrishna, P. (1995). Mediators vs. moderators of
patient satisfaction: the role of socio-demographic characteristics might be less
significant than previously thought. Journal of Health Care Marketing, Vol. 15,
pp. 16-23.

131
68. Murfin, D.E., Bobo, B. S., & Adamantios Diamantopoulos. (1995). Perceived
Service Quality and Medical Outcome: An Interdisciplinary Review and
Suggestions for Future Research. Journal of Marketing Management, Vol 11,
pp.97-117.
69. Newcome, L.N. (1997). Measuring of trust in health care. Health Affairs, Vol. 16
(1), pp.50-51
70. Nunnaly, J. (1978). Psychometric theory. New York: McGraw-Hill
71. O‘Connor, S. J., Shewchuk, R. M., & Carney, L. W. (1994). The great gap.
Journal of Health Care Marketing, Vol 14 (2), pp.32–39.
72. O‘Connor, S., & Shewchuk, R. (1989). The influence of perceived hospital
service quality on patient satisfaction and intentions to return. Academy of
ManagementProceedings, pp.95–99.
73. Øvretveit, J. (1992). Health Service Quality, Blackwell, Oxford.
74. Parasuraman, A., Zeithaml, V. A., & Berry, L.L. (1994). Reassessment of
Expectations as a Comparison Standard in Measuring Service Quality:
Implications for Further Research. Journal of Marketing, Vol 58 (1), pp.111-124.
132
75. Parasuraman, A., Zeithaml, V.A., & Berry, L.L. (1985). A conceptual model of
service quality and its implications for future research. Journal of Marketing,
Vol. 49 ( 4), pp. 41-50.
76. Parasuraman, A., Berry, L.L. & Zeithaml, V.A. (1991). Understanding Customer
Expectations of Service. Sloane Management Review, Spring, pp.39-48.
77. Parasuraman, A., Berry, L.L. & Zeithaml, Valarie A. (1988). SERVQUAL: A
Multiple-Item Scale for Measuring Consumer Perceptions of Service Quality,
Journal of Retaling, Vol 64 (1), pp.12-40.
78. Parasuraman, A., Zeithaml, V.A. & Berry, L.L. (1988), SERVQUAL : a multiple-
item scale for measuring consumer perceptions of service quality. Journal of
Retailing, Vol. 64 (2), pp. 12-37.
79. Pendleton, D., Schofield, T., Tate, P., & Havelock, P. (1984). The Consultation:
An Approach to Learning and Teaching, Oxford University Press, Oxford.
80. Petersen, M. B. H. (1988). Measuring patient satisfaction: collecting useful data.
Journal of Nursing Quality Assurance,2 (3), pp.25–35.

133
81. Pickering, E. (1991). New approaches to hospital accreditation. Pan American
Health Organization, World Health Organization, and Latin American
Federation of Hospitals. Quality Assessment: Hospital Accreditation for Latin
America and the Caribbean, Kumarian Press, Bloomfield, CT, pp 1-8.
82. Polluste, K., Kalda, R., & Lember, M. (2000). Primary health care system in
transition: the patient's experience. International Journal for Quality in Health
Care, Vol 12, pp.503-509
83. Pui-Mun Lee., PohWah Khong., & Dhanjoo, N. G. (2006), Impact of deficient
healthcare service quality. The TQM Magazine Vol. 18 (6), pp. 563-571.
84. Ramsey, R., & Sohi, R. (1997). Listening to your customers: the impact of
perceived salesperson listening behavior on relationship outcomes. Journal of the
Academy of Marketing Science, Vol. 25, pp.127-37.
85. Reidenbach, R.E., & Sandifer-Smallwood, B. (1990). Exploring perceptions of
hospital operations by a modified SERVQUAL approach. Journal of Health
Care Marketing, Vol. 10 (4), pp.47-55.
134
86. Rohini, R. & Mahadevappa, B. (2006). Service Quality in Bangalore Hospitals:
An Empirical Study. Journal of Services Research, Vol 6 (1), pp 59-84.
87. Sasser, W., Olsen, R. P. & Wyckoff, D.D. (1978). Management of Service
Operations: text, cases, and readings. Boston: Allyn & Bacon.
88. Silvestro, R. (2005). Applying gap analysis in the health service to inform the
service improvement agenda. International Journal of Quality & Reliability
Management, Vol 22, (3), pp 215-233.
89. Smith, M., Meth Engelbrecht. (ND), Developing a Tool to assess Client
Satisfaction at District Hospitals, Technical Report 14 , South Africa: Health
Systems Trust.
90. Sohail, M.S. (2003). Service quality in hospitals: more favorable than you might
think. Managing Service Quality, Vol. 13 (3), pp.197-207.
91. Sower,V., Duffy, J., Kilbourne,W.,Kohers, G.,& Jones, P. (2001). The
dimensions of service quality for hospitals: Development and use of the KQCAH
scale. Health Care Management Review, Vol 26(2), pp.47–59.
135
92. SSIGO. (2006). Social insurance statistical compilation. Ulaanbaatar: State
Social Insurance General Office.
93. Stefen, G. E. (1988). Quality medical care: A defnition. JAMA, Vol 260, pp.56-
61.
94. Taner, T., & Antony, J. (2006). Comparing public and private hospital care
service quality in Turkey. Leadershp in Health Services, Vol. 19 (2), pp. 1-10.
95. Tarlov, A. R., Ware, J. E., Greenfeld, S., Nelson, E. C.,Perrin, E., & Zubkof, M.
(1989). The medical outcomes study: An application of methods for monitoring
the results of medical care. JAMA, Vol 262, pp.925-930.
96. Taylor, S.A., & Cronin, J.J. (1994). Modelling patient satisfaction and service
quality, Journal of Health Care Marketing, Vol. 14 (1). pp.34-44.
97. Tomes, A. & Ng, S.C.P. (1995). Service quality in hospital care: the
development of in-patient questionnaire. International of Health Care Quality
Assurance, Vol. 8 (3), pp. 25-33.

136
98. Ulaanbaatar Health Department. (2005). Niisleliin hyn amiin eruul mendiin
uzuulelt [Health indicators of people of the capital city]. Ulaanbaatar:
Ulaanbaatar Health Department.
99. Webster, C. (1989). Can consumers be segmented on the basis of their service
quality expectations? Journal of Services Marketing, Vol. 3 (2), pp. 35-53.
100. Weitzman, B.C. (1995). In: Kovner, A.R. Health care delivery in the United
States, (5thed.). Berlin: Springer.
101. Wiggers, John H., Kathleen O, Donovan., Selina Redman., & Rob W, Sanson-
Fisher. (1990). Cancer Patient Satisfaction with Care. Cancer, Vol 66, pp. 610-
616.
102. Williams, S.J., & Calnan, M. (1991). Convergence and divergence: assessing
criteria of consumer satisfaction across general practice, dental and hospital care
settings. Journal of Social Science & Medicine, Vol 33 (6), pp. 707-716.
103. Woodside, A.G., & Shinn, R. (1988). Consumer awareness and preference
toward competing hospital services. Journal of Health Care Marketing, Vol. 8
(1), pp.39-47.
137
104. Youssef, F.N., Nel, D., & Bovaird, T. (1996). Health-care quality in NHS
hospitals. International Journal of Health Care Quality Assurance, Vol. 9 (1),
pp.15-28.
105. Zeithaml, V. A., & Bitner, M. J. (2000). Services marketing. New York:
McGraw-Hill.
106. Zeithaml, V.A. (1988). Consumer perceptions of price, quality and value: a
means-end model and synthesis of evidence. Journal of Marketing, Vol. 52, pp.2-
22.
107. Zemencuk, J. et al. (1996). Patients‘ desires and expectations for medical care:
a challenge to improving patient satisfaction. American journal of medical quality,
Vol 14, pp.21–27.
108. Zifko-Baliga, G. M., & Krampf, R. F. (1997). Managing perceptions of
hospital quality. Marketing Health Services, Vol 17(1), pp.28–35.
109. Zineldin, M. (2006). The quality of health care and patient satisfaction: An
exploratory investigation of the 5Qs model at some Egyptian and Jordanian

138
medical clinics. International Journal of Health Care Quality Assurance, Vol. 19
(1), pp 60-92.


![Wearabletech in healthcare ebook - [x]cube LABS](https://static.fdocuments.us/doc/165x107/5790538b1a28ab900c8ca97b/wearabletech-in-healthcare-ebook-xcube-labs.jpg)