The PEERSIST Project: Promoting Engineering Persistence … · Paper ID #33752 The PEERSIST...
16
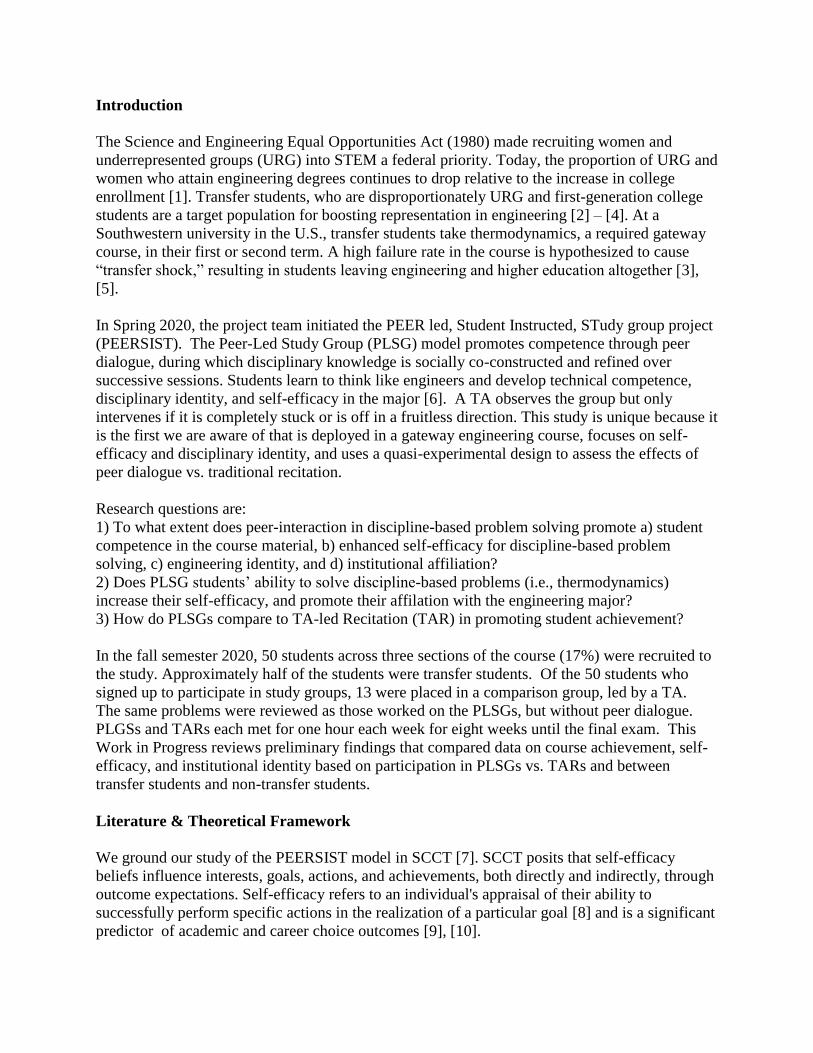
Paper ID #33752 The PEERSIST Project: Promoting Engineering Persistence Through Peer- led Study Groups Ms. Thien Ngoc Y Ta, Arizona State University Thien Ta is a doctoral student of Engineering Education Systems and Design at Arizona State University. She obtained her B.S., and M.S. in Mechanical Engineering. She has taught for Cao Thang technical college for seven years in Vietnam. She is currently a graduate research associate for the Entrepreneurial Mindset initiative at the Ira A. Fulton Schools of Engineering at Arizona State University. Her doctoral research focuses on Entrepreneurship Education and Innovation in Vietnam and in the U.S. Dr. Gary Lichtenstein, Arizona State University Gary Lichtenstein, Ed.D., Director of Program Effectiveness for the Entrepreneurial Mindset initiative at the Ira A. Fulton Schools of Engineering at Arizona State University. He is also and founder and principal of Quality Evaluation Designs, a firm specializing in research and evaluation for K-12 schools, universities, and government and non-profit organizations nationwide. He specializes in entrepreneurship education, research and evaluation methods, and STEM retention. Cody D Jenkins, Arizona State University Dr. Karl A. Smith, University of Minnesota - Twin Cities Emeritus Professor of Civil, Environmental, and Geo- Engineering, and Morse-Alumni Distinguished University Teaching Professor at the University of Minnesota; and Cooperative Learning Professor of En- gineering Education, School of Engineering Education, at Purdue University. E-mail: [email protected], web: https://karlsmithmn.org/ Dr. Ryan James Milcarek, Arizona State University Ryan Milcarek is an Assistant Professor of Mechanical Engineering in the School for Engineering of Matter, Transport and Energy at Arizona State University. He obtained his B.S., M.S. and Ph.D. in the Mechanical and Aerospace Engineering Department at Syracuse University. His current research is focused on microcombustion, manufacturing of ceramic materials for solid oxide fuel cells (SOFCs), and energy modeling. He also conducts research in engineering education in areas of sustainability, resilience and fuel cell education. Dr. Samantha Ruth Brunhaver, Arizona State University Samantha Brunhaver is an Assistant Professor of Engineering in the Fulton Schools of Engineering Poly- technic School. Dr. Brunhaver recently joined Arizona State after completing her M.S. and Ph.D. in Mechanical Engineering at Stanford University. She also has a B.S. in Mechanical Engineering from Northeastern University. Dr. Brunhaver’s research examines the career decision-making and professional identity formation of engineering students, alumni, and practicing engineers. She also conducts studies of new engineering pedagogy that help to improve student engagement and understanding. c American Society for Engineering Education, 2021
Transcript of The PEERSIST Project: Promoting Engineering Persistence … · Paper ID #33752 The PEERSIST...
Paper ID #33752
The PEERSIST Project: Promoting Engineering Persistence Through Peer-ledStudy Groups
Ms. Thien Ngoc Y Ta, Arizona State University
Thien Ta is a doctoral student of Engineering Education Systems and Design at Arizona State University.She obtained her B.S., and M.S. in Mechanical Engineering. She has taught for Cao Thang technicalcollege for seven years in Vietnam. She is currently a graduate research associate for the EntrepreneurialMindset initiative at the Ira A. Fulton Schools of Engineering at Arizona State University. Her doctoralresearch focuses on Entrepreneurship Education and Innovation in Vietnam and in the U.S.
Dr. Gary Lichtenstein, Arizona State University
Gary Lichtenstein, Ed.D., Director of Program Effectiveness for the Entrepreneurial Mindset initiativeat the Ira A. Fulton Schools of Engineering at Arizona State University. He is also and founder andprincipal of Quality Evaluation Designs, a firm specializing in research and evaluation for K-12 schools,universities, and government and non-profit organizations nationwide. He specializes in entrepreneurshipeducation, research and evaluation methods, and STEM retention.
Cody D Jenkins, Arizona State UniversityDr. Karl A. Smith, University of Minnesota - Twin Cities
Emeritus Professor of Civil, Environmental, and Geo- Engineering, and Morse-Alumni DistinguishedUniversity Teaching Professor at the University of Minnesota; and Cooperative Learning Professor of En-gineering Education, School of Engineering Education, at Purdue University. E-mail: [email protected],web: https://karlsmithmn.org/
Dr. Ryan James Milcarek, Arizona State University
Ryan Milcarek is an Assistant Professor of Mechanical Engineering in the School for Engineering ofMatter, Transport and Energy at Arizona State University. He obtained his B.S., M.S. and Ph.D. inthe Mechanical and Aerospace Engineering Department at Syracuse University. His current research isfocused on microcombustion, manufacturing of ceramic materials for solid oxide fuel cells (SOFCs), andenergy modeling. He also conducts research in engineering education in areas of sustainability, resilienceand fuel cell education.
Dr. Samantha Ruth Brunhaver, Arizona State University
Samantha Brunhaver is an Assistant Professor of Engineering in the Fulton Schools of Engineering Poly-technic School. Dr. Brunhaver recently joined Arizona State after completing her M.S. and Ph.D. inMechanical Engineering at Stanford University. She also has a B.S. in Mechanical Engineering fromNortheastern University. Dr. Brunhaver’s research examines the career decision-making and professionalidentity formation of engineering students, alumni, and practicing engineers. She also conducts studies ofnew engineering pedagogy that help to improve student engagement and understanding.
c©American Society for Engineering Education, 2021

The PEERSIST Project: Promoting Engineering Persistence
through Peer-Led Study Groups
Thien Ta1, Cody Jenkins1, Gary Lichtenstein1, Ryan James
Milcarek1, Samantha R. Brunhaver1, Karl A Smith2
1Arizona State University 2University of Minnesota, Twin Cities
Introduction
The Science and Engineering Equal Opportunities Act (1980) made recruiting women and
underrepresented groups (URG) into STEM a federal priority. Today, the proportion of URG and
women who attain engineering degrees continues to drop relative to the increase in college
enrollment [1]. Transfer students, who are disproportionately URG and first-generation college
students are a target population for boosting representation in engineering [2] – [4]. At a
Southwestern university in the U.S., transfer students take thermodynamics, a required gateway
course, in their first or second term. A high failure rate in the course is hypothesized to cause
“transfer shock,” resulting in students leaving engineering and higher education altogether [3],
[5].
In Spring 2020, the project team initiated the PEER led, Student Instructed, STudy group project
(PEERSIST). The Peer-Led Study Group (PLSG) model promotes competence through peer
dialogue, during which disciplinary knowledge is socially co-constructed and refined over
successive sessions. Students learn to think like engineers and develop technical competence,
disciplinary identity, and self-efficacy in the major [6]. A TA observes the group but only
intervenes if it is completely stuck or is off in a fruitless direction. This study is unique because it
is the first we are aware of that is deployed in a gateway engineering course, focuses on self-
efficacy and disciplinary identity, and uses a quasi-experimental design to assess the effects of
peer dialogue vs. traditional recitation.
Research questions are:
1) To what extent does peer-interaction in discipline-based problem solving promote a) student
competence in the course material, b) enhanced self-efficacy for discipline-based problem
solving, c) engineering identity, and d) institutional affiliation?
2) Does PLSG students’ ability to solve discipline-based problems (i.e., thermodynamics)
increase their self-efficacy, and promote their affilation with the engineering major?
3) How do PLSGs compare to TA-led Recitation (TAR) in promoting student achievement?
In the fall semester 2020, 50 students across three sections of the course (17%) were recruited to
the study. Approximately half of the students were transfer students. Of the 50 students who
signed up to participate in study groups, 13 were placed in a comparison group, led by a TA.
The same problems were reviewed as those worked on the PLSGs, but without peer dialogue.
PLGSs and TARs each met for one hour each week for eight weeks until the final exam. This
Work in Progress reviews preliminary findings that compared data on course achievement, self-
efficacy, and institutional identity based on participation in PLSGs vs. TARs and between
transfer students and non-transfer students.
Literature & Theoretical Framework
We ground our study of the PEERSIST model in SCCT [7]. SCCT posits that self-efficacy
beliefs influence interests, goals, actions, and achievements, both directly and indirectly, through
outcome expectations. Self-efficacy refers to an individual's appraisal of their ability to
successfully perform specific actions in the realization of a particular goal [8] and is a significant
predictor of academic and career choice outcomes [9], [10].

Figure 1 shows the most recent iteration of the SCCT framework adapted to study PEERSIST
outcomes [11]. Students with greater confidence in their technical competence and more positive
expectations for completing an engineering degree are thought to, in turn, demonstrate greater
achievement, increased commitment, and eventual completion of their degrees. In this way,
SCCT provides a means to address our research questions about the PEERSIST model’s impact
on students’ cognitive outcomes and persistence.
Fig. 1. SCCT framework [11] adapted to study PEERSIST outcomes
Engineering identity is strongly related to and influenced by engineering self-efficacy [12]. We
locate engineering identity in our SCCT model, similar to recent work investigating the role of
perceived science competence and science identity in the career intentions of URG students [13],
[14].
We hypothesize that PLSGs will effectively provide engineering transfer students with social
support that, in turn, promotes institutional and major persistence in ways consistent with social
cognitive career theory (SCCT).
Study Design
Treisman’s approach has been implemented at several institutions [15], [16], [17]. Our project
differs in four critical ways: we (1) utilize the PEERSIST model in an engineering context, (2)
extend beyond student achievement to also measure self-efficacy beliefs, (3) employ a virtual
platform to accommodate the unique work and personal circumstances of transfer students and
(4) compare PLSG results to a TA-led study group.
After piloting the method with four students in Spring 2020, the project was expanded in Fall
2020 to three sections of the course, which enrolled a total of 300 students. After receiving their
first exam scores, students were invited to participate in study groups. Students in the PLSGs
worked together to solve moderate to extremely difficult problems chosen by the faculty. These
were not necessarily problems students encountered in homework or exams. The point was for
students to develop a schema for solving thermodynamics problems and cultivate a discipline-
based mindset co-constructed through dialogue and interaction with peers. The course TA was

present but only intervened when students were completely stumped or off-base in their
approach. We hypothesized that this approach would increase students’ course competence and,
therefore, boost their engineering self-efficacy and outcome expectations and promote greater
identification with both engineering and ASU. Students in the comparison group were presented
the same problems, but solutions were worked out by the TA, without the social interaction of
PLSGs [18]. We anticipated these students to demonstrate an increase in course achievement
without the same increases in self-efficacy, outcome expectations, or identity gained by students
in PLSGs.
Study Sample
Thermodynamics is a required course for undergraduates enrolled in mechanical and aerospace
engineering and an elective for civil engineers. The course is typically taken in the junior year, so
it is often the first university course taken by transfer students. These students typically
comprise 96% of the class. Some students enroll from other engineering programs and a very
few from non-engineering majors. Students were recruited after receiving their first exam scores,
and they were placed in PLSGs or TARs based on their time availability. Thirty-seven students
were placed in PLSGs, and 13 were placed in TARs.
Data Collection
Data collection followed an explanatory mixed-methods design (i.e., pre/post surveys and course
exam scores, followed with post-course interviews). All data were collected according to ASU
IRB Protocol # 00012577.
Demographic Questionnaire
Students were asked about their traits and background contextual affordances (Table 1).
Demographic questions included gender (binary and other), race/ethnicity (URG vs. non-URG),
transfer status, first-generation status, and mother’s education as a proxy for socioeconomic
status (SES). These variables would act as controls in the study.
Pre/Post Survey
Survey data were collected via Qualtrics from all students participating in the PLSGs and the
comparison group. The pre-survey was administered after students received their scores on the
first exam, and the post-survey was deployed after the last study group session but before the
final exam. Surveys were anonymous, and data were not accessible to the instructors (Co-PI
Milcarek and other instructors). In the pre-survey, each student created a personal code that only
they knew, and they also used this code for the post-survey so that we could link these surveys
together. As a result, the student’s identity is not known, but the pre/post surveys can be linked
for the same student. Three instruments (1-3, below) comprised the survey and took
approximately 5-10 minutes to complete. Each section of the survey provided data to
operationalize study variables identified in the PEERSIST model (Fig. 1), namely, engineering
self-efficacy, engineering identity, institutional identity, and supports and barriers.
(1) Engineering Self-Efficacy Beliefs. Three items comprised this variable, adapted for this study
from Lent et al. [19]: confidence to (1) pass all remaining technical courses in the engineering
major, (2) pass all remaining design courses in the engineering major, and (3) graduate with an

engineering bachelor degree. Since the students’ remaining major courses at ASU consisted of
technical and design courses, the first two items covered the predominant competencies required
to complete the major. The third item was hypothesized to cover all other degree requirements or
summarize the first two responses. Items were measured on a five-point Likert scale, with
response options from 1=Not confident, 3=Moderately confident, 5=Extremely confident [20].
(2) Supports and Barriers. We adapted Lent et al.’s [20] measure of Social Supports and Barriers
related to majoring in engineering for this variable. Students were asked to rate each of eight
supports/barriers (e.g., “I have sufficient money for tuition and/or school or expenses,” “I have
classmates and/or friends that I can go to for help with engineering course work”) in their pursuit
of their engineering major. Responses were measured on a five-point Likert scale, from
1=Strongly disagree, 3=Neither agree nor disagree, 5=Strongly agree.
Course Exam Scores
Student exam scores served as a proxy for course achievement. The first of four exams occurred
before the study groups began.
Post-course Interview
The Graduate Research Assistant (lead author) interviewed four PLSG students after they
completed the Thermodynamics course. Each interview lasted approximately 15 minutes via
Zoom and was audio-recorded. Questions focused on students’ (1) motivations for joining the
study group, (2) perceptions of their course grade and whether/how the study group influenced
their grade, (3) impressions of other members in the study group, (4) opinions about the most
valuable and least helpful parts of the study group and (5) reflections on how participating in the
study group changed their confidence in completing the engineering degree and their feelings
about being a student at ASU. Pseudonyms were given to participants to ensure the
confidentiality of the interview.
Results
There were 22/50 respondents for the post-survey (response rate of 44%). Of these, 16 could be
matched to the pre-survey, due to the fact that some students did not use the same personal code
that they generated on the pre-survey. Of the 16, 14 had been placed in PLSGs, and one had
been placed in TARs (one student did not identify a group).
Table 2 presents the significant correlations among the post-survey items. The item asking if the
Study Groups helped students succeed in Thermodynamics is moderately correlated to their
confidence in completing the engineering degree, their perceived likelihood of passing their
remaining technical courses, design courses, completing the engineering degree, and how
connected students feel to the engineering major. In other words, the higher the rating students
chose for the helpfulness of the Study Groups, the higher students’ confidence and likelihood in
completing their engineering degree. Study Groups' helpfulness is also associated with students’
feeling of being connected to the engineering major. However, we cannot be sure of the
directionality of these findings.

Table 1
Demographic Characteristics of Post-Survey Respondents
Number of
Responses =22
--Number of Peer-led
students =21
--Number of TA-led
students =1
Race/ Ethnicity URG -- 10
Majority in STEM --11
Prefer not to state --1
Mother’s Degree Up to 11th grade -- 6
High school equivalent
--3
Associate’s certificate,
or vocational program
--3
Bachelor's -- 6
Master's --2
Ph.D., Law, or Medical
degree --1
N/A or Don’t know --1
Semester at ASU
1st -- 3
2nd -- 1
3rd -- 10
4th -- 0
5th --7
6th -- 1
7th -- 0
First Generation -- 11
(9/11 have Mother Degree
high school or less; 8/11
URG)
Program Mechanical Eng. --11
Aerospace Eng. -- 6
Civil Eng. -- 5
Transferred to ASU -- 11
(8/11 are first-generation,
6/11 have Mother Degree
high school or less, 5/11
URG)
First time taking
Thermodynamics
--20
Faculty support and classmate/friend support moderately correlated with student confidence and
likelihood items (r value ranges from 0.429 to 0.462, and p value ranges from 0.03 to 0.046). In
other words, the more support students received from faculty and/or classmates or friends, the
more confidence and the likelihood they had in passing their remaining technical courses, design
courses, and completing the engineering degree.
There are high correlations between each pair of the six items asking about student confidence in
completing the engineering degree and their perceived likelihood in passing their remaining
technical courses, design courses, and completing the engineering degree. Lent and Brown [20]
advised operationalizing confidence and likelihood as two separate variables. High correlations
in this sample suggest that the two are equivalent constructs (r ranges from 0.701 to 0.902, p <
.000). In future versions of the survey, we will only include the confidence items.

Table 2
Significant Correlations among the Post-Survey Items of All Students’
**Correlation is significant at the 0.01 level (2-tailed). * Correlation is significant at the 0.05 level (2-tailed).
TechConf: How confident are you that you can pass your remaining technical courses in the engineering major?
DesignConf: How confident are you that you can pass your remaining design courses in the engineering major?
EngDegConf: How confident are you that you can complete your undergraduate engineering degree at ASU?
TechLikelihood: How likely is it that you will pass your remaining technical courses in the engineering major?
DesignLikelihood: How likely is it that you will pass your remaining design courses in the engineering major?
EngDegLikelihood: How likely is it that you will complete the undergraduate engineering degree at ASU?
EngConnected: How connected do you feel to the engineering major?
ASUConnected: How connected do you feel to ASU?
EngImportant: How important is it to you to complete an engineering degree?
StudyGroupHelpful: Did the Study Group help you succeed in Thermodynamics?
FacultySupport: Faculty are available to help me when I need it.
ClassmateSupport: I have classmates and/or friends that I can go to for help with engineering coursework.
HousingSituation: My housing situation enables me to focus on my studies.
TechConf DesignConf EngDegConf Tech
Likelihood
Design
Likelihood
EngDeg
Likelihood
EngImportant StudyGroup
Helpful
Faculty
Support
Classmate
Support
Housing
Situation
TechConf
1 .830** .856** .796** .754** .776** .493*
.444* .429*
DesignConf
.830** 1 .812** .733** .808** .701** .535*
EngDegConf
.856** .812** 1 .884** .788** .902** .670** .593**
.436*
TechLikelihood
.796** .733** .884** 1 .821** .893** .551** .471*
DesignLikelihood
.754** .808** .788** .821** 1 .868** .533* .508*
EngDeg Likelihood .776** .701** .902** .893** .868** 1 .582** .540**
.462*
EngConnected .465* .508*
.518* .491*
ASUConnected
.527*

We found no significant differences in confidence, likelihood, connection with engineering
major, and ASU connection in both pre-survey and both-survey. However, at 90% confidence
(p<.1), there was a significant difference in how connected the students feel to the
engineering major after participating in the PLSGs, based on results of the 14 students who
responded to both pre-survey and both survey (t =1.883, p =.082). Considering the small sample
size, this is a notable result worth tracking in future iterations.
Twenty-two out of 37 students (59%) in PLSGs attended at least 5/8 study group sessions, and
5/13 (38%) of TARs students attended at least 5/8 study groups (the difference is non-
significant). We analyzed student scores of the 22 PLSGs and 5 TARs participants who attended
more than half of the sessions. Unexpectedly, students placed in the TARs evidenced
significantly higher Exam 1 scores than those placed in PLSGs. As shown in figure 2, the mean
Exam 1 score of PLSGs (47.8 points) was much lower than that of TARs (66.0 points), but the
mean scores of the following exams between the PLSGs and TARs were relatively close.
Statistically, there was a significant difference in the mean on Exam 1 score between the PLSGs
and TARs (p=.032). Because PLSG students’ scores rose while TAR students’ scores remained
static, there were no significant differences in the mean scores between the two groups on exams
2, 3, and the final.
We ran a paired samples T-test for PLSGs and TARs to compare the mean scores on Exam 2,
Exam 3, and the final exam versus the mean Exam 1 score. Of the PLSGs, we found significant
differences in all three pairs, with the mean scores on Exam 2, Exam 3, and the final exam
increasing compared to the Exam 1 mean score (p=.000) (Table 3). We did not find any
significant difference between the TAR groups’ mean scores on Exam 2, Exam 3, or the final
exam compared to Exam 1 (p>.500) (Table 4). These results show that only students in PLSGs
made significant improvements in their exam scores.

Fig. 2. Mean Exam Scores of PLSG and TAR Students
Table 3
Paired Samples Test for PLSG students’ exams scores
Paired Samples Test for PLSGs
Paired Differences
t df
Sig.
(2-
tailed) Mean
Std.
Deviation
Std. Error
Mean
95% Confidence Interval
of the Difference
Lower Upper
Exam1 - Exam2 -20.71364 16.05665 3.42329 -27.83276 -13.59452 -6.051 21 .000
Exam1 - Exam3 -19.69091 15.34797 3.27220 -26.49582 -12.88600 -6.018 21 .000
Exam1 – Final Exam -16.13409 13.14599 2.80273 -21.96270 -10.30549 -5.757 21 .000
47.8
68.5
67.5 63.9
66.0
63.5
71.468.1
0.0
10.0
20.0
30.0
40.0
50.0
60.0
70.0
80.0
90.0
100.0
Exam 1 Exam 2 Exam 3 Final Exam
Mea
n E
xam
Sco
re
ExamPLSGs TARs

Table 4
Paired Samples Test for TAR students’ exams scores
Paired Samples Test for TARs
Paired Differences
t df
Sig.
(2-
tailed) Mean
Std.
Deviation
Std. Error
Mean
95% Confidence Interval
of the Difference
Lower Upper
Exam1 - Exam2 2.45000 15.30972 6.84671 -16.55953 21.45953 .358 4 .739
Exam1 - Exam3 -5.45000 20.23178 9.04793 -30.57108 19.67108 -.602 4 .579
Exam1 – Final Exam -2.10000 25.74976 11.51564 -34.07255 29.87255 -.182 4 .864
Prior record data suggest that if a student scores between 50%-60% on Exam 1, it is difficult to
recover and pass. A score less than 50% has presaged almost certain failure. Among the 22
PLSG students, 2 students scored above 60% on Exam 1, 20 students scored below 60%, and 12
out of these 20 students scored below 50%. Ninety percent (18/20) of these PLSG students
passed the course, while 66% (55/83) of non-PLSG students who scored below 60 on Exam 1
passed the course (p=.036) (Table 5). The course pass rate of the PLSG students scoring above
60% on Exam 1 was 100% (2/2), which was statistically similar to the course pass rate (95%) of
non-PLSG students (Table 5). The course pass rate of the PLSG students was 90% (20/22)
compared to 80% (4/5) for TARs—differences are not statistically significant.
Table 5
Course pass rate
Course Pass Rate
PLSGs students who scored below 60 on exam 1 90% (18/20)
Other students who scored below 60 on exam 1 (excluding PLSGs students) 66% (55/83)
Other students who scored above 60 % on exam 1 (excluding PLSGs students) 95% (147/154)
PLSGs students (regardless their exam 1 score) 90% (20/22)
TARs students (regardless their exam 1 score) 80% (4/5)
Interview results
A few weeks after the course, the graduate research assistant interviewed four PLSG students.
All interviewees agreed that the peer-interaction in PLSGs increased their confidence in passing
their remaining courses and completing their engineering degree because they realized that other
students were struggling with the course just like they were. Students in PLSG groups reported
feeling more active and comfortable then at the beginning of the term reaching out for help. For
example, Adam (all student names are pseudonyms) said that the interaction with other PLSG
students made him feel more comfortable reaching out to people for help on any problems.
Another interviewee, Linda said:

o “Study Groups are awesome, make you succeed, make you feel more confident, make
you realize that you are not the only student that may be struggling, or feel kind of
intimidated by a course ….so you meet other students who are kind of in the same path
as you, build friendship, and feel more competent, and feel better about yourself”.
All interviewees agreed that they felt more connected to engineering since they had interactions
with other engineering students, they were studying the Thermodynamics course that was about
engineering, they learned about more practical engineering works/stories from the TA, or their
increased confidence in the Thermodynamics lead to their more confidence in engineering. Mia
said:
o “Honestly yes [I felt more connected to engineering] because … We had one electrical,
one mechanical, me-civil, and I don’t know whose was the other one, but I could see
different perspectives of engineering all coming together at once, so it helped me
understand more about different major perspectives than just mine”.
Students disagreed that PLSGs promoted institutional affiliation: students had minimal
experience with ASU life due to the COVID-19, students would get connected to ASU through
club and organization activities rather than courses, or students have never thought about the
ASU connection. For example, Adam shared that “I’ll get a deeper connection to ASU not
necessarily through my classes but through clubs and organizations.” Alex, a transfer student,
said, “I was going to the class with just two or three students, and quite honestly, I don’t feel that
connected to ASU in the first place. I’m not sure that… I don’t think the Study Groups help or
hurt that anyway.”
Limitations
This study provides notable results, but it has some limitations. Sample size is relatively small,
limiting generalizability of findings. The comparison group (TARs) did not begin the term with
the same Exam 1 mean as did PSLG groups. The post-survey response rate from TAR students
was too low for us to compare results between the TAR and PLSG students. Additionally, we
could not match pre/post surveys for all respondents since students pre and post surveys did not
match, and therefore could not be associated with a particular student. Also, we found no
differences in survey confidence items, but PLSG students who were interviewed said their
confidence improved. In subsequent iterations of the course, we made changes in placement
procedures, survey items, and distribution method in order to increase granularity of the
confidence items and to boost response rates.

Discussion
The PLSG peer-interaction in discipline-based problem solving promoted student competence in
course material.
Evidence is promising regarding the extent to which PLSGs promote student competence in the
course material. According to student exam scores, students in PLSGs made improvements in
their mean exam scores after participating in the PLSGs, which was evidenced by the significant
increase in their mean scores on Exam 2, Exam 3, and the final exam. Among students who
scored below 60 on Exam 1, the course pass rate of PLSG students was significantly higher than
that of non-PLSG students.
Survey responses did not show a significant increase in engineering self-efficacy, but interview
results presented the enhanced engineering self-efficacy.
This study did not find a significant increase in self-efficacy, but the results were mixed. The few
students we interviewed reported increased confidence that they could pass the course and the
future course in interviews, but this did not appear in the survey responses. Thus, we have made
changes to the pre/post surveys to capture students’ sense of engineering self-efficacy better.
The PLSG peer-interaction in discipline-based problem solving did promote institutional
affiliation due to the COVID-19 and students’ personal opinions.
Contrary to our expectation, PLSGs did not promote institutional affiliation. The 14 PLSG
students who responded to both pre-survey and post-survey did not feel closely connected to
ASU, or their connection did not change significantly. However, from the interviews, we found
the following reasons why they disagreed that PLSGs promoted institutional affiliation: students
had minimal experience with ASU life due to the COVID-19, students would get connected to
ASU through club and organization activities rather than courses, or students have never thought
about the ASU connection; rather, they affiliate more with the engineering school. Moving
forward, we will re-cast the question to refer to the engineering major vs. ASU.
Students’ ability to solve discipline-based problems (i.e., thermodynamics) increased more
through peer-led study groups (PLSGs) than they do conventional TA-led recitations (TARs).
With the limitations mentioned above, this study could address only the first part of the second
research question: PLSGs increased students’ ability to solve discipline-based problems more
than the TARs. Exam scores and course pass rates were used to measure student competence
(i.e., students’ ability to solve discipline-based problems). The PLSG students had their mean
scores on Exam 2, Exam 3, and final exam significantly increased after participating in the
PLSGs while these exams’ mean scores of TAR students did not significantly improve. Among
students who scored below 60 on Exam 1, the course pass rate of PLSG students was
significantly higher than that of non-PLSG students. Still, among students who scored above 60
on Exam 1, the course pass rate of PLSG students was comparable to that of TAR students. Lack

of equivalence in the mean scores of PLSGs vs. TARs on Exam 1 clouds the issue. In Spring
2021, we will ensure that the mean scores of PLSGs and TARs on Exam 1 are equivalent.
Students were not placed in their Study Groups when they completed the pre-survey. Of the 22
responses on the post-survey, only one student reported participating in the TA-led group, so we
could not compare self-efficacy and institutional affiliation outcomes between PLSGs to TARs.
Conclusion
There is strong interest in student persistence in STEM among practitioners and researchers.
Results of this study show that our PEERSIST model grounded in social cognitive career theory
was helpful to engineering students in promoting their achievement (i.e., exam scores and course
pass rate), although we did not find evidence that PLSGs promoted institutional affilation.
We believe that PLSG is a promising and scalable innovation for students in engineering. We
plan to run funded trials in Fall 2021 and Spring 2022. By providing time in PLSGs for students
to complete surveys, collecting their names, and enhancing the research design, we expect to
strengthen the study and document outcomes more substantially.
Acknowledgment
The research team is grateful to the ASU Kern Project for supporting this work. We also
acknowledge two other Thermodynamics professors, Dr. Wang, and Dr. Bocanegra, for their
support on this study. We also appreciate the program chair and the anonymous reviewers for
their helpful comments.
References
[1] G. Lichtenstein, H. L. Chen, K. A. Smith & T. A. Maldonado. “Retention and persistence
of women and minorities along the engineering pathway in the United States”. Cambridge
handbook of engineering education research, 2014, pp. 311-334.
[2] S. Hurtado, C. B. Newman, M. C. Tran & M. J. Chang. “Improving the rate of success for
underrepresented racial minorities in STEM fields: Insights from a national project.” New
Directions for Institutional Research, no. 148, pp. 5-15, 2010.
[3] J. C. McNeil, M. W. Ohland & R. A. Long. “Entry pathways, academic performance, and
persistence of nontraditional students in engineering by transfer status.” In 2016 IEEE Frontiers
in Education Conference (FIE), pp. 1-7, IEEE, Oct 2016.
[4] National Student Clearinghouse Research Center. “The Role of 2-Year Institutions in
Bachelor’s Attainment.” Snapshot Report, 2017 [Online]. Available:
https://nscresearchcenter.org/wp-content/uploads/SnapshotReport26.pdf. [Accessed July 17,
2020].

[5] J. P. Concannon & L. H. Barrow. “A cross-sectional study of engineering students’ self-
efficacy by gender, ethnicity, year, and transfer status.” Journal of Science Education and
Technology, vol. 18 no. 2, pp. 163-172, 2009.
[6] R. E. Fullilove & P. U. Treisman. “Mathematics Achievement Among African American
Undergraduates at the University of California, Berkeley: An Evaluation of the mathematics
workshop program.” The Journal of Negro Education, vol. 59, no. 3, pp. 463-478, 1990.
[7] R. W. Lent, S. D. Brown & G. Hackett, “Toward a unifying social cognitive theory of
career and academic interest, choice, and performance,” Journal of Vocational Behavior, vol. 45,
no. 1, pp. 79-122, 1994.
[8] A. Bandura, “Self-efficacy: toward a unifying theory of behavioral change,” Psychological
Review, vol. 84, no. 2, 1977.
[9] Marra, R. M., Rodgers, K. A., Shen, D., & Bogue, B. (2009). “Women engineering
students and self‐efficacy: A multi‐year, multi‐institution study of women engineering student
self‐efficacy,” Journal of engineering education, 98(1), 27-38.
[10] M. M. Nauta & D. L. Epperson, “A longitudinal examination of the social-cognitive model
applied to high school girls' choices of nontraditional college majors and aspirations,” Journal of
Counseling Psychology, vol. 50, no. 3, 2003.
[11] R. W. Lent & S. D. Brown, “Social cognitive career theory at 25: Empirical status of the
interest, choice, and performance models,” Journal of Vocational Behavior, vol. 115, 2019.
[12] A. D. Patrick & M. Borrego, “A review of the literature relevant to engineering identity”,
in American Society for Engineering Education Annual Conference, New Orleans, Louisiana,
2016.
[13] A. Byars-Winston & J. G. Rogers, “Testing intersectionality of race/ethnicity × gender in
a social–cognitive career theory model with science identity,” Journal of counseling psychology,
vol. 66, no. 1, 2019.
[14] M. M. Chemers, E. L. Zurbriggen, M. Syed, B. K. Goza & S. Bearman, “The role of
efficacy and identity in science career commitment among underrepresented minority students,”
Journal of Social Issues, vol 67, no. 3, pp. 469-491, 2011.
[15] H. Duncan & T. Dick. “Collaborative workshops and student academic performance in
introductory college mathematics courses: A study of a Treisman model math excel program.”
School Science and Mathematics, vol. 100, no. 7, pp. 365-373, 2000.
[16] T. J. Murphy & U. Treisman. “Supporting high achievement in introductory mathematics
courses: What we have learned from 30 years of the Emerging Scholars Program.” Making the
connection: Research and teaching in undergraduate mathematics education, vol. 18, no. 73, p.
205, 2008.

[17] A. Tenney & B. Houck. “Peer-led team learning in introductory biology and chemistry
courses: A parallel approach.” Journal of Mathematics and Science: Collaborative Explorations,
vol. 6, no. 1, pp. 11-20, 2003.
[18] J. W. Creswell & J. C. Guetterman, Educational research: Planning, conducting, and
evaluating quantitative and qualitative research. Upper Saddle River, NJ: Prentice Hall, 2017.
[19] R. W. Lent, “A social cognitive view of career development and counseling,” in Career
development and counseling: Putting theory and research to work, S. D. Brown & R. W. Lent
(Eds.), John Wiley & Sons, Inc., 2005, pp. 101–127.
[20] R. W. Lent & S. D. Brown. “On conceptualizing and assessing social cognitive constructs
in career research: A measurement guide”. Journal of career assessment, vol. 14, no. 1, pp. 12-
35, 2006.