The Pay Gap for Women in Medicine and Academic Medicine€¦ · British Medical Association The Pay...
34
British Medical Association The Pay Gap for Women in Medicine and Academic Medicine An analysis of the WAM* database By Sara Connolly (University of East Anglia) and Anita Holdcroft (Imperial College London) *Women in Academic Medicine Funded by the Higher Education Funding Council England, the British Medical Association, the Medical Women’s Federation and Imperial College London, with agreement from Caroline Fox (Athena Forum) to publish data from ASSET 2006.
Transcript of The Pay Gap for Women in Medicine and Academic Medicine€¦ · British Medical Association The Pay...

British Medical Association
The Pay Gap for Women inMedicine and Academic MedicineAn analysis of the WAM* database
By
Sara Connolly (University of East Anglia) and
Anita Holdcroft (Imperial College London)
*Women in Academic Medicine Funded by the Higher Education Funding Council England, the British Medical Association, the Medical Women’s Federation and Imperial College London, with agreement from Caroline Fox (Athena Forum) to publish data from ASSET 2006.

PrefaceI had until now felt confident in my belief that there was a fair, indeed robust, pay structure inmedicine that ensured equality. This report clearly shows that this is not so and that there is a need for exploration of the reasons for this disparity.
This report focuses on differences between men and women doctors at different stages of theircareers and between NHS and University employed doctors. It compliments the present government’sconsultations on the Equalities Bill and encourages NHS and University employers to audit their payaccording to professions and grade of staff.
The report’s analysis shows the actual pay gap where men and women hold equally similarcharacteristics, as well as the average pay gap which is used to identify areas of additionalremunerated work. By considering how pay can increase within a grade and how even whenprofessional characteristics are similar a pay gap is measured, reasons for and solutions to the pay gap can be identified.
The report has been debated within the BMA at senior and junior levels and at the BMA AnnualRepresentative Meeting in July 2009. It raises issues that the profession has to face and that employerscan discuss given the present parliamentary activity on equalities. Of note are the steps proposed toclose the pay gap: encouragement of female talent, pay audit, methods of negotiation of salary, and a review of workplace culture that devalues women’s contributions. Employers and employees as wellas professional societies can all contribute to the process of reducing the gaps.
In summary, the BMA as well as the Medical Women’s Federation have published this report to bringevidence to doctors’ employers and the profession. The report identifies tangible reasons for part ofthe gender pay gap but for a large part the gap is unexplained, as is that in academic medicine.Hence this report calls for changes in the workplace to remove discrimination in pay.
Professor Averil O Mansfield, CBE, FRCS, FRCPPresident
British Medical Association
The Pay Gap for Women in Medicine and Academic Medicine 1

Executive SummaryRecent UK Legislation has heightened awareness of the extent of the gender pay gap leading toconsideration of causation. This report for clinical medicine uses NHS and university responses frommen and women doctors in the Women in Academic Medicine cohort of the Athena Survey ofScience, Engineering and Technology 2006. It is timely because actual salary data in UK clinicalmedicine is scarce. Based on average salaries there is a raw pay gap of £15,245 – that is in general,women doctors earn 18% less than male doctors. There were mainly two grades of staff in thecohort, trainees and consultants on NHS and academic contracts. The difference between men andwomen reflects the impact of the much larger proportion of male doctors earning salaries in excess of £100,000. For university employees, average salaries are 5% lower compared with those whoseprimary contract is with the NHS. In academia, women earn 17% less than men whereas women in the NHS earn 21% less than men, but disparities also exist within grades with male professorsearning 15% more than female professors.
Factors that influence and may explain the pay gap include grade, hours worked, experience,administrative roles and specialty. In order to determine which factors may generate the pay gap and how much is unexplained due to differences in treatment, a regression analysis was utilised inorder to control for the different characteristics of the respondents, that is to compare like with like.For consultants there is a 13% gender pay gap but this is only partly explained; about 40% of this gap is unexplained due to different returns for the same characteristics e.g. the benefit of having beenemployed in the consultant grade for longer than 10 years is a significantly higher salary for men thanwomen. For trainees differences in experience, grade and other factors explain only half the reportedsalary differences. Overall, the gender pay gaps are lower for doctors starting their careers but quitesizeable gaps emerge even amongst similarly successful men and women. Our estimates that controlfor confounding factors so that one doctor is compared with another of similar background, suggest atrue gender pay gap amongst consultants of 5.6% worth £5,500 per annum and amongst trainees of4.1% worth £2,000 per annum. Using free text comments from the survey, we attempt to identifywhich, if any, aspects of the workplace culture serve to disadvantage or undermine the position ofwomen in medicine. Caring roles, hostile culture and geographical limitations are expressed ascommon concerns.
This report raises equality issues on pay that warrant further research within larger and more definedgroups of doctors. However, this initial evidence suggests a partly unexplained gender pay gap thatwill be a benchmark within the medical profession.
British Medical Association
The Pay Gap for Women in Medicine and Academic Medicine 3

ContextHigh gender pay gaps persist in the professions despite average pay gaps in the UK being at theirlowest levels since the 1970s, for example, women working in the law earn 27%, women working as medical practitioners earn 24%, and women working in Higher Education earn 15% less than menworking in the same professions (see Appendix Table A1)
1. These figures are naturally of interest to
women working in the professions and are increasingly of interest to employers. The Gender EqualityDuty which came into force in April 2007 places particular responsibilities on public sector employersto ensure equality of treatment in the workplace. Not only has this legislation raised the profile ofgender equality issues in the workplace, but it has also heightened awareness of the extent of thegender pay gap and of any causal or linking factors. This report considers the evidence and causes of the gender pay gap in medicine and academic medicine using the clinical cohort of Women inAcademic Medicine (WAM) of the Athena Survey of Science, Engineering and Technology 2006(ASSET 2006) database for male and female doctors working in the NHS, Higher Education Institutions(HEI) and for other employers.
Gender pay gaps in Medicine Gender pay gaps in medicine have been identified in a number of recent studies in both the US andthe UK. Laine and Turner (2004) report evidence from the US Census Bureau that “female physicians’wages averaged 63 cents for each dollar earned by their male colleagues”. Also in the US, Wright et al(2007) find evidence of gender pay differentials in the academic context in their study of a College ofMedicine in the US where female academics earned 89% of the average male salary. Other evidencefrom the UK, reports pay gaps amongst scientists working at Universities of between 18% (in subjectsallied to medicine) and 36% (in medicine and dentistry)
2.
These figures suggest that the perceptions of inequality reported by Bennett and Nickerson (1992) arejustified. In their study, Bennett and Nickerson found that only 19% of women in academic medicinethought that salaries for equivalent positions were equitable, with the proportion indicating thatsalaries for men and women are equal falling with increasing grade of staff. The ASSET 2006 data also asks doctors whether they perceive there to be equality of treatment in salary, career progression,access to career development/training opportunities and visibility to senior management. Very smallnumbers (less than 5%) perceive that men experience inequality in these areas, men are more likely to perceive equality in treatment and women are split between indicating equality of treatment andwomen experiencing disadvantage. Women, particularly those who are parents or of senior grade/highseniority, are more likely to indicate that women experience disadvantage in relation to careerprogression and salary (see Figure A1 in the Appendix).
British Medical Association
The Pay Gap for Women in Medicine and Academic Medicine4
1 The average gender pay gap is measured by taking the gap between the average (mean) level of pay for men and women as a proportion of the average pay for men, this is the preferredmeasure of the Equality Commission:[(Average Male Salary – Average Female) Salary/Average Male Salary × 100]. The average gender pay gap in the 1970s was over 30% by 2007 it had fallen to 23% but hassince risen slightly.Similarly, the median gender pay gap is measured as a proportion of the median salary for men,this measure was recently adopted by the UK government:[(Median Male Salary – Median Female Salary)/Median Male Salary × 100].
2 Anderson and Connolly (2006) and Connolly and Long (2008) who use the ASSET 2003/4 data and the subject areas are defined using the JACS subject codes.

What can explain the gender pay gap?A range of factors may explain the gender pay differentials. For example, the lower salaries for womenare, in part, a reflection of their more recent entry into the professions, younger age and so greaterconcentration in more junior positions. A recent report examining careers and career progression inmedicine – “Women in academic medicine – developing equality in governance and management for career progression” April 2008, which also uses the ASSET 2006 survey data – finds that womenremain under-represented within the sector particularly at more senior levels
3. We shall therefore
explore the extent to which gender pay differences can be explained by grade and the extent to which intra-grade pay differences in salary exist.
We also expect salaries to be influenced by contract and hours worked. One explanation which is often given for the gender pay gap is that women work fewer hours, but if we control for thisdimension of effort or activity we would expect to see that men and women earn similar salaries. In order to make meaningful comparisons, we split the sample into two groups according to theircontract types – consultants, which also includes professors, readers, senior lecturers; and trainees,who also include lecturers – and explore the relationship between salary and hours worked.
Furthermore, gender pay gaps may arise if men and women work in different areas of the professionwhich themselves are rewarded differently
4. Roberts (2005) argues that ‘Women continue to be over-
represented in the lower paid, less technically focused specialties, which are more often patientcentred’ and that salaries are also likely to reflect the sector in which doctors work; the salaries andremuneration associated with academic medicine are often significantly lower than in the NHS.Similarly, Goldbeck-Wood (2000) argues that doctors are ‘unwilling to choose a career path whichpromises little in the way of training structure, job security, flexibility, financial reward and are optinginstead for the better security, career and pay offered by purely clinical posts’. Studies in the US havealso found that gender pay gaps vary across areas of speciality of medicine
5. We examine the extent
to which salaries paid for the same grade differ across the NHS and HEIs, whether they are sensitive to field of specialism and whether there is a gender dimension to this.
British Medical Association
The Pay Gap for Women in Medicine and Academic Medicine 5
3 The report outlines the background, causes and suggested interventions relating to careerdevelopment.
4 There is evidence from the legal professions that women tend to be concentrated in areas of theprofession which are less lucrative and that this partly explains the gender pay gap for lawyers,Law Society, 2008.
5 Weeks and Wallace (2007a, 2007b, 2006) use data collected by the American Medical Associationbetween 1992 and 2001 of the salaries of a range of medical specialists and report significantgender pay gaps for Ophthalmologists, Dermatologists and Radiologists. Kaplan et al (1996)present annual salary data from a 1992 questionnaire survey – $122,172 for men, $102,198 forwomen working as paediatricians.

How much do these factors affect the gender pay gap?Having identified a range of possibly inter-related factors which may influence salary, we attempt todisentangle their effects. We do this using regression analysis which allows us to control for the fullrange of factors, or explanatory variables, which might influence pay. We use regression results todecompose the average gender pay gap into two components
6:
Those which can be explained – perhaps due to years of experience, grade or specialist field Those which are due to differences in returns – where men and women are rewarded differently for the same characteristics.
Whilst employers and professionals may be interested in differences in pay that arise due to differencesin experience and so on, it is the differences in returns that should be of greatest concern to all. Where this exists, it would mean that when we compare like with like, female doctors are paid less than male doctors.
Medicine and Academic Medicine using the WAM cohort of the AthenaSurvey of Science, Engineering and Technology 2006 (ASSET 2006) databaseWe explore these issues using the WAM cohort of ASSET 2006 data which collected details of thegrade at which doctors were employed and asked them to identify who held their contract ofemployment e.g. the NHS or HEI. The survey was completed by 1,162 doctors, providing us with alarge scale and extremely comprehensive source of data to explore these issues. Information on payand other relevant/related areas was collected
7; in order to ensure comparability across different forms
of employment respondents working part-time8
were asked to report the full-time equivalent of theirannual gross income from their main employment. There are limitations in this approach in that somedoctors work long hours and full time is a concept rather than an indication of hours worked. Thedistribution of salary is shown in Figure 1 – it shows salaries ranging from less than £20,000 to morethan £200,000. One feature which is immediately apparent is that the distribution appears to bebimodal which reflects the fact that there are two main groups of respondents in the sample –consultants and trainees – which we will analyse separately.
British Medical Association
The Pay Gap for Women in Medicine and Academic Medicine6
6 This is done using the Oaxaca decomposition technique – Oaxaca (1973) – see technical appendixfor more detail.
7 The survey used a drop down menu of salary bands in narrow bandings that were chosen in orderto avoid inaccuracies such as the respondent entering one zero too many – here the salary bandsare aggregated for ease of exposition.
8 The survey uses the OECD definition of part-time employment which is working less than 30 hoursper week.

Figure 1 – Annual Salary (FTE)
Note Sample N = 10159
In Figure 2, we present the distribution by gender. We see here that women are more heavilyrepresented in the lower part of the distribution and so we can expect to find a gender pay gap.Furthermore, the distributions of salary are not symmetric – a comparison of average with the mediansalaries illustrates the skewed nature of the distribution. For male doctors, the average salary wasfound to be £83,957 compared with a median salary of £75,000 – the median is significantly lowerthan the average because the average reflects the impact of a number of highly paid male doctors (1 in 3 male doctors earn more than £100,000). For female doctors, the median salary is £67,500which is much closer to the average £68,712 which reflects that they are more likely to beconcentrated in the lower paid salary bands.
Figure 2 – Annual Salary (FTE) by gender
Note Sample N = 1015
British Medical Association
The Pay Gap for Women in Medicine and Academic Medicine 7
9 1015 doctors provided salary details (87% of the overall sample), of these 42% worked in HEIs,58% in the NHS and 7% in other organisations.
16
14
12
10
8
6
4
2
0£20,000 £22,500 £27,500 £32,500 £37,500 £42,500 £47,500 £52,500 £57,500 £62,500 £67,500 £75,000 £85,000 £95,000 £110,000£130,000£150,000 £170,000 £190,000 £210,000
Mid-point of salary bands
18
16
14
12
10
8
6
4
2
0£20,000 £22,500 £27,500 £32,500 £37,500 £42,500 £47,500 £52,500 £57,500 £62,500 £67,500 £75,000 £85,000 £95,000 £110,000£130,000£150,000 £170,000 £190,000 £210,000
Mid-point of salary bands
Male
Female
%
%
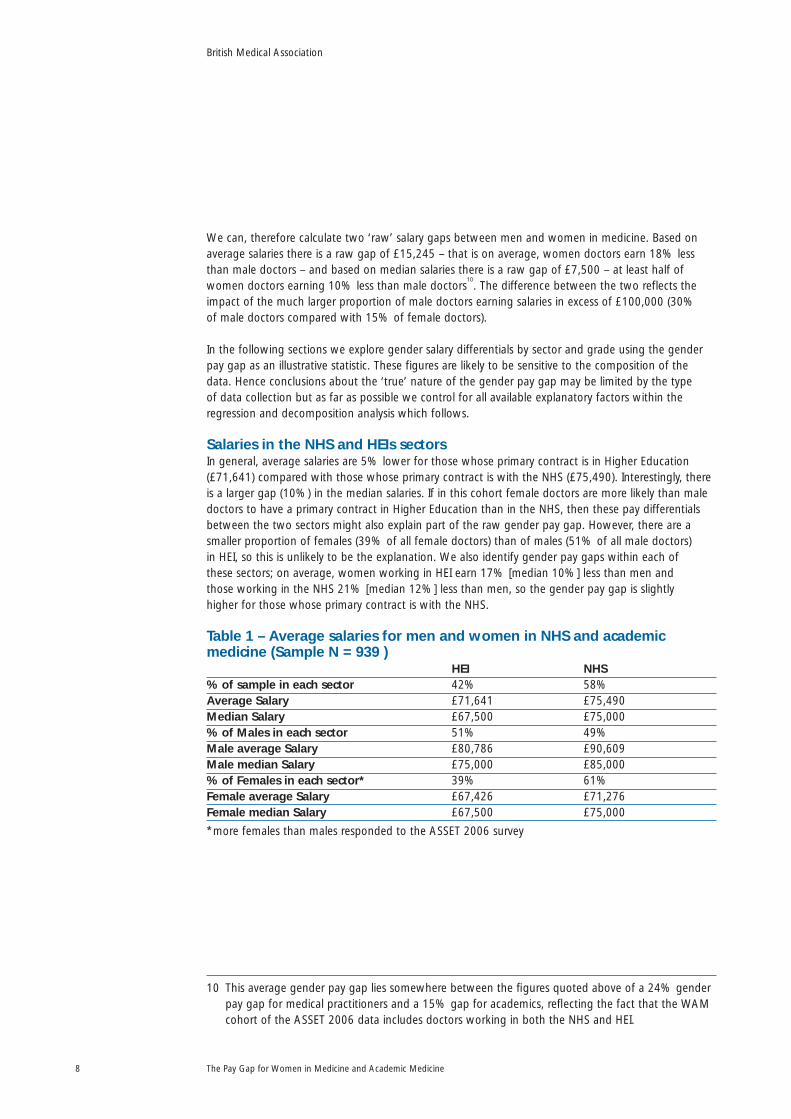
We can, therefore calculate two ‘raw’ salary gaps between men and women in medicine. Based onaverage salaries there is a raw gap of £15,245 – that is on average, women doctors earn 18% lessthan male doctors – and based on median salaries there is a raw gap of £7,500 – at least half ofwomen doctors earning 10% less than male doctors
10. The difference between the two reflects the
impact of the much larger proportion of male doctors earning salaries in excess of £100,000 (30% of male doctors compared with 15% of female doctors).
In the following sections we explore gender salary differentials by sector and grade using the genderpay gap as an illustrative statistic. These figures are likely to be sensitive to the composition of thedata. Hence conclusions about the ‘true’ nature of the gender pay gap may be limited by the type of data collection but as far as possible we control for all available explanatory factors within theregression and decomposition analysis which follows.
Salaries in the NHS and HEIs sectorsIn general, average salaries are 5% lower for those whose primary contract is in Higher Education(£71,641) compared with those whose primary contract is with the NHS (£75,490). Interestingly, thereis a larger gap (10%) in the median salaries. If in this cohort female doctors are more likely than maledoctors to have a primary contract in Higher Education than in the NHS, then these pay differentialsbetween the two sectors might also explain part of the raw gender pay gap. However, there are asmaller proportion of females (39% of all female doctors) than of males (51% of all male doctors) in HEI, so this is unlikely to be the explanation. We also identify gender pay gaps within each of these sectors; on average, women working in HEI earn 17% [median 10%] less than men and those working in the NHS 21% [median 12%] less than men, so the gender pay gap is slightly higher for those whose primary contract is with the NHS.
Table 1 – Average salaries for men and women in NHS and academicmedicine (Sample N = 939 )
HEI NHS% of sample in each sector 42% 58%Average Salary £71,641 £75,490Median Salary £67,500 £75,000% of Males in each sector 51% 49%Male average Salary £80,786 £90,609Male median Salary £75,000 £85,000% of Females in each sector* 39% 61%Female average Salary £67,426 £71,276Female median Salary £67,500 £75,000
*more females than males responded to the ASSET 2006 survey
British Medical Association
The Pay Gap for Women in Medicine and Academic Medicine8
10 This average gender pay gap lies somewhere between the figures quoted above of a 24% genderpay gap for medical practitioners and a 15% gap for academics, reflecting the fact that the WAMcohort of the ASSET 2006 data includes doctors working in both the NHS and HEI.
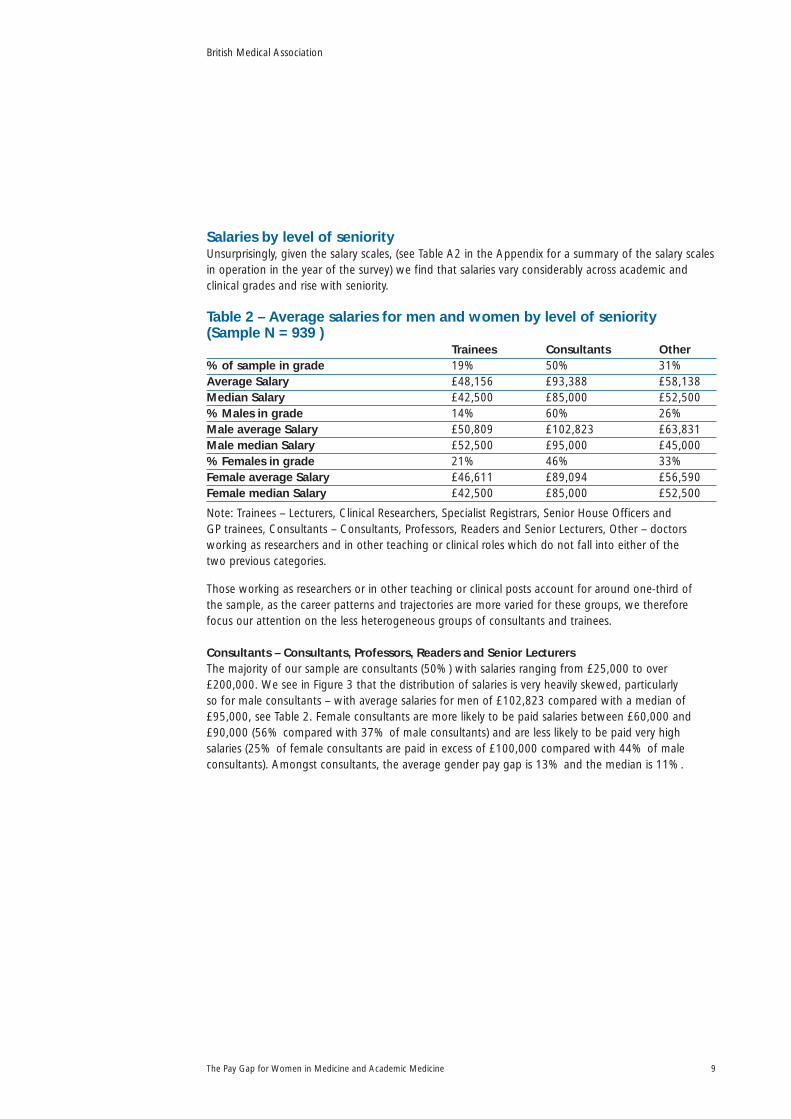
Salaries by level of seniorityUnsurprisingly, given the salary scales, (see Table A2 in the Appendix for a summary of the salary scalesin operation in the year of the survey) we find that salaries vary considerably across academic andclinical grades and rise with seniority.
Table 2 – Average salaries for men and women by level of seniority(Sample N = 939 )
Trainees Consultants Other% of sample in grade 19% 50% 31%Average Salary £48,156 £93,388 £58,138Median Salary £42,500 £85,000 £52,500% Males in grade 14% 60% 26%Male average Salary £50,809 £102,823 £63,831Male median Salary £52,500 £95,000 £45,000% Females in grade 21% 46% 33%Female average Salary £46,611 £89,094 £56,590Female median Salary £42,500 £85,000 £52,500
Note: Trainees – Lecturers, Clinical Researchers, Specialist Registrars, Senior House Officers and GP trainees, Consultants – Consultants, Professors, Readers and Senior Lecturers, Other – doctorsworking as researchers and in other teaching or clinical roles which do not fall into either of the two previous categories.
Those working as researchers or in other teaching or clinical posts account for around one-third of the sample, as the career patterns and trajectories are more varied for these groups, we thereforefocus our attention on the less heterogeneous groups of consultants and trainees.
Consultants – Consultants, Professors, Readers and Senior LecturersThe majority of our sample are consultants (50%) with salaries ranging from £25,000 to over£200,000. We see in Figure 3 that the distribution of salaries is very heavily skewed, particularly so for male consultants – with average salaries for men of £102,823 compared with a median of£95,000, see Table 2. Female consultants are more likely to be paid salaries between £60,000 and£90,000 (56% compared with 37% of male consultants) and are less likely to be paid very highsalaries (25% of female consultants are paid in excess of £100,000 compared with 44% of maleconsultants). Amongst consultants, the average gender pay gap is 13% and the median is 11%.
British Medical Association
The Pay Gap for Women in Medicine and Academic Medicine 9

Figure 3 – Consultants, Annual Salary (FTE) by gender
Note Sample N = 470
Trainees – Lecturers, Clinical Researchers, Specialist Registrars, Senior House Officers and GP traineesTrainees account for 19% of the overall sample and salaries range from £20,000 to £85,000. In Figure4 we see rather more variance in male salaries amongst the trainees, men are more likely to earnsalaries in the very lowest (6% earn less than £30,000) and highest salary bands (56% of maletrainees earn more than £50,000 compared with 30% of women). In contrast the large majority of women, just under 65%, earn salaries between £30,000-£50,000, compared with 38% of men.Amongst trainees, the average gender pay gap is 8% and the median is 19%.
Figure 4 – Trainees, Annual Salary (FTE) by gender
Note Sample N = 177
Hours workedConsultants – Consultants, Professors, Readers and Senior LecturersThe majority of consultants in the sample (86%) are employed on contracts based on time worked, so called Programmed Activities (PA). The ‘typical’ contract that generated a full time salary would be for 10-12 PAs; of those on a PA contract 86% of men and 75% of women reported this as theircontract, yet many work more hours (Table 3). Only about 40% of our sample actually works 10-12PAs. Contracts for more than 12 PAs are relatively rare (9% of men and 7% of women) yet around25% of both men and women report working more than 12 PAs per week.
British Medical Association
The Pay Gap for Women in Medicine and Academic Medicine10
35
30
25
20
15
10
5
0£22,500 £32,500 £37,500 £42,500 £47,500 £52,500 £57,500 £62,500 £67,500 £75,000 £85,000 £95,000 £110,000 £130,000 £150,000 £170,000 £190,000 £210,000
Mid-point of salary bands
Male
Female
25
20
15
10
5
0£22,500 £27,500 £32,500 £37,500 £42,500 £47,500 £52,500 £57,500 £62,500 £67,500 £75,000 £85,000
Mid-point of salary bands
Male
Female
%
%

Table 3 – Consultant PAs (Numbers as % of total male or female consultants)
PAs Contracted PAs WorkedNumber of PAs Men Women Men Women1-7 4 8 1 78-9 1 11 7 710 24 26 12 1311 26 29 25 2112 36 20 28 2913-14 8 4 23 1915 or more 1 3 1 7
The number of PAs worked should reflect the number of PAs in a job plan and, therefore we mightexpect to observe salary differentials between PAs worked. For example, the average salary for thoseworking less than 10 PAs is around £82,000 whereas the average salary for those working 10 to 12PAs is £91,000 rising to £106,000 for those working more than 12 PAs. Taking the ‘typical’ contract of 10-12 PAs we find that women consultants (across both the NHS and HEI) earn around 87% ofmale consultants who are working exactly the same number of PAs.
Table 4 – Average salary for doctors by PAs contracted and worked
PAs Contracted PAs WorkedNumber of PAs Men Women % average Men Women % average
gender pay gender paygap gap
Less than 10 £81,625 £79,919 2 £85,543 £80,307 610-12 £107,938 £93,934 13 £99,694 £86,933 13More than 12 £138,000 £103,382 25 £121,058 £99,911 17
There is a possibility that when asking doctors working part-time to provide an equivalent full timesalary, those doctors who are on contracts above 12 PAs may have considered that they should reducethe salary they reported to reflect the norm of a contract between 10-12 PAs. Nevertheless, such responsesshould not have been specific to one gender and to the extent that this has arisen it is likely to lead toan underestimate of highest, predominantly male, salaries. With this caveat in mind, we see that thereis evidence that women are working longer hours for less pay than men who work fewer hours. This isconsistent with evidence from earlier studies, Schafer (1997), which argued that gender differences insalary persist in presence of confounding variables e.g. academic productivity or hours worked.
Trainees – Lecturers, Clinical Researchers, Specialist Registrars, Senior House Officers and GP traineesWe find that on average hours worked by trainees are slightly higher than the contractual hours (Table5). With the exception of GP trainees, where the women are mostly working part-time, the differencesin hours worked are relatively small with male trainees working slightly more hours than females (49compared with 47 hours). The female trainees are slightly older; this is particularly noticeable amongstthe relatively small number of GP trainees where the women qualified up to 25 years earlier than themen some of whom reported having switched into GP training after a career elsewhere in medicine.
British Medical Association
The Pay Gap for Women in Medicine and Academic Medicine 11
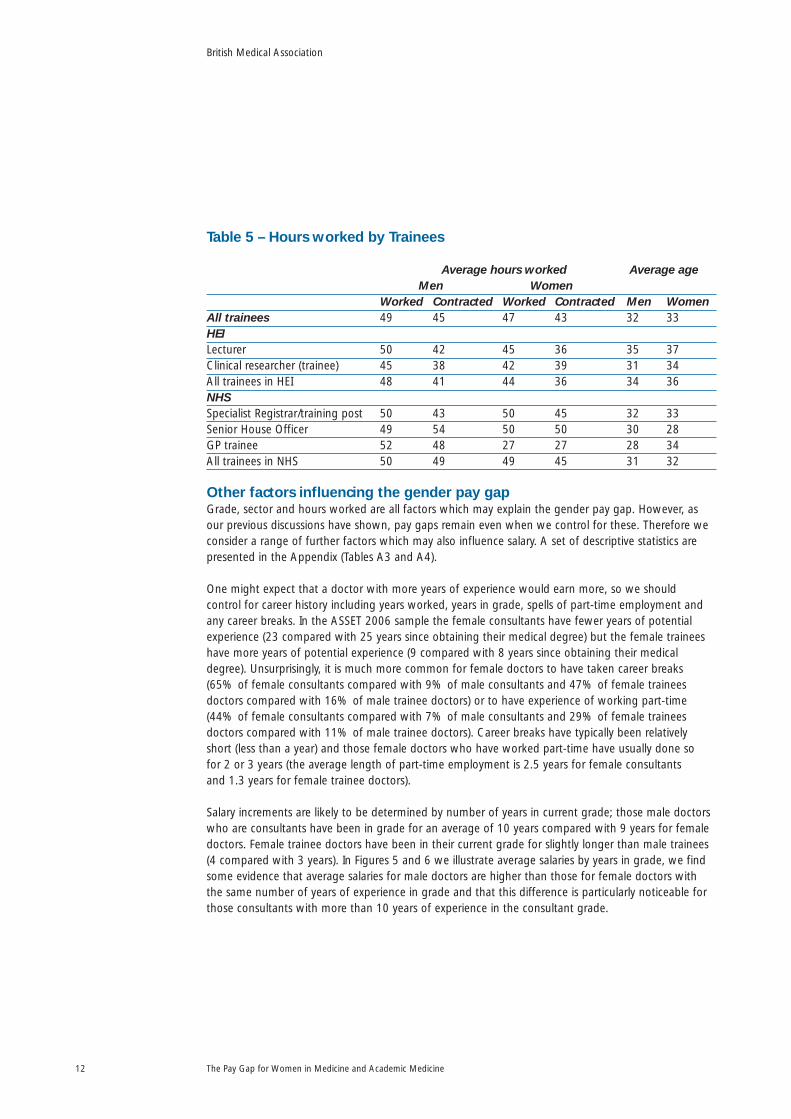
Table 5 – Hours worked by Trainees
Average hours worked Average ageMen Women
Worked Contracted Worked Contracted Men WomenAll trainees 49 45 47 43 32 33HEILecturer 50 42 45 36 35 37Clinical researcher (trainee) 45 38 42 39 31 34All trainees in HEI 48 41 44 36 34 36NHSSpecialist Registrar/training post 50 43 50 45 32 33Senior House Officer 49 54 50 50 30 28GP trainee 52 48 27 27 28 34All trainees in NHS 50 49 49 45 31 32
Other factors influencing the gender pay gapGrade, sector and hours worked are all factors which may explain the gender pay gap. However, asour previous discussions have shown, pay gaps remain even when we control for these. Therefore weconsider a range of further factors which may also influence salary. A set of descriptive statistics arepresented in the Appendix (Tables A3 and A4).
One might expect that a doctor with more years of experience would earn more, so we should control for career history including years worked, years in grade, spells of part-time employment andany career breaks. In the ASSET 2006 sample the female consultants have fewer years of potentialexperience (23 compared with 25 years since obtaining their medical degree) but the female traineeshave more years of potential experience (9 compared with 8 years since obtaining their medicaldegree). Unsurprisingly, it is much more common for female doctors to have taken career breaks (65% of female consultants compared with 9% of male consultants and 47% of female traineesdoctors compared with 16% of male trainee doctors) or to have experience of working part-time(44% of female consultants compared with 7% of male consultants and 29% of female traineesdoctors compared with 11% of male trainee doctors). Career breaks have typically been relatively short (less than a year) and those female doctors who have worked part-time have usually done so for 2 or 3 years (the average length of part-time employment is 2.5 years for female consultants and 1.3 years for female trainee doctors).
Salary increments are likely to be determined by number of years in current grade; those male doctorswho are consultants have been in grade for an average of 10 years compared with 9 years for femaledoctors. Female trainee doctors have been in their current grade for slightly longer than male trainees(4 compared with 3 years). In Figures 5 and 6 we illustrate average salaries by years in grade, we findsome evidence that average salaries for male doctors are higher than those for female doctors withthe same number of years of experience in grade and that this difference is particularly noticeable forthose consultants with more than 10 years of experience in the consultant grade.
British Medical Association
The Pay Gap for Women in Medicine and Academic Medicine12

Figure 5 – Average salary by years in current grade for consultants
Figure 6 – Average salary by years in current grade for trainees
The ASSET 2006 data assumes that the main employment salary includes clinical excellence awardsand specific details about these awards were not documented. However, we consider that medicalsalaries will be higher for those who have won clinical excellence awards and may explain part of thegender pay gap so measures of esteem are included in this analysis. For example, male doctors aremore likely to have received prizes in the past five years, with 33% of male consultants and 39% ofmale trainees compared with 22% of female consultants and 27% of female trainees having achievedthis measure of esteem.
Those who take on leadership or administrative roles are typically paid more and these positions aremore likely to be held by males. Similarly, those who excel in research often command higher salaries –so we should control for various measures of research success (e.g publications, engagement with theresearch community or involvement in professional societies). Here we find that male academics werealmost twice as likely to have been included in their department’s submission to the 2001 researchassessment exercise and in general male doctors were more likely to be an editor or sit on the editorialboard of a journal (these are documented in more detail in Women in Academic Medicine 2008).
British Medical Association
The Pay Gap for Women in Medicine and Academic Medicine 13
60000
180000
140000
120000
100000
80000
40000
20000
0<1 1 2 3 4 5 6 7 8 9 10 11 12 13 14 15 16 17 18 19 20 >20
Years in current grade
Male
Female
Male
Female
20000
80000
70000
60000
50000
40000
30000
10000
0<1 1 2 3 4 5 6 7 >7
Years in current grade
£
£

Given that academic and medical salaries include a London weighting (worth £2,162 for 2006)we might expect to see slightly higher salaries in the capital. Average salaries outside of London are £80,744 compared with £81,238 for those working in London. The average salaries for womenworking within and outside of London are very similar, salaries in London are marginally higher(£76,977 compared with £75,868 for those working outside of London). There is a much moresignificant pay differential for men, those working in London earn on average £102,794 comparedwith £92,043 for those working outside of London. As a consequence, we find a larger gender paygap amongst doctors working in London (25% compared to 18% amongst those working outside of London) which partly reflects the importance of London hospitals in providing training whereby the composition of the female academic and medical profession in London is more likely to be intraining posts and in consultant or academic posts amongst male doctors.
Whilst salary scales should be common across specialist fields we do find that in this cohort, averagesalaries are significantly higher amongst those working in Paediatrics (£88,889) or Anaesthetics(£91,406) and may reflect their clinical workload. With the exception of Medical Education andPsychiatry, women earn less on average than men with notable gender pay gaps in Paediatrics (38%),Ophthalmology (30%) and Obstetrics and Gynaecology (28%). These figures are likely to reflect thevarying composition of the doctors working within these fields, hence in our regression analysis wecontrol for specialty, grade and experience which allow us to take account of any variation in gendercomposition across specialties that is, to compare women with men of similar backgrounds/CVs.
Table 6 – Average salaries by specialist field of medicine for men and women*
% of sample Male doctors Female doctors % average gender pay gap
Accident & emergency 2 £79,167 £73,438 7Anaesthetics 8 £100,568 £83,654 17Clinical oncology, nuclear 5 £102,500 £87,738 14medicine & radiology
General medicine 22 £86,471 £73,193 15General practice 6 £83,333 £72,250 13Geriatrics 3 £82,917 £71,000 14Medical education 1 £63,750 £84,375 -32Obstetrics and Gynaecology 8 £110,000 £78,857 28Ophthalmology 3 £107,500 £74,853 30Paediatrics 7 £119,167 £73,750 38Pathology 12 £92,125 £77,731 16Psychiatry 8 £67,500 £81,220 -20Public health 6 £90,833 £78,879 13Surgery 6 £92,250 £73,482 20
*2% of the sample did not give medical specialty details
British Medical Association
The Pay Gap for Women in Medicine and Academic Medicine14

Finally, other studies of the gender pay gap have found evidence of a ‘mommy’ penalty, wherecomparing like with like, women who are mothers are paid less than women who are not, Harknessand Waldfogel (2003); we therefore also explore the possible impact of domestic responsibilities. Wefind evidence of a marriage and parenthood gap – 93% of the male consultants and 76% of the maletrainees are married compared with 83% of the female consultants and 75% of the female traineesand 27% of the female consultants are not parents compared with 6% of the male consultants.
Explaining the Gender Pay Gap separately for women and menWe have run separate regressions for men and women as this allows us to compare the impact of thevariables and identify whether they have differential effects for men and women. The results discussedin the text below are statistically significant at the 5% level. Our statistical modelling (see thediscussion and results in Tables TA1 and TA2 in the Technical Appendix) estimates a coefficient thatdescribes the proportional effects on salary e.g. among men, the estimated coefficient for being aprofessor is 0.22 meaning that male professors are estimated to have a 22% higher salary than maleNHS consultants and other academic consultants such as readers or senior lecturers. Finally, we use ourregression results to decompose the average gender pay gap into components which are explained –perhaps due to years of experience or specialist field – and those which are unexplained due todifferences in treatment.
11Here we simply summarise the main results of our regression analysis which
explores the causes of the gender pay gap for consultants and trainees separately.
The Consultant – why are there differences in salary?There is a 13% average gender pay gap for consultants but salaries vary by experience and otherfactors as follows:
GradeWithin the medical consultant grade, there is a pay premium for professors – male professorsearn 22% more than men working in other grades, whereas female professors earn 8% morethan women working in other grades.
ExperienceThose who are more experienced and have been in post for longer – those who have been intheir current clinical grade for more than ten years – earn a 34% (men) and 13% (women) paypremium compared to those with less experience.
SpecialtyThere is evidence that salaries are higher in some fields of medicine – salaries are higher formen working in Geriatrics (24%) or Paediatrics (11%)
12.
Programmed activityPay does rise with PAs contracted and worked for both men and women, but, whencontrolling for all other variables, the impact is relatively small and only statistically significantfor men.
British Medical Association
The Pay Gap for Women in Medicine and Academic Medicine 15
11 See technical appendix for more detail.12 These salary differentials are smaller than those reported in Table 6, clearly some of the raw gender
pay differential within specialty was due to the composition of the data e.g. more junior women insome of the specialty fields.

Professional portfolioIn general, salaries are higher for those with a national profile or being involved with theirprofessional societies than for those who do not engage in this way. Administrativeresponsibilities form another dimension of seniority e.g. being a Clinical Director or having asenior administrative position in an NHS Trust is associated with higher salaries for both menand women. With regard to measures of esteem, women who have been a keynote speaker at a conference, a member of a grant giving panel or have senior levels of responsibility withinthe professional organisations are paid more.
Career progression/mobilityThose in more senior positions earn more, but those women who have been promoted bytheir own employer earn less (5%) than those in the same position who moved to achievepromotion.
LocationAll other things being equal, men working in London benefit from a pay premium, whereasthere is no significant difference in salary for women working in the capital.
Career breaksAlthough careers may be interrupted by breaks or spells of part-time employment, it is quitesurprising that these have no statistically significant impact for women and so do notcontribute in any meaningful way to lower salaries for women. For men, those who haveworked part-time have higher (full-time equivalent) salaries than those working full-time(though the impact diminishes with the length of the spell of part-time employment).
Domestic responsibilitiesThere is no direct pay penalty associated with motherhood or care responsibilities for women.We do find that average salaries for the small number of men who are primary carers for theirpartners or parents are lower compared to those without care responsibilities but thisdifference is not statistically significant in the regression analysis.
Summary of Differences in Treatment for Female ConsultantsWomen in consultant positions within medicine earn less than men. This is partly because they are less likely to hold the high level positions, the levels of esteem or level of involvement in professionalorganisations of their male colleagues. However, this explains only about 59% of the gender pay gap (Figure 7), the remainder worth approximately £5,500, is due to difference in treatment for the same characteristics:• the premium for being a professor is 22% for men but only 8% for women • those men who have been in their current clinical grade for more than 10 years earn a return
of 34% compared with those with less experience in the consultant grade but it is only 13% for women
• men benefit from a significant pay premium associated with working in London
British Medical Association
The Pay Gap for Women in Medicine and Academic Medicine16

Figure 7 The amount of influence that each of the factors responsible forthe gender pay gap may exert for consultants
Using these results, having controlled for any differences in characteristics or composition of theconsultant sample, we are able to provide an estimate of the true gender pay gap which existsamongst consultants which is 5.6%, worth just over £5,500 per annum.
The Trainee – why are there differences in salary?Although the average gender salary gap is lower in both proportion and monetary terms for trainees,the percentage gap is 8%, again we find that salaries vary by grade, experience and other factors as follows:Experience
Experience is measured by the number of years since obtaining the main medical qualification;for both men (7%) and women (4%) there is a higher salary for each year of experience.
SectorWomen whose main contract is in the NHS earn less than women whose primary contract is in HEI.
LocationBoth men and women working in London earn less than those working outside of London,despite a London Weighting Allowance. However, the impact is only statistically significant for women.
SpecialityIn this cohort, there appears to be a significant salary premium for women associated withworking in General Practice compared to working in general medicine and other fields.
Professional experienceThere is a pay premium for those women who have been keynote or plenary speakers atconferences compared to those women who have not attended or given papers at conferences.
British Medical Association
The Pay Gap for Women in Medicine and Academic Medicine 17
-20% 0% 20% 40% 60% 80% 100%
Experience GradeProgrammed activities
Administrative role Esteem UnexplainedSpecialty
LondonMobility

Summary of Differences in Treatment for Female TraineesDifferences in experience and roles appear to explain about 50% of the gender pay gap (Figure 8) but the other half remains unexplained. Of those differences that are explained – for example, women receive a lower return in salary for each year of experience than men – employers andprofessionals can actively reduce these differentials.
Figure 8 The amount of influence that each of the factors responsible forthe gender pay gap may exert for trainees
Using these results, having controlled for any differences in the characteristics or composition of thetrainee sample, we are able to provide an estimate of the true gender pay gap which exists amongsttrainees which is 4.1% – worth just over £2,000 per annum.
British Medical Association
The Pay Gap for Women in Medicine and Academic Medicine18
-20% -10% 0% 10% 20% 30% 40% 50% 60% 70% 80% 90%
Experience Contract Esteem UnexplainedSpecialty London

What this report showsOur analysis of pay information taken from the WAM cohort of the Athena Survey of Science,Engineering and Technology 2006 (ASSET 2006) database for male and female doctors finds that on average women earn £15,245 less per year than men. We find evidence that significant rawaverage gender pay gaps exist within sectors (17% in HEI, 21% in the NHS), within grades (13% for consultants and 8% for trainees) and within fields of speciality medicine (ranging from 7% inAccident and Emergency to 38% in Paediatrics). The raw gender pay gaps are lower for those doctors at the start of their career (£4,198 for trainees) but quite sizeable gaps emerge even amongst similarly successful men and women (£13,729 for consultants).
We undertake a decomposition analysis which allows us to identify the extent to which the genderpay gap can be explained because women are younger, have fewer years of experience, more likely to have had career breaks, less likely to hold high profile administrative or research posts. These factorsexplain about 60% of the gender pay gap amongst consultants and 50% of the pay gap amongsttrainees. The remaining 40-50% of these respective gender pay gaps are unexplained and are theresult of different returns for men and women working in these fields. Female consultants are less well rewarded for each additional year of experience or extra PA worked; unlike male consultants they do not benefit from a salary premium when they work part-time. Within specialties, the femaleconsultants working in the field of Paediatrics do not receive the same salary premium; females do notbenefit as much as men when they are promoted unless they also move employer. Similarly, femaletrainees do not receive the same premiums for extra years of experience. Our estimates suggest a truegender pay gap amongst consultants which is 5.6%, worth about £5,500 per annum and amongsttrainees which is 4.1%, worth just over £2,000 per annum. Even controlling for confounding factorsso that one doctor would be compared with another doctor having a similar background by using theregression analysis, our results demonstrate significant gender differences in salaries especially withinconsultant grades.
One step in closing the gender pay gap in medicine would be to close the grade gap. We need toensure that female talent is encouraged so that more women meet the relevant criteria for promotionand that those who do are promoted. A second step is that the medical profession considers themechanisms for determining salary at an individual level. Our results clearly show that men andwomen with identical experience and expertise are paid differently – which suggests evidence ofdiscrimination. Given the greater onus that the Gender Equality Duty places on employers to ensureequality of treatment, we would argue that institutions need to conduct reflective reviews of salary or gender pay audits in order to ensure compliance with the legislation. Wright et al (2007) provideevidence of an institution in the US which undertook such a review, salary disparities were identifiedfor 21 of the 400 members of faculty, salary adjustments averaging $17,323 were paid to eightwomen and the raw gender pay gap closed from 11% to 6.5%.
A second would be to consider why such differences in salary returns exist. One possibility identified in the literature (Babcock and Laschever (2003)) is that women are poor or unwilling negotiators and that this may explain why men have a salary advantage over similarly well qualified women. Thismight offer a plausible explanation for the higher salary returns that we observe for men who workadditional PAs or for the existence of a premium to men who work part-time. Similarly, a reluctance to bargain or negotiate hard over salary might explain why women who are promoted by their current employer earn less than those who are promoted when they move employer.
Finally, we attempt to identify which, if any, aspects of the workplace culture serve to disadvantage orundermine the position of women in medicine. Both men and women indicate that medical careersare demanding – requiring hard work and involving long hours – making it hard to achieve a good
British Medical Association
The Pay Gap for Women in Medicine and Academic Medicine 19

work-life balance. Women do anticipate and have direct experience that taking maternity leave andcareer breaks will have a quite significant impact upon their career. The quotations below relate tocomments posted as free text to highlight barriers to progress
13.
“Not having any children which has allowed me to work long hours“, “I am nervous that having a family will significantly slow my career progression“, “Am about to go on maternity leave, withinevitable consequences on research projects during this time; it will take 1-2 years minimum postleave to re-build group.”, “I was offered but had to turn down a clinical senior lecturer post because I cannot work as few hours as I need to and the responsibilities are too great to juggle with newmotherhood”, “They had very stereotypical views about women with young children. A femalecolleague who was childless was promoted over my head despite much lower experience, but Iapplied for promotion through an appeal process and got it.”, “Senior female staff exist in ourorganisation, but they do not have children and take the view that we should be ‘flexible’ andprepared to relocate if necessary”.
Parents cite the difficulties in arranging appropriate and flexible child-care and the heavier burden thatwomen often have in managing other domestic responsibilities: “How many male consultants do thesupermarket shopping...“, “Lack of childcare for long hours”, “Progressing in medicine whilstmanaging to find the right work life balance which is more difficult for women that it is for men.”,“Unable to attend meetings and sit in committees due to childcare difficulties”.
Many women attempt to manage the dual responsibilities of home and work by switching into part-time employment. However, these are not always easy to find: “I had to wait 8 years for a part-timeconsultant post“, “It is not encouraged for NHS academics to work part time and I will have to make a decision in the long run about what is more important“, “Too difficult to balance research, teachingand clinical commitments within a part-time position. The department is actively discouraging parttime work for clinical researchers/ clinical lecturers.” Career progression for those working part-time isoften regarded as more limited: “Being part-time, still regarded as inferior to full-time malecolleagues”, “Part-time working still seems to be incompatible with a successful academic career – Icannot see how to be competitive (as judged by RAE
14etc) against full time male colleagues with
fewer responsibilities.”
Beyond this, women are more likely than men to either have found their career progression limitedbecause of family commitments – for example, they have moved as their husband has moved jobs orare unwilling to move and uproot the family in order to achieve promotion: “Like many women I hadthe choice ‘stay in this job or leave’ rather than being able to apply for good jobs in other towns.”, “My career has often been interrupted in full flow by my husband moving jobs and my following.”,“Personal family commitments e.g. young, old family members; partner’s career helped and made movedifficult.”. The willingness to apply for jobs elsewhere is clearly used as a bargaining tool for promotionor higher salaries “Getting a job elsewhere and using it to trade with” but for women, their perceivedlack of mobility is identified by some as weakening their bargaining strength “Being in a position to
British Medical Association
The Pay Gap for Women in Medicine and Academic Medicine20
13 One quarter of the sample, 340 doctors, provided free text comments in addition to completingthe questionnaire, of these 120 commented on areas which relate to various dimensions of equalityof opportunity. Most (70) identified some form of direct discrimination (gender or race), a further30 mentioned difficulties which relate to motherhood and the remaining 20 mention issuesrelating to flexibility of employment, part-time employment and other work-life balance issues.
14 The RAE is the periodic Research Assessment Exercise though which the research activity andoutputs of academic departments are peer reviewed and upon which the allocation of researchincome is based.

threaten to leave seems to work for those staff who can be believed. This is not possible for those whoare known to be constrained by their partner’s job.” The reluctance of women to use an alternative joboffer as a bargaining tool and the fact that employers may perceive the exit threat as weak may serve to reinforce the argument made earlier in relation to men and women having different motivations and skills in regard to negotiating for a better deal. This may explain why we find that women whoachieve promotion with their current employer earn less than those who move to be promoted.
More worrying is that so many women regard the work culture as being unsupportive and evenhostile: “Ignoring discriminating comments from senior colleagues”, “It is still difficult for women to progress their careers in hospital medicine due to the long hours and lack of flexibility in workingpatterns and training. You need to have 110% commitment to progress. I have made many personallifestyle sacrifices“, “Hate to say it but I still think you have to work twice as hard to get anywhereespecially if you are of an ethnic minority and female. People make judgements on first impressionsand you have to work hard to show them otherwise.“, “There is no support or encouragement forwomen in the workplace“, “Female of ethnic minority, non-EU National.”, “The old boy network”,“Old fashioned conservative attitudes”, “Alpha male culture”, “Racism and sexism”, “It is still a man’sworld – especially at the top.”
The combined results from our decomposition analysis together with the individual comments byrespondents suggest inequalities in workplace progress and remuneration for women doctors. Part ofthe gender pay gap has been identified by factors that can be explained but the majority of the gap is unexplained by objective structured analysis. It is the qualitative comments that identify some of the subtle issues that have created the present situation. Employer and professional recognition ofthe pay gap and its causes can create a responsible approach to reducing this gap so that women’scontributions in medicine are valued and equality achieved.
British Medical Association
The Pay Gap for Women in Medicine and Academic Medicine 21

References
Anderson J & Connolly S (2006) Equal Measures: investigating university science pay and opportunitiesfor success, Research Briefing, UK Resource Centre for Women in Science, Engineering andTechnology. Norwich: University of East Anglia. (Available at http://www.uea.ac.uk/eco/ecopeople/ConnollyS.html-6#6)
Ash AA, Carr PL, Goldstein R et al (2004) Compensation and advancement of women in academicmedicine – is there equity? Annals of Internal Medicine. 141: 205-12.
Babcock L & Laschever S (2003) Women Don’t Ask: Negotiation and the Gender Divide. Princeton:Princeton University Press.
Bennett NM & Nickerson KG (1992) Women in academic medicine: perceived obstacles toadvancement. Journal of the American Medical Women’s Association 47: 115-8.
British Medical Association (2004) Women in academic medicine: challenges and issues. A report by the Health Policy and Economic Research Unit for the Medical Academic Staff Committee.London: British Medical Association.
British Medical Association (2008) Women in academic medicine. Developing equality in governanceand management for career progression. Full Report. London: British Medical Association.
Connolly S & Long S (2008) Women in science – fulfilment or frustration? Evidence on gender paygaps from the UK, University of East Anglia, Economics Research Centre, Discussion Paper 2008-2.Norwich: University of East Anglia.
Goldbeck-Wood S (2000) Reviving Academic Medicine in Britain. BMJ 320: 591-2.
Harkness S & Waldfogel J (2003) The family gap in pay: evidence from seven industrializedcountries. Research in Labor Economics. 22: 369-414.
Kaplan SH, Sullivan LM, Dukes KA et al (1996) Sex differences in academic advancement –Results of a national study of pediatricians. New England Journal of Medicine. 335: 1282-9.
Laine C & Turner BJ (2004) Unequal pay for equal work: the gender gap in academic medicine. Annals of Internal Medicine. 141: 238-40.
The Law Society (2008) Earnings and work of private practice solicitors in 2007. London: The Law Society.
Oaxaca R (1973) Male-female wage differentials in urban labour markets. International EconomicReview 14: 693-709.
Roberts J (2005) The feminisation of medicine. BMJ Careers. 8 January, 13-5.
Schafer J (1997) Despite progress women in academic medicine find glass ceiling still in place.Journal of Investigative Medicine. 45: 211-20.
Weeks WB & Wallace AE (2006) Gender differences in diagnostic radiologists’ annual incomes.Academic Radiology. 13: 1266-73.
Weeks WB & Wallace AE (2007a) Gender differences in ophthalmologists’ annual incomes.Ophthalmology 114: 1696-701.
Weeks WB & Wallace AE (2007b) Gender differences in dermatologists’ annual incomes, Cutis. 80: 325-32.
Wright AL, Ryan K, St Germain P et al (2007) Compensation in academic medicine: progress towardgender equity. Journal of General Internal Medicine. 22: 1398-402.
British Medical Association
The Pay Gap for Women in Medicine and Academic Medicine22

Appendix
Table A1 – Average annual salary for selected Professions15
Profession Male Female % gender pay gap
Medical practitioners £85,712 £65,324 24Psychologists £44,952 £35,743 20Pharmacists/pharmacologists £39,439 £34,967 11Ophthalmic opticians £46,119 £30,635 34Dental practitioners £53,695 £36,629 32Veterinarians £41,711 £30,957 26Higher education teaching £44,303 £37,502 15Further education teaching £33,104 £28,531 14Education officers, school inspectors £40,084 £35,464 12Secondary education teaching £35,763 £31,701 11Primary and nursery education teaching £34,586 £30,331 12Solicitors and lawyers, judges and coroners £61,519 £44,828 27Chartered and certified accountants £41,417 £36,392 12Management accountants £40,726 £34,270 16Management consultants, actuaries, £59,282 £38,873 34economists and statisticians
Architects £42,712 £29,507 31Town planners £36,594 £28,726 22Chartered surveyors (not quantity surveyors) £44,493 £32,132 28
Source: New Earnings Survey.
British Medical Association
The Pay Gap for Women in Medicine and Academic Medicine 23
15 Gross (£) – For full-time employees: United Kingdom, 2006 (the same year as the Women inAcademic Medicine survey was undertaken)
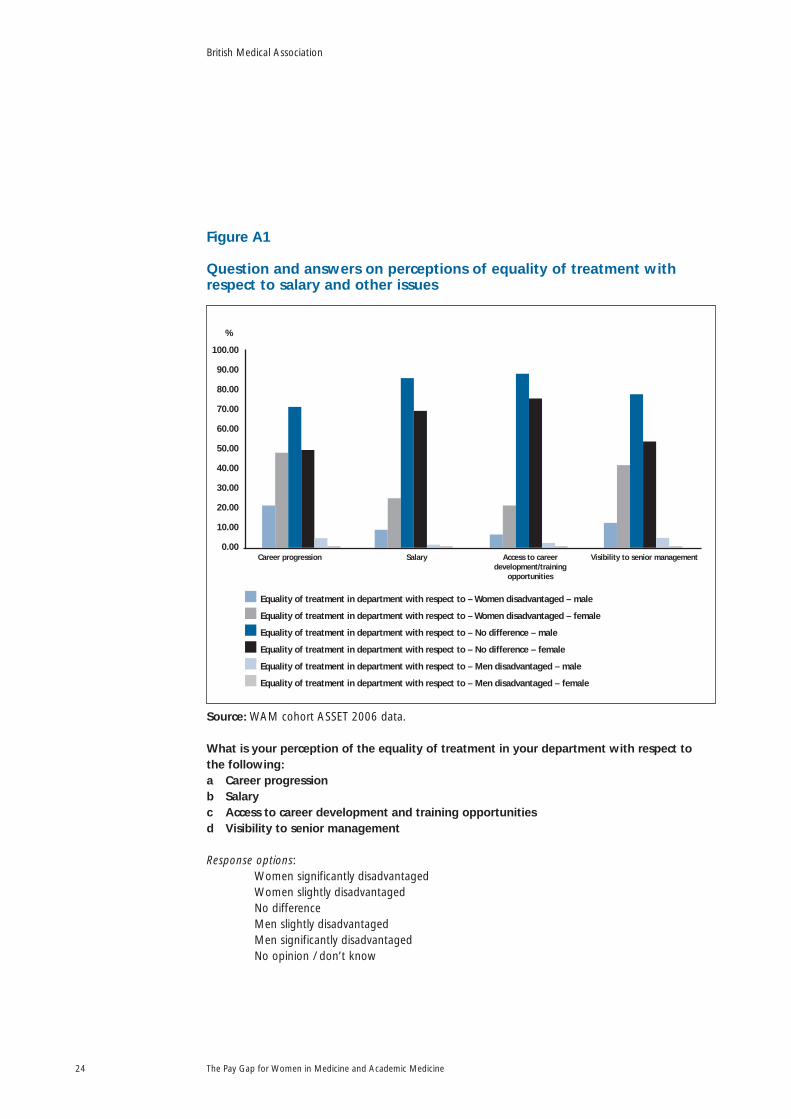
Figure A1
Question and answers on perceptions of equality of treatment withrespect to salary and other issues
Source: WAM cohort ASSET 2006 data.
What is your perception of the equality of treatment in your department with respect to the following: a Career progressionb Salaryc Access to career development and training opportunitiesd Visibility to senior management
Response options: Women significantly disadvantagedWomen slightly disadvantagedNo differenceMen slightly disadvantagedMen significantly disadvantagedNo opinion / don’t know
British Medical Association
The Pay Gap for Women in Medicine and Academic Medicine24
70.00
60.00
100.00
90.00
80.00
50.00
40.00
30.00
20.00
10.00
0.00Career progression Salary Access to career
development/trainingopportunities
Visibility to senior management
Equality of treatment in department with respect to – Women disadvantaged – male
Equality of treatment in department with respect to – Women disadvantaged – female
Equality of treatment in department with respect to – No difference – male
Equality of treatment in department with respect to – No difference – female
Equality of treatment in department with respect to – Men disadvantaged – male
Equality of treatment in department with respect to – Men disadvantaged – female
%
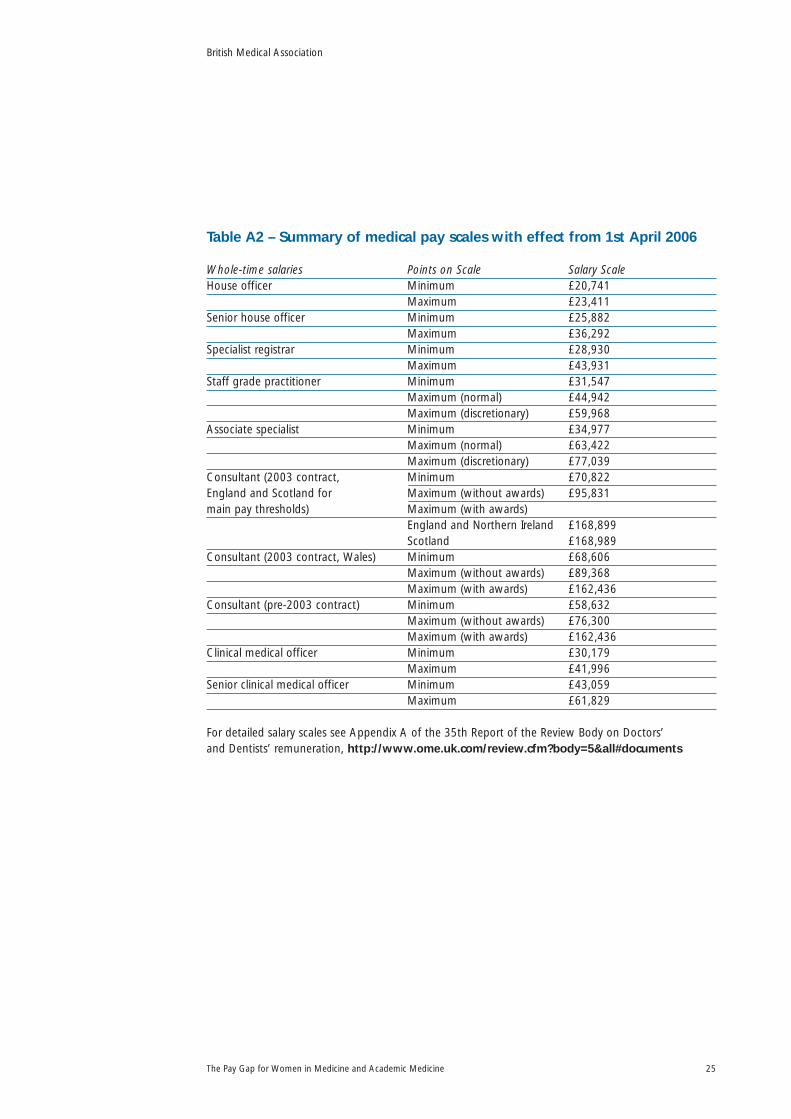
Table A2 – Summary of medical pay scales with effect from 1st April 2006
Whole-time salaries Points on Scale Salary Scale House officer Minimum £20,741
Maximum £23,411Senior house officer Minimum £25,882
Maximum £36,292Specialist registrar Minimum £28,930
Maximum £43,931Staff grade practitioner Minimum £31,547
Maximum (normal) £44,942Maximum (discretionary) £59,968
Associate specialist Minimum £34,977Maximum (normal) £63,422Maximum (discretionary) £77,039
Consultant (2003 contract, Minimum £70,822England and Scotland for Maximum (without awards) £95,831main pay thresholds) Maximum (with awards)
England and Northern Ireland £168,899Scotland £168,989
Consultant (2003 contract, Wales) Minimum £68,606Maximum (without awards) £89,368Maximum (with awards) £162,436
Consultant (pre-2003 contract) Minimum £58,632Maximum (without awards) £76,300Maximum (with awards) £162,436
Clinical medical officer Minimum £30,179Maximum £41,996
Senior clinical medical officer Minimum £43,059Maximum £61,829
For detailed salary scales see Appendix A of the 35th Report of the Review Body on Doctors’ and Dentists’ remuneration, http://www.ome.uk.com/review.cfm?body=5&all#documents
British Medical Association
The Pay Gap for Women in Medicine and Academic Medicine 25

Table A3 – Summary statistics for Consultants (as mean or %)
Experience Men WomenYears since obtained main medical qualification 25 23Years since becoming a consultant 10 9Age (years) 49 47In current academic grade for at least 10 years 24% 13%In current clinical grade for at least 10 years 53% 46%Taken a career break 9% 65%Length of career break (total in years) 0.09 0.88Ever in part-time employment 7% 44%Length of time in PT employment (total in years) 0.09 2.48GradeProfessor 31% 17%Reader 8% 7%Senior lecturer 31% 36%Primary contract in NHS not HEI 51% 59%Programmed ActivitiesNumber of Programmed Activities actually worked 12.84 12.51Number of Programmed Activities in contract 11.06 10.65Prizes and fellowshipsPrize/medal – Yes, in last 5 years 33% 22%Prize/medal – Yes, between 5 & 10 years ago 11% 12%Prize/medal – Yes, more than 10 years ago 19% 16%Prize/medal – No 38% 48%Have you been awarded any research fellowships? 46% 38%SpecialtyAccident & Emergency 2% 2%Anaesthetics 14% 6%Clinical oncology, nuclear medicine & radiology 10% 7%General medicine 20% 22%General practice 5% 5%Geriatrics 3% 2%Medical education 1% 1%Obstetrics & Gynaecology 7% 6%Ophthalmology 4% 4%Paediatrics 9% 7%Pathology 10% 14%Psychiatry 4% 9%Public health 3% 9%Surgery 7% 5%No speciality given 4% 1%Administrative rolesDean of faculty/Head of medical school 2% 1%Deputy dean of faculty/Head of medical school 3% 2%Head of dept or division 27% 17%Director of research of UG/PG studies 9% 9%Head of research group/section 28% 23%Undergraduate (UG) admissions 5% 5%Postgraduate (PG) admissions 2% 3%
British Medical Association
The Pay Gap for Women in Medicine and Academic Medicine26

Student support/welfare 5% 9%Other departmental admin posts 22% 27%Medical director 10% 4%GP principal 5% 4%Director of NHS Trust/clinical director 15% 9%Member of local medical committees 10% 8%Research outputIncluded in your department’s submission in the 2001Research Assessment Exercise 44% 29%No information on 2001 Research Assessment Exercise submission 36% 50%Has no sole authored publications 54% 46%Has 1 sole authored publication 9% 8%Has 2 sole authored publications 3% 4%Has 3 sole authored publications 3% 2%Has 4 sole authored publications 3% 1%Has 5 sole authored publications 1% 2%Has more than 5 sole authored publications 4% 3%No information on number of sole authored publications 23% 34%Has no lead authored publications 31% 30%Has 1 lead authored publication 9% 10%Has 2 lead authored publications 11% 15%Has 3 lead authored publications 4% 9%Has 4 lead authored publications 8% 7%Has 5 lead authored publications 4% 7%Has more than 5 lead authored publications 33% 23%Has no joint authored publications 19% 22%Has 1 joint authored publication 6% 10%Has 2 joint authored publications 9% 11%Has 3 joint authored publications 8% 10%Has 4 joint authored publications 6% 7%Has 5 joint authored publications 9% 4%Has more than 5 joint authored publications 43% 35%Involvement in conferencesKeynote-plenary speaker at a conference 46% 42%Specialist/break-out session speaker at a conference 54% 49%Sessional chair at a conference 53% 47%Has not attended a conference 6% 4%TeachingProportion of teaching in PA contract 7% 9%Proportion of teaching in PA worked 7% 9%Esteem indicatorsMember of a national advisory/policy committee 57% 42%Editorial board of an academic/profession/learned journal 52% 34%Assessor for a research council 48% 27%Member of grant giving panel 46% 26%Member of an international advisory/policy committee 29% 18%Company supported at professional meetings 18% 9%Board member of a PLC company or equivalent 10% 7%Editor of an academic/profession/learned journal 22% 10%Member of European Commission expert groups 9% 6%
British Medical Association
The Pay Gap for Women in Medicine and Academic Medicine 27

Professional societiesAttend meetings 83% 80%Present papers 46% 36%Member of special interest group 38% 36%Member of Council (professional) 22% 23%Member conference programme committee 23% 22%College examiner 31% 21%College tutor 20% 15%Running local/regional group 17% 10%President/Chair/Senior office 13% 12%Member of awards panel 14% 9%Member editorial board 18% 9%Regional advisor 13% 8%Career progressionChanged employer in last year 4% 5%Changed employer in last 1 to 5 years 23% 31%Been with current employer for more than 5 years 73% 64%Promoted by current employer 37% 32%Moved to achieve promotion 34% 28%LocationLondon 11% 21%Domestic responsibilitiesMarried or has a partner 93% 83%Not a parent 6% 27%Has children aged <6 23% 18%Has children aged 6-16 42% 43%Has joint or sole care responsibilities for children 61% 62%Has care responsibilities for partner or parents 11% 17%White 83% 88%
British Medical Association
The Pay Gap for Women in Medicine and Academic Medicine28

Table A4 – Summary statistics for Trainees (as mean or %)
Experience Men WomenYears since obtained main medical qualification 8 9Years in current grade 3 4Taken a career break 16% 47%Length of career break (total in years) 0.09 0.7Ever in part-time employment 11% 29%Length of time in PT employment (total in years) 0.14 1.32GradeLecturer 53% 33%Clinical researcher (trainee) 5% 9%Specialist Registrar/training post 58% 53%Senior House Officer 16% 18%GP Trainee 5% 7%Primary contract with NHS not HEI 53% 75%Prizes and fellowshipsPrize/medal – Yes, in last 5 years 39% 27%Prize/medal – Yes, between 5 & 10 years ago 8% 7%Prize/medal – Yes, more than 10 years ago 8% 4%Prize/medal – No 47% 56%Have you been awarded any research fellowships? 32% 28%SpecialismAccident & Emergency 3% 1%Anaesthetics 6% 6%Clinical oncology, nuclear medicine & radiology 0% 2%General medicine 21% 25%General practice 3% 14%Geriatrics 3% 3%Medical education 3% 0%Obstetrics & Gynaecology 6% 11%Ophthalmology 0% 3%Paediatrics 9% 7%Pathology 15% 9%Psychiatry 15% 7%Public health 3% 2%Surgery 12% 8%No speciality given 3% 1%Administrative rolesStudent support/welfare 8% 1%Other departmental administrative posts 11% 3%Member of local medical committees 8% 4%Research outputHas no sole authored publications 71% 54%Has 1 sole authored publication 3% 7%Has 2 sole authored publications 3% 1%Has 3 sole authored publications 0% 0%Has more than 3 sole authored publications 3% 2%No information on number of sole authored publications 21% 37%Has no lead authored publications 29% 44%
British Medical Association
The Pay Gap for Women in Medicine and Academic Medicine 29

Has 1 lead authored publication 23% 16%Has 2 lead authored publications 16% 15%Has 3 lead authored publications 16% 6%Has more than 3 lead authored publications 16% 19%Has no joint authored publications 26% 45%Has 1 joint authored publication 17% 13%Has 2 joint authored publications 29% 22%Has 3 joint authored publications 11% 10%Has more than 3 joint authored publications 17% 10%Involvement in conferencesKeynote-plenary speaker at a conference 26% 11%Specialist/break-out session speaker at a conference 26% 16%Sessional chair at a conference 13% 6%Has not attended a conference 5% 15%Esteem indicatorsMember of an editorial board 12% 4%Professional societiesAttend meetings 79% 54%Present papers 29% 21%Member of special interest group 15% 11%Career progressionChanged employer in last year 26% 20%Changed employer in last 1 to 5 years 58% 53%Been with current employer for more than 5 years 16% 27%Promoted by current employer 16% 17%Moved to achieve promotion 29% 18%LocationLondon 11% 13%Domestic responsibilitiesMarried or has a partner 76% 75%Not a parent 63% 60%Has children aged <6 24% 27%Has children aged 6-16 16% 17%Has joint or sole care responsibilities for children 26% 37%Has care responsibilities for partner or parents 8% 12%White 63% 74%
British Medical Association
The Pay Gap for Women in Medicine and Academic Medicine30

Technical Appendix
British Medical Association
The Pay Gap for Women in Medicine and Academic Medicine 31

Table TA1 – Preferred model for all Consultants including HonoraryConsultants who are Professors, Readers, Senior lecturers in HEICoef = Estimated regression coefficient, t-stat = Estimated t-statistics
Men WomenExperience Coef t-stat Coef t-statIn current clinical grade for at least 10 years 0.34 7.43 0.13 5.53Length of time in PT employment 0.53 2.57 -0.01 -0.52Square of years in PT employment -0.29 -2.56 0.00 0.02GradeProfessor 0.22 3.04 0.08 1.88Senior lecturer 0.07 1.42 -0.02 -0.81NHS Consultants (not HEI) 0.13 2.89 0.05 1.83Programmed activitiesNumber of PAs actually worked 0.01 1.67 0.00 1.36Number of PAs in contract 0.01 1.57 0.00 -0.09SpecialtiesGeriatrics 0.24 2.13 -0.01 -0.08Paediatrics 0.11 1.77 -0.03 -0.75Anaesthetics 0.03 0.55 0.07 1.47Psychiatry -0.02 -0.24 0.04 1.18London 0.20 3.08 0.01 0.21Career mobility/ progressionChanged employer in last 1 to 5 years 0.06 1.17 0.00 0.10Promoted by current employer 0.05 1.06 -0.05 -1.75Administrative responsibilitiesDean of faculty/Head of medical school 0.04 0.21 0.24 2.61Head of dept or division 0.15 3.19 0.05 1.53UG admissions 0.07 0.65 -0.06 -0.94PG admissions -0.20 -1.28 0.16 2.02Medical director 0.07 1.16 0.19 3.38Director of NHS Trust/clinical director 0.07 1.36 0.18 4.34Conferences Keynote-plenary speaker 0.00 0.05 0.08 3.17Esteem/Professional SocietiesMember of grant giving panel -0.05 -0.94 0.12 3.47Outreach/schools/equivalent activities for -0.24 -2.57 0.06 0.95professional organisationPresident/Chair or VP/VC/Treasurer/Other 0.10 1.47 0.15 4.43senior officer of professional organisation
Constant17
10.87 147.9 11.16 256.7Adjusted R-squared 0.6717 0.5285
British Medical Association
The Pay Gap for Women in Medicine and Academic Medicine32
17 The constant term reflects the average salary (measured in natural logs) when all of theexplanatory variables take a value of zero. This is interpreted as the reference group.
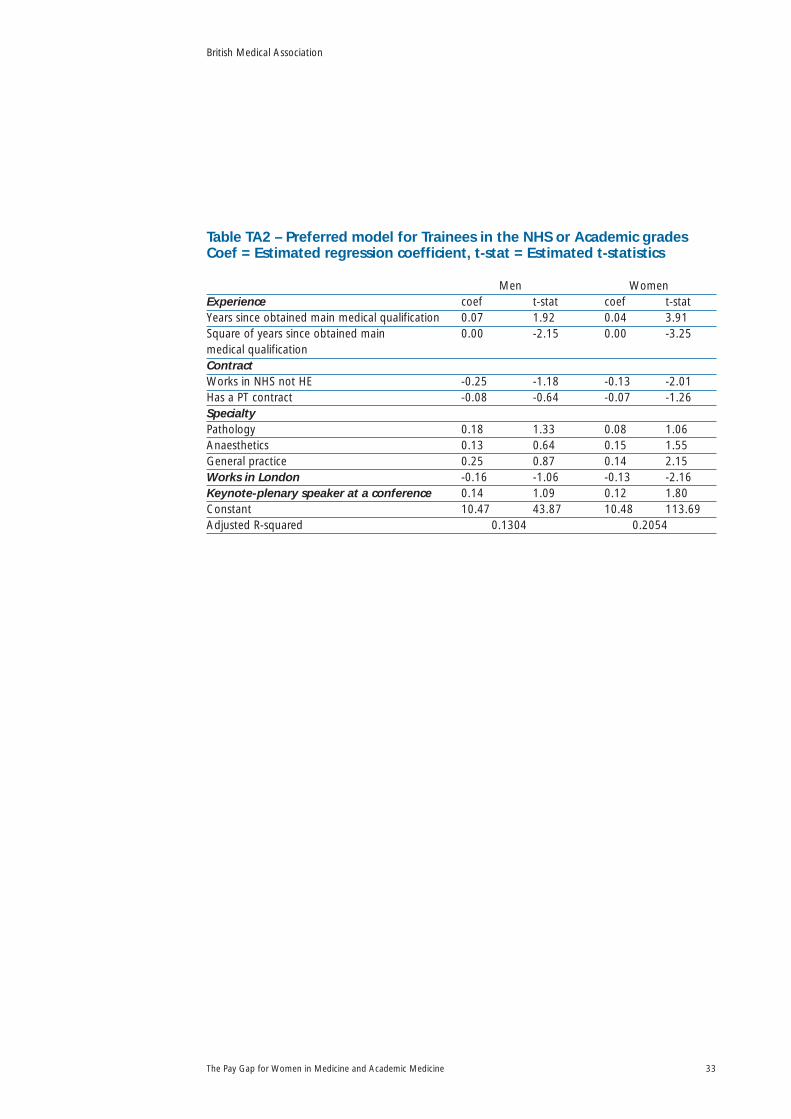
Table TA2 – Preferred model for Trainees in the NHS or Academic gradesCoef = Estimated regression coefficient, t-stat = Estimated t-statistics
Men WomenExperience coef t-stat coef t-statYears since obtained main medical qualification 0.07 1.92 0.04 3.91Square of years since obtained main 0.00 -2.15 0.00 -3.25medical qualificationContractWorks in NHS not HE -0.25 -1.18 -0.13 -2.01Has a PT contract -0.08 -0.64 -0.07 -1.26SpecialtyPathology 0.18 1.33 0.08 1.06Anaesthetics 0.13 0.64 0.15 1.55General practice 0.25 0.87 0.14 2.15Works in London -0.16 -1.06 -0.13 -2.16Keynote-plenary speaker at a conference 0.14 1.09 0.12 1.80Constant 10.47 43.87 10.48 113.69Adjusted R-squared 0.1304 0.2054
British Medical Association
The Pay Gap for Women in Medicine and Academic Medicine 33

BMA Medical Academics
British Medical Association, BMA House, Tavistock Square, London, WC1H 9JP
www.bma.org.uk
© British Medical Association, 2009 CO
DE:
BM
A50
440
PAY
GA
P RE
PORT