The Pareto fitness genetic algorithm: Test function...
17
The Pareto fitness genetic algorithm: Test function study Samya Elaoud a, * , Taicir Loukil a , Jacques Teghem b a Laboratoire GIAD–FSEG–Sfax, B.P. 1081, 3018 Sfax, Tunisia b FPMs/MATHRO Rue de Houdain, 9, B-7000 Mons, Belgium Abstract Evolutionary algorithms have shown some success in solving multiobjective optimization problems. The methods of fitness assignment are mainly based on the information about the dominance relation between individuals. We propose a Pareto fitness genetic algorithm (PFGA) in which we introduce a modified ranking procedure and a promising way of sharing; a new fitness function based on the rank of the individual and its density value is designed. This is considered as our main contribution. The performance of our algorithm is evaluated on six multiobjective benchmarks with different Pareto front features. Computational results (quality of the approximation of the Pareto optimal set and the number of fitness function evaluations) proving its efficiency are reported. Ó 2005 Elsevier B.V. All rights reserved. Keywords: Multiobjective optimization; Genetic algorithm; Pareto ranking 1. Introduction The multiobjective optimization problems (MOP) consist of the simultaneous optimization of several possibly conflicting and incommensurable objectives and result in a set of non-dominated solutions. This set, generally called Pareto front, helps the decision maker to identify the best compromise solutions by elimination of inferior ones. The choice of one solution over the other entails an additional knowledge of the problem such as the relative importance of different objectives. Evolutionary algorithms (EAs) seem to be particularly suitable for MOP because they can sample many Pareto optimal solutions in parallel via a population of solutions in a single run. The ability to handle 0377-2217/$ - see front matter Ó 2005 Elsevier B.V. All rights reserved. doi:10.1016/j.ejor.2005.10.018 * Corresponding author. E-mail addresses: [email protected] (S. Elaoud), [email protected] (T. Loukil), [email protected] (J. Teghem). European Journal of Operational Research xxx (2005) xxx–xxx www.elsevier.com/locate/ejor ARTICLE IN PRESS
Transcript of The Pareto fitness genetic algorithm: Test function...

ARTICLE IN PRESS
European Journal of Operational Research xxx (2005) xxx–xxx
www.elsevier.com/locate/ejor
The Pareto fitness genetic algorithm: Test function study
Samya Elaoud a,*, Taicir Loukil a, Jacques Teghem b
a Laboratoire GIAD–FSEG–Sfax, B.P. 1081, 3018 Sfax, Tunisiab FPMs/MATHRO Rue de Houdain, 9, B-7000 Mons, Belgium
Abstract
Evolutionary algorithms have shown some success in solving multiobjective optimization problems. The methods offitness assignment are mainly based on the information about the dominance relation between individuals. We proposea Pareto fitness genetic algorithm (PFGA) in which we introduce a modified ranking procedure and a promising way ofsharing; a new fitness function based on the rank of the individual and its density value is designed. This is considered asour main contribution. The performance of our algorithm is evaluated on six multiobjective benchmarks with differentPareto front features. Computational results (quality of the approximation of the Pareto optimal set and the number offitness function evaluations) proving its efficiency are reported.� 2005 Elsevier B.V. All rights reserved.
Keywords: Multiobjective optimization; Genetic algorithm; Pareto ranking
1. Introduction
The multiobjective optimization problems (MOP) consist of the simultaneous optimization of severalpossibly conflicting and incommensurable objectives and result in a set of non-dominated solutions. Thisset, generally called Pareto front, helps the decision maker to identify the best compromise solutions byelimination of inferior ones. The choice of one solution over the other entails an additional knowledgeof the problem such as the relative importance of different objectives.
Evolutionary algorithms (EAs) seem to be particularly suitable for MOP because they can sample manyPareto optimal solutions in parallel via a population of solutions in a single run. The ability to handle
0377-2217/$ - see front matter � 2005 Elsevier B.V. All rights reserved.doi:10.1016/j.ejor.2005.10.018
* Corresponding author.E-mail addresses: [email protected] (S. Elaoud), [email protected] (T. Loukil), [email protected] (J.
Teghem).

2 S. Elaoud et al. / European Journal of Operational Research xxx (2005) xxx–xxx
ARTICLE IN PRESS
complex problems reinforces the potential effectiveness of EAs in multiobjective search and optimization[8]. The numerous applications and the rapidly growing interest in the area of multiobjective evolutionaryalgorithm (MOEA) take this fact into account.
A detailed survey of MOEA has been published recently [3,4] were advantages and disadvantages of themost known existing methods are discussed. Thus, in the present paper we do not review again this field.Nevertheless, we give a few words on the methods we mentioned later for comparison reasons.
• The pioneering work in the area of EAs for MOP is the vector evaluated genetic algorithm (VEGA) pro-posed by Schaffer [17], and then Hajela and Lin [10] included the weighting method in the fitness func-tion assignment. Fonseca and Fleming [9] proposed a Pareto based ranking procedure that includes thedensity information into the rank. The rank of a given individual is the number of individuals who dom-inate it and added to it one. The distribution of individuals over the Pareto region was performed by afitness sharing procedure.
• Srinivas and Deb [18] introduced the ranking procedure proposed by Goldberg in the non-dominatedsorting genetic algorithm (NSGA) where the rank of each individual is based on the rank of the frontto which it belongs. To maintain diversity, a fitness sharing is done in the decision space for each frontseparately. Deb et al. [7] proposed an enhanced version of the NSGA including an elitism strategy andcrowding sort to avoid the use of the sharing factor. NSGA II used a tournament selection that preferspoints with a lower rank value from a combined parent and children population. Ties are broken by thebigger crowding distance which is an estimate of the size of the largest cuboid enclosing a given individ-ual without including any other.
• Horn et al. [11] proposed niched Pareto genetic algorithm (NPGA) with a Pareto dominance tourna-ment selection scheme: two individuals are compared with a number of individuals picked randomlyas a sample from the current population. If both competitors are either dominated or non-dominated,the selection is decided through a fitness sharing procedure, otherwise the non-dominated one isselected.
• Zitzler et al. [21] proposed the strength Pareto evolutionary algorithm II (SPEA II) as an improvementof the (SPEA I) [19] where the strength of an individual is the number of solutions it dominates in theunion of the current population and an incumbent external set of non-dominated solutions. The rank isdetermined by the strengths of its dominators in that union. The fitness value is the summation of therank and the density value that is a decreasing function of the distance of the kth nearest data point.Therefore, the fitness of an individual depends strongly on the parameter k and the number and the dis-tribution of individuals it dominates.
• The multipopulation genetic algorithm (MPGA) [2] is characterized by two steps. The first evolves apopulation considering a weighted fitness of all objectives. In the second step, the population is dividedinto sub-populations each optimizing one of the k objectives and the last evolves considering the com-bined objective.
• Lu and Yen [14] proposed the rank-density based genetic algorithm (RDGA) where the rank of an indi-vidual is the summation of the rank of its dominators which is majored by one. An adaptive density esti-mation procedure is also proposed. A modified VEGA (see [17]) with an overlapping selection model isthen used to fulfill fitness assignment minimizing both population diversity value and individuals rank.Finally the RDGA maintains an archive of elite solutions that may be reintroduced in the populationwith a given probability.
• The Pareto archive evolutionary strategy (PAES) [12] is purely based on the mutation operator to searchfor new individuals. An archive of elitist previously generated solutions is maintained and updated ateach generation. A new crowding method is also introduced to promote diversity in the population.It was initially conceived as a (1 + 1) evolutionary strategy (a single parent generates a single offspring),it has been extended later to the (l + k)-PAES.

S. Elaoud et al. / European Journal of Operational Research xxx (2005) xxx–xxx 3
ARTICLE IN PRESS
• Sarker et al. [16] proposed a (l + k) multiobjective evolutionary algorithm (MEA) which only considersnon-dominated solutions in the reproduction process. k new offspring are generated at each generationfrom the l non-dominated individuals using discrete recombination and Gaussian mutation, where k iscalculated by multiplying l by a fixed ratio. If the number of non-dominated individuals exceeds lmax, itwill be limited using a nearest neighborhood distance function.
In spite of this variety, all of these methods require the determination of some appropriate parameters inorder to direct the search in better way: the fitness sharing procedure requires an intensive experimentationin order to search for the appropriate sharing factor, size of tournament in NPGA . . .
Coello Coello [4] argues that the primary difficulty in the existing MOEAs lies in designing a suitablefitness assignment strategy in order to search for a near-complete and near-optimal approximated Paretofront for the given optimization problem. Nevertheless, the fitness design is closely dependent on othergenetic operators. For instance if a given fitness function favors the convergence of the population tothe Pareto front without considering its diversity, it will be necessary to introduce a means of diversificationsuch as a higher mutation rate or a multipoint crossover.
We introduce in this paper, a Pareto fitness genetic algorithm proposed specifically for multiobjectiveproblems by taking advantage of a novel fitness function design, density estimation strategy, ranking pro-cedure and modified genetic operators. The PFGA presents a better efficiency, comparing with existingmethods, in both quality of results and computational requirements.
The remainder of this paper is organized as follows. In Section 2, we present a Pareto fitness genetic algo-rithm and different proposed procedures. Section 3 presents six studied multiobjective benchmarks andempirical results of the specific implementation. In Section 4, we propose some metrics to evaluate the per-formance of the PFGA results compared with exact solutions. Finally, we conclude the paper with someremarks and future research directions.
2. The Pareto fitness genetic algorithm (PFGA)
In this section, we describe the double ranking strategy that includes both the density information andindividuals’ distribution in the rank. We also propose the population size adaptive density estimation thatavoids the intensive search of any sharing factor and takes into consideration any population size changes.A Pareto fitness function is also proposed to search for uniformly distributed and near-complete Paretofront. We finally describe modified genetic operators such as the Binary selection designed in order toensure a level of diversity during the evolutionary process.
2.1. Double ranking strategy (DRS)
In a first stage, we assign to an individual a dummy rank value R 0(i) representing the number of individ-uals that dominate it in the current population P.
R0ðiÞ ¼ jfj=j 2 P ; i � jgj 8i 2 P ;
where the symbol � corresponds to the Pareto dominance relation i.e. i � j if solution j performs betterthan solution i considering all criteria at a time.
An individual’s rank R(i) is then defined as the summation of its own dummy rank value and those of itsdominators.
RðiÞ ¼ R0ðiÞ þX
j2P ;i�j
R0ðjÞ 8i 2 P .

Fig. 1. Individual rank values resulting from different ranking methods.
4 S. Elaoud et al. / European Journal of Operational Research xxx (2005) xxx–xxx
ARTICLE IN PRESS
For instance, for point C in Fig. 1, we have
R0ðiÞ ¼ 4 and RðiÞ ¼ 4þ ð0þ 1þ 1þ 3Þ ¼ 9.
This approach is different from the ranking scheme proposed in SPEA II since the rank of a given individ-ual does not depend on individuals that it dominates but only on its dominators. This approach is then,more suitable to deal with the genetic drift phenomenon (where the population tends to evolve toward asmall region of the search space, even if other regions of similarly high fitness exist) since it takes into con-sideration not only the number of dominators, as it is in the MOGA ranking procedure, but also their dis-tribution in the search space.
Considering a population of 13 individuals (solutions) in a two objective minimization problem, eachindividual is represented by a dot in the objective space (f1, f2) and is assigned different rank values whichare respectively obtained by using five ranking procedures; namely from left to right: MOGA, NSGA II,SPEA II, RDGA and finally DRS (see Fig. 1).
In DRS all non-dominated individuals are assigned a zero rank value while dominated ones are penal-ized following to the Pareto dominance relation between its dominators. Individuals located in the secondPareto front and which are dominated by only one individual (A, B), are also assigned a relatively low DRSrank value since we believe that they have non-exploited good schemata and a high probability to producenon-dominated offspring.
2.2. Population size adaptive density estimation (PADE)
Almost all sharing procedures require the search for the adequate niche’s size or the cell width for eachdimension in the search space. Depending on this sharing factor, the population evolves trying to maintainan equitable distribution of the individuals in the search space and to promote non-explored regions. How-ever, this factor needs a high care to be determined. This task will be more critical in the case of a dynamicpopulation size. Whether this sharing factor is adaptive to any change in the population size or not is aquestion of a critical importance.
The principle of the population size adaptive density estimation strategy (PADE) proposed in this paper,can be explained with a simple geographic example. For a population of 100 individuals and a land squareof 25 km2, the optimal distribution, i.e. preventing crowding, is when each individual lives in exactly0.25 km2 or 1/N of the whole square, where N represents the population size. Analogically, the cell width

S. Elaoud et al. / European Journal of Operational Research xxx (2005) xxx–xxx 5
ARTICLE IN PRESS
of each dimension space is determined considering this ideal population distribution in the search space.This refers to a population where each individual occupies 1/N of the objective space measure.
Therefore, this procedure consists in splitting the search space according to each criterion. The objectivespace is then divided into hypercubes building a grid that determines the density of individuals. In Fig. 2,obtained cells in a bi-objective search space are delimited by dashed lines.
The cell width Wdi in each objective dimension i may be calculated with the following formula:
Wdi ¼maxx2X fiðxÞ �minx2X fiðxÞffiffiffiffi
Nkp ; i ¼ 1; . . . ; k;
where k denotes the number of objectives and maxx2X fi(x) (respectively minx2X fi(x)) represents the maxi-mum (respectively minimum) reached value of objective fi reached by all visited solutions.
LetffiffiffiffiNk
p¼ aþ r, such that a 2 N and 0 6 r < 1; the number of cells nc in each dimension will then be
equal to the smallest integer that is greater or equal toffiffiffiffiNk
p:
nc ¼a; if r ¼ 0;
aþ 1; otherwise.
�
Since the aims of MOP is to converge toward the Pareto front, PADE favors non-inferior region in thesearch space by assigning smaller size to these cells (see Fig. 2).
If r 5 0, the non-inferior cells of each objective will have a width of wi, which is the fractional part offfiffiffiffiNk
pmultiplied by Wdi.
wi ¼ Wdi � r.
We thus obtain
maxx2X
fiðxÞ �minx2X
fiðxÞ ¼a � Wdi; if r ¼ 0;
a � Wdi þ wi; otherwise.
�
We can now define the density value of a given individual as the number of solutions located in a single cell;for instance in Fig. 2, D(A) = 2.
Fig. 2. Population size adaptive density estimation.

6 S. Elaoud et al. / European Journal of Operational Research xxx (2005) xxx–xxx
ARTICLE IN PRESS
It should be underlined that the number of created cells is the same for each dimension but the size ofeach niche relatively to each objective is dynamically modified at each generation depending on the highestand the lowest values of the objective space during the evolution process.
This procedure may be easily implemented and avoids the problem of the incommensurability of differ-ent objectives. Indeed, each cell is determined for each objective separately and the number of divisions(cells) considering each search dimension is always the same, i.e. independently of the objective dimension.Moreover, this procedure is easy to implement and avoids the use of any sharing factor (see [11]).
2.3. Pareto fitness assignment
A new fitness assignment is proposed. It tries to exploit the genetic drift to converge the solution to anearly Pareto optimal point and, on the other hand, to avoid it in order to sketch a uniformly sampledtrade-off surface for the final Pareto front. Since the density information has already been incorporated intothe DRS, an exponential importance is assigned to the rank values panelized by the density indicator. Thefitness of an individual is then
f ðxiÞ ¼1
expðRðxiÞÞ � DðxiÞ;
where D(xi) denotes the density value of solution xi.Note that the rank of a non-dominated individual is equal to zero, Rð�xÞ ¼ 0 so expðRð�xÞÞ ¼ 1. The cor-
responding fitness will only depend on its density value to strongly penalize crowded solutions and to pre-vent genetic drift.
The rank of any dominated solution depends on its Pareto optimality and penalizes exploited andcrowded dominated regions at the same time, while the density value considers the distribution of the pop-ulation in the whole objective space.
A non-dominated solution which does not share the cell with any other individual will have a rank valueequal to zero, a density value equal to one and accordingly a maximum fitness value equal to one.
2.4. Selection operation
One of the most known selection methods is the Roulette wheel selection (RWS) where each individual isassigned a portion of the wheel proportional to its fitness. Individuals are then selected by a spin in asequence of independent selection trials (see Fig. 3). The RWS may fail when only one individual is stronglybetter than other solutions in the population. This elite will probably be very frequently selected due to its
Fig. 3. Roulette wheel selection (sampling with replacement).

S. Elaoud et al. / European Journal of Operational Research xxx (2005) xxx–xxx 7
ARTICLE IN PRESS
biggest slice in the roulette which may cause its redundancy in the mating pool and, in consequence, in thenext population.
The stochastic universal sampling (SUS) was introduced by Baker [1] in order to reduce the stochasticselection caused by the previous method; k parents may be selected at a single wheel spin by equally spacedpointers (see Fig. 4). Although this method has shown some success, the selected individuals are highly cor-related by the distribution of their corresponding slots in the Roulette, since the difference between differentspins remains fixed during the whole selection process.
Moreover, these two presented methods consider the whole population members, even the worst ones, aspossible candidates to contribute to the recombination operators in order to guarantee diversification in thepopulation. However, the probability of a non-dominated individual being derived from a dominated indi-vidual decreases as the rank of the individual in the population increases. In other selection schemes [16],only non-dominated solutions are allowed to reproduce. This may be beneficial in term of CPU time butmay strongly affect the population distribution if the number of non-dominated individuals is too small rel-atively to the population size. In our implementation, we consider, for reproduction, solutions having arank value R(x) such that
RðxÞ < Nnc
;
where N denotes the population size and nc represents the number of division (cells) according to onedimension (this parameter is the same for all problem dimensions).
This limitation is certainly less computationally expensive than considering all population members.Besides, this guarantee a well-distributed population according to the principles explained in Section 2.2.
Thus, to overcome the identified weaknesses of the RWS and SUS methods, we slightly modify thesemechanisms and propose a binary stochastic sampling without replacement, which selects two different par-ents from the current population as follows:
• Summing the fitness of all population members having an acceptable rank (we name this summation asthe total fitness).
• Normalizing the fitness of each considered individual by dividing it by the total fitness.• Generate a random number (R1) between 0 and 1.• The first selected individual ‘‘i’’ is whose normalized fitness, added to the preceding individual, is greateror equal to (R1).
• Generate a second random number (R2) between 0 and 1 private from the interval between the addednormalized fitness of the individual ‘‘i � 1’’ and the added normalized fitness of the individual ‘‘i’’.
Fig. 4. Stochastic universal sampling.

Fig. 5. Binary stochastic sampling without replacement.
8 S. Elaoud et al. / European Journal of Operational Research xxx (2005) xxx–xxx
ARTICLE IN PRESS
• The second selected individual is whose normalized fitness, added to the preceding individual, is greateror equal to (R2).
This can be easily shown in Fig. 5. We randomly choose R1 = 0.6 so the individual 4 is chosen. R2 mustthen be chosen in the range ]0, 0.35[ [ ]0.75, 1] which is represented in Fig. 5 by the grey plan.
The main particularity of this method is that it is based on pair selection and does not maintain a matingpool of individuals. The two selected parents will automatically undergo a two-point crossover then onerandomly chosen type of mutation (permutation of two bits, changing one bit’s value . . .) will be appliedon one of the two resulted offspring. This whole process is repeated until the desired number of offspringbeing produced. The crossover and mutation rate are different from those used by competitor algorithmssince the selection scheme of the PFGA is different and requires a crossover rate Pcross = 1. One of the tworesulting offspring will undergo a mutation with a bit flip mutation rate 1/k for a chromosome of k genes[15].
2.5. Elitist external set
An elitist external set is also created to maintain elitist solutions in the whole evolution process. This setis updated at each generation according to the elitist scheme proposed by Knowles and Corne [12]. Non-dominated individuals are first copied from the population to the archive set which is updated at each gen-eration by introducing new Pareto optimal solutions and removing dominated ones. The final Pareto frontwill derive from this external set.
During the evolutionary process, a small random number R (R = 1 or 2) of elitist external set solutionsare also randomly selected and reintroduced into the population in order to undergo recombination oper-ators and produce high quality children. Algorithm 1 resumes different steps of the proposed PFGA.
Algorithm 1 (The PFGA algorithm).
Initializing at random a population of solutionsWHILE (non-Stop) DO
Evaluate the current populationUpdate the elitist set by coping non-dominated solutionsAssigning rank and density value to each individualCalculate the corresponding fitnessSet i = 0

S. Elaoud et al. / European Journal of Operational Research xxx (2005) xxx–xxx 9
ARTICLE IN PRESS
WHILE (i < R) DOSelect a solution randomly from the elitist external setReintroduce the selected solution to the next populationi = i + 1
ENDWHILE (i < Population size) DO
Select two different parentsPerform crossoverIntroduce children into the next populationi = i + 2Perform mutation on one randomly selected child
ENDEND
3. Experimental results
A set of multiobjective test functions presented in [5] was attractive for many researchers to evaluate theperformance of their newly proposed approaches [16,13]. Seven multiobjective evolutionary algorithms andone random search algorithm were compared and executed on six test functions: random search (RAND),FFGA, NPGA, HLGA, VEGA, NSGA, a single-objective EA using weighted-sum aggregation (SOEA),and SPEA. Since the SPEA is claimed to be the best among those listed, Sarker et al. [16] compared their(l + k) MEA to the SPEA on five selected benchmarks.
To evaluate the efficiency of the proposed PFGA, we tested it on five selected multiobjective optimiza-tion problems exhibiting different Pareto front features: convex, non-convex, discontinuous, multimodaland non-uniform. These benchmark test function problems were carefully designed by Ziztler [20] followingthe guidelines in [6] and tested using different MOEA in [16]. Another convex multimodal MOP is chosensince the relative Pareto front is represented by a very thin curve. This problem is designed to explore localand global Pareto optimality caused by specificities of its objective functions and constraints. It is shown tobe strongly dependent on the initial population and requires a high number of function evaluations to reachthe true Pareto curve [15].
3.1. DEBs multiobjective benchmark
The first considered benchmark is a two-variable, two-objective local Pareto testing problem initiallyproposed by Deb [6] and used by Lu and Yen [15]. It was chosen to estimate the ability of the algorithmto escape from possible convergence to a local Pareto front.
Minimize f1ðx1; x2Þ and f 2ðx1; x2Þ; where
f1ðx1; x2Þ ¼ sinp2x1
� �
f2ðx1; x2Þ ¼1� e�
ðx2�0:1Þ20:0001
� �þ 1� 0:5e�
ðx2�0:8Þ20:8
� �arctanð100x1Þ
Subject to 0 6 xi 6 1; i ¼ 1; 2.
As it is shown in the following figures this problem is characterized by a thin Pareto curve and presents ahigh probability to push the evolution process toward local optima. Lu and Yen [15] argue that reaching

10 S. Elaoud et al. / European Journal of Operational Research xxx (2005) xxx–xxx
ARTICLE IN PRESS
the Pareto set strongly depends on whether the initial population contains an individual on the true Paretoset or not.
We are using graphical representations of the Pareto-optimal curve found by different methods. It shouldbe noted that we did not implement the competitor algorithms but the results are reported from Lu andYen’s implementations [15]. In order to be as closed as possible to these implementations the populationis initialized, in our experiments, in the way that it does not contain any individual in the true Pareto front.Each variable Xi is coded by a string of integer values.
Fig. 6 underlines the fact that the PFGA outperform MOEAs in breaking away from the local Paretofront and providing better distribution of individuals over the non-dominated regions. The competitoralgorithms use 10,000 functions evaluations while the PFGA generates acceptable performance with only8000 fitness function evaluations. Nevertheless, PFGA shows a high level of efficiency to reach a near-opti-mal Pareto front while other approaches fell in a premature convergence.
3.2. Zitzler’s multiobjective benchmarks
The bases of this empirical study is formed by a set of well-defined, domain-independent test functionsthat allows the investigation of independent problems features [20]. In the following, we present the PFGAimplementation results compared to those of (l + k) MEA and SPEA on five numerical benchmarks listedin Table 1 as they were presented in [16].
Figs. 7–12 show the data points of non-dominated solutions of the three considered algorithms where thefunction f1 is represented horizontally and function f2 represented vertically. The (l + k) MEA (denoted inFigs. 7–12 as MOES) and the SPEAs presented Pareto curves are the outcome of five independent runswhich were unified and the dominated resulting solutions are deleted from the union set.
Fig. 6. Comparative results.
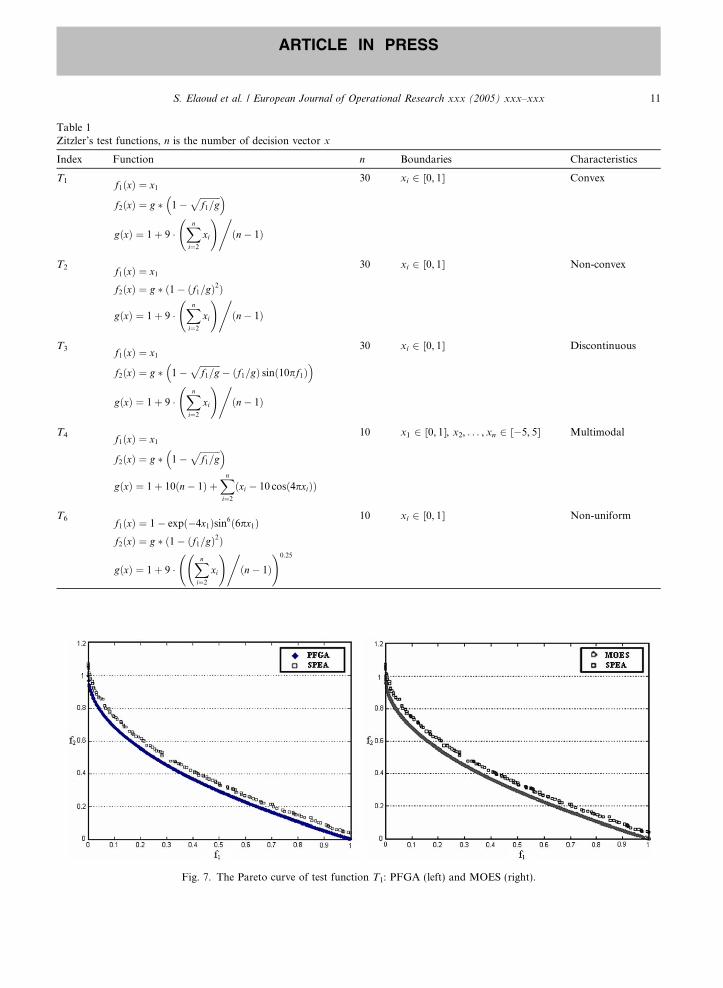
Table 1Zitzler’s test functions, n is the number of decision vector x
Index Function n Boundaries Characteristics
T1 f1ðxÞ ¼ x1
f2ðxÞ ¼ g � 1�ffiffiffiffiffiffiffiffiffif1=g
p� �
gðxÞ ¼ 1þ 9 �Xni¼2
xi
!,ðn� 1Þ
30 xi 2 [0, 1] Convex
T2 f1ðxÞ ¼ x1
f2ðxÞ ¼ g � ð1� ðf1=gÞ2Þ
gðxÞ ¼ 1þ 9 �Xni¼2
xi
!,ðn� 1Þ
30 xi 2 [0, 1] Non-convex
T3 f1ðxÞ ¼ x1
f2ðxÞ ¼ g � 1�ffiffiffiffiffiffiffiffiffif1=g
p� ðf1=gÞ sinð10pf1Þ
� �
gðxÞ ¼ 1þ 9 �Xni¼2
xi
!,ðn� 1Þ
30 xi 2 [0, 1] Discontinuous
T4 f1ðxÞ ¼ x1
f2ðxÞ ¼ g � 1�ffiffiffiffiffiffiffiffiffif1=g
p� �gðxÞ ¼ 1þ 10ðn� 1Þ þ
Xni¼2
ðxi � 10 cosð4pxiÞÞ
10 x1 2 [0, 1], x2, . . . , xn 2 [�5, 5] Multimodal
T6 f1ðxÞ ¼ 1� expð�4x1Þsin6ð6px1Þf2ðxÞ ¼ g � ð1� ðf1=gÞ2Þ
gðxÞ ¼ 1þ 9 �Xni¼2
xi
!,ðn� 1Þ
!0:25
10 xi 2 [0, 1] Non-uniform
Fig. 7. The Pareto curve of test function T1: PFGA (left) and MOES (right).
S. Elaoud et al. / European Journal of Operational Research xxx (2005) xxx–xxx 11
ARTICLE IN PRESS

Fig. 8. The Pareto curve of test function T2: PFGA (left) and MOES (right).
Fig. 10. Enlarged rectangle of test function T3 PFGA (left) and (l + k) MEA (right).
Fig. 9. The Pareto curve of test function T3.
12 S. Elaoud et al. / European Journal of Operational Research xxx (2005) xxx–xxx
ARTICLE IN PRESS

Fig. 11. The Pareto curve of test function T4 (left) and enlarged rectangle from left (right).
Fig. 12. The Pareto curve of test function T6: PFGA (left) and MOES (right).
S. Elaoud et al. / European Journal of Operational Research xxx (2005) xxx–xxx 13
ARTICLE IN PRESS
In the (l + k) MEA 10,000 function evaluations are used per run which makes a total of 50,000 functionevaluations while the SPEA used 20,000 evaluations per run. In our opinion, the repetitive execution of thealgorithm may disguise any genetic drift phenomena i.e. at each run the algorithm used may converge to areduced part of the Pareto curve and then the union of final solutions found from each run will result in awell-distributed Pareto set. Here the results are the outcome of only one run of the PFGA with less totalfunction evaluations’ number (details of CPU time of each benchmark and quality measures of the Paretofront are presented and discussed in Section 4).
Functions T1 and T2 (Figs. 7 and 8)It is clear that both PFGA and (l + k) MEA outperform the SPEA in finding Pareto optimal or near
Pareto optimal solutions and generate almost similar solutions’ quality, well-distributed and very closeto the true Pareto curve, for both functions T1 and T2.
Function T3 (Fig. 9)The results of function T3 are also very close. However, the enlarged region located between 0.8 and 0.9
of f1 presented in Fig. 10 clearly shows that the PFGA provides a better distribution with a larger number

14 S. Elaoud et al. / European Journal of Operational Research xxx (2005) xxx–xxx
ARTICLE IN PRESS
of non-dominated solutions. This is due to the fact that the PFGA does not discard dominated individualsbut uses the information from dominated scheme although they are strongly penalized by the DoubleRanking Strategy. The considerable importance allowed to the dominated individuals which are dominatedby only one solution and the Pareto fitness assignment have a great effect on the homogeneity of the trade-off surface (it is clearly illustrated in different Pareto front representations: Figs. 6–12). Analyzing the effectof the proposed ranking procedure and different genetic operators on the whole evolutionary process couldbe an interesting topic of future research.
Function T4 (Fig. 11)For function T4 it is obvious that both PFGA and (l + k) MEA clearly outperform SPEA which has
great difficulty in finding the true Pareto front. On the other hand, the enlarged rectangle in Fig. 11 showsthat, in fact, the PFGA outperforms the (l + k) MEA in both issues: finding good solutions’ quality and agood distribution on the global Pareto front.
Function T6 (Fig. 12)Finally, it is clear from Fig. 12 that the three methods perform well in finding Pareto optimal or near
Pareto optimal solutions of the last listed benchmarks. However the solutions’ distribution of the SPEAis relatively not satisfactory [16].
The results show that the PFGA is a relatively strong performer. It always exceeds the SPEA and hasbetter distribution and alignment to the Pareto curve against the (l + k) MEA.
Besides the choice of appropriate test functions, the performance assessment by means of quantitativemetrics is an important issue when evaluating any multiobjective optimizers.
4. Performance measures
In this section, some quantitative measures are used to evaluate the trade-off surface fronts producedby the PFGA. Zitzler et al. listed in [20] three criteria to be considered in the evaluation of a given Paretofront.
• The convergence to the Pareto optimal front.• The distribution and the number of non-dominated solutions found.• The spread of the given set.
Hence, we propose some evaluations measures considering these aspects. Some of the used metricsrequire comparison with the true Pareto front.
Mathematically, the true Pareto fronts of benchmarks T2, T2, T3, T4 and T6 are found when g(x) = 1[20].
To evaluate the convergence of the resulted non-dominated solution sets, we define:
• Function Gapi: gives the distance to the Pareto optimal set in a bi-criteria problem according to eachcriterion separately.
Gap1 ¼1
kXkXa2X
f aopt1 � f a
1 ; resp. Gap2 ¼1
kXkXa2X
f aopt2 � f a
2
!;
where the symbol k Æk corresponds to the cardinality of the set, X represents the set of non-dominatedsolutions generated by PFGA, f a
1 presents the value of objective f1 of solution a and f aopt1 is the minimal
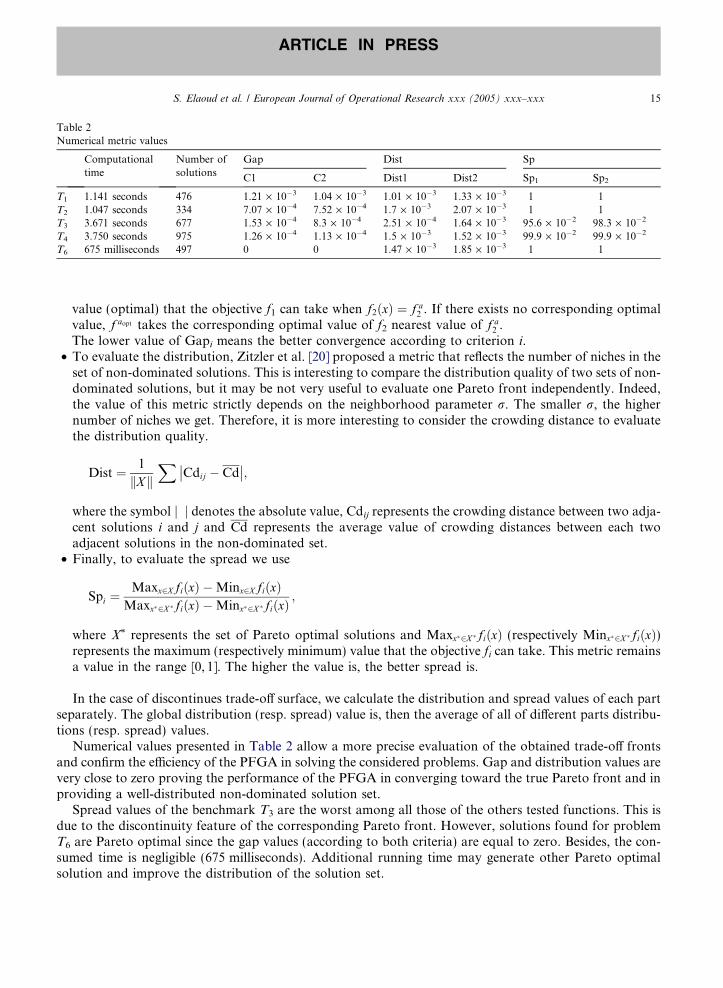
Table 2Numerical metric values
Computationaltime
Number ofsolutions
Gap Dist Sp
C1 C2 Dist1 Dist2 Sp1 Sp2
T1 1.141 seconds 476 1.21 · 10�3 1.04 · 10�3 1.01 · 10�3 1.33 · 10�3 1 1T2 1.047 seconds 334 7.07 · 10�4 7.52 · 10�4 1.7 · 10�3 2.07 · 10�3 1 1T3 3.671 seconds 677 1.53 · 10�4 8.3 · 10�4 2.51 · 10�4 1.64 · 10�3 95.6 · 10�2 98.3 · 10�2
T4 3.750 seconds 975 1.26 · 10�4 1.13 · 10�4 1.5 · 10�3 1.52 · 10�3 99.9 · 10�2 99.9 · 10�2
T6 675 milliseconds 497 0 0 1.47 · 10�3 1.85 · 10�3 1 1
S. Elaoud et al. / European Journal of Operational Research xxx (2005) xxx–xxx 15
ARTICLE IN PRESS
value (optimal) that the objective f1 can take when f2ðxÞ ¼ f a2 . If there exists no corresponding optimal
value, f aopt takes the corresponding optimal value of f2 nearest value of f a2 .
The lower value of Gapi means the better convergence according to criterion i.• To evaluate the distribution, Zitzler et al. [20] proposed a metric that reflects the number of niches in theset of non-dominated solutions. This is interesting to compare the distribution quality of two sets of non-dominated solutions, but it may be not very useful to evaluate one Pareto front independently. Indeed,the value of this metric strictly depends on the neighborhood parameter r. The smaller r, the highernumber of niches we get. Therefore, it is more interesting to consider the crowding distance to evaluatethe distribution quality.
Dist ¼ 1
kXkX
Cdij � Cd�� ��;
where the symbol j Æ j denotes the absolute value, Cdij represents the crowding distance between two adja-cent solutions i and j and Cd represents the average value of crowding distances between each twoadjacent solutions in the non-dominated set.
• Finally, to evaluate the spread we use
Spi ¼Maxx2X fiðxÞ �Minx2X fiðxÞ
Maxx�2X �fiðxÞ �Minx�2X �fiðxÞ;
where X* represents the set of Pareto optimal solutions and Maxx�2X �fiðxÞ (respectively Minx�2X �fiðxÞ)represents the maximum (respectively minimum) value that the objective fi can take. This metric remainsa value in the range [0, 1]. The higher the value is, the better spread is.
In the case of discontinues trade-off surface, we calculate the distribution and spread values of each partseparately. The global distribution (resp. spread) value is, then the average of all of different parts distribu-tions (resp. spread) values.
Numerical values presented in Table 2 allow a more precise evaluation of the obtained trade-off frontsand confirm the efficiency of the PFGA in solving the considered problems. Gap and distribution values arevery close to zero proving the performance of the PFGA in converging toward the true Pareto front and inproviding a well-distributed non-dominated solution set.
Spread values of the benchmark T3 are the worst among all those of the others tested functions. This isdue to the discontinuity feature of the corresponding Pareto front. However, solutions found for problemT6 are Pareto optimal since the gap values (according to both criteria) are equal to zero. Besides, the con-sumed time is negligible (675 milliseconds). Additional running time may generate other Pareto optimalsolution and improve the distribution of the solution set.

16 S. Elaoud et al. / European Journal of Operational Research xxx (2005) xxx–xxx
ARTICLE IN PRESS
5. Conclusion
A new MOEA design was proposed in this paper. It includes a modified ranking strategy, a promisingsharing procedure and a new fitness function design based on the Pareto relation and the population diver-sity. The PFGA implementation results were compared to those of different MOEA existing in the literatureand have shown a relatively good performance when dealing with different Pareto front features. However,we believe that any MOEA comparison is subjective because deciding a common population size or a sameway of variables’ encoding may be suitable for one MOEA and not for another for a given kind of problem.Possibly a smaller common population size or a higher crossover rate may lead to a different MOEAs clas-sification results. As it was previously mentioned, we think that in each algorithm, genetic operators evolvesynergistically to solve the problem at hand.
Although the MOEA comparison may be useful, we think that the aim of the multiobjective optimiza-tion is not to decide which algorithm outperforms the other but how to deal with difficult problems, whichgenetic operator may be more suitable for which algorithm to solve a given kind of problems, how toextract the best features from the existing approaches and why not to hybridize some of them to providebetter problems’ solutions.
References
[1] J.E. Baker, Reducing bias and inefficiency in the selection algorithm, in: J.J. Grefenstette (Ed.), Genetic Algorithms and TheirApplications, Proceedings of the Second International Conference on Genetic Algorithms, New Jersey, 1987, pp. 14–21.
[2] J.K. Cochran, S.-M. Horng, J.W. Fowler, A multi-population genetic algorithm to solve multi-objective scheduling problems forparallel machines, Computers & Operations Research 30 (2003) 1087–1102.
[3] C.A. Coello Coello, C.E. Mariano Romero, Evolutionary algorithms and multiple objective optimization, in: M. Ehrgott, X.Gandibleux (Eds.), Multiple Criteria Optimization, State of the Art, Annotated Bibliographic Surveys, Kluwer AcademicPublishers, 2002.
[4] C.A. Coello Coello, A comprehensive survey of evolutionary-based multiobjective optimization techniques, Knowledge andInformation Systems: An International Journal 1 (3) (1999) 269–308.
[5] C.A. Coello Coello, A.D. Christiansen, Multiobjective optimization of trusses using genetic algorithms, Computers and Structures75 (2000) 647–660.
[6] K. Deb, Multiobjective genetic algorithms: Problem difficulties and construction of test problems, Evolutionary Computation 7(1999) 205–230.
[7] K. Deb, A. Pratap, S. Agarwal, T. Meyarivan, A fast and elitist multiobjective genetic algorithm: NSGA–II, IEEE Transactionson Evolutionary Computation 6 (2) (2002) 182–197.
[8] C.M. Fonseca, P.J. Fleming, An overview of evolutionary algorithms in multiobjective optimization, Evolutionary Computation 3(1995) 1–16.
[9] C.M. Fonseca, P.J. Fleming, Genetic algorithms for multiobjective optimization: Formulation, discussion and generalization, in:Proceedings of the Fifth International Conference on Genetic Algorithms, 1993, pp. 416–423.
[10] P. Hajela, C.-Y. Lin, Genetic search strategies in multicriterion optimal design, Structural Optimization 4 (1992) 99–107.[11] J. Horn, N. Nafpliotis, D.E. Goldberg, A niched Pareto genetic algorithm for multiobjective optimization, Proceedings of the
First IEEE Conference on Evolutionary Computation, IEEE World Congress on Computational Intelligence 1 (1994) 82–87.
[12] J.D. Knowles, D.W. Corne, Approximating the non-dominated front using the Pareto archived evolutionary strategy,Evolutionary Computation 8 (2000) 149–172.
[13] J. Lohn, W. Kraus, G. Haith, Comparing a coevolutionary genetic algorithm for multiobjective optimization, in: Proceedings ofthe 2002 IEEE Congress on Evolutionary Computation, 2002, pp. 1157–1162.
[14] H. Lu, G.G. Yen, Rank-density based multiobjective genetic algorithm, in: Proceedings of the 9th IEEE Congress onEvolutionary Computation, 2002, pp. 944–949.
[15] H. Lu, G.G. Yen, Rank-density-based multiobjective genetic algorithm and benchmark test function study, IEEE Transactions onEvolutionary Computation 7 (4) (2003) 325–343.
[16] R. Sarker, K.-H. Liang, Ch. Newton, A new multiobjective evolutionary algorithm, European Journal of Operational Research140 (2002) 12–23.

S. Elaoud et al. / European Journal of Operational Research xxx (2005) xxx–xxx 17
ARTICLE IN PRESS
[17] J.D. Schaffer, Multiple objective optimization with vector evaluated genetic algorithms, Proceedings of the first InternationalConference on Genetic Algorithms (1985) 93–100.
[18] N. Srinivas, K. Deb, Multiobjective optimization using nondominated sorting in genetic algorithms, Evolutionary Computation 2(3) (1994) 221–248.
[19] E. Zitzler, L. Thiele, Multiobjective evolutionary algorithms: A comparative case study and the strength Pareto approach, IEEETransactions on Evolutionary Computation 3 (1999) 257–271.
[20] E. Zitzler, K. Deb, L. Thiele, Comparison of multiobjective evolutionary algorithms: Empirical results, EvolutionaryComputation 8 (2) (2000) 173–195.
[21] E. Zitzler, M. Laumanns, L. Thiele, SPEA2: Improving the Strength Pareto Evolutionary Algorithm, Technical Report 103,Computer Engineering and Networks Laboratory (TIK), Swiss Federal Institute of Technology (ETH) Zurich, 2001.