DNA REPLICATION. Animation gone Crazy DNA Replicates and Replicates.

ORIGINAL ARTICLE OPEN
The parasite cytokine mimic Hp-TGM potently replicates theregulatory effects of TGF-b on murine CD4+ T cellsMadeleine P J White1 , Danielle J Smyth1 , Laura Cook2 , Steven F Ziegler3,Megan K Levings2 & Rick M Maizels1
1 Wellcome Centre for Integrative Parasitology, Institute of Infection, Immunity and Inflammation, University of Glasgow, Glasgow, UK
2 Department of Medicine, BC Children’s Hospital Research Institute, University of British Columbia, Vancouver, BC, Canada
3 Department of Translational Research, Benaroya Research Institute, Seattle, WA, USA
Keywords
autoimmunity, immune evasion, parasite
cytokines, regulatory T cells
Correspondence
Rick M Maizels, Wellcome Centre for
Integrative Parasitology, Institute of Infection,
Immunity and Inflammation, University of
Glasgow, 120 University Place, Glasgow,
G12 8TA, UK.
E-mail: [email protected]
Present address
Danielle J Smyth, Division of Cell Signalling
and Immunology, School of Life Science,
University of Dundee, Dundee, DD1 4HN, UK
Laura Cook, The Peter Doherty Institute for
Infection and Immunity, University of
Melbourne, Melbourne, VIC, Australia
Received 18 December 2020;
Revised 1 April 2021;
Accepted 12 May 2021
doi: 10.1111/imcb.12479
Immunology & Cell Biology 2021; 99:
848–864
Abstract
Transforming growth factor-beta (TGF-b) family proteins mediate many vital
biological functions in growth, development and regulation of the immune
system. TGF-b itself controls immune homeostasis and inflammation,
including conversion of na€ıve CD4+ T cells into Foxp3+ regulatory T cells
(Tregs) in the presence of interleukin-2 and T-cell receptor ligands. The
helminth parasite Heligmosomoides polygyrus exploits this pathway through a
structurally novel TGF-b mimic (Hp-TGM), which binds to mammalian TGF-
b receptors and induces Tregs. Here, we performed detailed comparisons of
Hp-TGM with mammalian TGF-b. Compared with TGF-b, Hp-TGM induced
greater numbers of Foxp3+ Tregs (iTregs), with more intense Foxp3 expression.
Both ligands upregulated Treg functional markers CD73, CD103 and
programmed death-ligand 1, but Hp-TGM induced significantly higher CD39
expression than did TGF-b. Interestingly, in contrast to canonical TGF-bsignaling through Smad2/3, Hp-TGM stimulation was slower and more
sustained. Gene expression profiles induced by TGF-b and Hp-TGM were
remarkably similar, and both types of iTregs suppressed T-cell responses
in vitro and experimental autoimmune encephalomyelitis-driven inflammation
in vivo. In vitro, both types of iTregs were equally stable under inflammatory
conditions, but Hp-TGM-induced iTregs were more stable in vivo during
dextran sodium sulfate-induced colitis, with greater retention of Foxp3
expression and lower conversion to a ROR-ct+ phenotype. Altogether, results
from this study suggest that the parasite cytokine mimic, Hp-TGM, may deliver
a qualitatively different signal to CD4+ T cells with downstream consequences
for the long-term stability of iTregs. These data highlight the potential of Hp-
TGM as a new modulator of T-cell responses in vitro and in vivo.
INTRODUCTION
The family of transforming growth factor-beta (TGF-b)proteins constitute a widely expressed multifaceted set of
mediators, which are essential for critical biological
functions such as embryonic development, tissue repair
and immune regulation.1–3 Virtually all cells express one
or more members of the TGF-b superfamily, as well as
heterodimeric receptors specific for individual ligands.
Fibroblasts, platelets, epithelial cells and T cells are,
among others, notable producers of the cytokine TGF-b;however, it is expressed as a latent inactive precursor,
which is activated through tightly regulated proteolytic
cleavage.4,5 Moreover, activation of TGF-b requires key
membrane-bound partners such as avb8 integrins and
glycoprotein-A repetitions predominant (GARP) that
848
Immunology & Cell Biology 2021; 99: 848–864www.wileyonlinelibrary.com/journal/icb

spatially constrain the immunosuppressive cytokine when
interacting with receptors on target cells.6–8
TGF-b signals through a heterodimeric complex
composed of type I and II transmembrane serine/
threonine kinase receptors (TbRI and II). Canonical
signaling for TGF-b occurs when active TGF-b binds
TbRII which then recruits and phosphorylates TbRI,resulting in downstream phosphorylation of cytosolic
Smad2/3 complexes.9 Once Smad2/3 is phosphorylated,
binding of Smad4 to the complex occurs, resulting in
nuclear translocation and promoter activation to induce
transcription of TGF-b-specific genes, the variety of
which are dependent on the cell type and environment.2
Smad7, which acts as a negative regulator of the Smad2/3
pathway, is one of the few genes induced by TGF-bsignaling in all cell types.10
TGF-b has a variety of immunological functions; from
the view of immunoregulation, the role of TGF-b in T-
cell differentiation is of particular interest. In vitro, TGF-
b signaling can promote CD4+ T-cell polarization toward
T helper (Th) 9 and Th17 phenotypes in the presence of
interleukin (IL)-4 and IL-6, respectively.11,12 Perhaps
more notably, TGF-b signaling is also essential for the
induction of regulatory T cells (Tregs) in both the
periphery and the thymus.13–15 In vitro, mammalian
Tregs can be induced from na€ıve CD4+ T cells by T-cell
receptor/costimulatory engagement in the presence of IL-
2 and TGF-b, and these cells are identifiable by the
expression of their master transcription factor (Foxp3)
and constitutive expression of high levels of CD25 (IL-
2Ra).16,17
Tregs are critically important for regulation of the
immune system.18,19 In patients with inflammatory or
autoimmune disorders, such as multiple sclerosis and
rheumatoid arthritis, the frequency or function of Tregs
may be reduced compared with healthy controls.20,21
Therefore, innovative therapies now aim to promote
Tregs, by either expanding their numbers ex vivo for
infusion or directly in vivo, to suppress disease
symptoms.22,23 There are several hurdles that need to be
overcome to successfully develop Treg therapies. Patients
with inflammatory diseases may have reduced, or
intrinsically dysfunctional, Treg populations from which
to expand. Strategies promoting in vivo expansion also
need to account for effects of an inflammatory
environment as in the presence of IL-6, Tregs can convert
to a Th17 phenotype because of high expression of the
IL-6 receptor or STAT3-dependent loss of Foxp3
expression, which could be problematic in autoimmune
diseases such as multiple sclerosis, where inflammatory
Th17 cells drive disease.24,25 One method to overcome
this would be to induce Tregs ex vivo from na€ıve CD4+ T
cells using TGF-b, for autologous cell therapy,26 which
has an advantage, as TGF-b treatment is thought to
downregulate IL-6R on induced Tregs (iTregs)27; in
addition, it has been suggested that inclusion of retinoic
acid (RA) in vitro iTreg cultures may render cells more
resistant to effector cell conversion.28
Helminth parasites are known to induce Tregs during
infection to potentially enhance their survival within the
host, and one mechanism by which they do so is through
the TGF-b pathway.29–31 In particular, the murine
intestinal nematode Heligmosomoides polygyrus secretes a
protein, Hp-TGM (TGF-b mimic), which mimics the
activity of TGF-b and binds to its receptors despite
having no structural homology.32 This novel parasite
protein is an attractive potential therapeutic given that,
unlike mammalian TGF-b which is tightly regulated, Hp-
TGM is readily synthesized as an active protein and may
be a more stable stimulator of TGF-b pathways within
the host. Furthermore, Hp-TGM is one of 10 family
members of proteins produced by H. polygyrus with
similar gene sequences, indicating that activation of TGF-
b pathways is a positively selected mechanism to enhance
parasite survival.33
In our previous studies, we identified that Hp-TGM
stimulates canonical TGF-b signaling through pSmad2/3
and induces expression of Foxp3 in both mouse and
human T cells.32 Here we used mouse T cells and
compared the signaling profile, gene expression and
stability of TGF-b- and Hp-TGM-induced iTregs. We
established that Hp-TGM can induce robust iTregs to an
equal or greater degree than TGF-b, with a superior
stability profile under inflammatory conditions. Parallel
studies now being reported on human T cells
demonstrate the induction of functionally suppressive
iTregs by Hp-TGM which showed greater in vitro stability
than comparable cells induced by ΤGF-b.34 As Hp-TGM
is highly stable, does not require bioactivation and may
not be subject to the same constraints as TGF-b, it has
the potential to offer a novel therapeutic to manipulate
T-cell responses in human disease.
RESULTS
Hp-TGM potently induces murine Foxp3+ Tregs
in vitro
To compare the efficacy of Hp-TGM and TGF-b for
in vitro Treg induction, CD4+Foxp3– T cells were sorted
from Foxp3-green fluorescent protein (GFP) reporter
mice35 and cocultured with IL-2, anti-CD3 and either
TGF-b or Hp-TGM. Aliquots of these cells were collected
every 24 h and evaluated for Foxp3 induction using the
gating strategy shown in Figure 1a. We found that both
proteins induced progressively more Foxp3+ cells over
849
MPJ White et al. Hp-TGM induction of Tregs
TGF- Hp-TGM TGF-+ RA
Hp-TGM+ RA
0
1000
2000
3000
4000
CD
39 M
FI
**
**
TGM Hp-TGM+ RA
0
20
40
60
80
100 ***
0 1 2 3 40
20
40
60
80
100
Days in vitro
% F
oxp3
+
TGF-Hp-TGMTGF +RAHp-TGM+RA
**
TGF- Hp-TGM TGF-+ RA
Hp-TGM+ RA
0
500
1000
1500
CD
103
MFI
**
TGF- Hp-TGM TGF-+ RA
Hp-TGM+ RA
0
500
1000
1500
2000
PD-L
1 M
FI
*
TGF- Hp-TGM TGF-+ RA
Hp-TGM+ RA
0
500
1000
1500
2000
2500
CD
73 M
FI
**
(c) (d)
(e) (f)
(g) (h)
CD73
CD103 PD-L1
(a)
(b)
TGF- Hp-TGM0
20
40
60
80
100%
Fox
p3+
***
TGF- Hp-TGM0
500
1000
1500
2000
Foxp
3 M
FI
**
TGF- TGF-+ RA
0
20
40
60
80
100
% F
oxp3
+
***across multiple experiments across multiple experiments
non Treg
non Tregnon Treg
non TregCD39
64.0%
4.91%
75.4% 88.5% 91.7%
FS
H
Foxp3-GFP
Starting population TGF- TGF- + RAHp-TGM Hp-TGM + RA
664.0%%
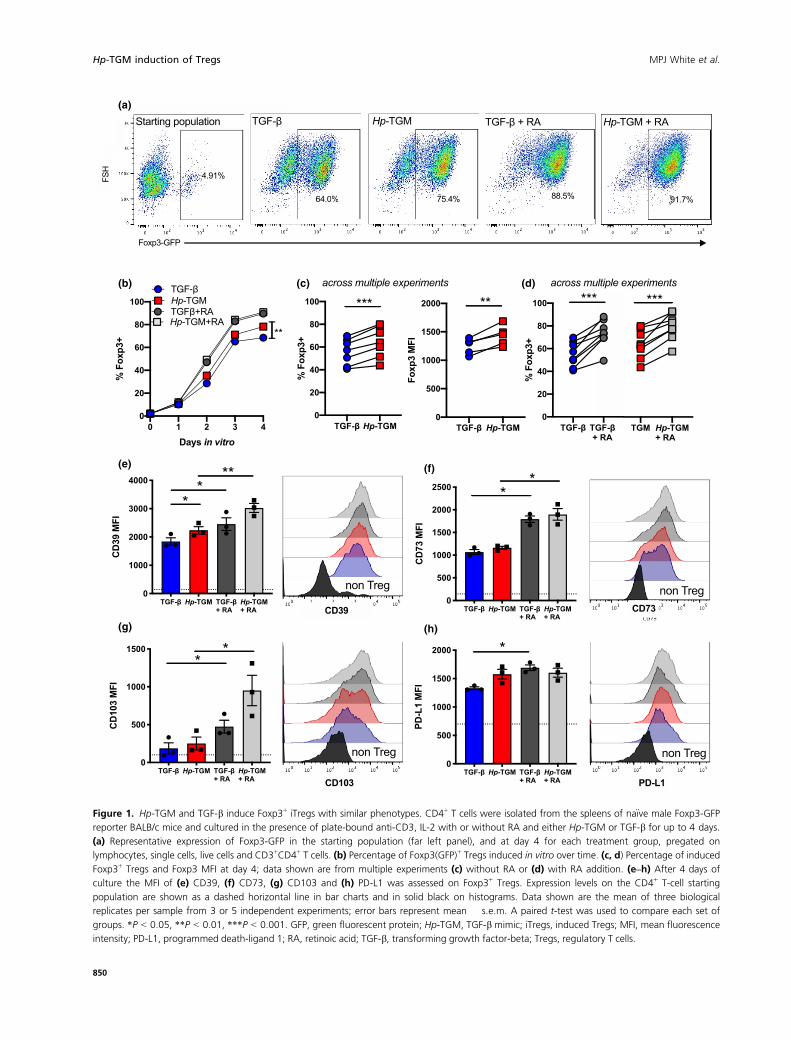
Figure 1. Hp-TGM and TGF-b induce Foxp3+ iTregs with similar phenotypes. CD4+ T cells were isolated from the spleens of na€ıve male Foxp3-GFP
reporter BALB/c mice and cultured in the presence of plate-bound anti-CD3, IL-2 with or without RA and either Hp-TGM or TGF-b for up to 4 days.
(a) Representative expression of Foxp3-GFP in the starting population (far left panel), and at day 4 for each treatment group, pregated on
lymphocytes, single cells, live cells and CD3+CD4+ T cells. (b) Percentage of Foxp3(GFP)+ Tregs induced in vitro over time. (c, d) Percentage of induced
Foxp3+ Tregs and Foxp3 MFI at day 4; data shown are from multiple experiments (c) without RA or (d) with RA addition. (e–h) After 4 days of
culture the MFI of (e) CD39, (f) CD73, (g) CD103 and (h) PD-L1 was assessed on Foxp3+ Tregs. Expression levels on the CD4+ T-cell starting
population are shown as a dashed horizontal line in bar charts and in solid black on histograms. Data shown are the mean of three biological
replicates per sample from 3 or 5 independent experiments; error bars represent mean � s.e.m. A paired t-test was used to compare each set of
groups. *P < 0.05, **P < 0.01, ***P < 0.001. GFP, green fluorescent protein; Hp-TGM, TGF-b mimic; iTregs, induced Tregs; MFI, mean fluorescence
intensity; PD-L1, programmed death-ligand 1; RA, retinoic acid; TGF-b, transforming growth factor-beta; Tregs, regulatory T cells.
850
Hp-TGM induction of Tregs MPJ White et al.

time, with the effect of Hp-TGM significantly greater
than TGF-b by day 4 (Figure 1b) in repeated
comparisons (Figure 1c). The degree of Foxp3 expression
in iTregs showed a similar trend between Hp-TGM and
TGF-b, with Hp-TGM iTregs expressing higher levels, as
determined by mean fluorescence intensity across
multiple comparisons (Figure 1c). Parallel cultures were
also grown in the presence of RA, a known enhancer of
Treg induction36; we found that RA maximized Foxp3
expression and equalized the effects of TGF-b compared
with Hp-TGM (Figure 1b, d).
In addition, expression levels of Treg-associated
functional markers CD39, CD73, CD103 and
programmed death-ligand 1 were measured, showing Hp-
TGM and TGF-b had very similar effects on increasing
expression of these molecules, with the adenosine
triphosphatase/adenosine diphosphatase ectoenzyme
CD39 having significantly higher expression on Hp-TGM
iTregs, compared with TGF-b iTregs (as assessed by a
paired comparison; Figure 1e). The presence of RA
significantly enhanced the expression of all of these
markers in both TGF-b and Hp-TGM cultures
(Figure 1e–h), indicating that the addition of RA not
only induces more iTregs but also increases expression of
markers associated with suppressive function.
Hp-TGM induces sustained canonical signaling through
TGF-b receptors
Hp-TGM binds mammalian TGF-b receptors and
stimulates a qualitatively similar level of intracellular
Smad2/3 phosphorylation, as judged by western blotting
and flow cytometry at 16–18 h poststimulation.32 To study
signaling events in more detail, we used phospho-Smad2/
3-specific antibodies in flow cytometry at doubling
intervals from 15 min following addition of either Hp-
TGM or TGF-b to freshly isolated mouse CD4+ T cells
(example gating strategy is shown in Supplementary
figure 1) and assessed pSmad2/3 in Foxp3– (Figure 2a) and
Foxp3+ (Figure 2b) subsets. In both cell subsets, TGF-belicited a much more rapid response, peaking at 15–30 min and slowly declining thereafter, whereas Hp-TGM
drove a slower but more sustained response, which in
CD4+Foxp3– T cells was significantly higher throughout
the period 2–16 h poststimulation (Figure 2a).
Signaling through TGF-b receptors can also occur
through other noncanonical pathways, including via
Smad1/5/8 phosphorylation.37 Flow cytometry analysis of
T cells over the same time course again showed more rapid
activation of pSmad1/8 by TGF-b compared with Hp-TGM
(Figure 2c, d), although at all time points from 30 min
onward, Smad1/8 phosphorylation was similar with both
ligands.
Phosphorylated Smad2/3 forms a complex with the
common Smad, Smad4, which then moves into the
nucleus to directly regulate gene transcription and
expression of target genes.38 Therefore, we also evaluated
Smad signaling by imaging flow cytometry to determine
the relative level of cytoplasmic and nuclear localization
of Smad2/3 proteins after freshly isolated mouse CD4+ T
cells were stimulated with Hp-TGM or TGF-b (gating
strategy examples are presented in Supplementary
figure 2, Figure 2e). At both 1 and 4 h poststimulation,
total CD4+ T cells showed a greatly enhanced degree of
nuclear Smad2/3 translocation with both treatments
(Figure 2f, g).
Hp-TGM and TGF-b induce similar expression of Treg-
related genes
TGF-b activation of T cells results in a complex web of
gene expression changes beyond the Smad-dependent
pathway.5 To ascertain whether Hp-TGM replicated, or
altered, these transcriptional profiles we conducted
NanoString digital gene expression analysis on
unstimulated ex vivo CD4+ non-Tregs (Foxp3–) and
Foxp3+ Tregs, as well as Foxp3+ Tregs induced in vitro
with either Hp-TGM or TGF-b. First, we focused on a
panel of genes associated with Treg function and assessed
the expression of these genes after ex vivo isolated Foxp3–
cells were cultured for 18 or 72 h in the presence of
either Hp-TGM or TGF-b. At 18 h, prior to the
induction of Foxp3, total cell cultures were analyzed,
revealing an upregulation of Jak1, Mapk1, Ski, Tgfb1,
Tgfb2 and to a lesser extent Tnf, genes to similar levels in
both TGF-b- and Hp-TGM-treated cells (Figure 3a).
After 72 h of culture, we sorted cells according to their
Foxp3-GFP status and separately analyzed their gene
expression.
Within the Foxp3+ sorted cells, we found similar
upregulation of genes associated with Treg function by
both TGF-b and Hp-TGM iTregs, including levels of
Foxp3 (Figure 3b). We then evaluated gene expression as
a fold change compared with freshly isolated CD4+ T
cells, and found that cells cocultured with TGF-b or Hp-
TGM, both total T cells at 18 h, and fluorescence-
activated cell sorting (FACS)-sorted Foxp3+ iTregs at
72 h, showed a close correlation in nearly all genes
evaluated as indicated by the red line (Figure 3c, d).
From cultures stimulated with TGF-b or Hp-TGM we
also isolated the Foxp3– cells to identify any differences
underlying fate decisions with Hp-TGM. In these
populations we found that both ligands amplified the
same gene set, with the exception of Foxp3
(Supplementary figure 3). We noted inverse regulation of
Jak1, Ski and Tgfbr1, which were more strongly expressed
851
MPJ White et al. Hp-TGM induction of Tregs

0.00 0.25 0.50 1.00 2.00 4.00 8.00 16.000
500
1000
1500
Time (hours)
pSM
AD
2/3
geo
mea
n
Foxp3 CD4 T cells
*** ***
****
0.00 0.25 0.50 1.00 2.00 4.00 8.00 16.000
500
1000
1500
Time (hours)
pSM
AD
2/3
geo
mea
n
Foxp3+ Tregs
TGF-Hp-TGM
*** ***
*
Media TGF Hp-TGM 0
20
40
60
80
% S
MA
D2/
3 nu
clea
r at 1
hr
******
0.00 0.25 0.50 1.00 2.00 4.00 8.00 16.000
200
400
600
800
1000
Time (hours)
pSM
AD
1/8
geo
mea
n
Foxp3 CD4 T cells
**
0.00 0.25 0.50 1.00 2.00 4.00 8.00 16.000
200
400
600
800
1000
Time (hours)
pSM
AD
1/8
geo
mea
n
Foxp3+ Tregs
*
Media TGF Hp-TGM 0
10
20
30
% S
MA
D2/
3 nu
clea
r at 4
hrs **
***
(a) (b)
(c) (d)
(e) (f) (g)TGF- - 1 hour
Hp-TGM - 1 hour
Figure 2. Activation of pSMAD2/3 and pSMAD1/8 signaling pathways by Hp-TGM and TGF-b. CD4+ T cells were isolated from the spleens of
female C57BL/6 mice and cultured in serum-free media for 4 h prior to the addition of Hp-TGM or TGF-b, for 15 min to 16 h. Expression of
pSMAD2/3 and pSMAD1/8 was determined by flow cytometry using barcode-labeled beads as shown in Supplementary figure 1. (a) pSMAD2/3
expression in non-Treg Foxp3– CD4+ T cells. (b) pSMAD2/3 expression in Foxp3+ Tregs, (c) pSMAD1/8 expression in Foxp3- CD4+ T cells and (d)
pSMAD1/8 expression in Foxp3+ Tregs. (e) Raw ImageStream data showing SMAD2/3 nuclear localization during TGF-b receptor activation
showing brightfield, nuclear dye DRAQ5 in red and Smad2/3-AF488 in green. Cells that are SMAD2/3 nuclear located have overlapping signal for
both fluorochromes. (f, g) Percentage of CD4+ T cells that had SMAD2/3 nuclear localized at (f) 1 h and (g) 4 h post-Hp-TGM or TGF-b
stimulation. Data shown are representative of three independent experiments, with three biological replicates per timepoint (n = 3,
mean � s.e.m.); a–d were tested using a two-way ANOVA with �Sid�ak’s multiple comparisons test. f and g were tested using a one-way ANOVA
with Tukey’s multiple comparisons test; *P < 0.05, **P < 0.01, ***P < 0.001. Hp-TGM, TGF-b mimic; TGF-b, transforming growth factor-beta;
Tregs, regulatory T cells.
852
Hp-TGM induction of Tregs MPJ White et al.

TGFbiTregs
Hp-TGMiTregs
Ctla4
Entpd1 (cd39)
FoxP3
Ifng
Il2
IL10
Il10ra
Il10rb
Jak1
Mapk1
Nt5e (cd73)
Phlpp1
Phlpp2
Ski
Smad3
Smad5
Stat3
Tgfb1
Tgfb2
Tgfb3
Tgfbi
Tgfbr1
Tgfbr2
Tnf
Tyk2
1000
Tran
scrip
t cou
nts
2000
TGFb 18hrs
Hp-TGM 18hrs
Ctla4
Entpd1 (cd39)
FoxP3
Ifng
Il2
IL10
Il10ra
Il10rb
Jak1
Mapk1
Nt5e (cd73)
Phlpp1
Phlpp2
Ski
Smad3
Smad5
Stat3
Tgfb1
Tgfb2
Tgfb3
Tgfbi
Tgfbr1
Tgfbr2
Tnf
Tyk2
500
Tran
scrip
t cou
nts
1000
(a) (b)Gene expression at 18 hoursWhole cell culture
Gene expression at 72 hours Sorted Foxp3+
0.01 0.1 1 10 100 10000.01
0.1
1
10
100
1000
TGF iTregs
Hp-
TGM
iTre
gs
Expression fold change from freshly isolated CD4+at 72 hr (Sorted Foxp3+ )
Btnl1
Ccl11
Ccl2
Ccl5
Ccl9
Cd74
Cdkn1a
Fcgr1
Foxp3
Il2ra
Il9
Klrb1
Lif
Ncam1
Nox1
Pdgfb
Runx3
Hp-TGM/TGF-log-log liner2=0.9745
Downregulated genes
Upregulated genes
(c)
0.01 0.1 1 10 100 10000.01
0.1
1
10
100
1000
TGF- 18 hr culture
Hp-
TGM
18
hr c
ultu
re
Expression fold change from freshly isolated CD4+ at 18 hrs (whole cell cuture)
TGM/TGFlog-log line
Downregulated genes
Upregulated genes
Cd22
C4a
Csf2
Lif
Irf4Ccr8
Pdgfb
Il2raCcl11
Il27
Trem1
Csf1rIrf7
Prf1
Ccr2
Gzmb
Ccrl1
(d)
Figure 3. Hp-TGM- and TGF-b-induced Foxp3+ Tregs had similar gene expression after 3 days in culture. CD4+ T cells were isolated from the spleens
of na€ıve Foxp3-GFP reporter BALB/c mice and cultured in the presence of anti-CD3/anti-CD28 beads, IL-2 and either Hp-TGM or TGF-b for 18 or
72 h. Gene expression was analyzed using the mouse immunology gene set (V1) from NanoString on total cell populations at 18 h, and on cells
sorted for Foxp3-GFP expression at 72 h. (a) Heatmap showing the gene expression of isolated CD4+ T cells that were cultured in the presence of Hp-
TGM or TGF-b for 18 h prior to analysis, with the blue color indicating a low level of gene expression and red color indicating a high level of gene
expression as determined by the number of transcript counts. (b) Heatmap showing the gene expression of TGF-b-induced Tregs (TGF-b iTregs) and
Hp-TGM-induced Tregs (Hp-TGM iTregs) which were sorted for Foxp3-GFP expression after 72 h of culture prior to gene analysis. (c, d) Fold-change
comparison of genes from 18-h-cultured CD4+ T cells (c) and 72-h Foxp3+-sorted T cells (d), cocultured with Hp-TGM or TGF-b, relative to the freshly
sorted CD4+ T-cell starting population. The log–log line is indicated in red, and top right quadrant shows genes that are upregulated compared with
fresh CD4+ control cells, and the blue-shaded lower left quadrant indicates those that are downregulated. GFP, green fluorescent protein; Hp-TGM,
TGF-b mimic; IL, interleukin; iTregs, induced Tregs; TGF-b, transforming growth factor-beta; Tregs, regulatory T cells.
853
MPJ White et al. Hp-TGM induction of Tregs

in TGF-b iTregs and in Hp-TGM-stimulated CD4+Foxp3–
cells (Figure 3b, Supplementary figure 4). Given that Ski
protein is a negative suppressor of TGF-b signaling
through the repression of Smad4,39 these results suggest
that the Ski inhibition pathway may be differentially
activated by TGF-b, or that Ski-expressing na€ıve T cells
are more resistant to Foxp3 induction by Hp-TGM,
possibilities that require further investigation. Taken as a
whole, however, these results demonstrate that the gene
pathways induced by Hp-TGM and TGF-b are highly
similar, confirming that the parasite mimic effectively
induces a parallel suppressive gene program.
Both Hp-TGM- and TGF-b-induced Foxp3+ Tregs can
suppress Τ-cell responses in vitro and in vivo
We next tested the ability of iTregs induced by Hp-TGM
to suppress immune responses in vitro and in vivo. In
vitro, both Hp-TGM- and TGF-b-induced Tregs very
effectively reduced the proliferation of cocultured CD4+ T
cells activated by anti-CD3/anti-CD28 beads in a dose-
dependent manner (Figure 4a, b). To assess the ability of
iTregs to suppress T-cell responses in vivo, we used a T-
cell model of autoimmunity, experimental autoimmune
encephalomyelitis (EAE), in which Th17 CD4+ cells play
a critical role in driving disease pathology through IL-17
secretion.40,41 Mice are primed to myelin oligodendrocyte
glycoprotein (MOG) peptide and develop ascending
paralysis.42 Two days prior to priming, animals received 1
9 106 Hp-TGM- or TGF-b-induced Tregs, and the
course of EAE disease was followed for 22 days
(Figure 4c). Symptoms first began to appear from day 13,
and although Hp-TGM- and TGF-b-induced Tregs did
not fully abrogate pathology, both ameliorated EAE
disease severity (Figure 4d, e). There was no significant
enhancement of overall Treg numbers or reduction of the
percentage of CD4+ T cells expressing the Th17-
associated transcription factor RORct+ in either iTreg-
treated group (Figure 4f, g). There was, however, a
significant reduction in the amount of IL-17A secreted by
cultured cells from Hp-TGM iTreg-treated mice following
ex vivo MOG restimulation (Figure 4). These results
indicate that while both types of iTregs are suppressive
in vitro and in vivo, the Hp-TGM iTregs may be better
able to suppress cytokine secretion by inflammatory cells.
Hp-TGM- and TGF-b-induced Foxp3+ Tregs display
similar levels of stability in vitro
Although Foxp3 expression can readily be induced in
murine T cells through the TGF-b signaling pathway, in
the absence of continued TGF-b activation, a portion of
cells reverts to the Foxp3-negative state.43 To assess the
ability of iTregs to retain their Foxp3 expression over
time, TGF-b and Hp-TGM iTregs were induced from
CD4+ T cells, using the previously defined protocol
(Figure 1), and then sorted based on Foxp3-GFP
expression to achieve a population that was over 99%
Foxp3+ cells (Figure 5a). These cells were then cultured
for up to 12 days in the presence of high levels of IL-2
(1000 U/mL) with, or without, additional TGF-b or Hp-
TGM, after which time both iTreg groups lost similar
levels of Foxp3 expression with a much greater decline
seen in the groups without additional cytokines added
(Figure 5b).
As epigenetic changes are strongly associated with Treg
stability,44 we investigated the degree of methylation at the
Foxp3 locus, which is reduced in stable (in vivo
differentiated) Tregs (Figure 5c). We measured methylation
levels at the Treg-specific demethylation region (TSDR) in
the first intron of the Foxp3 locus in iTregs at 12 days
postinduction, but neither TGF-b nor Hp-TGM drove any
significant demethylation (Figure 5c), indicating that under
the conditions used to induce functional murine iTregs, we
do not observe the demethylation seen in established in vivo
populations of Tregs.
Foxp3 expression is reported to be particularly fragile
in inflammatory environments,45 so we next tested its
stability in vitro in the presence of IL-6. There was a
substantial loss of Foxp3 expression in both TGF-b- and
Hp-TGM-induced iTregs (approximately 80% loss,
Figure 5d), with approximately 15% of both iTregs
converting to a Th17 cell phenotype (Figure 5e),
classified as Foxp3– cells that expressed both the
transcription factor RORct and secreted IL-17A.
Furthermore, freshly isolated ex vivo CD4+CD25+Foxp3+
Tregs with low levels of TSDR methylation were less
susceptible to Foxp3 loss and adoption of a Th17 cell
phenotype in the presence of IL-6, indicating that TGF-b/Hp-TGM-induced iTregs have reduced Treg-lineage
stability in the presence of IL-6 (Figure 5c). Interestingly,
IL-6 stimulation of both TGF-b and Hp-TGM iTregs
induced a small population of Foxp3+RORct+ cells, more
so than freshly isolated Tregs (Figure 5f). This dual
positive population has been shown to be a stable Treg
lineage with a high suppressive capacity, particularly
during the inflammation of mucosal sites such as in the
T-cell transfer colitis model where transfer of
Foxp3+RORct+ Tregs show a more potent suppression
compared with Foxp3+RORct- Tregs.46
Hp-TGM- and TGF-b-induced Foxp3+ Tregs display
similar levels of stability in vivo
We then evaluated iTreg stability in vivo, again within an
inflammatory environment using an acute model of
854
Hp-TGM induction of Tregs MPJ White et al.

Day-2
1x10⁶
i.v iTregs
Day 0 Day 2
EAE ptx boost
Day 22
Cull
0 5 10 15 200
1
2
3
4
Days
EAE
Dis
ease
Sco
re
PBSTGF- iTregsHp-TGM iTregs **
**
(a) (b)
(c)(d)
Gated on effector CD4+ T cells
PBS TGFiTregs
Hp-TGMiTregs
0
5
10
15
Foxp
3 %
of C
D4
T ce
lls
ns
PBS TGFiTregs
Hp-TGMiTregs
0
2
4
6
8
10
RoR
t+ %
of C
D4
T ce
lls
ns
PBS TGFiTregs
Hp-TGM iTregs
0
10
20
30
40
Dis
ease
bur
den
(AU
C)
**
PBS TGFiTregs
Hp-TGMiTregs
0
1000
2000
3000IL
17A
pg.m
l-1**
ns
(e) (f) (g) (h) MOG restimulation
1:1 1:2 1:4 1:8 1:16 0:10
20
40
60
80
100
Nor
mal
ized
% S
uppr
essi
on
TGF- iTregsHp-TGM iTregs
NS
Treg:Teffector ratio
Figure 4. Hp-TGM- and TGF-b-induced Foxp3+ Tregs were equally able to suppress T-cell responses in vitro and reduce EAE severity in vivo.
Na€ıve CD4+ T cells from (a, b) Foxp3-GFP C57BL/6 or (c, d) IL-10-GFP-Foxp3-RFP C57BL/6 mice were cultured to generate Hp-TGM- or TGF-b-
induced Foxp3+ Tregs (iTregs) that were sorted based on Foxp3-GFP/RFP expression and used for downstream analysis in vitro and in vivo. (a)
Suppression assays were performed using freshly isolated and Cell Trace Violet-labeled responder CD4+ T cells cultured with anti-CD3/CD28
beads and varying concentrations of Hp-TGM or TGF-b iTregs. The percentage of T cells that proliferated in the presence of iTregs at a ratio of
2:1 (iTregs to labeled CD4+ T cells (gray)) and either 1:16 ratio of TGF-b Tregs (blue) or TGM iTregs (red) where the percentage proliferation is
shown as well as the division index (DI) calculated using FlowJo analysis software v9 (BD Biosciences). (b) Percentage suppression of effector cell
proliferation is shown for varying ratios of iTregs added to cultures, relative to proliferation in cultures of effector cells alone. (c) Female C57BL/6
mice received 1 9 106 of either Hp-TGM or TGF-b iTregs or PBS on day �2 and then were immunized for EAE on days 0 and 2, and euthanized
at day 22. (d) Disease scores from mice receiving iTregs showed a marked decrease in severity by day 16 post-EAE induction, which is further
indicated by the overall disease burden (e). The percentage of (f) Foxp3+ Tregs and (g) RORct+ CD4+ T cells in the inguinal lymph node. (h)
Splenocytes that were restimulated for 72 h in the presence of the immunizing antigen (MOG) showed a significant reduction in IL-17A
production in mice that were treated with Hp-TGM iTregs. Data are from one of two similar independent experiments (a, b, h: n = 3 or 5 per
experiment group) or pooled from 2 independent experiments (c–g: n = 9 or 10 per treatment group). Data were analyzed by two-way ANOVA
with Dunnett’s multiple comparisons test comparing the iTreg treatment groups with the control PBS group (d), *P < 0.05, **P < 0.01. EAE,
experimental autoimmune encephalomyelitis; GFP, green fluorescent protein; Hp-TGM, TGF-b mimic; IL, interleukin; iTregs, induced Tregs; NS,
not significant; PBS, phosphate-buffered saline; RFP, red fluorescent protein; TGF-b, transforming growth factor-beta; Tregs, regulatory T cells.
855
MPJ White et al. Hp-TGM induction of Tregs

colitis induced by a mixture of dextran sodium sulfate
(DSS) in drinking water (Figure 6a). In this model, mice
begin to lose weight within 5 days, and the degree of
pathology is measured over time as a disease activity
index. Donor TGF-b or Hp-TGM-induced Tregs, carrying
the allotypic marker CD45.2, were transferred into
CD45.1 recipient mice 3 days before commencement of
DSS treatment to allow the iTregs to engraft prior to
induced disease. Recipient mice showed little protection
against colon shortening (Figure 6b), weight loss
(Figure 6c) or disease score as measured by a disease
activity index (Figure 6d), which is unsurprising given
that DSS-induced colitis is considered to be triggered
initially by innate inflammation, although other studies
have noted some reduction in DSS-induced colitis with
Treg treatment.47,48
Importantly, this model allowed us to assess the
stability of donor iTregs by immunophenotyping after
7 days of DSS treatment in vivo. Cells were isolated from
the mesenteric lymph nodes and spleens of all recipient
0 4 8 12
60
80
100
Days post iTreg sort
% R
etai
ning
Fox
p3+
TGF iTregs, no TGF
Hp-TGM iTregs, no Hp-TGM
TGF iTregs + TGF
Hp-TGM iTregs + Hp-TGM
Ex vivoTregs
TGF-iTregs
Hp-TGM iTregs
0
50
100
% R
etai
ning
Fox
p3+
****
Ex vivoTregs
TGF-iTregs
Hp-TGM iTregs
0
10
20
30
40
% o
f iTr
egs
switc
hed
to T
h17 **
**
ns
Ex vivoTregs
Naive CD4
TGFiTregs
Hp-TGMiTregs
0
50
100
% M
ethy
latio
n
Ex vivoTregs
TGF-iTregs
Hp-TGM iTregs
0
2
4
6
% o
f Tre
gs e
xpre
ssin
g R
OR
t ****
Unstimulated TGF Hp-TGM
Post Foxp3+ sort
Foxp3-GFP
FSC
-H
+ IL-6 in vitro + IL-6 in vitro + IL-6 in vitro
(a) (b)
(c) (d) (e) (f)
Figure 5. Hp-TGM- and TGF-b-induced Foxp3+ Tregs showed similar levels of methylation and stability, and acted similarly under inflammatory
conditions in vitro. (a) Na€ıve CD4+ T cells from male BALB/c-Foxp3-GFP mice were cultured with Hp-TGM or TGF-b to induce Foxp3+ Tregs
(iTregs) that were sorted based on Foxp3-GFP expression and used for downstream analysis in vitro as shown by the representative flow
cytometry plots. (b) Percentage retention of Foxp3 expression among sorted Foxp3 loss over time in culture for Hp-TGM- and TGF-b-induced
Tregs in the presence of additional IL-2, with or without Hp-TGM/TGF-b in the second step culture. (c) In vivo differentiated Foxp3+ Tregs
(nTregs) show a high level of demethylation at the TSDR locus; however, Hp-TGM- and TGF-b-induced Tregs after 12 days in culture have a
similar level of methylation in freshly isolated na€ıve CD4+ T cells. (d) Percentage of IL-6-induced Foxp3 loss in sorted Hp-TGM or TGF-b-iTregs that
were cultured in the presence of IL-6 for 4 days. (e) Percentage of iTreg cultures in d that converted to Th17 as evaluated by their expression of
both RORct and IL-17A in the presence of IL-6. (f) Percentage of iTregs that became double positive for RORct and Foxp3 in the presence of IL-6
for 4 days. Data are from three similar independent experiments (a–f). Shown are the means � s.e.m. and data were analyzed using a one-way
ANOVA (c–f) with Dunnett’s multiple comparisons test comparing iTreg treatment groups with nTreg controls, and a paired t-test between TGF-b
and TGF-b + RA. **P < 0.01. FSC-H, forward scatter-height; GFP, green fluorescent protein; Hp-TGM, TGF-b mimic; IL, interleukin; iTregs,
induced Tregs; NS, not significant; TGF-b, transforming growth factor-beta; Th, T helper; Tregs, regulatory T cells; TSDR, Treg-specific
demethylation region.
856
Hp-TGM induction of Tregs MPJ White et al.

0 1 2 3 4 5 6 7 870
80
90
100
110
Days
% o
f sta
rting
wei
ght
TGF
Hp-TGM
PBS
Controls
U/T PBS TGF Hp-TGM50
60
70
80
90
Col
on le
ngth
(mm
)
**
0 1 2 3 4 5 6 7 80
5
10
15
DaysD
isea
se A
ctiv
ity In
dex
*
(a)
TGF Hp-TGM0.00
0.05
0.10
0.15
0.20
MLN
CD
45.2
as
% o
f CD
4
TGF Hp-TGM0
20
40
60
80
100
% C
D45
.2 F
oxp3
+
CD45.2 Foxp3%
TGF Hp-TGM0
5
10
15
20
25
CD45.2 RoR t%
% C
D45
.2 R
OR
t+
TGF Hp-TGM0
5
10
15
%C
D45
.2 F
oxp3
+RoR
t+
CD45.2 DP
TGF Hp-TGM0.0
0.2
0.4
0.6
0.8
Spleen
CD
45.2
as
% o
f CD
4
TGF Hp-TGM0
20
40
60
80
100
% C
D45
.2 F
oxp3
+
CD45.2 Foxp3%
*
TGF Hp-TGM0
20
40
60
CD45.2 RoR t %
% C
D45
.2 R
OR
t+
TGF Hp-TGM0
1
2
3
4
5
%C
D45
.2 F
oxp3
+RoR
t+
CD45.2 DP
(b)
(c) (d)
(e)
(f)
Day-3
1x10⁶
i.v CD45.2iTregs
Day0
2% DSS in drinking water
Day7
Cull
CD45.1
Figure 6. Hp-TGM- and TGFb-induced Tregs showed similar levels of stability in vivo using DSS-induced colitis as an inflammatory model. Male
CD45.1 congenic (Ly5.1) mice received either Hp-TGM- or TGF-b-induced Tregs from Foxp3-GFP C57BL/6 mice or PBS only 3 days prior to DSS
colitis induction. Colitis was induced by administering 2% DSS in the drinking water for 7 days and the mice were euthanized and transferred
Tregs were analyzed. (a) The DSS colitis experimental protocol where Hp-TGM or TGF-b iTregs from male C57BL/6-Foxp3-GFP mice were induced
in vitro and sorted for Foxp3 expression prior to intravenous injection into male CD45.1 mice 3 days prior to DSS administration. (b) Colon length
of DSS colitis mice compared with untreated (U/T) control mice. (c) Percentage of initial body weight of colitis mice over time. (d) Colitis disease
severity score [disease activity index (DAI)] over time. (e) Analysis of transferred iTregs (CD45.2-expressing cells) in the mesenteric lymph node
(MLN), indicating percentage of CD45-2 among all CD4+ T cells, percentage of cells which retained Foxp3 expression, percentage of cells that
turned on RORct and the percentage of cells which became double positive (DP) for both Foxp3 and RORct. (f) Analysis of transferred cells in the
spleen, as above. Data are from one or two similar independent experiments (n = 2 or 4 per experiment group). A one-way ANOVA (c) with
Bonferroni’s multiple comparisons test, a two-way ANOVA (d) with Tukey’s multiple comparisons test and an unpaired t-test (e, f). *P < 0.05.
DSS, dextran sodium sulfate; GFP, green fluorescent protein; Hp-TGM, TGF-b mimic; iTregs, induced Tregs; PBS, phosphate-buffered saline; TGF-
b, transforming growth factor-beta; Tregs, regulatory T cells.
857
MPJ White et al. Hp-TGM induction of Tregs

mice, with no significant differences in numbers
(Supplementary figure 5). Lymph node populations
showed similar levels of Foxp3 retention or conversion to
a Th17 phenotype and although not statistically
significant, levels of Foxp3+RORct+ double-positive cells
were increased following transfer of Hp-TGM-induced
Tregs compared with TGF-b-induced Tregs (Figure 6e).
However, within the systemic response as measured by
transferred cells recovered from the spleen, there was
significantly greater stability of Foxp3 expression, and a
trend toward reduced RORct expression, on Hp-TGM
iTregs compared with TGF-b-induced Tregs (Figure 6f).
Altogether, our results establish that the parasite cytokine
Hp-TGM is able to induce a Treg population that is
equal to, and in some respects more stable than, TGF-b-induced Tregs in vivo, particularly under inflammatory
conditions.
DISCUSSION
TGF-b is a pivotal cytokine in the immune system,
restraining reactivity, dampening inflammation and
restoring homeostasis through cross-talk with multiple
other growth factors.1,5 Its essential role is evidenced not
only by the lethality of gene deficiency in mutant
mice,49,50 but also by the high degree of conservation
across the vertebrate subphylum.50 The potent inhibitory
effects of TGF-b, mediated in part through regulatory T
cells, are also reflected in the elaborate control
mechanisms which ensure that the processed ~110-amino
acid mature TGF-b is activated only under appropriate
conditions.7 In this context, it is perhaps not surprising
that pathogens manipulate the TGF-b pathway, as
described for example in malarial51 and filarial52
parasites, but few specific pathogen-encoded mediators
have yet been identified.
In the case of the murine intestinal helminth parasite
H. polygyrus, we previously reported that the secretion
of a ~400-amino acid protein composed of five
domains, requiring no processing or activation, was
able to ligate mammalian TGF-b receptors and induce
both murine and human Foxp3+ regulatory T cells
in vitro.32 Remarkably, the parasite ligand lacked any
structural or sequence similarity to the TGF-b gene
family, bearing a distant resemblance instead to
complement control protein modules. This new parasite
protein, named Hp-TGM, is a monomer with direct
binding capacity for both subunits of the mammalian
signaling receptors (TbRI and TbRII). By contrast, the
host ligand is a homodimeric protein which mediates
an ordered assembly, binding first to TbRII, forming a
complex which then recruits TbRI.9,53,54 In addition,
mammalian TGFb, but not Hp-TGM, binds the TbRIII
coreceptor betaglycan, enhancing activation through the
signaling receptors.55,56 Hence, it may be expected that
Hp-TGM-induced activation may differ through altered
receptor complex formation or stoichiometry,
interactions with coreceptors and/or internalization of
the bound receptors.
These structural and functional contrasts prompted us
to conduct a more detailed comparison, reported here, of
the ability of Hp-TGM and TGF-b to induce regulatory T
cells in vitro. In every respect, from Foxp3 induction to
altered gene expression and ability to suppress
inflammatory responses, we find that Hp-TGM is equal
to, and in some cases more potent than, TGF-b.Interestingly in view of the differing receptor interactions,
signal induction by Hp-TGM is relatively slow; this may
reflect its higher affinity for TbRI that would still require
interaction with TbRII for phosphorylation and
subsequent activation of Smad intermediaries. Equally,
the more sustained signaling with Hp-TGM may explain
the instances in which its effects appear more profound
than those of TGF-b, such as significantly higher Foxp3
expression in Hp-TGM iTregs.32
In addition to the in vitro setting, in which Hp-TGM
fully replicates the functions of mammalian TGF-b, we
also tested the efficacy of iTregs induced by Hp-TGM in
in vivo models. In the mouse EAE model, disease was
equally well suppressed by iTregs generated with either
ligand, with a greater inhibition of autoantigen-specific
Th17 responses in mice receiving Hp-TGM-iTregs.
Interestingly, in the context of EAE, suppression of IL-17
production is restricted to the CD39+ subset of Foxp3+
cells,57 which we found to be more strongly upregulated
by Hp-TGM. Moreover, CD39 is an ectoenzyme that
degrades extracellular adenosine triphosphate, thereby
reducing proinflammatory purinergic signaling, while
promoting Treg migration into the central nervous
system.58 We also utilized the DSS model of colitis to
create an inflammatory environment that challenges the
stability of iTregs; in this setting Hp-TGM iTregs did
confer a small degree of protection and showed a
significantly higher degree of retention of Foxp3
expression among splenic cells than observed in recipients
of TGF-b-iTregs. We note that, in human Tregs, higher
CD39 expression is associated with greater stability when
exposed to the same inflammatory cytokines tested in our
experiments.59
These studies address, but do not resolve, the question
of how iTregs can best be generated that prove resilient
in the face of inflammatory stimuli and would retain
regulatory function after transfer to a host with
inflammatory disorders.23,60 Further modifications to
Treg induction conditions are being explored, testing
combinations of metabolic and epigenetic factors which
858
Hp-TGM induction of Tregs MPJ White et al.

are implicated in Treg commitment and function,61–64
and varying the nature of the stimuli delivered in vitro.
In the latter respect, it is interesting that when anti-CD28
is omitted from the initial T-cell cultures, thereby
minimizing protein kinase C–NF-jB signaling, newly
induced iTregs do display the hypomethylation
characteristic of more stable peripheral Tregs.65
It is important to note that our analysis thus far has
focused on the effects in T cells, in order to replicate the
regulatory pathways known to be induced by TGF-b. Itwill be instructive to evaluate the effects of Hp-TGM on a
range of other cell types, in particular the gut epithelium
as well as macrophages and other innate cells. The
helminth protein is released during the adult life stage
within the gut of the host, and this is where the highest
concentrations of Hp-TGM would be found, thus it
would be of interest to assess whether the parasite mimic
has a potent effect on these cell types in comparison to
mammalian TGF-b. Recent studies have also identified
that TGF-b can induce phosphorylation of the Smad1/5
pathway through two type I receptors, TGFBR1 and
ACVR1 (one of the classical bone morphogenetic protein
type I receptors), and activation through this pathway is
required for full TGF-b transcript activation.66 Our study
showed that both TGF-b and Hp-TGM induced
phosphorylation of Smad1/5/8; however, the signal was
quite low, so it would be worth assessing the activation
of this pathway in other cell types as well.
In conclusion, we describe a salient example of
convergent evolution and cytokine mimicry, involving a
strongly immunosuppressive protein at the center of
immunological regulation. In this setting there is
potential for its use as an anti-inflammatory agent,
particularly as parallel studies with human CD4+ T cells
indicate efficient Foxp3 induction by Hp-TGM even
among memory effector T cells, with greater suppressive
capacity and enhanced stability in comparison to TGF-biTregs.34 The ability of Hp-TGM to induce human Tregs
suggests that it may be therapeutically valuable, either
directly in vivo or indirectly by ex vivo production of
Tregs in an autologous transfer protocol,23,26 and further
investigations toward this goal are currently under way.
METHODS
Mouse strains and husbandry
Female and male Foxp3-GFP C57BL/6, Foxp3-GFP BALB/c,IL-10-GFP-Foxp3-red fluorescent protein (RFP) C57BL/6,CD45.1 C57BL/6 and C57BL/6 mice (aged 8–14 weeks) wereused for experiments. All mice were either bred in-house orsourced from the University of Edinburgh and housed in theanimal facility at the University of Glasgow. All experiments
were performed under UK Home Office license and approvedby the University of Glasgow Ethical Review Board.
In vitro Treg induction
A single-cell suspension was prepared from the spleens ofna€ıve mice by passing the tissue through a 70-lm cell strainer;contaminating red blood cells were removed by resuspendingthe cells in red blood cell lysis buffer (Sigma, St Louis, MO,USA) for 2 min at room temperature. Cells were then washedand resuspended in media made up of Dulbecco’s modifiedEagle’s medium containing HEPES, supplemented with 2 mML-glutamine, 10% heat-inactivated fetal bovine serum (FBS),non-essential amino acids, 100 U mL�1 of penicillin and100 lg mL�1 of streptomycin (all purchased from ThermoFisher Scientific, Waltham, MA, USA). The cell suspensionwas then enriched for CD4+ T cells using the autoMACSsystem (Miltenyi Biotec, Bergisch Gladbach, Germany) and themouse CD4+ T cell isolation kit with “depletes” setting as permanufacturer’s instructions. Cells were cultured at aconcentration of 2 9 105 mL�1 in flat-bottomed 96-wellplates (Corning, New York, NY, USA) coated with10 lg mL�1 a-CD3 (Life Technologies, Carlsbad, CA, USA)for flow analysis or 7.5 9 105 cells in a 24-well plate (LifeTechnologies) for cell sorting experiments. Additional IL-2(Miltenyi Biotec) was added at a final concentration of 400 UmL�1 and cytokines/proteins were added at 20 ng mL�1 forHp-TGM (expressed in HEK293 cells as previouslydescribed32) and hTGFb1 (R&D Systems, Minneapolis, MN,USA) and 50 ng mL�1 for IL-6 experiments (Miltenyi Biotec).In some cultures RA was also added at a final concentrationof 1 nM (Sigma). Cultures were incubated at 37°C with 5%CO2 for at least 72 h before being analyzed for flow cytometryor sorted for Foxp3 expression. All conditions were set up inat least duplicate and repeated at least twice.
T-cell culture for Smad signaling analysis
Purified CD4+ T cells were isolated from Foxp3-GFP BALB/cmale mice as per method outlined above and washed inserum-free media [Dulbecco’s modified Eagle’s mediumcontaining 100 U mL�1 of penicillin and 100 lg mL�1 ofstreptomycin and 2 mM L-glutamine (Thermo FisherScientific)]. The cells were then cultured at 2 9 106 cells in200 lL volume of serum-free media in 5-mL round-bottomtubes that were loosely lidded (BD Biosciences, Franklin Lakes,NJ, USA) at 37°C with 5% CO2. The samples were left for atleast 4 h in serum-free media before 20 ng mL�1 TGF-b orTGM was added for varying culture lengths between 16 h and15 min in a reverse time course experiment, as specified in thefigures.
Staining for flow cytometry
Cells were washed in phosphate-buffered saline (PBS) andstained for viability using FVS510 (BD Biosciences) which wasdiluted 1:1000 in PBS and 100 lL added to each sample of
859
MPJ White et al. Hp-TGM induction of Tregs

cells and left in the dark at room temperature for 15 min,then washed twice in FACS buffer (PBS containing 0.5%bovine serum albumin, 5 lM EDTA and 0.5% sodium azide).To reduce nonspecific binding, samples were incubated with50 lL of polyclonal rat IgG (Sigma; diluted 1:50 in FACSbuffer) for 15 min on ice and protected from light, thenwashed once in FACS buffer by spinning at 400g for 5 minand removing supernatant. Samples were then stained for flowcytometry by adding 50 lL of fluorescent antibodies inBrilliant Staining Buffer (BD Biosciences) at theconcentrations as follows: anti-CD3-PE/y7 (clone 145-2C11 at1/200), anti-CD4-BB700 (clone RM4-5 at 1/400), anti-CD103-BV785 (clone M290 at 1/200), anti-PDL1-BV711 (clone MIH5at 1/400), anti-CD39-BV421 (clone Y23-1185 at 1/100), anti-CD25-BV421 (clone PC61 at 1/400), anti-CD73-PE (clone TY/23 at 1/200), anti-CD45.2-BV711 (clone 104 at 1/200, BDBiosciences) and anti-CD126-PE/Cy7 (clone D7715A7 at 1/100, BioLegend, San Diego, CA, USA).
Samples that were also stained for intracellular antigenswere fixed and permeabilized using Foxp3 TranscriptionFactor Buffer kit (Invitrogen, Waltham, MA, USA) andstained with antibodies in perm/wash buffer as follows: anti-Foxp3-ef450 (clone FJK-16s, eBioscience, San Diego, CA, USA,1/100) and anti-ROR-ct-PE (clone AFJKS-9, eBioscience, 1/100). Samples were then washed prior to analysis on the BDCelesta (BD Biosciences).
Cell barcoding and Phosflow
Samples that were assayed for SMAD signaling analysis werefixed by adding 2 mL of prewarmed 19 Lyse/Fix buffer (BDBiosciences) at the end of the experiment, and mixed byinverting five times and then leaving in a 37°C water bath for10–12 min. The tubes were then spun at 600g for 6 min to washthe cells, and then vortexed thoroughly before adding another2 mL of FACS buffer and repeating the wash steps a further twotimes. The cells were then permeabilized by thoroughlypipetting 1 mL ice-cold Perm Buffer III (BD Bioscience) andleaving samples on ice for 30 min. The cells were then washedby adding 3 mL of FACS buffer and spinning at 600g for 6 minand then vortexed thoroughly. The cells were resuspended in500 lL of 50% Perm III (BD Biosciences) diluted in PBS and60 lL of Violet Fluorescent Cell Barcoding (BD Biosciences)solution reconstituted as per manufacturer’s instructions andleft in the fridge in the dark for 30 min. The cells were thenresuspended in 3 mL of FACS buffer and wash steps wererepeated a further two times and all barcoded samples were thenpooled together and washed by spinning at 600g for 6 min. Thecells were then resuspended in 100 lL of FACS buffer andPhosflow antibody mix containing anti-mouse CD3-BV785,anti-mouse CD25-BV650, anti-mouse Foxp3-AF488, anti-mouse CD4-BB700, anti-Smad 1(pS463/pS465)/Smad 8 (pS465/pS467) and anti-Smad 2 (pS465/pSS467)/3 (pS423/pS425), allpurchased from BD Biosciences and used at the manufacturers’recommended concentrations and added in 1 mL of FACSbuffer and left at room temperature in the dark for 1 h. Thecells were then washed three times in FACS buffer andresuspended in 1 mL prior to flow analysis.
Fluorescent cell sorting
Na€ıve CD4+ T cells were isolated from the spleens of na€ıveFoxp3-GFP BALB/c, Foxp3-GFP C57BL/6 or IL-10-GFP-Foxp3-RFP C57BL/6 transgenic mice using the autoMACSprotocol as described above, and for in vivo and TSDRexperiments further sorted using the BD Aria III sorter (BDBiosciences). Cells that were purified by cell sorting prior toTreg induction were stained with anti-CD4-Percp/cy5.5 (cloneGK1.5, BioLegend) and anti-CD25-APC (clone PC61,eBioscience), and cells which were CD4+CD25–Foxp3-GFP/RFP– were sorted into 15-mL falcon tubes (BD Biosciences)containing 700 lL FBS. After sorting cells were washed threetimes in culture media and used as the starting population forTreg induction. After 4 days of Treg culture as describedabove, cells were sorted using Foxp3 reporter (either GFP orRFP-expressing Foxp3 mice) and sorted into PBS containing10% FBS to a purity of at least 98% using BD AriaIII (BDBiosciences). Prior to injection or culture, cells were washedthree times in PBS or culture media depending on the purpose.
ImageStream analysis
Purified CD4+ T cells were cultured in serum-free media asabove (section) overnight and stimulated with 20 ng mL�1
TGM or TGF-b for 1 or 4 h. Then, the samples were fixed with200 lL of 4% paraformaldehyde (PFA) solution in PBS(Sigma) to a final concentration of 2% PFA and left in a 37°Cwater bath for 20 min. The samples were transferred into a1.5-mL Eppendorf tube, spun at 600g for 6 min and thenwashed twice in PBS. After the final wash the cells wereresuspended in 100 lL perm wash solution (19 PBS with 0.1%Triton X-100) containing 0.2 lg anti-Smad 2/3 AF488 (SantaCruz Biotechnology, Dallas, TX, USA) and equivalent rat-IgGantibody (Sigma) to block nonspecific binding, and sampleswere left in the fridge in the dark for 40 min. Cells were thenwashed in 1 mL of FACS buffer twice before beingresuspended in 50 lL of PBS containing 0.5 lM DRAQ5(BioLegend). Samples were run on the Amnis ImageStream XMKII and analyzed using the IDEAS software (Amnis, Seattle,WA, USA). Cells were subsequently gated on focused cells,single cells, double-positive (Smad 2/3-AF488 and DRAQ5positive) and nuclear localization was calculated using thesimilarity dilate score between the 2 markers, with those havinga higher score indicating the Smad2/3 is nuclear localized.
Cytokine bead array of IL-17 responses in EAE
Splenocytes from immunized EAE mice were processed into asingle-cell suspension as described above. The cells werecultured with 30 lg mL�1 of the immunizing proteinpMOG35–55 (GenScript, Piscataway, NJ, USA) at aconcentration of 1 9 106 cells per well in a 96-well plate andcultured for 72 h at 37°C in 5% CO2. The supernatant wasremoved and immediately stored at �80°C until cytokine beadarray analysis. IL-17A was analyzed using the mouse IL-17AFlex Set cytokine bead array as per manufacturer’s instructions(BD Biosciences).
860
Hp-TGM induction of Tregs MPJ White et al.
Treg-specific demethylation region
Na€ıve CD4+ T cells were isolated from the spleens of na€ıveFoxp3-GFP BALB/c mice using the autoMACS protocol asdescribed above, and further sorted using the AriaIII sorter(BD Biosciences). Cells that were purified by cell sorting priorto Treg induction were stained with anti-CD4-Percp/cy5.5(clone GK1.5, BioLegend) and anti-CD25-APC (clone PC61,eBioscience), whereas cells which were CD4+CD25–Foxp3-GFP– were sorted into 15-mL Falcon tubes (BD Biosciences)containing 700 lL FBS. After sorting cells were washed threetimes in culture media and used as the starting population forTreg induction. After 4 days of Treg culture as describedabove, cells were sorted using Foxp3-GFP reporter (and sortedinto PBS containing 10% FBS to a purity of at least 98%using BD AriaIII (BD Biosciences). The sorted cells were thenplated into 24-well plates with aCD3/aCD28 beads (MiltenyiBiotec) at a concentration of 1:2 (beads to cells) withadditional IL-2 (1000 U mL–1, Miltenyi Biotec) and20 ng mL�1 of either TGF-b or Hp-TGM. At day 12 postreculture the cells were sorted again for Foxp3-GFP on the BDAriaIII (BD Biosciences) and 20 000 cells were collected inEppendorf tubes. The cells were then pelleted bycentrifugation for 10 min at 500g and supernatants removedcompletely. The cell pellets were stored at �80°C until TSDRanalysis was performed. Genomic DNA from cells of interestwas obtained using the NucleoSpin Tissue kit (MACHEREY-NAGEL, D€uren, Germany). Genomic DNA was subjected tobisulfite conversion using the EZ DNA Methylation Kit (ZymoResearch, Irvine, CA, USA). The murine TSDR was amplifiedby PCR containing 100 ng of bisulfite-converted genomicDNA, HotStarTaq PCR buffer (Qiagen, Hilden, Germany),1 U HotStarTaq DNA polymerase, 2.5 mM MgCl2 and0.38 µM each of TSDR-for (AAGGGGGTTTTAATATTTATGAGG) and TSDR-rev (CCTAAACTTAACCAAATTTTTCTACCA) primer in a final volume of 25 µL(cycle: 95°C for 15 min; 45 9 95°C for 30 s, 57°C for 1 min,72°C for 1 min; 72°C for 7 min). The PCR product wasanalyzed by gel electrophoresis. The pyrosequencing procedurewas performed on a PyroMark Q96 ID (Qiagen) according tothe manufacturer’s protocol, including 40 µL of the PCRproduct, PyroMark Gold Q96 reagents (Qiagen), PyroMarkbuffers (Qiagen), Streptavidin Sepharose (GE Healthcare,Chicago, IL, USA) and the sequencing primers TSDR1(AACCAAATTTTTCTACCATTA), TSDR2 (AAAACAAATAATCTACCCC) or TSDR3 (AATAAACCCAAATAAAATAATATAAAT). The methylation rate was determined by thePyroMark Q96 software (Qiagen). A rate was excluded if thequality criteria (PyroMark Q96 standard settings) failed forthat CpG motif.
Analysis of gene expression of iTregs by NanoString
analysis
Isolated splenocytes from male BALB/c Foxp3-GFP mice wereprocessed into a single-cell suspension. CD4+ cells werefurther selected for using the autoMACS pro (MiltenyiBiotec) and a CD4 T-cell isolation kit (Miltenyi Biotec).
MACS-purified cells were then cultured in T25 vented flaskswith an anti-CD3/anti-CD28 bead-to-cell ratio of 1:2, 400 UmL–1 IL-2 (Miltenyi Biotec) and 40 ng mL–1 TGM or TGF-bfor 3 days prior to FACS sorting of samples for FoxP3+ cellsand FoxP3– cells. Na€ıve CD4+ T cells and nTregs samples wereprepared and FACS sorted (not cultured prior to NanoStringanalysis).
RNA lysates of cells were obtained by resuspending10 000–20 000 of sorted cells per lL of RLT buffer(Qiagen). Samples were immediately frozen at �80°C untilanalysis. On the day of analysis, 1.5 lL of cell lysate wasdirectly analyzed using a NanoString mouse immunologypanel (V1) and run on a nCounter FLEX analyzer as perthe manufacturer’s instructions (NanoString, Seattle, WA,USA). Hybridization was performed for 18 h at 65°C andsamples were processed using the NanoString prep stationset on high sensitivity. Images were analyzed at maximum(555 fields of view). Data were normalized using nSolver 4.0software (NanoString).
Experimental autoimmune encephalomyelitis
experiments
Female C57BL/6 mice (8–10 weeks of age) were obtained fromthe University of Edinburgh and immunized for EAE aspreviously described.42 In brief, mice were injectedsubcutaneously in the hind flanks with 50 lg MOG35–55
peptide (GenScript) in complete Freund’s adjuvant (Sigma)supplemented with Mycobacterium tuberculosis (500 lg/mouse,BD Biosciences). Each mouse was also administered 200 ng ofpertussis toxin (Sigma) intraperitoneally on days 0 and 2.Mice were weighed daily from the onset of disease and scoredas follows: 0, normal; 1, partial tail paralysis; 2, full tailparalysis; 3, paralysis in one hind limb; 4, paralysis in bothhind limbs and 5, moribund. Mice which reached a weightloss of greater than 20% or a score of 5 for longer than 24 hwere euthanized. Mice received 1 9 106 Tregs (sortedCD4+CD25+Foxp3-GFP+ cells from C57BL/6 mice which wereinduced in vitro using either TGM or TGF-b) by intravenousinjection in 200 lL PBS 2 days prior to EAE induction.
Dextran sulfate sodium (DSS)-induced colitis
Colitis was induced in male C57BL/6 congenic mice (CD45.1)by administering 2% DSS (36 000–50 000 MW, MPBiomedicals, Santa Ana, CA, USA) in the drinking waterad libitum. In addition, mice received 1 9 106 iTregs (sortedCD4+CD25+Foxp3-GFP+ cells from C57BL/6 mice which wereinduced in vitro using either Hp-TGM or TGF-b) 3 days priorto DSS commencement. Mice were weighed and scored dailyusing a disease activity index matrix comprising body weight,blood, stool consistency and general appearance to aidobjective comparison of the clinical progression of disease.Scores for each parameter are out of 4 and summed to give adisease activity index out of a maximum of 16. Animals wereeuthanized if they lost greater than 20% of their original bodyweight and experiments were terminated at day 7 or 8,
861
MPJ White et al. Hp-TGM induction of Tregs

depending on disease severity, and mesenteric lymph nodesand spleens were isolated for analysis by flow cytometry.
Statistics
Graphs and statistics were analyzed using Prism (GraphPad,San Diego, CA, USA). Data are presented as means � standarderror of the mean (s.e.m.). One-way or two-way ANOVA or t-tests (paired or unpaired) were used where appropriate, withnonparametric tests being applied if data were not normallydistributed. *P < 0.05, **P < 0.01, ***P < 0.001.
ACKNOWLEDGMENTS
We thank Nicola Britton and Claire Ciancia for excellenttechnical assistance. The authors gratefully acknowledge theFlow Core Facility, University of Glasgow for their supportand assistance as well as BD Biosciences for their panel designexpertise. We thank Jana Gillies for her help in running anddesigning the mouse TSDR assay, and Andy Hinck for hiscritical comments on the manuscript. This work wassupported by the Kenneth Rainin Foundation through Synergyand Innovator Grants (Refs 2015-964 and 2016-3067), theWellcome Trust through an Investigator Award to RMM (Ref106122), the Wellcome Trust core-funded Wellcome Centrefor Integrative Parasitology (Ref: 104111) and by the MedicalResearch Council Confidence-in-Concept scheme. MKL andLC received salary awards from the BC Children’s HospitalResearch Institute.
CONFLICT OF INTEREST
We declare no competing financial interests.
AUTHOR CONTRIBUTIONS
Madeleine White: Conceptualization; Investigation;Methodology; Writing-original draft. Danielle Smyth:Investigation; Methodology. Laura Cook: Methodology;Writing-review & editing. Steven Ziegler: Conceptualization;Funding acquisition; Writing-review & editing. Megan KLevings : Conceptualization; Funding acquisition; Writing-review & editing. Rick Maizels: Conceptualization; Datacuration; Formal analysis; Funding acquisition; Projectadministration; Supervision; Writing-original draft; Writing-review & editing.
REFERENCES
1. Chen W, Ten Dijke P. Immunoregulation by members ofthe TGFb superfamily. Nat Rev Immunol 2016; 16: 723–740.
2. David CJ, Massagu�e J. Contextual determinants of TGFbaction in development, immunity and cancer. Nat Rev MolCell Biol 2018; 19: 419–435.
3. Kelly A, Houston SA, Sherwood E, Casulli J, Travis MA.Regulation of innate and adaptive immunity by TGFb.Adv Immunol 2017; 134: 137–233.
4. Shi M, Zhu J, Wang R, et al. Latent TGF-b structure andactivation. Nature 2011; 474: 343–349.
5. Travis MA, Sheppard D. TGF-b activation and function inimmunity. Annu Rev Immunol 2014; 32: 51–82.
6. Campbell MG, Cormier A, Ito S, et al. Cryo-EM revealsintegrin-mediated TGF-b activation without release fromlatent TGF-b. Cell 2020; 180: e16.
7. Lienart S, Merceron R, Vanderaa C, et al. Structural basisof latent TGF-b presentation and activation by GARP onhuman regulatory T cells. Science 2018; 362: 952–956.
8. Worthington JJ, Klementowicz JE, Travis MA. TGFb: asleeping giant awoken by integrins. Trends Biochem Sci2011; 36: 47–54.
9. Hinck AP. Structural studies of the TGF-bs and theirreceptors – insights into evolution of the TGF-bsuperfamily. FEBS Lett. 2012; 586: 1860–1870.
10. Fantini MC, Becker C, Monteleone G, Pallone F, Galle PR,Neurath MF. TGF-b induces a regulatory phenotype inCD4+CD25- T cells through Foxp3 induction and down-regulation of Smad7. J Immunol 2004; 172: 5149–5153.
11. Veldhoen M, Uyttenhove C, van Snick J, et al. Transforminggrowth factor-b ’reprograms’ the differentiation of T helper2 cells and promotes an interleukin 9–producing subset. NatImmunol 2008; 9: 1341–1346.
12. Veldhoen M, Hocking RJ, Atkins CJ, Locksley RM,Stockinger B. TGFb in the context of an inflammatorycytokine milieu supports de novo differentiation of IL-17-producing T cells. Immunity 2006; 24: 179–189.
13. Liu Y, Zhang P, Li J, Kulkarni AB, Perruche S, Chen W.A critical function for TGF-b signaling in thedevelopment of natural CD4+CD25+Foxp3+ regulatory Tcells. Nat Immunol 2008; 9: 632–640.
14. Huber S, Schramm C, Lehr HA, et al. TGF-b signaling isrequired for the in vivo expansion andimmunosuppressive capacity of regulatory CD4+CD25+ Tcells. J Immunol 2004; 173: 6526–6531.
15. Peng Y, Laouar Y, Li MO, Green EA, Flavell RA. TGF-bregulates in vivo expansion of Foxp3-expressing CD4+CD25+
regulatory T cells responsible for protection against diabetes.Proc Natl Acad Sci USA 2004; 101: 4572–4577.
16. Kanamori M, Nakatsukasa H, Okada M, Lu Q, YoshimuraA. Induced regulatory T cells: their development, stability,and applications. Trend Immunol 2016; 37: 803–811.
17. Chen W, Jin W, Hardegen N, et al. Conversion ofperipheral CD4+CD25- naive T cells to CD4+CD25+
regulatory T cells by TGF-b induction of transcriptionfactor Foxp3. J Exp Med 2003; 198: 1875–1886.
18. Josefowicz SZ, Lu LF, Rudensky AY. Regulatory T cells:mechanisms of differentiation and function. Annu RevImmunol 2012; 30: 531–564.
19. Sakaguchi S, Yamaguchi T, Nomura T, Ono M.Regulatory T cells and immune tolerance. Cell 2008; 133:775–787.
20. Vila J, Isaacs JD, Anderson AE. Regulatory T cells andautoimmunity. Curr Op Hematol 2009; 16: 274–279.
862
Hp-TGM induction of Tregs MPJ White et al.

21. Dominguez-Villar M, Hafler DA. Regulatory T cells inautoimmune disease. Nat. Immunol. 2018; 19: 665–673.
22. Bluestone JA, Buckner JH, Fitch M, et al. Type 1 diabetesimmunotherapy using polyclonal regulatory T cells. SciTransl Med 2015; 7: 315ra189.
23. Raffin C, Vo LT, Bluestone JA. Treg cell-based therapies:challenges and perspectives. Nat Rev Immunol 2020; 20:158–162.
24. Kimura A, Kishimoto T. IL-6: Regulator of Treg/Th17balance. Eur J Immunol 2010; 40: 1830–1835.
25. Laurence A, Amarnath S, Mariotti J, et al. STAT3transcription factor promotes instability of nΤreg cells andlimits generation of iΤreg cells during acute murine Graft-versus-Host Disease. Immunity 2012; 37: 209–222.
26. Hippen KL, Merkel SC, Schirm DK, et al. Generation andlarge-scale expansion of human inducible regulatory Tcells that suppress graft-versus-host disease. Am JTransplant 2011; 11: 1148–1157.
27. Zheng SG, Wang J, Horwitz DA. Foxp3+CD4+CD25+
qegulatory T Cells ιnduced by IL-2 and TGF-b areresistant to Th17 conversion by IL-6. J Immunol 2008;180: 7112–7116.
28. Lu L, Lan Q, Li Z, et al. Critical role of all-trans retinoicacid in stabilizing human natural regulatory T cells underinflammatory conditions. Proc Natl Acad Sci USA 2014;111: E3432–E3440.
29. McSorley HJ, Hewitson JP, Maizels RM. Immunomodulationby helminth parasites: defining mechanisms and mediators.Int J Parasitol 2013; 43: 301–310.
30. Johnston CJC, Smyth DJ, Dresser DW, Maizels RM. TGF-b in tolerance, development and regulation of immunity.Cell Immunol 2016; 299: 14–22.
31. White MPJ, McManus CM, Maizels RM. Regulatory T-cells in helminth infection: induction, function andtherapeutic potential. Immunology 2020; 160: 248–260.
32. Johnston CJC, Smyth DJ, Kodali RB, et al. A structurallydistinct TGF-b mimic from an intestinal helminth parasitepotently induces regulatory T cells. Nat Commun 2017; 8:1741.
33. Smyth DJ, Harcus Y, White MPJ, et al. TGF-b mimicproteins form an extended gene family in the murineparasite Heligmosomoides polygyrus. Int J Parasitol 2018;48: 379–385.
34. Cook L, Reid K T, H€akkinen E, et al. Induction of stablehuman FOXP3+ Tregs by a parasite-derived TGF-b mimic.Immunol Cell Biol 2021; 99. http://dx.doi.org/10.1111/imcb.12475. [Epub ahead of print].
35. Fontenot JD, Rasmussen JP, Williams LM, Dooley JL, FarrAG, Rudensky AY. Regulatory T cell lineage specificationby the forkhead transcription factor Foxp3. Immunity2005; 22: 329–341.
36. Mucida D, Park Y, Kim G, et al. Reciprocal TH17 andregulatory T cell differentiation mediated by retinoic acid.Science 2007; 317: 256–260.
37. Schmierer B, Hill CS. TGFb-SMAD signal transduction:molecular specificity and functional flexibility. Nat RevMol Cell Biol 2007; 8: 970–982.
38. Shi Y, Massagu�e J. Mechanisms of TGF-b signaling fromcell membrane to the nucleus. Cell 2003; 113: 685–700.
39. Luo K, Stroschein SL, Wang W, et al. The Skioncoprotein interacts with the Smad proteins to repressTGFb signaling. Genes Dev. 1999; 13: 2196–2206.
40. Komiyama Y, Nakae S, Matsuki T, et al. IL-17 plays animportant role in the development of experimentalautoimmune encephalomyelitis. J Immunol 2006; 177:566–573.
41. Fletcher JM, Lalor SJ, Sweeney CM, Tubridy N, Mills KH.T cells in multiple sclerosis and experimental autoimmuneencephalomyelitis. Clin Exp Immunol 2010; 162: 1–11.
42. White MPJ, Johnston CJC, Grainger JR, et al. Thehelminth parasite Heligmosomoides polygyrus attenuatesEAE in an IL-4Ra-dependent manner. Front Immunol2020; 11: 1830.
43. Selvaraj RK, Geiger TL. A kinetic and dynamic analysis ofFoxp3 induced in T cells by TGF-b. J Immunol 2007; 178:7667–7677.
44. Kanno Y, Vahedi G, Hirahara K, Singleton K, O’Shea JJ.Transcriptional and epigenetic control of T helper cellspecification: molecular mechanisms underlying commitmentand plasticity. Annu Rev Immunol 2012; 30: 707–731.
45. Zhou X, Bailey-Bucktrout SL, Jeker LT, et al. Instability ofthe transcription factor Foxp3 leads to the generation ofpathogenic memory T cells in vivo. Nat Immunol 2009;10: 1000–1007.
46. Yang BH, Hagemann S, Mamareli P, et al. Foxp3+ T cellsexpressing RORct represent a stable regulatory T-celleffector lineage with enhanced suppressive capacity duringintestinal inflammation. Mucosal Immunol. 2016; 9: 444–457.
47. Boschetti G, Kanjarawi R, Bardel E, et al. Gutinflammation in mice triggers proliferation and functionof mucosal Foxp3+ regulatory T cells but impairs theirconversion from CD4+ T Cells. J Crohn Colitis 2016; 11:105–117.
48. Per�se M, Cerar A. Dextran sodium sulphate colitis mousemodel: traps and tricks. J Biomed Biotech 2012; 2012:718617.
49. Li MO, Wan YY, Sanjabi S, Robertson A-KL, Flavell RA.Transforming Growth Factor-b regulation of immuneresponses. Annu Rev Immunol. 2006; 24: 99–146.
50. Robertson IB, Rifkin DB. Unchaining the beast; insightsfrom structural and evolutionary studies on TGFbsecretion, sequestration, and activation. Cytokine GrowthFactor Rev 2013; 24: 355–372.
51. Omer FM, de Souza JB, Corran PH, Sultan AA, Riley EM.Activation of transforming growth factorb by malariaparasite-derived metalloproteinases and athrombospondin-like molecule. J Exp Med 2003; 198:1817–1827.
52. Hartmann W, Schramm C, Breloer M. Litomosoidessigmodontis induces TGF-b receptor responsive, IL-10-producing T cells that suppress bystander T-cellproliferation in mice. Eur J Immunol 2015; 45: 2568–2581.
53. Groppe J, Hinck CS, Samavarchi-Tehrani P, et al.Cooperative assembly of TGF-b superfamily signalingcomplexes is mediated by two disparate mechanisms anddistinct modes of receptor binding. Mol Cell 2008; 29:157–168.
863
MPJ White et al. Hp-TGM induction of Tregs
54. Zuniga JE, Groppe JC, Cui Y, et al. Assembly of TbRI:TbRII:TGFb ternary complex in vitro with receptorextracellular domains is cooperative and isoform-dependent. J Mol Biol 2005; 354: 1052–1068.
55. L�opez-Casillas F, Chiefetz S, Doody J, Andres JL, LaneWS, Massagu�e J. Structure and expression of themembrane proteoglycan betaglycan, a component of theTGF-b receptor. Cell 1991; 67: 785–795.
56. Mythreye K, Blobe GC. Proteoglycan signaling co-receptors: roles in cell adhesion, migration and invasion.Cell Signal 2009; 21: 1548–1558.
57. Fletcher JM, Lonergan R, Costelloe L, et al. CD39+Foxp3+
regulatory T Cells suppress pathogenic Th17 cells and areimpaired in multiple sclerosis. J Immunol 2009; 183:7602–7610.
58. Wang Y, Begum-Haque S, Telesford KM, et al. Acommensal bacterial product elicits and modulatesmigratory capacity of CD39+ CD4 T regulatory subsets inthe suppression of neuroinflammation. Gut Microbes 2014;5: 552–561.
59. Gu J, Ni X, Pan X, et al. Human CD39hi regulatory T cellspresent stronger stability and function under inflammatoryconditions. Cell Mol Immunol 2017; 14: 521–528.
60. Tang Q, Vincenti F. Transplant trials with Tregs: perilsand promises. J Clin Invest 2017; 127: 2505–2512.
61. Atif M, Mohr A, Conti F, Scatton O, Gorochov G, MiyaraM. Metabolic optimisation of regulatory T cells intransplantation. Front Immunol 2020; 11: 2005.
62. Miyara M, Chader D, Burlion A, et al. Combination ofIL-2, rapamycin, DNA methyltransferase and histone
deacetylase inhibitors for the expansion of humanregulatory T cells. Oncotarget 2017; 8: 104733–104744.
63. Tao R, de Zoeten EF, Ozkaynak E, et al. Deacetylaseinhibition promotes the generation and function ofregulatory T cells. Nat Med 2007; 13: 1299–1307.
64. Wang L, Beier UH, Akimova T, et al. Histone/proteindeacetylase inhibitor therapy for enhancement of Foxp3+
T-regulatory cell function posttransplantation. Am JTransplant 2018; 18: 1596–1603.
65. Mikami N, Kawakami R, Chen KY, Sugimoto A, OhkuraN, Sakaguchi S. Epigenetic conversion of conventional Tcells into regulatory T cells by CD28 signal deprivation.Proc Natl Acad Sci USA 2020; 117: 12258–12268.
66. Ramachandran A, Viz�an P, Das D, et al. TGF-b uses anovel mode of receptor activation to phosphorylateSMAD1/5 and induce epithelial-to-mesenchymaltransition. eLife 2018; 7: e31756.
SUPPORTING INFORMATION
Additional supporting information may be found online in theSupporting Information section at the end of the article.
ª 2021 The Authors. Immunology & Cell Biology published by John Wiley &
Sons Australia, Ltd on behalf of Australian and New Zealand Society for
Immunology, Inc
This is an open access article under the terms of the Creative Commons
Attribution License, which permits use, distribution and reproduction in any
medium, provided the original work is properly cited.
864
Hp-TGM induction of Tregs MPJ White et al.