The Padua Inventory-Washington State University Revision ...
41
Rubio-Aparicio, M., Núñez-Núñez, R. M., Sánchez-Meca, J., López- Pina, J., Marín-Martínez, F., & Lopez-Lopez, J. A. (2018). The Padua Inventory-Washington State University Revision of Obsessions and Compulsions: A Reliability Generalization Meta-analysis. Journal of Personality Assessment. https://doi.org/10.1080/00223891.2018.1483378 Peer reviewed version License (if available): Other Link to published version (if available): 10.1080/00223891.2018.1483378 Link to publication record in Explore Bristol Research PDF-document This is the accepted author manuscript (AAM). The final published version (version of record) is available online via Taylor & Francis at https://doi.org/10.1080/00223891.2018.1483378 . Please refer to any applicable terms of use of the publisher. University of Bristol - Explore Bristol Research General rights This document is made available in accordance with publisher policies. Please cite only the published version using the reference above. Full terms of use are available: http://www.bristol.ac.uk/red/research-policy/pure/user-guides/ebr-terms/
Transcript of The Padua Inventory-Washington State University Revision ...
Rubio-Aparicio, M., Núñez-Núñez, R. M., Sánchez-Meca, J., López-Pina, J., Marín-Martínez, F., & Lopez-Lopez, J. A. (2018). The PaduaInventory-Washington State University Revision of Obsessions andCompulsions: A Reliability Generalization Meta-analysis. Journal ofPersonality Assessment.https://doi.org/10.1080/00223891.2018.1483378
Peer reviewed versionLicense (if available):OtherLink to published version (if available):10.1080/00223891.2018.1483378
Link to publication record in Explore Bristol ResearchPDF-document
This is the accepted author manuscript (AAM). The final published version (version of record) is available onlinevia Taylor & Francis at https://doi.org/10.1080/00223891.2018.1483378 . Please refer to any applicable terms ofuse of the publisher.
University of Bristol - Explore Bristol ResearchGeneral rights
This document is made available in accordance with publisher policies. Please cite only thepublished version using the reference above. Full terms of use are available:http://www.bristol.ac.uk/red/research-policy/pure/user-guides/ebr-terms/

1
The Padua Inventory-Washington State University Revision of Obsessions and
Compulsions: A Reliability Generalization Meta-analysis
Abstract
The Padua Inventory-Washington State University Revision (PI-WSUR) is a frequently
used test to assess obsessive-compulsive symptoms in screening and clinical contexts. A
reliability generalization meta-analysis was carried out to estimate the average
reliability of the PI-WSUR scores and its subscales and to search for characteristics of
the studies that can explain the heterogeneity among reliability coefficients. A total of
124 independent samples reported some coefficient alpha or test-retest correlation with
the data at hand for the PI-WSUR scores. The average internal consistency reliability of
the PI-WSUR total scores was .929 (95%CI: .922 and .936), and for the subscales, the
means ranged from .792 to .900. The test-retest reliability for PI-WSUR total scores
was .767 (95%CI: .700 and .820), with the subscales ranging from .540 to .790.
Moderator analyses revealed a positive relationship between the standard deviation of
PI-WSUR total scores and alpha coefficients, as well as higher reliability estimates for
the original version of the test and for studies from North America. The reliability
induction rate for the PI-WSUR was 53.7%. Regarding reliability, the PI-WSUR ranks
among the best scales for assessing obsessive-compulsive symptoms. Internal
consistency reliability was excellent for the PI-WSUR total score and good for the
subscales.
Key words: PI-WSUR, reliability generalization, meta-analysis, internal consistency,
test-retest reliability.
2
The Padua Inventory-Washington State University Revision of Obsessions and
Compulsions: A Reliability Generalization Meta-analysis
Obsessive-compulsive disorder (OCD) is a mental disorder characterized by the
presence of obsessions and/or compulsions. The Diagnostic and Statistical Manual of
Mental Disorders (5th ed. [DSM-5]; American Psychiatric Association, 2013) defines
obsessions as recurrent and persistent thoughts, urges or images that one recognizes as
unwanted, inappropriate and intrusive, causing marked anxiety or distress; compulsions
are defined as repetitive behaviors or mental acts that one performs in response to an
obsession or certain rules, to prevent or reduce anxiety, distress or avoid some negative
event. However, these behaviors are not connected realistically with what they want to
neutralize. This disorder is more prevalent in females than in males in adulthood, but
the opposite is true in childhood. The prevalence of OCD in adults has been estimated
to be approximately 1.1% - 1.8% (Kessler, Petukhova, Sampson, Zaslavsky, &
Wittchen, 2012; Somers, Goldner, Waraich, & Hsu, 2006).
The Padua Inventory (PI) of Sanavio (1988) is a widely used instrument to
assess obsessive-compulsive symptoms. In its original Italian version, the PI consists of
60 self-report items describing common obsessional and compulsive behavior, and each
item is rated on a 5-point scale (from 0 to 4) to measure disturbance associated with
OCD symptoms. The PI comprises four subscales: impaired mental control (17 items),
contamination (11 items), checking (8 items), and urges and worries (7 items). It has
been adapted to at least seven languages and cultures, including English, Spanish, Dutch,
and Japanese.

3
Following the publication of the 4th edition of the Diagnostic and Statistical
Manual of Mental Disorders [American Psychiatric Association (APA), 1994], which
included separate definitions for obsessions and worries, Freeston, Ladouceur, Rheaume,
Letarte, Gagnon, and Thibodeau (1994) noted that the obsessional subscales of the
original PI merged both constructs, and therefore, a revision of the scale was due. Thus,
two short versions of the original PI were developed. First, van Oppen, Hoekstra, and
Emmelkamp (1995) developed the Padua Inventory Revision (PI-R), a Dutch adaptation
of the PI composed of 41 items on a 5-point scale (scoring from 0 to 4) and five
subscales: impulses (7 items), washing (10 items), checking (7 items), rumination (11
items), and precision (6 items). The PI-R has been adapted to at least five languages,
including English, German, and Turkish. Second, Burns, Keortge, Formea, and
Sternberger (1996) simplified the original PI by eliminating 21 items that did not
discriminate obsessional content areas and/or did not fit in one of the standard
obsessional or compulsive content categories. The new scale, named the Padua
Inventory-Washington State University Revision (PI-WSUR), consists of 39 items rated
on a 5-point scale (0 = "not at all", 1 = "a little", 2 = "quite a lot", 3 = "a lot" and 4 =
"very much") and organized into five subscales: obsessive thoughts about harm to
self/others (OTHASO, 7 items), obsessive impulses to harm self/others (OITHSO, 9
items), contamination obsessions and washing compulsions (COWC, 10 items),
checking compulsions (CHKC, 10 items), and dressing/grooming compulsions
(DRGRC, 3 items). Higher scores indicate greater severity of obsessive-compulsive
symptoms. Burns et al. (1996) validated the PI-WSUR with 5,010 native English
speakers from the USA and obtained an internal consistency reliability for the total
scale of .92 (subscales ranged .77 - .88). In another study, Washington, Temple, and
Norton (2005) found that the factor structure of the PI-WSUR was similar across

4
different ethnicities (Caucasians, Hispanics, Southeast Asians, and South Asians), and
Donahue (2005) also replicated the factor structure of the original PI-WSUR with a
sample of undergraduates from the USA.
The PI-WSUR has been translated and adapted into various languages and
cultures. A Turkish adaptation developed by Yorulmaz et al. (2007) was performed with
OCD patients and undergraduates, and its original factor structure was confirmed. For
total scores, the coefficient alpha was .94, and the test-retest reliability was .86.
Subscales obtained alpha coefficients ranging between .75 (DRGRC) and .92 (CHKC)
and test-retest coefficients between .78 (CHKC) and .85 (COWC). Gönner, Ecker, and
Leonhart (2010) developed a German adaptation of the PI-WSUR with a sample of
OCD patients, obtaining good psychometric properties. Other adaptations of the PI-
WSUR to other languages were those of Jónsdóttir and Smári (2000) to Icelandic, Pang,
Zhu, Wang, Zhang, Yang, and Ma (2009) to Chinese, and Shams, Kaviani, Esmaili,
Ebrahimkhani, and Manesh (2011) to Iranian culture, although in the latter the original
factor structure of the PI-WSUR was not replicated exactly.
The reliability of test scores can change depending on the composition and
characteristics of the samples of participants and the application context, as well as on
the number of items of the test. Thus, reliability is not an inherent property of the test
but of the scores in a given application of the test. However, it is very common to find
researchers inducing score reliability from previous administrations of the test to other
samples (Crocker & Algina, 1986; Lord & Novick, 1968; McDonald, 1999; Streiner &
Norman, 2008). Vacha-Haase, Kogan, and Thompson (1999) coined the term
‘reliability induction’ to refer to this malpractice. Two types of reliability induction can
be distinguished when researchers do not report a reliability estimate of test scores with
the data at hand (Shields & Caruso, 2004): Reliability induction “by omission” consists

5
of omitting any reference to test score reliability, whereas reliability induction “by
report” occurs when the study refers to the reliability exhibited in previous studies. In
addition, two types of induction “by report” can be distinguished: reliability induction
by ‘vague report’ consists of referring to the reliability of the test scores but not
reporting specific estimates (e.g., ‘previous studies have demonstrated that the test has
good reliability’), whereas reliability induction by ‘precise report’ occurs when specific
estimates are reported (e.g., ‘in a previous validation of the test a coefficient alpha of .8
was found’).
When a test is applied to a sample of participants, researchers should report the
reliability obtained with the data at hand. This is important because reliability affects the
effect size and statistical power of significance tests. Therefore, reliability induction is
an erroneous practice that must be avoided. However, this malpractice is widespread
among researchers. A systematic review conducted on 123 psychological tests and more
than 41,000 empirical studies revealed that 78.6% induced reliability from previous
studies (Sánchez-Meca, Rubio-Aparicio, López-Pina, Núñez-Núñez, & Marín-Martínez,
2015, July). Similar results have been found by Vacha-Haase and Ness (1999), who
estimated the reliability induction at approximately 64.4% and by Whittington (1998),
who estimated the reliability induction to be approximately 54%.
Meta-analysis is a suitable method to statistically integrate the reliability
estimates obtained in different applications of a test. Vacha-Haase (1998) coined the
term reliability generalization (RG) to refer to this type of meta-analysis. An RG meta-
analysis enables us to obtain an estimate of the average reliability of the test scores and
to examine which characteristics of the test, of the studies and of the samples of
participants can account for heterogeneity among the reliability coefficients (Henson &
Thompson, 2002; Rodriguez & Maeda, 2006; Sánchez-Meca, López-López, & López-

6
Pina, 2013). An RG meta-analysis on the original Sanavio’s (1988) PI obtained average
internal consistency and test-retest reliability for the PI total score of .935 and .835,
respectively (Sánchez-Meca, Rubio-Aparicio, Núñez-Núñez, López-Pina, Marín-
Martínez, & López-López, 2017). Another RG meta-analysis on van Oppen et al.’s
(1995) PI-R found means of .926 and .910 for coefficient alpha and test-retest reliability,
respectively (Núñez-Núñez, Sánchez-Meca, López-Pina, Marín-Martínez, López-López,
& Rubio-Aparicio, 2017). An RG meta-analysis on the Burns’ et al. (1996) PI-WSUR
has not yet been accomplished.
Purpose
We conducted an RG meta-analysis on the Padua Inventory-Washington State
University Revision, PI-WSUR (Burns et al., 1996) with the following aims: (a) to
estimate the average reliability (for the total scale and subscales), in terms of internal
consistency and test-retest, found in the empirical studies that applied the PI-WSUR and
reported any reliability estimate with the data at hand; (b) to examine the variability
among the reliability estimates; (c) to search for substantive and methodological
characteristics of the studies that can be statistically associated with the reliability
coefficients; (d) to propose explanatory models that researchers and clinicians can use in
the future to estimate the expected reliability of the PI-WSUR scores according to the
most relevant study characteristics; (e) to estimate the reliability induction rates of the
PI-WSUR, and (f) to investigate the generalizability of the results of our RG meta-
analysis by comparing the sample characteristics of the studies that induced reliability
with those that reported reliability estimates.
Method
7
Selection Criteria of the Studies
To be included in the meta-analysis, each study had to fulfil five criteria: (a) to be an
empirical study where the PI-WSUR, or an adaptation of this revision maintaining the
39-item structure, was applied to a sample of at least 10 participants; (b) to report any
reliability estimate with data from the study-specific sample; (c) the paper had to be
written in English; (d) samples of participants from any target population were accepted
(community, clinical or subclinical populations); and (e) the paper might be published
or unpublished. The following exclusion criteria were applied: (a) N = 1 or case series
studies, and (b) studies that applied the Sanavio´s (1988) original version of the Padua
Inventory, the PI-R (Van Oppen et al., 1995), or any other version that did not maintain
the 39-item structure of the PI-WSUR. In addition, studies that applied the PI-WSUR
but did not report reliability were also analyzed to compare the sample characteristics of
the studies that reported and induced reliability.
Searching for the Studies
Although the PI-WSUR was published in 1996, it was adapted from Sanavio’s original
version of the Padua Inventory from 1988; therefore, the search period of relevant
studies covered 1988 to September 2017. The following databases were consulted:
PROQUEST, PUBMED, and Google Scholar. The keywords “Padua Inventory” were
set in all electronic databases to be found anywhere in the documents. In addition, the
references of the retrieved studies were also checked to identify additional studies that
might fulfil the selection criteria.
In Supplementary file 3, Figure 1 presents a flowchart describing the selection
process of the studies. A total of 1,335 references were initially identified, out of which
1,093 were removed for various reasons. Once screened, 242 references were empirical
8
studies that had applied the PI-WSUR. From these, 112 studies (46.3%) reported some
reliability estimate with the data at hand, whereas the remaining 130 studies (53.7%)
induced the reliability of the PI-WSUR from previous applications of the test.
Data Extraction
To explore how study characteristics can affect score reliability of the PI-WSUR, the
following moderator variables were coded: (a) mean and standard deviation (SD) of the
total scores of the PI-WSUR as well as of each of the five subscales; (b) mean and SD
of the participants’ age (in years); (c) gender distribution of the sample (% male); (d)
sample ethnicity (% Caucasian); (e) mean and SD of the history of the disorder (in years,
for clinical samples only); (f) target population (community, undergraduate students,
subclinical, and clinical); (g) percentage of clinical participants in the sample; (h) type
of clinical disorder (OCD vs. other; for clinical samples only); (i) geographical location
of the study (country and continent); (j) test version (English original vs. other); (k)
administration format (clinical interview vs. self-report); (l) study focus (psychometric
vs. applied); (m) focus of the psychometric study (PI-WSUR vs. other scale); (n)
diagnostic procedure of participants (DSM, ICD, other, for clinical samples only); (o)
sample size; (p) time interval (in weeks) for test-retest reliability; (q) year of the study;
and (r) training of the main researcher (psychology, psychiatry, other). Alongside these
moderator variables, alpha and test-retest coefficients were extracted for the total scale
and for the reported subscales.
All study characteristics were not only extracted from studies reporting
reliability but also from those that induced it, with the aim of comparing the
characteristics of the studies that both reported and induced reliability. This comparison
was critical in determining the extent to which the results of our meta-analysis (which

9
only included studies reporting reliability) can be generalized to all studies that applied
the PI-WSUR, regardless of whether reliability was reported.
To check the reliability of the data extraction process, all studies that had applied
the PI-WSUR (242 studies, 365 independent samples) were doubly coded by two
independent coders, both psychologists who had a PhD in psychology and who
specialized in meta-analysis. A codebook was produced, and the coders were trained in
its use. The results showed a highly satisfactory overall agreement, with kappa
coefficients for qualitative variables ranging between .95 (target population) and 1.0
(45.4% of the qualitative variables reaching kappa = 1; mean = .99), and intraclass
correlations for continuous variables varying between .92 (% Caucasian) and 1.0
(73.7% of the continuous variables reaching ICC = 1; mean = .99). From the six
qualitative characteristics analyzed, the inter-coder agreement percentages varied from
96.7% (target population) to 100% (psychometric focus and main researcher; mean =
99.2%). Inconsistencies between coders were resolved by consensus.
Reliability Estimates
In this meta-analysis, two types of reliability coefficients were taken into
account: coefficient alpha to assess internal consistency reliability of the measures, and
Pearson correlation coefficient to estimate test-retest temporal stability. Furthermore,
these two types of reliability coefficients were extracted for the PI-WSUR total score
and for each of the five subscales. Thus, a total of 12 reliability coefficients might be
obtained from each sample. The reliability coefficients were transformed to normalize
their distributions and stabilize their variances. On the one hand, alpha coefficients, i,
were transformed with the formula proposed by Bonett (2002) to normalize its
distribution and stabilize the variances. In particular, Bonett’s transformation was
10
calculated as Li = Ln(1 - i), where Ln is the natural logarithm. Conversely, Pearson
correlation coefficients, r, to assess test-retest reliability were transformed into Fisher’s
Z.
Statistical Analyses
Separate meta-analyses were carried out for alpha and test-retest
reliability coefficients. In addition, separate meta-analyses were conducted for the
reliability coefficients obtained from the total scale and for each of the five subscales.
To obtain summary statistics of reliability coefficients in each meta-analysis, a random-
effects model was assumed (Borenstein, Hedges, Higgins, & Rothstein, 2009; Sánchez-
Meca et al., 2013). This model implies that each reliability coefficient was weighted by
its inverse-variance, which was the sum of the within-study variance and the between-
study variance. The between-study variance was estimated by restricted maximum
likelihood (López-López, Botella, Sánchez-Meca, & Marín-Martínez, 2013). The 95%
confidence interval around each overall reliability estimate was computed with the
improved method proposed by Hartung (1999; Sánchez-Meca & Marín-Martínez, 2008).
To facilitate the interpretation of the results from each meta-analysis, the
average reliability coefficients and their confidence limits obtained with Bonett’s
or Fisher’s Z transformations were back-transformed into the coefficient alpha and the
Pearson correlation metrics, respectively.
Heterogeneity among the reliability coefficients in each meta-analysis was
assessed with a forest plot and with the Q statistic and the I2 index. A forest plot is a
graphical and numerical representation of the individual reliability coefficients and their
95% CIs, together with the average reliability and a 95% CI. The Q statistic allows
testing the null hypothesis of homogeneous reliability coefficients by assuming a chi-

11
square distribution with degrees of freedom equal to k – 1, k being the number of
studies; a p-value for the Q statistic < .05 allows rejecting the homogeneity hypothesis
(Borenstein et al., 2009). Furthermore, the I2 index is a statistic that quantifies the
degree of true heterogeneity exhibited by the reliability coefficients as a percentage, i.e.,
heterogeneity due to varying characteristics of studies that affect the reliability of test
scores. I2 values of approximately 25%, 50%, and 75% can be considered to reflect low,
moderate, and large heterogeneity, respectively (Higgins, Thompson, Deeks, & Altman,
2003). For meta-analyses with at least 30 coefficients where evidence of heterogeneity
was found, moderator analyses were conducted through meta-regression analyses for
continuous variables and weighted ANOVA for qualitative variables. Mixed-effects
models were assumed, using the improved method proposed by Knapp and Hartung to
test the statistical significance of moderator variables (Knapp & Hartung, 2003; López-
López et al., 2013; Viechtbauer, López-López, Sánchez-Meca, & Marín-Martínez,
2015). In particular, Knapp and Hartung have developed an F statistic that takes into
account uncertainty in the estimation of the between-study variance and, as a
consequence, offers a better control of the Type I error rate than the standard statistics
(QB and QR statistics proposed by Hedges & Olkin, 1985). Whereas the F statistics
enable testing the statistical significance of moderator variables (both qualitative or
continuous variables), the QE and QW statistics allow testing the model misspecification
for meta-regression and ANOVA, respectively. The proportion of variance accounted
for by the moderator variables was estimated with R2, an index that considers the total
and residual between-study variances (López-López, Marín-Martínez, Sánchez-Meca,
Van den Noortgate, & Viechtbauer, 2014). All statistical analyses were carried out with
the metafor package in R (Viechtbauer, 2010).

12
Results
Mean Reliability and Heterogeneity
Supplementary file 1 presents the references of the 112 studies that reported some
reliability estimates with the data at hand. Of the 112, seven (Bhar & Kyrios, 2005;
Elwood, Riskind, & Olatunji, 2011; Haslam, Williams, Kyrios, McKay, & Taylors,
2005; Nedeljkovic & Kyrios, 2007; Wu, 2008; Wu, Aardema, & O´Connor, 2009; Wu
& Cortesi, 2009) could not be included in our RG meta-analysis for various reasons,
such as reporting reliability coefficients as a range, dichotomization of PI-WSUR scores,
or a combination of PI-WSUR subscales. The remaining 105 studies were included in
our RG meta-analysis. Most of the included studies were published, with the exception
of nine unpublished Doctoral Theses (Árnadóttir & Daníelsdóttir, 2016; Anderson,
2010; Doucet, 2008; Etzel, 2009; Francazio, 2015; Green-Armytage, 2016;
Lappalainen, 2012; Ragnarsdóttir & Siggeirsdóttir, 2016; Sarawgi, 2011).1
Several studies reported reliability coefficients for two or more different
samples; therefore, the database of our RG study included a total of 124 independent
samples. The total sample size was N = 32,792 participants (min. = 18; max. = 5,010),
with a mean of 265 participants per sample (Median = 156; SD = 487). Regarding the
location where studies were conducted, four continents were represented in our RG
study: North America - 75 samples (60.5%), Australia - 21 samples (16.9%), Asia - 14
samples (11.3%), Europe - 13 samples (10.5%), and a mixed category with one sample
(0.8%)2.
Separate meta-analyses were conducted for alpha and test-retest reliability
coefficients. Furthermore, different meta-analyses were undertaken for PI-WSUR total
1 The database with 105 studies, the statistical methods used in the analyses and materials used to conduct
this research can be obtained from the corresponding author upon request. 2 This study was carried out in Europe and South America.
13
score reliability and for each of the five subscales. Although the statistical analyses were
performed using Bonett’s transformation for coefficient alpha, Tables 1, 3, and 4, as
well as Figures 2 and 3 in Supplementary file 3, present the means and their respective
confidence limits once back-transformed to the coefficient alpha metric for the purpose
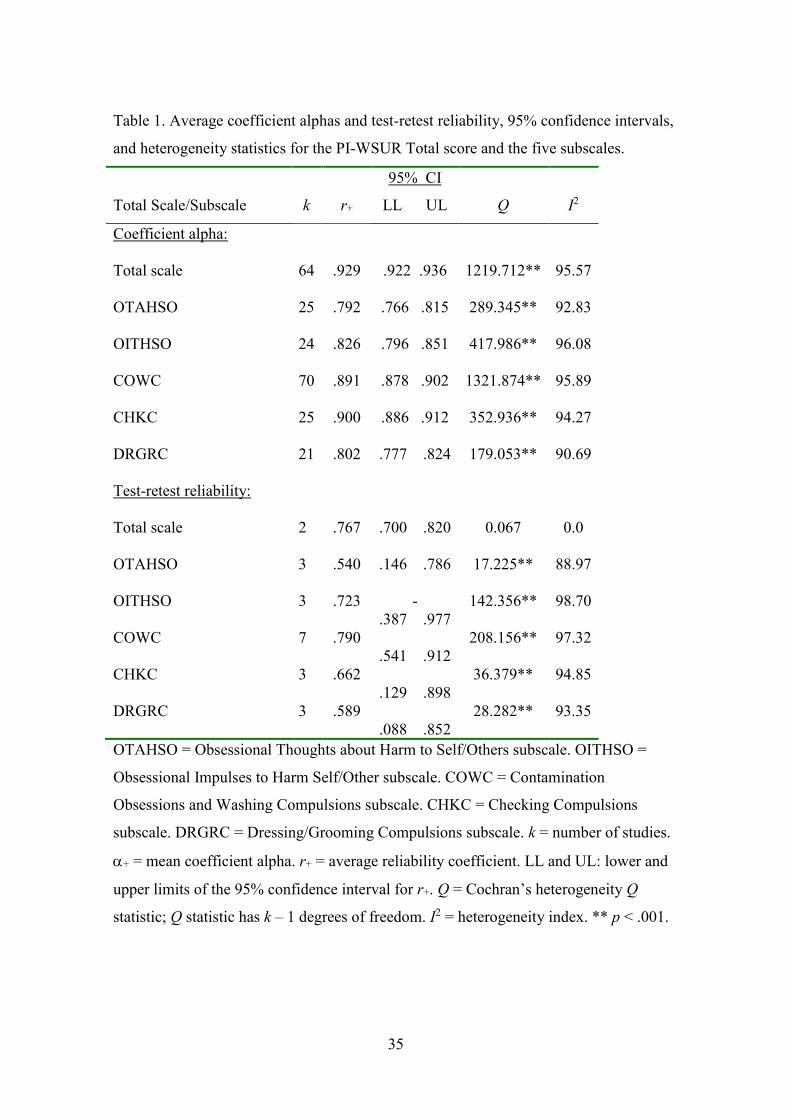
of facilitating interpretation. Table 1 shows the main summary statistics for the alpha
coefficients obtained for the total scores as well as for each subscale. Figure 2 in
Supplementary file 3 displays a forest plot of alpha coefficients for the PI-WSUR total
scores in each study, and Figure 3 (Supplementary file 3) presents a forest plot of alpha
coefficients for the Contamination Obsessions and Washing Compulsions, COWC,
subscale scores. The 64 estimates reported for the total scale yielded a mean coefficient
alpha of .929 (95%CI: .922 and .936), ranging from .68 to .97. On the other hand, the 70
samples that reported a coefficient alpha for the COWC subscale ranged from .64 to .96,
with a mean of .891 (95%CI: .878 and .902). The remaining subscales showed lower
average reliability coefficients than the total scores, with checking compulsions, CHKC,
yielding the largest estimates (mean = .900; 95%CI: .886 and .912), followed by
obsessive impulses to harm self/other, OITHSO, (mean = .826; 95%CI: .796 and .851),
and with the dressing/grooming compulsions, DRGRC (mean = .802; 95%CI: .777
and .824), and obsessive thoughts about harm to self/other, OTAHSO (mean = .792;
95%CI: .766 and .815) subscales yielding the poorest average reliabilities.
Table 1 also presents the main summary statistics for test-retest reliability
coefficients, both for total scores and for each subscale, applying Fisher’s Z
transformation. Once again, all means and respective confidence intervals were back-
transformed to the Pearson correlation metric (see also Figure 4 in Supplementary file
3) to facilitate interpretation. It is worth noting the scarce number of studies that
reported this type of reliability. The two estimates reported for the total scale yielded a

14
mean test-retest coefficient of .767 (95%CI: .700 and .820). The seven samples
reporting a test-retest reliability coefficient for the COWC subscale ranged from .21
to .95, with a mean of .790 (95%CI: .541 and .912).
From the 7 studies that reported test-retest coefficients for the COWC subscale,
4 provided information on the time interval between test-retest administration varying
from 1 to 26 weeks, with a mean of 13 weeks (SD = 13.9). To test the possible
relationship between test-retest coefficients and time interval, a meta-regression was
conducted. The results showed a non-significant relationship between them, bj = -0.028;
F(1,2) = 6.59; p = .124; R2 = .71.
The remaining four subscales exhibited lower reliability than the total scale and
COWC subscale, with the OITHSO subscale yielding the highest average test-retest
reliability (mean = .723; 95%CI: -.387 and .977), followed by the CHKC (mean = .662;
95%CI: .129 and .898), and DRGRC subscales (mean = .589; 95%CI: .088 and .852).
The OTAHSO subscale showed the poorest reliability (mean = .540; 95%CI: .146
and .786).
Evidence of heterogeneity was found in both alpha and test-retest meta-analyses,
with Q statistics yielding statistically significant results and I2 indices of medium to
large magnitude in all cases (with the exception of test-retest for total scale; see Table 1).
Thus, moderator analyses were carried out to explain the large variability exhibited by
the reliability coefficients obtained in different applications of the PI-WSUR. As
mentioned in the Methods section, at least 30 reliability estimates were needed to
accomplish moderator analyses. Consequently, moderator analyses were conducted for
alpha coefficients but not for test-retest coefficients.
Analysis of Moderator Variables

15
As alpha coefficients for the total scores and COWC subscale were those that alone
presented more than 30 reliability estimates, the analysis of moderator variables was
conducted for these coefficients only. Meta-regressions and weighted ANOVAs were
performed for continuous and categorical variables, respectively, on alpha coefficients
for the total scale and COWC subscale, assuming mixed-effects models.
Table 2 shows the results of the simple meta-regressions applied on alpha
coefficients for the PI-WSUR total scores. Note that the sign of the regression slope, bj,
is obtained by taking the alpha coefficients transformed using Bonett’s (2002) formula
as the dependent variable. This means that the direction of the true relationship between
the alpha coefficients and each moderator is the inverse of that represented by the sign
of the slope in Table 2. From the different moderators analyzed, the SD of test scores
exhibited a positive, statistically significant relationship with the coefficient alpha, with
a percentage of variance explained of 37%.
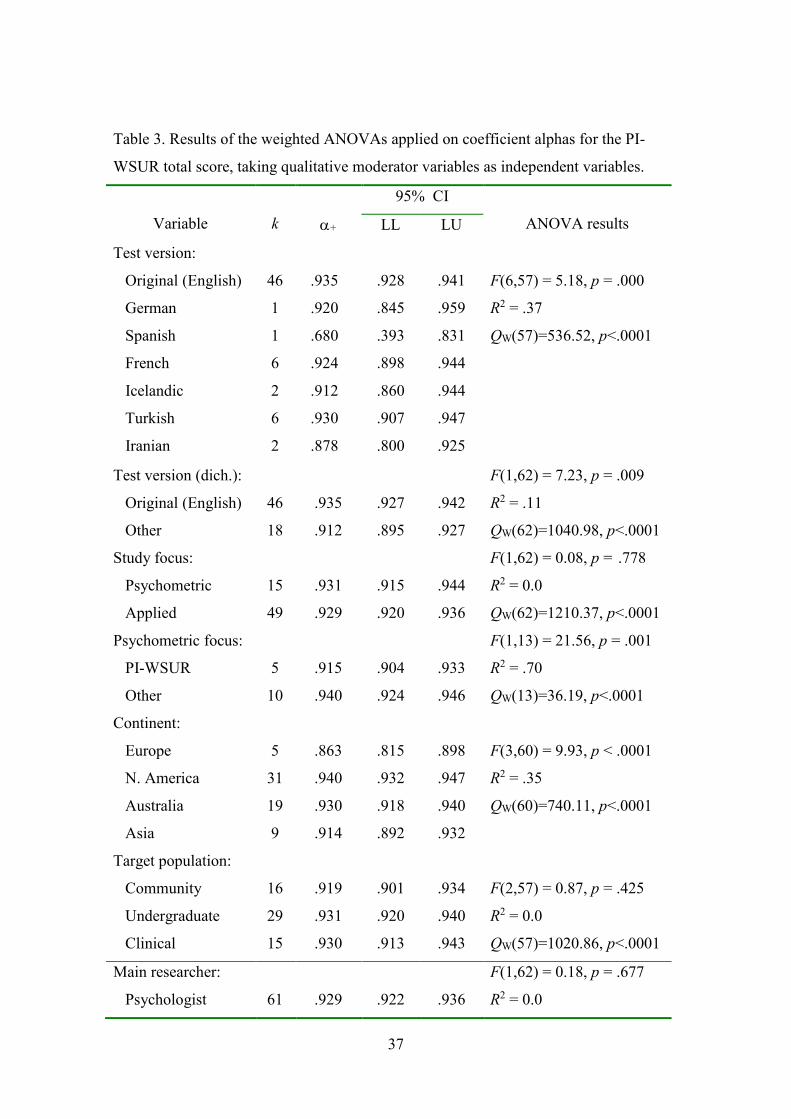
With regard to qualitative moderators, Table 3 presents the results of the
ANOVAs applied on alpha coefficients of the total scale. The test version showed a
statistically significant influence on the reliability estimates (p < .001), and 37% of the
variance explained. However, due to the large number of adaptations of the original PI-
WSUR (in English) to at least six different languages, this variable was dichotomized to
“original” vs. “adapted” versions. In this case, statistically significant differences were
also found (p = .009), with a higher overall reliability for the “original version” (mean
=.935) than for “adapted versions” (mean = .912). Of the 64 studies that reported a
coefficient alpha for the total scale, 15 were psychometric. When those 15 were
classified according to whether the target test was the PI-WSUR or another, statistically
significant differences were found between their mean alpha coefficients (p = .001),
with 70% of variance accounted for, and the mean reliability was lower for

16
psychometric studies focused on the PI-WSUR. Lastly, the geographical location of the
studies also showed a statistically significant relationship with the alpha coefficients (p
< .001) with a 35% of variance explained, with larger average alpha coefficients for
studies conducted in North America, Australia and Asia (means = .940, .930, .914,
respectively), and the lowest average yielded by those conducted in Europe (mean
= .863).
Regarding the COWC subscale, Table 2 also presents the results of the simple
meta-regressions applied on alpha coefficients. From the different continuous moderator
variables analyzed, the SD of the COWC scores and the percentage of clinical
participants in the sample showed a statistically significant relationship with the alpha
coefficients, with percentages of variance explained of 24% and 16%, respectively. In
particular, both predictors exhibited a positive relationship with alpha coefficients;
therefore, larger alpha coefficients were obtained as the SD of scores and number of
participants with clinical disorder increased.
Table 4 shows the results of the ANOVAs applied on the alpha coefficients for
the COWC subscale. Statistically significant differences were found when comparing
the average alpha coefficients grouped by the target population (p = .001), with 23% of
variance explained. In particular, larger average reliability was found for the clinical
samples (mean = .951) than for community (mean = .860), undergraduate (mean = .895),
subclinical (mean = .799), and mixed (mean = .893) samples. The three studies that
used clinical samples comprised participants with OCD. The remaining qualitative
moderator variables analyzed did not reach statistical significance.
Explanatory Models

17
Although several moderators showed a statistically significant association with the
alpha coefficients, all misspecification tests (QE for meta-regressions and QW for
ANOVAs) suggested the presence of residual heterogeneity among the reliability
coefficients after including the moderator (see Tables 2-4). Thus, the next step of this
RG meta-analysis was to use multiple meta-regression to identify the subset of most
relevant study characteristics to explain the variability of the alpha coefficients.
Separate explanatory models were fitted for the PI-WSUR total scale and COWC
subscale. Supplementary file 2 presents the results related to both explanatory models
(see Supplementary Tables 1 and 2).
With respect to the total scale, the explanatory model included five predictors:
the SD of total scores, the test version (dichotomized in ‘original’ vs. ‘other’), and the
continent where the study was carried out, coded as three dummy variables for
categories “Europe”, “North America”, and “Australia”. Due to missing data in some
variables, the number of studies included in the model was k = 50. The full model
presented a statistically significant relationship with the alpha coefficients (p = .0003),
with a percentage of variance explained of 51%. Of the five predictors included in the
model, the category “Europe” (p = .006) showed a statistically significant relationship
with the alpha coefficients, and the SD of the total scores also yielded a significant
result (p = .001), once the influence of the other variables was controlled. These results
indicated that alpha coefficients obtained in the studies were larger as the SD increased
and smaller in studies conducted in Europe. For contribution in terms of proportion of
variance increase of each predictor to the multiple meta-regression model, including the
SD of scores led to an increase of 17% of variance explained (ΔR2 = .17), once the
remaining predictors were already in the model. Regarding continent, its inclusion led

18
to an increase of 9% (ΔR2 = .09), and the test version did not increase the variance
explained once the remaining predictors were already in the model (ΔR2 = 0).
For the COWC subscale, two predictors were selected for inclusion in the
model: the SD of scores and the percentage of clinical sample. The final number of
studies in this model was k = 63 due to missing data in some variables. The full model
reached statistical significance (p < .001), with 29% of variance accounted for. From the
two predictors included in the model, and once the influence of the other predictor was
controlled, only the SD of the scores showed a positive, statistically significant
relationship with the alpha coefficients (p = .008). Finally, regarding the increase in the
percentage of variance accounted for by each predictor, and after incorporating the other
into the model, the most notable increment in R2 was found when the SD of scores was
introduced in the model (ΔR2 = 13%).
Estimating Reliability Induction
Of the 242 studies that applied the PI-WSUR, 130 induced reliability from other studies,
implying a 53.7% of reliability induction for this test (see Figure 1 in Supplementary
file 3). Of the 130 studies that induced reliability, 51 (39.2%) omitted any reference to
the PI-WSUR reliability (induction by omission), whereas the remaining 79 studies
(60.8%) induced reliability from previous studies (induction by report). In particular, of
these 79 studies, 31 (23.9%) vaguely induced reliability (not reporting specific
estimates), and 48 (36.9%) accurately induced reliability (i.e., reporting specific
estimates from previous studies).
Furthermore, we compared the reliability induction rates according to
publication year, study type (psychometric versus applied), and continent where the

19
study was performed. A binary logistic regression model found no evidence of an
association between publication year and reliability induction (z = 0.899, p = .343).
Of the 242 studies that had applied the PI-WSUR, 5 were psychometric and
focused on the PI-WSUR, 40 psychometric studies focused on scales other than PI-
WSUR, and the remaining 197 were applied studies. All psychometric studies focused
on the PI-WSUR reported reliability estimates with the data at hand. In contrast, 56% of
the other psychometric studies and 54% of the applied studies induced the reliability of
the PI-WSUR.
The percentages of studies inducing reliability on different continents were
100% (South America), 74.5% (Europe), 67.7% (mixed category3), 58.3% (Asia), 50%
(Australia), and 45% (North America). These differences were statistically significant,
χ2(5) = 13.53, p = .019. It is important to highlight the scarce number of studies from
mixed category (6 studies) and South America (1 study) compared to 120 studies -
North America, 47 - Europe, 44 - Australia, and 24 - Asia.
Comparing Studies that induce and report Reliability
An important aim in an RG meta-analysis is to examine to what extent results can be
generalized to the population of studies that have applied the test, regardless of whether
they reported or induced reliability. To reach this aim, the characteristics of the samples
used in studies that reported and induced test score reliability were compared. In
particular, reporting and inducing studies were compared regarding the mean and SD of
the PI-WSUR total score, as well as the mean age, gender (% male) and ethnic
distribution (% Caucasians) of the participants in the samples. Furthermore, these
3 Category composed of four studies performed combining various geographic locations. Of the four
studies, one was conducted in Europe and South America, two in North America and South Africa, and
the remaining three in Australia and North America.

20
comparisons were conducted separately for clinical and non-clinical samples.
Supplementary file 2 presents the results of these comparisons (see Supplementary
Table 3).
Regarding non-clinical samples, studies that induced reliability presented SDs of
test scores lower than those of studies that reported reliability with the data at hand (p
< .001). In addition, the mean (p < .001) and SD of the age (p < .001) and the
percentage of males in the samples (p = .033) also presented statistically significant
differences between both types of studies, with inducing studies showing larger means
than reporting studies.
As for clinical samples, no differences were found between studies inducing and
reporting the reliability in any sample characteristics.
Discussion
An RG meta-analysis was performed to estimate the reliability of PI-WSUR scores and
identify the characteristics of studies statistically associated with the variability of the
reliability coefficients. We also estimated the reliability induction rate when using the
PI-WSUR and compared the characteristics of studies that reported and induced
reliability. Our RG meta-analysis was based on a total of 112 studies that reported any
internal consistency and/or test-retest reliability estimate with the data at hand.
It is generally accepted that the internal consistency reliability of test scores
must be over .80 for research purposes and over .90 for clinical practice (Charter, 2003;
Nunnally & Bernstein, 1994). In addition, Cicchetti (1994) suggested the following
guidelines for assessing the clinical relevance of coefficient alpha of test scores:
unacceptable for coefficients lower than .7, fair for range .7 - .8, good for .8 - .9, and
excellent for values over .9. Considering these guidelines, the average internal

21
consistency reliability of the PI-WSUR total score can be deemed excellent, both for
research and clinical practice. Three PI-WSUR subscales exhibited scores with good
reliability (over .8): checking compulsions, contamination obsessions and washing
compulsions, and obsessive impulses to harm self/others. Obsessive thoughts about
harm self/others and dressing/grooming compulsions subscales showed scores with fair
internal consistency reliability (between .7 - .8).
There is no consensus in the literature regarding guidelines for interpreting the
adequacy of test-retest coefficients (Charter, 2003). If we tentatively use the
abovementioned guidelines for internal consistency reliability, then the PI-WSUR total
score showed fair reliability (between .7 - .8), as well as obsessive impulses to harm
self/others, contamination obsessions and washing compulsions, checking compulsions,
and dressing/grooming compulsions subscales. Only the obsessive thoughts about harm
self/others subscale presented average reliability under .7. Our results on test-retest
reliability must be interpreted very cautiously due to the scarcity of studies reporting
these coefficients.
The overall reliabilities obtained in our meta-analysis of the PI-WSUR scale can
be compared to the values found for other measurement scales used to assess obsessive-
compulsive symptomatology. In this respect, PI-WSUR exhibited similar average
internal consistency reliability (mean alpha = .929) to that of the original PI (mean alpha
= .935; Sánchez-Meca et al., 2017) and the PI-R (mean alpha = .926; Núñez-Núñez et
al., 2017) and slightly lower test-retest reliability (mean = .767) than those of the PI and
PI-R (mean = .835 and .910, respectively). These results indicate that the PI-WSUR
scores exhibit similar internal consistency reliability to the PI scores, in addition to the
reduction of items in the PI-WSUR compared to the original PI and PI-R. An RG meta-
analysis on the Yale-Brown Obsessive-Compulsive Scale (Y-BOCS; López-Pina et al.,
22
2015) found average internal consistency and test-retest reliability for the Y-BOCS total
score of .866 and .848, respectively. The internal consistency and test-retest reliability
of the Maudsley Obsessive-Compulsive Inventory (MOCI) was also investigated in
another RG meta-analysis, obtaining averages of .76 and .70, respectively (Sánchez-
Meca et al., 2011). Thus, compared with the reliability exhibited by other obsessive-
compulsive scales, the PI-WSUR scores present excellent reliability.
Alpha coefficients showed large heterogeneity, meaning that the reliability of the
PI-WSUR scores should not be generalized to any test application, as it depends on the
context where the test was applied, characteristics of studies, and composition, target
population, and variability of the samples. The large heterogeneity found among alpha
coefficients led us to search for moderator variables able to explain variability. For the
PI-WSUR total scores, the SD presented a positive, statistically significant relationship
with reliability estimates. The positive relationship of the SD with reliability is a result
expected from the psychometric theory (cf., e.g., Crocker & Algina, 1986). Another
variable related to alpha coefficients was the test version, with the original (English)
version exhibiting better average reliability than adapted versions to other languages
and/or cultures. Difficulties in adapting a test to other contexts can explain the slightly
lower reliability exhibited by the adapted versions compared to the original PI-WSUR.
Finally, the continent where the study was conducted also showed a statistically
significant relationship with the alpha coefficients, with studies conducted in North
America exhibiting better average reliability than those from other continents. When
these three moderator variables were included in a multiple meta-regression, only the
SD of test scores and the continent remained statistically significant.
Moderator analyses were also performed for the contamination obsessions and
washing compulsions subscale, as it has been very frequently used. As expected from

23
the psychometric theory, a positive, statistically significant relationship was found
between the SD of subscale scores and coefficient alpha. In addition, clinical samples
exhibited, on average, larger alpha coefficients than community samples. When both
moderators were included in a multiple meta-regression model, only the SD of the
subscale scores showed a statistically significant association. The results obtained with
the explanatory models for the PI-WSUR total score and the contamination obsessions
and washing compulsions subscale indicate the importance of taking the variability of
the test scores into account in the sample when interpreting the magnitude of a
reliability coefficient. Furthermore, the predictive equations shown in Supplementary
file 2 can be used by researchers to make predictions of the expected reliability
according to study characteristics.
Another purpose of our meta-analysis was to investigate the extent to which the
studies that applied the PI-WSUR induced reliability from previous studies. We found
that most studies did so (53.7%). This figure was lower than the 78.6% and 64.4%
obtained by Sánchez-Meca et al. (2015, July) and Vacha-Haase and Ness (1999),
respectively, and very similar to the value of 54% found by Whittington (1998).
Numerous initiatives have been developed to avoid the malpractice of inducing the
reliability of test scores (Thompson, 2003). Recommendations for reporting reliability
estimates of test scores with the data at hand have been proposed by the APA Task
Force on Statistical Inference (Wilkinson & the APA Task Force for Statistical
Inference, 1999), scientific associations such as the American Educational Research
Association and the National Research Council on Measurement in Education, editorial
policies of such scientific journals as Educational and Psychological Measurement
(Thompson, 1994) and the Journal of Experimental Education (Heldref Foundation,
1997) and, more recently, the reporting standards of the American Psychological

24
Association specifically recommended for quantitative studies: “Estimate and report
values of reliability coefficients for the scores analyzed (i.e., the researcher’s sample), if
possible” (Appelbaum et al., 2018, Table 1, p. 7).
The final aim of our research was to determine to what extent results in our RG
meta-analysis can be generalized to the total population of studies that have applied the
PI-WSUR. The results of an RG meta-analysis can be generalized to the total
population of studies when the studies that reported reliability used samples similar in
composition and variability to those studies that induced it, therefore reporting bias, as
regards reliability, can be discarded as a threat against the validity of the meta-analytic
results (Sterne et al., 2011). With this purpose, the sociodemographic characteristics of
the studies that induced and reported reliability were compared. Regarding clinical
samples, no differences were found between the two groups of studies. For non-clinical
samples, larger SD of total score and lower mean age, SD of age, and percentage of
males were found for reporting than for inducing reliability studies. Consequently, our
results can be reasonably generalized to all studies that applied the PI-WSUR to clinical
samples, but not when applied to non-clinical ones.
Limitations and Future Research
The main limitation of our study was the scarce number of studies that reported any
test-retest correlation for the PI-WSUR scores. This circumstance limits the
generalizability of our results regarding the temporal stability of the PI-WSUR scores
and did not allow us to examine moderator variables related to the test-retest estimates.
A second limitation was the scarce number of studies reporting reliability from
clinical samples. Of the 15 studies with clinical samples, 7 comprised participants with
OCD, and the remaining 8 samples included participants with different disorders

25
(mainly anxiety disorders and depression). The small number of samples did not enable
us to obtain reliability estimates of the PI-WSUR scores for the different clinical
disorders.
A third problem in any RG meta-analysis is the extent to which results can be
generalized to the total population of studies that applied the scale, regardless of
inducing or reporting reliability. Regarding non-clinical samples, some differences were
found in the composition and variability of the samples used by the studies that reported
and induced reliability of the PI-WSUR scores. Therefore, when non-clinical samples
are used, our results must be generalized only to studies that reported reliability of the
PI-WSUR.
Conclusions
Our findings demonstrate the good reliability of the PI-WSUR scores, both for
screening and clinical purposes, and its similarity with the reliability exhibited by the
original PI and PI-R scores. Our results also demonstrate how reliability depends on the
application context and the composition and variability of the samples. In particular, a
strong positive relationship was found with the SD of test scores. Finally, the large rate
of reliability induction found for the PI-WSUR evidence the importance that researchers
who use the PI-WSUR in the future report reliability estimates with their own samples
and avoid the erroneous practice of inducing reliability.
26
References
American Psychiatric Association (1994). Diagnostic and Statistical Manual of Mental
Disorders (4th ed.): DSM-4. American Psychiatric Association, DC.
American Psychiatric Association (2013). Diagnostic and Statistical Manual of Mental
Disorders (5th ed.): DSM-5. American Psychiatric Association, DC. doi:
10.1176/appi.books.9780890425596
Anderson, K. (2010). Interpretation of ambiguous information: Can generalized anxiety
disorder be distinguished from other anxiety disorders? Unpublished doctoral
dissertation. Concordia University, Canada.
Appelbaum, M. Cooper, H., Kline, R. B., Mayo-Wilson, E., Nezu, A. M., & Rao, S. M.
(2018). Journal article reporting standards for quantitative research in
psychology: The APA Publications and Communications Board Task Force
report. American Psychologist, 73, 3-25. doi: 10.1037/amp0000191
Árnadóttir, Á., & Daníelsdóttir, S. A. (2016). The contribution of disgust in
contamination fear: The mediating role of harm avoidance and incompleteness.
Unpublished doctoral dissertation. University of Iceland, Iceland.
Bhar, S. S., & Kyrios, M. (2005). Obsessions and compulsions are associated with
different cognitive and mood factors. Behaviour Change, 22, 81-96.
https://doi.org/10.1375/bech.2005.22.2.81
Bonett, D. G. (2002). Sample size requirements for testing and estimating coefficient
alpha. Journal of Educational and Behavioral Statistics, 27, 335–340. doi:
10.3102/10769986027004335
Borenstein, M., Hedges, L. V., Higgins, J. P. T., & Rothstein, H. R. (2009).
Introduction to meta-analysis. Chichester, UK: Wiley. doi:10.1002/
9780470743386

27
Burns, G. L., Keortge, S. G., Formea, G. M., & Sternberger, L. G. (1996). Revision of
the Padua Inventory of obsessive compulsive disorder symptoms: Distinctions
between worry, obsessions, and compulsions. Behaviour Research and Therapy,
34, 163-173.
Charter, R. A. (2003). A breakdown of reliability coefficients by test type and reliability
methods, and the clinical implications of low reliability. The Journal of General
Psychology, 130, 290-304. doi: 10.1080/00221300309601160
Cicchetti, D. V. (1994). Guidelines, criteria, and rules of thumb for evaluating normed
and standardized assessments instruments in psychology. Psychological
Assessment, 6, 284-290. doi: 10.1037/1040-3590.6.4.284
Crocker, L. M., & Algina, J. (1986). Introduction to classical and modern test theory.
New York: Holt, Rinehart & Winston.
Donahue, R. D. (2005). The structural relationships among generalized anxiety,
obsessions-compulsions, and depression at the syndrome and sub-syndrome
level. Behaviour Research and Therapy, 43, 1587-1609. doi:
10.1016/j.brat.2004.11.009
Doucet, A. (2008). Screening for generalized anxiety disorder using a self-report
questionnaire: Validity of the Worry and Anxiety Questionnaire II. Unpublished
doctoral dissertation. Concordia University, Canada.
Elwood, L. S., Riskind, J. H., & Olatunji, B. O. (2011). Looming vulnerability:
Incremental validity of a fearful cognitive distortion in contamination fears.
Cognitive Therapy and Research, 35, 40-47. doi: 10.1007/s10608-009-9277-3
Etzel, E. N. (2009). The effects of safety behaviors on health anxiety: Conceptualizing
hypochondriasis as an anxiety disorder. Unpublished doctoral dissertation.
Vanderbilt University, United States of America.

28
Francazio, S. K. (2015). Examining cognitive flexibility in young adults with symptoms
of obsessive-compulsive and related problems. Unpublished doctoral dissertation.
Kent State University, United States of America.
Freeston, M. H., Ladouceur, R., Rheaume, J., Letarte, H., Gagnon, F., & Thibodeau, N.
(1994). Self-report of obsessions and worry. Behaviour Research and Therapy,
32, 29-36. doi: 10.1016/0005-7967(94)90081-7
Gönner, S., Ecker, W., & Leonhart, R. (2010). The Padua Inventory: Do revisions need
revision? Assessment, 17, 89-106. doi: 10.1177/1073191109342189.
Green-Armytage, M. (2016). Are disgust, contamination fear and health anxiety
associated with desire to avoid contact with people with facial dermatological
conditions? Unpublished doctoral dissertation. University of Surrey, United
Kingdom.
Hartung, J. (1999). An alternative method for meta-analysis. Biometrical Journal, 41,
901-916. doi: 10.1002/(SICI)1521-4036(199912)41:8<901:AID-
BIMJ901>3.0.CO;2-W
Haslam, N., Williams, B. J., Kyrios, M., McKay, D., & Taylor, S. (2005). Subtyping
obsessive-compulsive disorder: A taxometric analysis. Behavior Therapy, 36,
381-391. doi: 10.1016/S0005-7894(05)80120-0
Hedges, L. V., & Olkin, I. (1985). Statistical methods in meta-analysis. Orlando, FL:
Academic Press.
Heldref Foundation (1997). Guidelines for contributors. Journal of Experimental
Education, 65, 95-96.
Henson, R. K., & Thompson, B. (2002). Characterizing measurement error in scores
across studies: Some recommendations for conducting" reliability
29
generalization" studies. Measurement and Evaluation in Counseling and
Development, 35, 113-127.
Higgins, J. P. T., Thompson, S. G., Deeks, J. J., & Altman, D. G. (2003). Measuring
inconsistency in meta-analyses. British Medical Journal, 327, 557–560. doi:
10.1136/bmj.327.7414.557
Jónsdóttir, S. D., & Smári, J. (2000). Measuring obsessions without worry: Convergent
and discriminant validity of the Revised Padua Inventory in an Icelandic student
population. Scandinavian Journal of Behaviour Therapy, 29, 49-56.
doi:10.1080/028457100750066397
Kessler, R. C., Petukhova, M., Sampson, N. A., Zaslavsky, A. M., & Wittchen, H. U.
(2012). Twelve-month and lifetime prevalence and lifetime morbid risk of
anxiety and mood disorders in the United States. International Journal of
Methods in Psychiatric Research, 21, 169-184. doi: 10.1002/mpr.1359
Knapp, G., & Hartung, J. (2003). Improved tests for a random effects meta-regression
with a single covariate. Statistics in Medicine, 22, 2693-2710. doi:
10.1002/sim.1482
Lappalainen, P. S. M. (2012). Disgust propensity, fear of contamination and underlying
dimensions of obsessive-compulsive symptoms. Unpublished doctoral
dissertation. University of Iceland, Iceland.
López-López, J. A., Botella, J., Sánchez-Meca, J., & Marín-Martínez, F. (2013).
Alternatives for mixed-effects meta-regression models in the reliability
generalization approach: A simulation study. Journal of Educational and
Behavioral Statistics, 38, 443-469. doi: 10.3102/1076998612466142
López-López, J. A., Marín-Martínez, F., Sánchez-Meca, J., Van den Noortgate, W., &
Viechtbauer, W. (2014). Estimation of the predictive power of the model in

30
mixed-effects meta-regression: A simulation study. British Journal of
Mathematical and Statistical Psychology, 67, 30-48. doi: 10.1111/bmsp.12002
López-Pina, J. A., Sánchez-Meca, J., López-López, J. A., Marín-Martínez, F., Núñez-
Núñez, R. M., Rosa-Alcázar, A. I., ..., & Ferrer-Requena, J. (2015). The Yale–
Brown Obsessive Compulsive Scale: A reliability generalization meta-
analysis. Assessment, 22, 619-628. doi: 10.1177/1073191114551954
Lord, F. M., & Novick, M. R. (1968). Statistical theories of mental test scores. Reading,
MA: Addison-Wesley.
McDonald, R. P. (1999). Test theory: A unified treatment. Hillsdale, NJ: Erlbaum.
Nedeljkovic, M., & Kyrios, M. (2007). Confidence in memory and other cognitive
processes in obsessive–compulsive disorder. Behaviour Research and Therapy,
45, 2899-2914. doi: 10.1016/j.brat.2007.08.001
Nunnally, J. C., & Bernstein, I.H. (1994). Psychometric Theory. New York: McGraw
Hill.
Núñez-Núñez, R. M., Sánchez-Meca, J., López-Pina, J. A., Marín-Martínez, F., López-
López, J. A., & Rubio-Aparicio, M. (2017). Reliability generalization meta-
analysis of the Padua Inventory Revision for assessing obsessive-compulsive
symptomatology. Manuscript under review.
Pang, B., Zhu, C.Y., Wang, K., Zhang, L., Yang, P., & Ma, P. (2009). Validity and
reliability of the Chinese version of Padua Inventory-Washington State
University Revision for college students. Chinese Journal of Clinical
Psychology, 17, 131-133.
Ragnarsdóttir, R., & Siggeirsdóttir, S. (2016). Disgust and OC symptoms: The
mediating role of harm avoidance and incompleteness. Unpublished doctoral
dissertation. University of Iceland, Iceland.
31
Rodriguez, M. C., & Maeda, Y. (2006). Meta-analysis of coefficient alpha.
Psychological Methods, 11, 306-322. doi: 10.1037/1082-989X.11.3.306
Sanavio, E. (1988). Obsessions and compulsions: The Padua Inventory. Behaviour
Research and Therapy, 26, 169-177. doi: 10.1016/0005-7967(88)90116-7
Sánchez-Meca, J., López-López, J. A., & López-Pina, J. A. (2013). Some recommended
statistical analytic practices when reliability generalization (RG) studies are
conducted. British Journal of Mathematical and Statistical Psychology, 66, 402-
425. doi: 10.1111/j.20448317.2012.02057.x
Sánchez-Meca, J., López-Pina, J. A., López-López, J. A., Marín-Martínez, F., Rosa-
Alcázar, A. I., & Gómez-Conesa, A. (2011). The Maudsley Obsessive-
Compulsive Inventory: A reliability generalization meta-analysis. International
Journal of Clinical and Health Psychology, 11, 473-493.
Sánchez-Meca, J., & Marín-Martínez, F. (2008). Confidence intervals for the overall
effect size in random-effects meta-analysis. Psychological Methods, 13, 31-48.
doi: 10.1037/1082-989X.13.1.31
Sánchez-Meca, J., Rubio-Aparicio, M., López-Pina, J. A., Núñez-Núñez, R. M., &
Marín-Martínez, F. (2015, July). El fenómeno de la inducción de la fiabilidad en
Ciencias Sociales y de la Salud [The reliability induction phenomenon in the
Social and Health Sciences]. Paper presented at the XIV Congress of
Methodology of the Social and Health Sciences, Palma de Mallorca (Spain).
Sánchez-Meca, J., Rubio-Aparicio, M., Núñez-Núñez, R. M., López-Pina, J. A., Marín-
Martínez, F., & López-López, J. A. (2017). A reliability generalization meta-
analysis of the Padua Inventory of obsessions and compulsions. The Spanish
Journal of Psychology, 20. e70. Doi:10.1017/sjp.2017.65

32
Sarawgi, S. (2011). Attention retraining treatment for contamination fear: A
randomized control trial. Unpublished doctoral dissertation. Vanderbilt
University, United States of America.
Shams, G., Kaviani, H., Esmaili, Y., Ebrahimkhani, N., & Manesh, A. A. (2011).
Psychometric properties of the Persian version of the Padua Inventory
Washington State University Revision (PI-WSUR). Iranian Journal of
Psychiatry, 6, 12-18.
Shields, A. L., & Caruso, J. C. (2004). A reliability induction and reliability
generalization study of the Cage Questionnaire. Educational and Psychological
Measurement, 64, 254-270. doi: 10.1177/0013164403261814
Somers, J. M., Goldner, E. M., Waraich, P., & Hsu, L. (2006). Prevalence and incidence
studies of anxiety disorders: A systematic review of the literature. Canadian
Journal of Psychiatry, 51, 100-113. doi:10.1177/070674370605100206
Sterne, J. A., Sutton, A. J., Ioannidis, J., Terrin, N., Jones, D. R., Lau, J., ..., & Tetzlaff,
J. (2011). Recommendations for examining and interpreting funnel plot
asymmetry in meta-analyses of randomised controlled trials. British Medical
Journal, 343, D4002. doi: 10.1136/bmj.d4002
Streiner, D. L., & Norman, G. R. (2008). Health measurement scales: A practical guide
to their development and use (4th ed.). New York: Oxford University Press. doi:
10.1093/acprof:oso/9780199231881.001.0001
Thompson, B. (1994). Guidelines for authors. Educational and Psychological
Measurement, 54, 837-847.
Thompson, B. (Ed.) (2003). Score reliability: Contemporary thinking on reliability
issues. Thousand Oaks, CA: Sage.
33
Vacha-Haase, T. (1998). Reliability generalization: Exploring variance in measurement
error affecting score reliability across studies. Educational and Psychological
Measurement, 58, 6-20. doi: 10.1177/0013164498058001002
Vacha-Haase, T., Kogan, L. R., & Thompson, B. (2000). Sample compositions and
variabilities in published studies versus those of test manuals: Validity of score
reliability inductions. Educational and Psychological Measurement, 60, 509-522.
https://doi.org/10.1177/00131640021970682
Vacha-Haase, T., & Ness, C. (1999). Practices regarding reporting of reliability
coefficients: A review of three journals. Journal of Experimental Education, 67,
335-342. https://doi.org/10.1080/0022097990959848
Vacha-Haase, T., & Thompson, B. (2011). Score reliability: A retrospective look back
at 12 years of reliability generalization studies. Measurement and Evaluation in
Counseling and Development, 44, 159-168. doi: 10.1177/0748175611409845
Van Oppen, P., Hoekstra, R. J., & Emmelkamp, P. M. (1995). The structure of
obsessive-compulsive symptoms. Behaviour Research and Therapy, 33, 15-23.
doi: 10.1016/0005-7967(94)E0010-G
Viechtbauer, W. (2010). Conducting meta-analyses in R with the metaphor package.
Journal of Statistical Software, 36, 1–48. doi: 10.18637/jss.v036.i03
Viechtbauer, W., López-López, J. A., Sánchez-Meca, J., & Marín-Martínez, F. (2015).
A comparison of procedures to test for moderators in mixed-effects meta-
regression models. Psychological Methods, 20, 360-374. doi:
10.1037/met0000023
Washington, C., Temple, S. R., & Norton, P. J. (2005). Comparison on the
psychometric properties of the Y-BOCS and PI-WSUR among five racial groups.
Depression and Anxiety, 22, 245-246. doi: 10.1002/da.20093
34
Wilkinson, L., & APA Task Force on Statistical Inference. (1999). Statistical methods
in psychology journal: Guidelines and explanations. American Psychologist, 54,
594-604. doi: 10.1037/0003-066X.54.8.594
Whittington, D. (998). How well do researchers report their measures? An evaluation of
measurement in published educational research. Educational and Psychological
Measurement, 58, 21-37. http://psycnet.apa.org/doi/10.1177/0013164498058001003
Wu, K. D. (2008). Eating disorders and obsessive–compulsive disorder: A dimensional
approach to purported relations. Journal of Anxiety Disorders, 22, 1412-1420.
doi: 10.1016/j.janxdis.2008.02.003
Wu, K. D., Aardema, F., & O’Connor, K. P. (2009). Inferential confusion, obsessive
beliefs, and obsessive-compulsive symptoms: A replication and extension.
Journal of Anxiety Disorders, 23, 746-752. doi: 10.1016/j.janxdis.2009.02.017
Wu, K. D., & Cortesi, G. T. (2009). Relations between perfectionism and obsessive–
compulsive symptoms: Examination of specificity among the dimensions.
Journal of Anxiety Disorders, 23, 393-400. doi: 10.1016/j.janxdis.2008.11.006
Yorulmaz, O., Karancı, A. N., Dirik, G., Baştuğ, B., Kısa, C., Göka, E., & Burns, G. L.
(2007). Padua Envanteri-Washington Eyalet Üniversitesi Revizyonu: Türkçe
Versiyonunun Psikometrik Özellikleri [Padua Inventory - Washington State
University Revision: Psychometric properties of the Turkish version]. Türk
Psikoloji Yazıları, 10, 75-85.
35
Table 1. Average coefficient alphas and test-retest reliability, 95% confidence intervals,
and heterogeneity statistics for the PI-WSUR Total score and the five subscales.
Total Scale/Subscale
k
r+
95% CI
LL UL
Q
I2
Coefficient alpha:
Total scale
OTAHSO
OITHSO
COWC
CHKC
DRGRC
Test-retest reliability:
Total scale
OTAHSO
OITHSO
COWC
CHKC
DRGRC
64
25
24
70
25
21
2
3
3
7
3
3
.929
.792
.826
.891
.900
.802
.767
.540
.723
.790
.662
.589
.922 .936
.766 .815
.796 .851
.878 .902
.886 .912
.777 .824
.700 .820
.146 .786
-
.387 .977
.541 .912
.129 .898
.088 .852
1219.712**
289.345**
417.986**
1321.874**
352.936**
179.053**
0.067
17.225**
142.356**
208.156**
36.379**
28.282**
95.57
92.83
96.08
95.89
94.27
90.69
0.0
88.97
98.70
97.32
94.85
93.35
OTAHSO = Obsessional Thoughts about Harm to Self/Others subscale. OITHSO =
Obsessional Impulses to Harm Self/Other subscale. COWC = Contamination
Obsessions and Washing Compulsions subscale. CHKC = Checking Compulsions
subscale. DRGRC = Dressing/Grooming Compulsions subscale. k = number of studies.
+ = mean coefficient alpha. r+ = average reliability coefficient. LL and UL: lower and
upper limits of the 95% confidence interval for r+. Q = Cochran’s heterogeneity Q
statistic; Q statistic has k – 1 degrees of freedom. I2 = heterogeneity index. ** p < .001.

36
Table 2. Results of the simple meta-regressions applied on coefficient alphas for the PI-
WSUR total score and COWC subscale score, taking continuous moderator variables as
predictors.
Predictor variable k bj F p QE R2
PI-WSUR total score:
Mean Total score
SD of Total score
Mean age (years)
SD of age (years)
Gender (% male)
Ethnicity (% Caucasian)
% of clinical sample
Year of the study
COWC subscale score:
Mean COWC subscale score
SD of COWC subscale score
Mean age (years)
SD of age (years)
Gender (% male)
Ethnicity (% Caucasian)
% of clinical sample
Year of the study
53
50
56
51
57
25
64
64
64
63
60
52
63
35
70
70
-0.0022
-0.0256
0.0024
0.0044
-0.0013
0.0018
-0.0003
0.0059
0.0132
-0.0793
0.0021
0.0121
-0.0043
-0.0019
-0.0083
-0.0269
0.38
15.19
0.10
0.12
0.09
1.19
0.04
0.28
1.01
16.41
0.04
0.33
0.54
0.17
10.76
3.88
.541
< .001
.750
.737
.769
.287
.835
.598
.319
< .001
.855
.566
.466
.683
.002
.053
405.09***
230.96***
1075.49***
1015.15***
1142.27***
134.11***
1205.59***
1187.01***
939.65***
692.22***
1226.46***
1037.44***
1254.31***
424.81***
1138.12***
1126.06***
0.0
.37
0.0
0.0
0.0
.10
0.0
0.0
0.0
.24
0.0
0.0
0.0
0.0
.16
.04
k = number of studies. bj = regression coefficient of each predictor. F = Knapp-
Hartung’s statistic for testing the significance of the predictor (the degrees of freedom
for this statistic are 1 for the numerator and k – 2 for the denominator). p = probability
level for the F statistic. QE = statistic for testing the model misspecification. R2 =
proportion of variance accounted for by the predictor. *** p < .0001.
37
Table 3. Results of the weighted ANOVAs applied on coefficient alphas for the PI-
WSUR total score, taking qualitative moderator variables as independent variables.
Variable
k
+
95% CI
ANOVA results LL LU
Test version:
Original (English)
German
Spanish
French
Icelandic
Turkish
Iranian
46
1
1
6
2
6
2
.935
.920
.680
.924
.912
.930
.878
.928
.845
.393
.898
.860
.907
.800
.941
.959
.831
.944
.944
.947
.925
F(6,57) = 5.18, p = .000
R2 = .37
QW(57)=536.52, p<.0001
Test version (dich.):
Original (English)
Other
46
18
.935
.912
.927
.895
.942
.927
F(1,62) = 7.23, p = .009
R2 = .11
QW(62)=1040.98, p<.0001
Study focus:
Psychometric
Applied
15
49
.931
.929
.915
.920
.944
.936
F(1,62) = 0.08, p = .778
R2 = 0.0
QW(62)=1210.37, p<.0001
Psychometric focus:
PI-WSUR
Other
5
10
.915
.940
.904
.924
.933
.946
F(1,13) = 21.56, p = .001
R2 = .70
QW(13)=36.19, p<.0001
Continent:
Europe
N. America
Australia
Asia
5
31
19
9
.863
.940
.930
.914
.815
.932
.918
.892
.898
.947
.940
.932
F(3,60) = 9.93, p < .0001
R2 = .35
QW(60)=740.11, p<.0001
Target population:
Community
Undergraduate
Clinical
16
29
15
.919
.931
.930
.901
.920
.913
.934
.940
.943
F(2,57) = 0.87, p = .425
R2 = 0.0
QW(57)=1020.86, p<.0001
Main researcher:
Psychologist
61
.929
.922
.936
F(1,62) = 0.18, p = .677
R2 = 0.0

38
Psychiatrist 3 .922 .874 .951 QW(62)=1219.71, p<.0001
k = number of studies. + = mean coefficient alpha. LL and LU = lower and upper 95%
confidence limits for +. F = Knapp-Hartung’s statistic for testing the significance of
the moderator variable. QW = statistic for testing the model misspecification. R2 =
proportion of variance accounted for by the moderator.

39
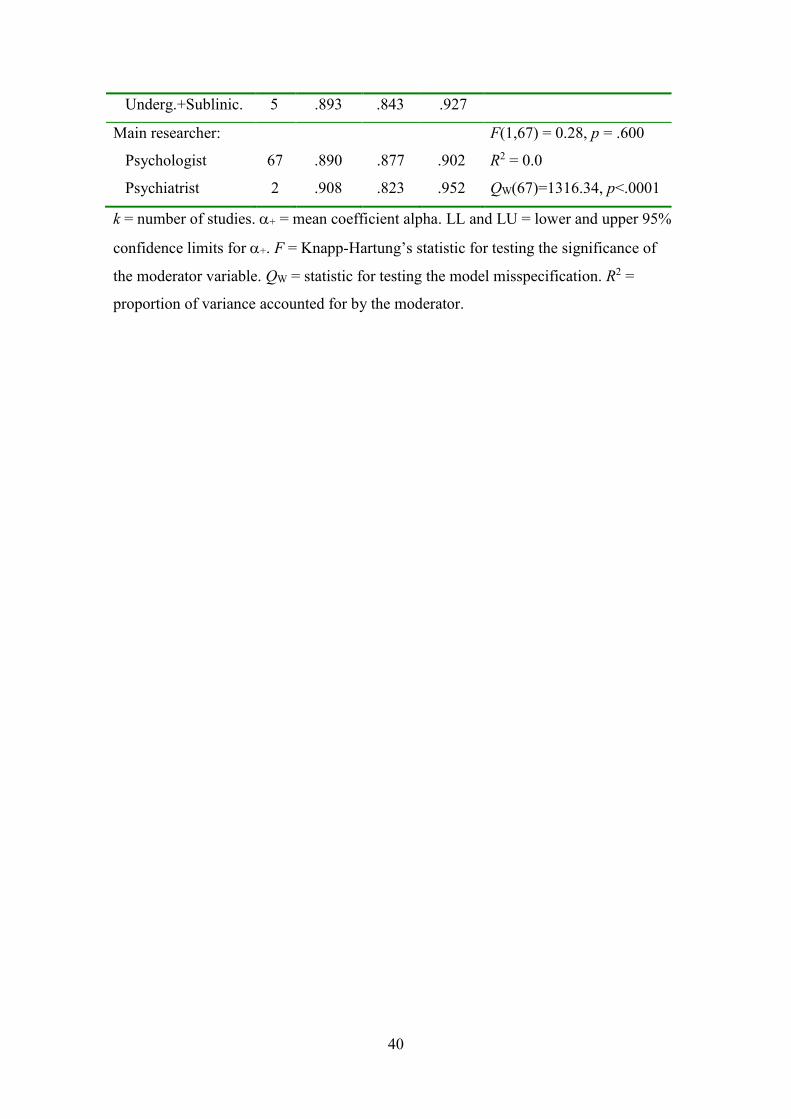
Table 4. Results of the weighted ANOVAs applied on coefficient alphas for the
Contamination Obsessions and Washing Compulsions (COWC) subscale score, taking
qualitative moderator variables as independent variables.
Variable
k
+
95% CI
ANOVA results LL LU
Test version:
Original (English)
German
Spanish
Icelandic
Turkish
Iranian
Dutch
57
2
1
6
2
1
1
.893
.930
.670
.879
.901
.860
.880
.879
.867
.211
.824
.813
.663
.692
.905
.963
.862
.916
.948
.942
.953
F(6,63) = 1.54, p = .181
R2 = .07
QW(63)=938.03, p<.0001
Test version (dich.):
Original (English)
Other
57
13
.893
.881
.879
.846
.906
.908
F(1,68) = 0.53, p = .469
R2 = .0.0
QW(68)=1238.27, p<.0001
Study focus:
Psychometric
Applied
9
61
.892
.891
.854
.877
.920
.903
F(1,68) = 0.01, p = .947
R2 = 0.0
QW(68)=1211.40, p<.0001
Psychometric focus:
PI-WSUR
Other
3
6
.893
.892
.782
.820
.947
.935
F(1,7) = 0.00, p = .979
R2 = 0.0
QW(7)=226.63, p<.0001
Continent:
Europe
N. America
Australia
Asia
11
51
5
3
.879
.893
.892
.889
.839
.878
.834
.809
.909
.907
.929
.935
F(3,66) = 0.22, p = .883
R2 = 0.0
QW(66)=1238.25, p<.0001
Target population:
Community
Undergraduate
Subclinical
Clinical
11
48
3
3
.860
.895
.799
.951
.821
.881
.658
.921
.891
.907
.882
.966
F(4,65) = 5.22, p = .001
R2 = .23
QW(65)=1049.67, p<.0001
40
Underg.+Sublinic. 5 .893 .843 .927
Main researcher:
Psychologist
Psychiatrist
67
2
.890
.908
.877
.823
.902
.952
F(1,67) = 0.28, p = .600
R2 = 0.0
QW(67)=1316.34, p<.0001
k = number of studies. + = mean coefficient alpha. LL and LU = lower and upper 95%
confidence limits for +. F = Knapp-Hartung’s statistic for testing the significance of
the moderator variable. QW = statistic for testing the model misspecification. R2 =
proportion of variance accounted for by the moderator.