The Ownership and Industry Effects of Corporate Dividend ...Keywords: Dividend Policy, Indian...
36
Munich Personal RePEc Archive The Ownership and Industry Effects of Corporate Dividend Policy in India, 1961-2007 Kamat, Manoj S. Indian Institute of Technology Bombay 5 January 2009 Online at https://mpra.ub.uni-muenchen.de/12545/ MPRA Paper No. 12545, posted 06 Jan 2009 09:09 UTC
Transcript of The Ownership and Industry Effects of Corporate Dividend ...Keywords: Dividend Policy, Indian...

Munich Personal RePEc Archive
The Ownership and Industry Effects of
Corporate Dividend Policy in India,
1961-2007
Kamat, Manoj S.
Indian Institute of Technology Bombay
5 January 2009
Online at https://mpra.ub.uni-muenchen.de/12545/
MPRA Paper No. 12545, posted 06 Jan 2009 09:09 UTC

1
The Ownership and Industry Effects of
Corporate Dividend Policy in India, 1961-2007
Dr. Manoj Subhash Kamat*
December 2008
Abstract
The cross-sectional trends in dividends are investigated at an aggregate level of ownership
(i.e. closely/largely held and regulated firms), and at disaggregate level across 20 industries to
examine how Indian Private Corporate Sector appropriated its profits over 1961-2007 periods.
Alternatively it is examined whether internal funds are a significant source of finance and the
dynamics of relation between dividends relative to earnings across type of companies and
industries. Indian corporate sector pays relatively more equity dividends than preference
dividends. Other things being equal, the probability of paying cash dividends decreases with
share holder concentration and the regulated companies pay relatively larger dividends.
Dividend payouts for all type of firms decline, and such tendency is more pronounced after
liberalization periods indicating a greater choice of internal financing through retained
earnings. The analysis of inter-corporate and inter-industry variations reveals that dividends
interplays differently with exogenous factors.
Keywords: Dividend Policy, Indian Private Corporate Sector, Public and Private Limited
Companies, Regulated Industry, Ownership Effect, Industry Cross-section.
* Dr. Manoj S. Kamat is a Ph.D. in Financial Economics from Indian Institute of Technology Bombay and
currently serves as Faculty at VVM’s Shree Damodar College of Commerce and Economics, Margao-Goa.
Correspondence can be addressed at [email protected]

2
The Ownership and Industry Effects of
Corporate Dividend Policy in India, 1961-2007
The dividend policy decision is regarded to be complex having implications for
economy (macro level) and firm (micro level), as well. At the macro level it helps in
formulating appropriate policies for achieving the national aggregate savings and sectoral
distribution of those savings keeping in view the priorities of national credit plans as per
Bhole (1980) and at the firm level, are crucial in taking investment and financial decisions
according to Aurebach (1982), Mahapatra (1996), and Benito and Young (2001). The
relationship between type of ownership and nature of industry the firm represents sector
membership with their capital structures and dividend policies have received considerable
attention in literature. The type of industry and sector in which a firm operates is likely to
have a significant effect on its financing and dividend behavior. Harris and Raviv (1991) state
that firms in a given industry have similar proportions of individual assets and liabilities while
studies by Bowen et. al., (1982), Bradley et. al., (1984) and Kester (1986) find that specific
industries have common financial characteristics and are relatively stable over time.
Richardson et. al., (2002) on the other hand confirm that the industry affiliation is a strong
determinant of corporate cash holdings, acquisitions, R&D, capital expenditures, leverage,
dividends and share repurchase policy.
The prior research on relationship between industry and dividend policies are mostly
focused on dividend behavior of public limited and non-financial corporations with reference
to developed capital markets alone. Similar work analyzing variation of dividends across
industry groups and over time in the emerging market context is rare. Present study is an
attempt to fill the gap and investigates empirically cross-sectional trends and specific shifts in
corporate dividend patterns in India over the last four decades. The evidence and plausible
explanations of changing dividend behavior and their earnings at an aggregate ownership; i.e.
closely / largely held and regulated firms, and at disaggregate (PLCs across 20 industries)
level are presented. Specifically it is looked at the extent to which a firm’s observed dividend
policy is similar to others across ownership types (Public Limited, Private Limited and
Finance / Investment Companies in India, hereafter referred to as PLCs, PVLCs and FINCs
respectively). The behaviors of PLCs have been subject to further analysis by classifying
them into 20 industries to identify possible sources of variations. The focus is on providing

3
extensive cross-sectional description on how Indian corporate sector firms in general have
appropriated their profits over the period 1960-61 through 2006-2007 periods. Alternatively it
is examined whether internal funds are a significant source of finance. Also a look is taken at
the relationship between dividend payments to equity and preference share holders relative to
earnings across firms. A cross-sectional time-trend analysis is conducted to specifically
answer the following questions; Does the trend in cash dividend payments differ across
Public, Private and Investment companies? What are the variations over period of time and
specifically after the post-reform periods? Which corporate type (industry) has higher payouts
and earnings? Whether they retain their relative position over time and does the analysis of
the dividend payment support the pecking order and the dividend smoothening hypothesis?
This remainder of the chapter is organized as follows. Section 1 describes the data and
specifies time-trend models. Results and interpretations of the analysis are presented in
section 2 whereas, section 3 concludes.
1. Data and Model Specifications
For purpose of analysis the data from Reserve Bank of India (RBI), emerging from two
different dataset compilations namely the published data compendium by on the ‘Private
Corporate Business Sector in India - Selected Financial Statistics from 1950-51 to 1997-98
(All Industries)’, and published compendium on ‘Selected Financial Statistics on Public
Limited Companies 1974-75 to 1999-2007 (Selected Industries)’ consisting of industry level
data respectively. In order to determine the differences in cash dividend and earnings behavior
of the (PLCs), private limited (PVLCs) and finance companies (FINCs), we use the former
source consisting data from 1950-51 to 1997-98 and various issues of the RBI bulletins to
cover data for the balance periods on above three sub-sectors, at an all industry level. The
average number of firms in sample, along with study year from which they are drawn is
appended in table 1 (in Appendix). The cash dividend behavior relating PLCs, PVLCs, and
the FINCs for all firms in dataset and the time period under consideration is forty-three years,
1961 through 2007 whereas the industry effects relating PLCs are analyzed for all the firms in
the dataset for twenty-five years, 1976 through 2007. We divide the entire time-period into
pre-reform period: 1961-1992 and 1976-1992 and the post- reform period 1993-2007 and
1993-2007 respectively, to capture the effect of policy break on the dividend decisions of
firms. For the purpose of analysis of trends we consider only cash dividends (total dividends).

4
The variable size of earnings (SZEAR) is defined as total net profit after taxes after
accounting for preference dividends is used as the earnings measure for equity dividends
whereas profits after taxes (PAT) is the earnings measure for preference dividends. Both the
earnings measures represent the profits available for appropriation to the share holders and
preference holders respectively. Equity dividend payout ratio (EDPOR) and preference
dividend payout ratio (PDPOR) is therefore given by total equity dividend (EQDIV) and
preference dividend (PRFDIV) at the end of the year divided by SZEAR and PAT
respectively. The equity return (EQRET) and preference return (PRFRET) are a function of
respective dividends by the book value of the respective share capital, where the book value
of shares includes bonus shares and shares issued for consideration other than cash.
The descriptive statistical tools are primarily used for analyzing the cross-sectional
data. Annual sub-period averages across every five year period are computed to depict their
changing behavior of dividends in the pre/post-reform and the full period. In order to compare
the sub-group means across the cross section and over time we use non-parametric techniques
for they do not assume equal variances. The Shapiro-Wilk (S-W) and Levene’s Robust tests
are calculated to detect normality and homogeneity of variance respectively. S-W test
hypothesizes that the data are normally distributed, and a low significance value indicate that
the distribution of the data differs significantly from a normal. The Levene statistic tests
hypothesis of equality of variance of the dependent variable for groups defined by categorical
factor variables and is an alternative to the Bartlett test that is less sensitive to departures from
normality. This tests the null hypothesis of equality of variance of the dependent variable for
groups defined by categorical factor variables. In order to test whether two independent
samples (groups) come from the same population, Kolmogorov-Smirnov test (K-S statistic) is
used. The K-S test is based on the maximum absolute difference between the observed
cumulative distribution functions for both samples. When this difference is significantly large,
the two distributions are considered to be different. The Kruskal Wallis-H (KW-H) test for
several independent samples is used to detect the differences in distribution location, is an
extension of Mann-Whitney U test and a nonparametric alternative to one-way ANOVA. In the
KW-H test, the scores are ranked without regard to group membership. If the groups do not
differ, the mean ranks will be similar to each other. The instantaneous growth rate,
compounded annual growth rate (CAGR) and the linear trend are computed using semi-log
(log-lin) and Linear trend model respectively for the full time period, pre and post-
5
liberalization period are computed. The instantaneous (constant) growth and the CAGR’s is
given as as follows.
1 2ln
t tY t uβ β= + + ...…………………………….……………………..………………...…(1)
From equation 1 where the X variable is time, we compute the constant percentage over
the full period, (100. β2) rate of growth (if β2 > 0) or rate of decay (if β2 < 0) in the variable Y
and the CAGR, over time is computed as
= (ln β2 – 1) . 1 …………………………...……………………………..……………...…(2)
To test for structural stability of regression model break due liberalization, we use
simplest form of dummies to distinguish the pre-reform (pre-1992) and the post-reform (post
1993) period. This equation using the dummy variable approach unlike the Chow test
pinpoints the source(s) of difference the intercept or the slope, or both in the two periods as
under.
1 2 1 2ln ( )
i i i i i iY D X D X uα α β β= + + + + ………………………………………..………...…(3)
Where Xi and Yi records time and the independent variable under study respectively.
D1 equals one for observations in the pre-reform period and zero for observations in the post
reform period. 2
α is the differential intercept and 2β is the differential slope coefficient
indicating how much the slope coefficient of the first period differs from the slope coefficient
of the second period. The introduction of the dummy variable D in the multiplicative form (D
multiplied by X) enables to differentiate between slope coefficients of two periods.
Assuming that ( ) 0,i
E u = we obtain
2 1 21( 1, ) ( ) ( )i ii i
E Y D X Xα α β β= = + + + …………………………………………..……...…...(4)
11( 0, )i ii i
E Y D X Xα β= = + …………………………………………………………………..(5)
which are, respectively, the mean functions for pre-reform and post-reform periods and
can be used to test the following hypothesis: If the differential intercept coefficient 2
α is
significant, but differential slope coefficient 2
β is statistically insignificant we may at least
not reject the hypothesis that the two regressions have the same slope (the two regressions
differ only in the intercepts) that is, two regressions are parallel. If both, the differential
intercept 2α and the differential slope coefficient 2
β is statistically significant, indicates that
the two regressions are completely different, dissimilar. If differential intercept 2
α and
differential slope coefficient 2
β are insignificant, then both regressions are coincident and if
the differential intercept coefficient 2
α is statistically insignificant and 2
β is statistically

6
significant, we may accept the hypothesis that the two regressions have the same intercept that
is the two regressions are concurrent.
The time trend for the full period and for the pre-reform and the post–reform period
using dummies are computed using the following linear trend models respectively.
1 2t tY t uβ β= + + …………………………………………………………………………...(6)
1 2 2 2i i iY D t uα α β= + + + .........................................................................................................(7)
Where t is variable X representing the time period and Y is the variable under study. Di
equals 1 to represent the pre-liberalization period whereas equals 0 to represent the post-
liberalization period. Assuming that ( ) 0,iE u = we obtain the following mean functions for the
two periods as under
1 2 1( , 1) ( )i i i iE Y X D Xα α β= = + + …………………………………………………….….....…(8)
1 1( , 0)i i i iE Y X D Xα β= = + ………………………………………………...….…………...…(9)
2. Results and Interpretations
The results are presented in two parts, the Ownership and Regulated Industry effects
and secondly the Inter-and Intra-Industry effects. The former follows first.
2.1 Ownership and Regulated Industry Effect
The descriptive statistics across the PLCs, the PVLCs and FINCs relating the dividend
returns and dividend payout ratio over time are presented in table 2 and 3 respectively. For all
periods the average equity dividend return with a range of 7-14 % earned by equity holders is
twice that of preference holders, across all type of companies. However the variability in case
of preference return is lower in all quinquenniums indicating relatively higher stability
compared to equity return. Share holders of PLCs gained higher returns in post-reform
periods compared to the former. Across all type of companies, the equity and the preference
dividend returns in the post-reform period has declined compared to pre-reform periods. For
post-reform period the equity return for PLCs increase significantly by 7%. The equity and
preference return of PLCs followed by that of PVLCs and the highly regulated, FINCs are
largest across both sub-periods and also in the full period under study.
The comparative descriptive statistics of dividend payout percentages on similar lines
presented in table 3 reveal interesting facts. Over other two types of companies, FINCs pay
relatively a larger proportion of their respective earnings (75 and 6% of SZEAR and PAT
respectively) to their equity and preference holders in the entire period. This tendency remains

7
unchanged through the pre-reform and post-reform period as well. A positive effect aftermath
the structural break period is noted in FINCs payout decisions, as they significantly increase
their equity payout percentage by 145 %, from 55 to 135 % in the preceding sub-period.
Broadly in sub-period 1993-2007, conservative dividend payout policy is followed by the
Indian joint stock companies. The PLCs and the PVLCs following a conservative payout
policy indicate a greater choice of internal financing through retained earnings, thereby
significantly reducing their equity and preference dividend payouts after reform periods. Such
conservatism is more pronounced in the PVLCs in relation to PLCs as their equity payout
percentages decrease by 44 % compared to 20 %. Thus though Indian joint stock companies
(across closely-held as well as the widely-held firms) demonstrate the tendency of decreasing
dividends and such pattern is distinct in case of closely-held firms than their widely-held
counterparts. Specifically, the results suggest retention ratios of public and the private limited
companies have significantly improved aftermath reforms. Thus it may be safely said that the
private corporate sector has become adequately self reliant in respect of financing its own
need after reform periods, suggesting the tenets of the pecking order. Contrary, the regulated
firms (finance companies) demonstrate a relatively poor corporate savings performance in
India.
The results based on table 2 and 3 may hide substantial information, for inter-period
variations within 1993-2007 periods are not accounted for. The absolute average rupee value
of earnings available to equity and preference holder using five year data each commencing
1961 are therefore analyze. Table 4 reports that the SZEAR and PAT increase substantially in
all quinquenniums. It is also evident that the average rupee values of equity dividend paid by
the Indian joint stock companies’ increase consistently in each successive quinquenniums,
and preference dividends widely vary during the 1961-2007 period. Across all the three types
of companies, the PLCs and the PVLCs are found to make relatively large and (low)
aggregate nominal rupee equity dividend payments in full period, whereas on the preference
front larger absolute values of rupee dividends are paid by the FINCs, both in the post-1991
and the full period. The impressive average earning by PVLCs by 277% in last three year
period compared to preceding quinquennium is responsible for the aggregate averages for all
type of companies to exceed preceding quinquennium averages of total aggregate earnings of
Indian joint stock companies. But the absolute increase in the total average earnings of all
types of companies put together don’t translate in form of higher dividend payouts because of
decrease in equity dividend payout percentage by FINCs by 33% to 133%, from 200% in the

8
last sub-period compared to the preceding. Thus the aggregate equity payout percentage for
all three types of companies in the last sub-period fall by 12% compared to the preceding
quinquennium. This decrease in equity payout percent is contrary to the fact that the
individual average payout ratios of PLCs and PVLCs rise from 39 to 54% and 24 to 44% in
the sub-period 2001-2007 compared to that of 1996-2007 respectively. Thus it seems that
there are signs that tendency of decreasing dividends is reversing in case of PLCs and PVLCs
in recent periods, specifically in post-2007 periods.
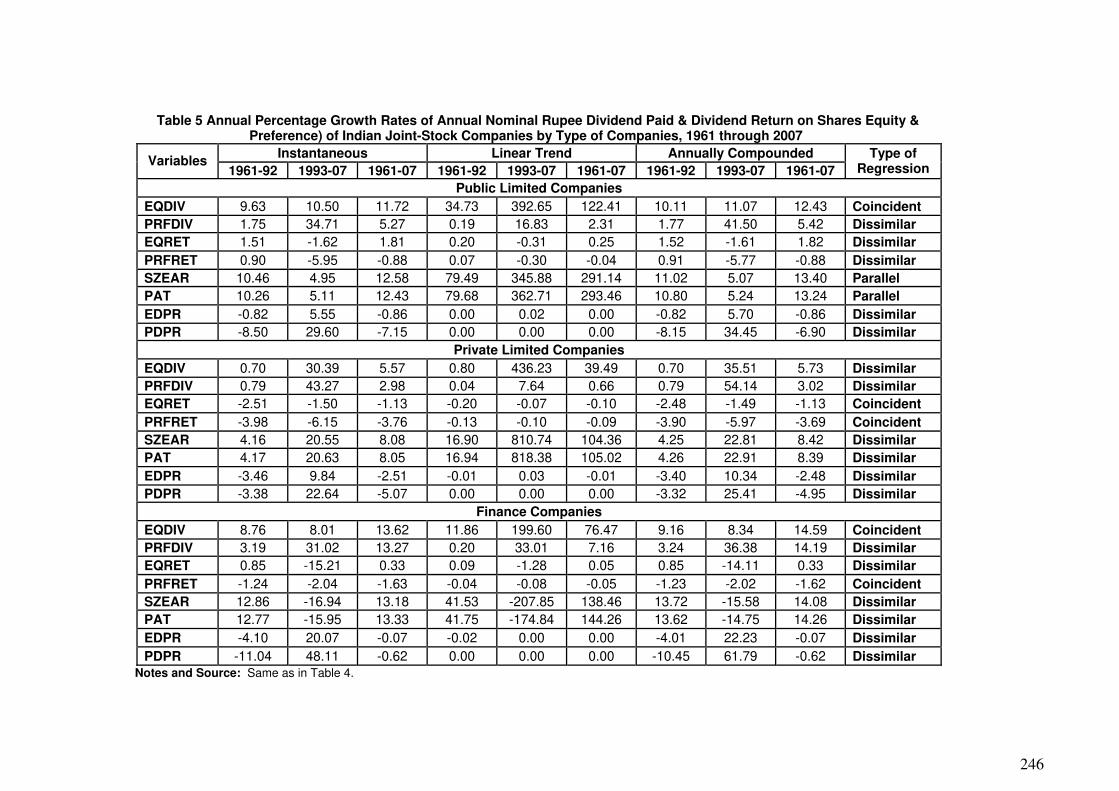
The instantaneous (constant) growth, the compound growth and the linear trend
through the pre-reform, post-reform, and the full period (1961-2007) are presented in table 5.
The instantaneous growth rate measures the growth in a given variable at a point in time,
CAGR over a period of time, whereas the linear trend model measures the sustained absolute
upward or downward movement in the behavior of a given variable. The annual growth rates
of the dividend return on shares (equity and preference) register a downward trend across all
types of companies in the post-reform period. Over the full period, the CAGR of rupee value
of equity dividend paid by FINCs larger (16%) than that of PLCs and PVLCs (12 and 6%),
and thus ranks highest in relative ranking in table 6. The CAGR of the rupee value of equity
dividends paid PVLCs significantly increase from 0.70 percentage points to 35% in the post-
reform period. Adopting the technique of dummy variable using a single regression model
over the Chow test we test whether the mean parameter of the dividend function has changed
in the two periods. We find that the differential intercept and the differential slope coefficient
are both statistically significant and may accept the hypothesis that the regressions for both
the periods are completely different (Dissimilar). Similarly, preference dividend payment of
the PVLCs also record a highest annual growth rate of 43% in the post-reform period
compared to the lowest growth rate it had in the pre-reform period. The growth rates of the
annual equity and preference dividend payout percentage growth rates appended in table 4
measured in constant and compounded terms are negative (indicating a rate of decay) in the
full period across all types of companies owing to the larger negative and statistical
significant growth coefficients in the pre-reform period. The same dividend payout
coefficients improve significantly in the post-reform period. FINCs for example, register the
largest relative CAGR in case of equity and preference dividend payout percentages
compared to other two types of companies, by recording an impressive 22 and 62% growth
after the structural break period from the rate of decay with 4 and 10% before the break,
respectively.

9
The relatively changing ranks across type of companies having highest (lowest)
dividend payments and dividend return in the same period are comparatively analyzed in table
6. The relative ranking show that PLCs continue to retain its position as highest dividend
payer and also yield the highest dividend return on equity and preference share across both
sub-periods (pre and post-reform period) and the entire period under consideration, but when
relatively ranked from highest to lowest across type of companies in terms of CAGR of equity
dividend payments, loose its rank to PVLCs and FINCs in the post-reform and the full period
respectively. The same table also reports relative ranks based on earnings available to equity
and preference holders and their dividend payout ratios across types of companies. It is
observed that the PLCs are relatively more profitable than the PVLCs and FINCs, but FINCs
continue to have larger average dividend payout percentages (equity and preference) in pre,
post-reform and the entire period with 78 and 6%, compared to 50 and 3% and 45 and 1.3%
each for PLCs and PVLCs respectively.
The results of Kruskal-Wallis (K-W) statistic in table 7 indicate that mostly dividend
related measures of Indian joint stock companies significantly differ (decrease) in the post-
reform periods compared to its preceding periods as indicated by the above mentioned
findings. All the results support general understanding that interest alignment between
different classes of owners influences corporate dividend policy in India. The evidence that
emerges from above discussion is in tandem with the fact that the dividend payments are
higher where there are dispersed outsiders with little leverage over the insiders as long as the
firm is in continuous need of equity capital and thus forces to them to return to the capital
markets. In general, firms with sizeable “outside” financing such as common equity are
subject to agency costs of managerial discretion and with no dominating share holders,
managers have incentives to use cash dividends to convey information about the firms’ future
performance.
The incentive to pay cash dividends declines as the shareholder concentration declines
and supports Agency Cost hypothesis which begun with the work of Donaldson (1961, 1963)
and Easterbrook (1984), suggesting dividends can help reduce the agency costs associated
with the separation of ownership and control which occurs in companies. When the ownership
of the company is highly diversified, individual investors have few incentives to control the
actions of managers and if they do so, results in high cost for the company. In such a
framework outsiders may prefer a high dividend policy with a view, better a dividend today
than a highly uncertain capital gain from questionable future investment. La Porta et. al.,

10
(2000) show that a closely held firm does not need to increase its dividend or take on more
debt to signal to insiders the higher quality of its earnings. In a similar study Yurtoglu (2000)
describes the main characteristics of ownership structure of the Turkish companies listed on
the Istanbul stock exchange and show that concentrated ownership and pyramidal structures
have a negative effect on performance. Kalay and Michaely (2000, 2002) argue that
asymmetric information and agency considerations are likely to be more severe in public
rather than private firms. For a privately held firm it would be easier to transmit information
through other vehicles, and easier to monitor managers, to prevent them from excessive
spending. Hence the consequences of reducing dividends may be more severe for public firms
and no difference is expected in case of financial firms. Public firms consequently are
reluctant to reduce dividends. For China, Lee and Xiao (2003) find share holding
concentration is positively associated with cash dividend paying decision, firms with high and
intermediate share holding concentration have about equal tendency of paying cash dividends,
but firms with low share holding concentration have much lower tendency of paying cash
dividends. The results for regulated industry are also in tandem with literature. It is argued
that the regulated firms give managers the incentive to pay higher dividends to force them to
raise funds more frequently in the capital market. This is probably since regulated firms are
more matured than the unregulated firms; managers have no much freedom to make them
grow as significant difference in percentage of common stock held by insiders. Studies like
that of Smith (1986) hypothesize that the regulated firms have a restricted growth prospects,
restricted geography, product market, earnings etc. and the regulators act as delegated
monitors of firm behavior, reducing considerably the wasteful investments engagements by
managers or private consumption of the available FCF leading to more dividend distribution.
Saxena (1999) finds that the mean DPRs for the regulated firms are larger than that of
unregulated firms as these firms are less risky, have lower growth rates, much few insiders’
holdings in its common stock and fewer investment opportunities. Regulation in case of such
firms effectively reduces the possibility for corporate under-investment simply by transferring
much of management’s discretion over investment’s decision to regulatory authorities.
Similarly, Barclay et. al,. (1995) notes that the regulated industries have higher leverage ratios
and pay higher dividends than unregulated corporations whereas, Collins et. al., (1996) also
find that the payout ratios for the financial firms and utilities are significantly larger than that
for unregulated sample firms.

11
2.2 Inter and Intra-Industry Effects
The annual sub-period averages of amount of nominal rupee dividend distributed and
dividend percentage return on the book value of shares (both equity and preference) across 20
industries over 1976 through 2007 period are appended in table 8. Across the industry cross-
section, annual averages of nominal rupee value of dividend are calculated for every five year
period commencing 1976. The total rupee of average equity and preference dividends in first
sub-period (1976-1980) is the lowest, pick up successively to record highest payments in last
quinquenniums (1996-2007) amounting to Rs.2,97,729.79 and Rs.7066.77 lakh, but
quinquenniums 1991-1995 and 1996-2007 register a higher growth compared to other sub-
periods respectively. This evidence give a clear impression that the in absolute terms, the
dividend payments effected by select industries mark a significant rise in recent years. The
behavior of equity and preference return however, is contrary to the pattern we notice above.
The total average value of the equity and preference return is at its highest during the period
1981-85, at 19.20 and 8.34% and decreases to 16.39 and 6.59% till the last (1996-2007)
quinquenniums respectively.
The annual sub-period averages of the amount of nominal rupee earnings available for
repatriation as dividends and dividend payout percentages for 1976 through 2007 period are
appended in table 9. The average nominal rupee earning measures of the select 20 industries
available to equity holders and preference holders (SZEAR and PAT) consistently increase
from the first quinquennium (1991-1995) to their highest levels in 1996-2007, and higher
growth in the level of earnings is witnessed in sub-period 1991-95. Except for Jute, and
Foundries, all industries record a massive spurt in their relative earnings over the time
variable. The Jute industry faces the problem of increasing un-competitiveness, and SZEAR
and PAT variable measuring earnings attributable to the equity and preference holders carry a
negative sign through all quinquenniums. The firms affiliated to foundries segment report
losses in the last quinquennium. Both these industries also remain as lone exceptions
reporting aggregate losses in the post-reform period compared to former period. The average
equity dividend payout ratios depict a constantly decreasing tendency over the entire period
except for the third sub-period, 1986-1990. All firms in the select industries sample have
significantly higher payouts exceeding 100 percentages in the quinquenniums 1979-80 and
1986-90 respectively and register a decline up to 46.83% in the last sub-period, 1996-2007. In
the entire period, Cement and Jute industry record the largest and the lowest dividend payout

12
ratio of 296 and 3.86% respectively whereas; the Shipping and the Jute industry have the
largest (170%) and the lowest (8.45%) payout in the pre and post-reform periods respectively.
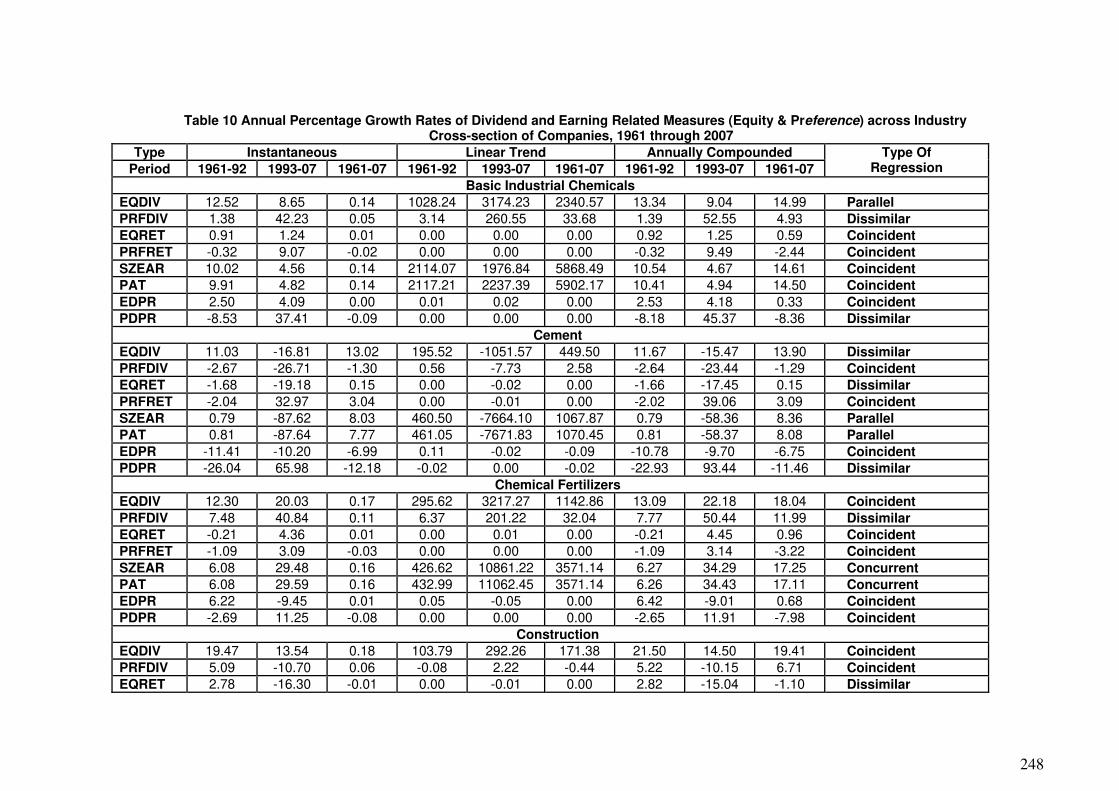
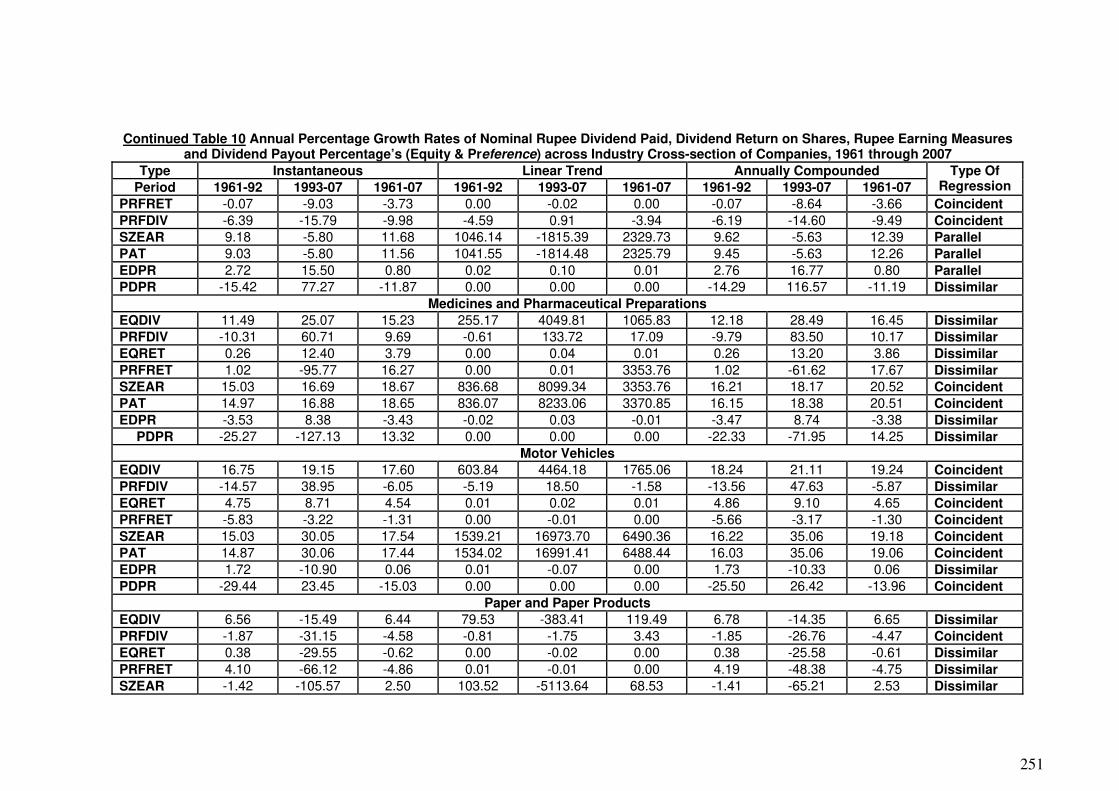
The annual percentage growth rates of dividend, earnings, return and payout
percentages across industry classification are presented in table 10, whereas appended tables
11 and 12 summarizes the changing ranks based on absolute values and CAGR of annual
nominal rupee dividends paid and dividend return on shares. The Basic chemical industry by
nature pays the highest rupee value of equity and preference dividend in both the pre and
post-reform and over the entire period 1976-2007, as well. In fact in the sub-period 1995-
2007, this industry pays 17.47 and 15.12% of the total equity and preference dividends, paid
by all select industries put together. Other capital intensive industries like that of Motor
vehicles, Machinery, and Fertilizers follow in a decreasing order, larger equity dividend
payments and more or less maintain similar ranks in the pre, post-reform and the full period.
Table 11 and 12 also highlights the significant inter-period differences in the composition in
the ranks of highest and lowest payers across industry classifications. The traditional
industries producing consumer goods like Cotton, Tea and Rubber, loose their ranks as the
second largest, sixth and tenth largest equity dividend payers in the pre-reform period to
twelfth, eleventh and fifteenth position in the post-reform period respectively whereas, the
firms affiliated to large sized and capital intensive industries like that of Electricity and
Foundries significantly improve their relative positions as highest dividend payers, from
fifteenth and fourteenth highest ranks in the pre-reform period to ninth and eight rank as the
highest dividend payers in post-reform period respectively. The Fertilizer, Electricity, Silk
and Cotton industry in the order follow the basic chemical as the largest preference dividend
payers. In the full period under study, table 12 reveals that industries like that of Construction,
Rubber and Medicine reporting high compounded annual growth in their respective earnings
follow low dividend payout ratios whereas those in Jute, and Shipping sector that are lowest
in the order of growth in their earnings have larger dividend payout ratios indicating dividend
payments are negative associated with their growth in line with the evidence of Friend and
Puckett (1964).
The firms affiliated to industries involved in Production / Distribution of consumer
goods like that Sugar, Paper and the Trading industries besides Jute and Construction are
relatively least equity dividend payers. On the preference dividend front, the Tea, Jute,
Construction, Shipping and Motor industry in an order, relatively pay the lowest. The Basic
Chemical industry continues to report relatively larger rupee value of earnings attributable to

13
both, equity and preference shareholders in the pre and post reform, and the entire period
1976-2007 as well. In the sub-period 1995-2007, the Chemical Industry earns an average of
16.93% of the total average earnings put together by all select industries. This explains the
tendency to pay larger dividends. Other large and capital-Intensive industries like that of
Motor vehicles, Fertilizers, Medicines and Other machineries follow the Basic Chemical
industry in that decreasing order and more or less maintain similar ranks in the pre, post-
reform and the full period. The size of earnings, as a measure attributable to equity holders of
the capital intensive industries like Cement and Fertilizers significantly improve their ranks as
highest relative earners as the ninth and third largest in the post-reform period from
seventeenth and ninth largest earning position in the pre-reform period. Whereas, the
traditional industries like Foundries and Tea loose their importance as they drop their position
as thirteenth and fourth largest earners in the pre-reform period to nineteenth and tenth largest
position in the post- reform period respectively.
Significant inter-industry differences in the composition in the ranks with regards to
highest and lowest payout percentages are evident. It is experienced that the traditional
industries have higher payouts in the entire period. Firms affiliated to industries like Cotton,
Cement, Ferrous/non-ferrous metal, Rubber, paper, Silk and Construction in a decreasing
order top the equity payout percentage list with an average payout range of 82 to 200% in the
entire period; largely attributable to the high payouts made in the pre-reform periods.
However, drastic variations in the pre and post-reform period are experienced by the Cement,
Construction, Paper, Rubber and Silk industries, for they significantly drop their payout
percentages in the post-reform period inspite of average improvements in their earnings in the
same period. The Cement industry for instance, enjoying the position as the first largest
payout industry, relative to all select industries considerably decreases its payout ratio in the
post-1991 periods to become an industry with 16th
largest payout in the post-reform period
despite improving its earnings from relatively 17th
to 9th
largest earner position.
On the other hand industries like Cotton, Metal and Other machinery pay relatively
larger proportion of their earnings as dividends in the post-reform period, inspite of relative
fall in their earnings and thus their payouts smooth earnings. Firms belonging to Jute,
Electricity, Trading, Motor and Medicines in a decreasing order, pay relatively smaller
portion of their earnings as equity dividends. The behavior of Jute industry can be directly
correlated with the fragile earnings they report. The Jute industry which stands at the bottom
end of the earnings list reporting significant increase in losses is also at the bottom end of the

14
list of industries with lowest dividend payout percentages. The dividend payouts of industries
like basic chemicals, motor, medicines, other machinery and electricity generation / supply
don’t follow their respective earnings, for they in nature highly capital intensive and have
higher investment avenues to and growth opportunities, thereby displaying their preference
towards internally financing their growth requirements.
In the entire period, the shareholders belonging to Silk and Jute industry earn highest
and the lowest average dividend return of 45 and 2.42% and 16 and 3.67% on equity and
preference shares respectively. Drastic variations in the pre and post-reform period with
regards to dividend return are experienced by share holders of Silk, Tea and Rubber
industries. The average percentage equity dividend return drops by 46%, from 64 to 17,
whereas it increases by 20% from 20.75 to 40.77% in case of silk and tea industry. On the
preference front the shareholders of Silk industry shed its average return by 15% whereas of
the Rubber industry gain by 11% in the post 1991 in relation to the pre-1991 periods.
In post-reform periods compared to the former, the K-W statistics reported in table 13
indicates that decrease in means of various dividend related variables for the select industries
under study are sizeable and significant. Overall results imply the changing (decreasing)
pattern of dividend behaviour across the inter and intra-industry cross-section during the study
periods. The present study on ownership and industry effects of dividends suggests that the
aggregate data at corporate sector level provide a useful and interesting perspective on the
sectoral differences in dividend policies and their relationship with other earning variables,
but masks many of the industry-specific behavior dominating dividend decisions. To capture
such effects, we look at the dividend behavior of individual industries in which the firm
operates. It is found that the dividend policies followed by the regulated industry are
significantly larger then the un-regulated private and public firms. Further, the dividend
payments are higher where there are dispersed outsiders and the incentive to pay cash
dividends therefore declines as the shareholder concentration declines. Dividend policies of
Indian firms respond to informational asymmetries, agency costs, and the institutional and
contracting environment it is in. Firms systematically differ across industry class so far as
their earnings management is concerned. We find that industries with higher reported
compounded growth in the earnings pay fewer dividends, firms in capital intensive industry
pay more while those in the production / distribution sector pay fewer dividends. Though
differences is firm size contributes to the existing variations in nominal dividend and dividend
related ratio’s across industry-classes, to some extent it is the stage of maturity or more

15
precisely the differences in the corporate type, the industry size, their technology / labour
orientation, need for cash, fragility of earnings and the general economic trends specific to
industry-class contributes to the existing variation in dividend policies, but nature of the
industry seems to dominate largely. The overall evidence also signals that there exists some
linkage between the product and the capital market.
3. Summary and Findings
The Indian corporate sector pays relatively more equity dividends then preference
dividends, and the average equity dividend return earned by equity holders is twice that of
preference holders. Other things being equal, the probability of paying cash dividends
decreases with the share holder concentration in India. Across all the three types of
companies, the widely-held firms pay the largest and the closely-held firms relatively lower
aggregate nominal rupee equity dividend payments in the pre/post- reform and the full period.
Private companies (closely held) are characterized by higher shareholding concentration
compared to public limited companies, and other things being equal the probability of paying
cash dividends, dividend returns and payout ratio decreases with shareholder concentration.
Most studies exclude regulated companies intentionally with a notion that their
regulatory status may affect their dividend policies. We include financial companies as a
proxy to study regulated industry effect and find that they pay relatively a larger proportion of
their respective earnings to their equity and preference holders in the entire period. This
tendency remains unchanged through the pre-reform and the post-reform period, as well and
is consistent with the limited evidence we review. The absolute average rupee earnings
available to equity holders and to preference-holders increase commencing 1961-2007 and
earnings drastically increase in the post 1991 sub-period and this growth and clearly translate
in higher growth of absolute dividends by private limited companies and finance companies in
the post-reform and the full period respectively. The dividend policies follow wider patterns
over time. The average dividend payout ratios for all type of companies decline incase of
closely held as well as the widely held firms as well but fall is more pronounced in case of
closely held firms, after the liberalization period indicating a greater choice of internal
financing through retained earnings.
The Chemical Industry in India precedes other industries in terms of nominal rupee
value of reported size of earnings and dividend payments. Other capital-intensive industries
like that of Motor vehicles, Machinery, Silk and Fertilizers follow in a decreasing order,

16
larger equity dividend payments and more or less maintain similar ranks in the pre, post-
reform and the full period. The firms in production/distribution of consumer goods like that of
jute, sugar construction, paper and the trading industries are relatively bad equity dividend
payers. In the entire period, the shareholders belonging to silk and (jute industry) earn highest
and the (lowest) average dividend return on equity and preference shares respectively.
The dividend payment across/within industry exhibits significant variations over the
sub-periods. The traditional industries like Cotton, Tea and Rubber pay relatively less
nominal rupee value of equity dividend in the post-reform period whereas the firms affiliated
to capital intensive industries like that of Electricity and Foundries significantly improve their
relative positions as larger dividend payers in the post-reform period. Drastic variations in the
pre and post-reform period with regards to dividend return are experienced by share holders
of silk, tea and rubber industries. Incidentally, the industries making to the top the list of
highest earners are eventually the largest payers. Large industries like cement and fertilizers
significantly improve their ranks as highest relative earners in post-reform whereas,
traditional industries like Foundries and Tea loose their importance as they drop their position
as largest earners. The evidence in respect of dividend smoothening behavior by industry
cross-section is mixed. The dividend payouts of industries like Basic Chemicals, Motor,
Medicines, Other machinery and Electricity generation / supply don’t follow their respective
earnings, for they in nature highly capital intensive, and have higher investment and growth
opportunities, thereby displaying their preference towards internally financing their growth
requirements whereas, Cotton, Metal, and Other machinery pay relatively larger proportion of
their earnings as dividends in the post-reform period, despite of relative fall in their earnings,
and thus their payouts smooth earnings. In accordance with Zeckhauser and Pound (1990)
industries differ with respect to maturity and information opacity, thus the degree of free cash
flow problems and, consequently as Moh’d et. al., (1995) prove empirically, payout ratios are
likely to vary considerably across sectors.
More specifically, on analysis of inter-corporate and inter-industry variations in
dividend policy for India it is found that dividends interplay differently with exogenous
factors. It the differences in ownership concentration, external fund requirement based on
technology, the type of the product they manufacture, the presence of growth opportunities
via internal financing and the future earnings flows that they expect to generate, differences
the inter-corporate, inter-industry variations in dividend policies. One important observation
through the analysis on systematic cross-sectional pattern over a longer period of time is

17
worth re-mentioning. The average dividend payout ratios for all type of companies (closely-
held, widely-held firms, and across industry cross-section) decline and such a tendency is
more pronounced after the liberalization periods. Though this finding is based on aggregate
level data the results are captivating and are in tandem with the recent evidence documenting
dividend payments are disappearing, the world-over.
References Auerbach, A. J., (1982), “Issues in the Measurement and Encouragement of Business
Saving”, Saving and Government Policy, Federal Reserve Bank of Boston: FRBB.
Barclay, M. J., C. W. Smith, and R. L. Watts, (1995), “Determinants of Corporate Leverage
and Dividend Policy”, Journal of Applied Corporate Finance, Vol. 7.
Benito, A., and G. Young, (2001), “Hard Times or Great Expectations: Dividend Omissions
and Dividend Cuts by UK Firms”, Bank of England Working Paper, London.
Bhole, L. M., (1980), “Deductibility of Interest Cost, Retention of Profits and Development of
Stock Market; A Comment”, Economic & Political Weekly, July Vol. 15, No. 29, pp. 1237-
1240.
Bowen, R.M., L.A. Daley, and C.C. Huber, Jr., (1982), “Evidence on the Existence and
Determinants of Inter-Industry Leverage Differences”, Financial Management, Vol.11, pp.10-
20.
Bradley, M., G. Jarrell, and E. H. Kim, (1984), “On the Existence of an Optimal Capital
Structure: Theory and Evidence”, Journal of Finance, Vol. 39, July, pp. 857-878.
Collins, M. C., A. K. Saxena, and J. W. Wansley, (1996), “The Role of Insiders and Dividend
Policy: A Comparison of Regulated and Unregulated Firms”, Journal of Financial and
Strategic Decisions, Vol. 9(2).
Donaldson, G., (1961), “Corporate Debt Capacity”, Harvard: Harvard University Press.
Donaldson, G., (1963), “Financial Goals: Management v/s Stockholders”, Harvard Business
Review, Vol. 41, pp. 116-129.
Easterbrook, F. H., (1984), “Market Rationality and Dividend Announcements: Two Agency-
Cost Explanations of Dividends”, American Economic Review, Vol. 74.
Harris, M., and A. Raviv, (1991), “The Theory of Capital Structure”, Journal of Finance, Vol.
49, pp. 297-355.
Kester, W., (1986), “Capital and Ownership Structure: A Comparison of United States and
Japanese Manufacturing Corporations”, Financial Management, Vol. 15, pp. 5-6.

18
LaPorta, R., F. L. Silanes, A. Shleifer, and R.Vishny, (2000), “Agency Problems and
Dividend Policy around the World”, Journal of Finance, Vol. 16.
Lee, C. J., and X. Xiao, (2003), “Cash Dividends in China: Liquidating, Expropriation and
Earnings Management”, Tulane University Working Paper, New Orleans.
Mahapatra, R. P., (1996), “On the Savings Behavior of General Engineering Industry”,
Abhigyan , Autumn.
Moh’d, M. A., Perry, L. G. and Rimbey, J. N., (1995), “An Investigation of the Dynamic
Relationship between Agency Theory and Dividend Policy”, Financial Review, Vol. 30, pp.
367-85.
Richardson, S, A. I. Tuna, and P D. Wysocki (2002) “Accounting for Taste: Board Member
Preferences and Firms’ Financial and Accounting Choices”, Wharton Working Paper,
Wharton University, (September).
Saxena, A. K., (1999), “Determinants of Dividend Policy: Regulated v/s Unregulated
Firms”, Financial Management Association Conference.
Smith, C. W. Jr., (1986), “Investment Banking and the Capital Acquisition Process”, Journal
of Financial Economics, Vol. 15, pp. 3-29.
Yurtoglu B. B., (2000) “Ownership, Control and Performance of Turkish Listed Firms”,
Empirica 27, pp. 193–222.
Zeckhauser, R. J., and J. Pound, (1990), ‘Are Large Shareholders Effective Monitors? An
Investigation of Share Ownership and Corporate Performance”, In Hubbard, R.G. (Ed.),
Asymmetric Information, Corporate Finance, and Investment, University of Chicago Press,
Chicago.

19
Appendix Table 1 Financial Year, Study Year and Number of Indian Joint-Stock Companies by Type of
Companies, 1961 through 2007
PLCs PVLCs FINCs Financial Year (Yr. ending) Study Year Number Study Year Number Study Year Number
1960-61 1333 501 1960-61 113
1961-62 1333 501 176
1962-63 1333 501 1962-63
176
1963-64 1333 501 194
1964-65 1333 501 1964-65
194
1965-66
1965-66
1333
1965-66
501 195
1966-67 1501 701 1966-67
195
1967-68 1501 701 219
1968-69 1501 701 1968-69
219
1969-70
1969-70
1501 701 220
1970-71 1650
1970-71
701 1970-71
220
1971-72 1650 1001 244
1972-73 1650 1001 1972-73
244
1973-74 1650 1001 261
1974-75 1650 1001 1974-75
261
1975-76
1975-76
1650
1975-76
1001 297
1976-77 1720 1011 297
1977-78 1720 1011
1977-78
297
1978-79 1720 1011 1978-79 299
1979-80 1720 1011 305
1980-81
1980-81
1720
1980-81
1011 1980-81
305
1981-82 1651 1004 307
1982-83 1982-83
1651 1982-83
1004 1982-83
307
1983-84 1838 1027 325
1984-85 1984-85
1838 1984-85
1027 1984-85
325
1985-86 1942 1096 400
1986-87 1986-87
1942 1986-87
1096 1986-87
400
1987-88 1885 1019 506
1988-89 1988-89
1885 1988-89
1019 1988-89
506
1989-90 2131 1096 411
1990-91 1990-91
2131 1990-91
1096 1990-91
411
1991-92 1802 1005 510
1992-93 1992-93
1802 1992-93
1005 1992-93
510
1993-94 1720 839 472
1994-95 1994-95
1720 1994-95
839 1994-95
472
1995-96 1930 853 705
1996-97 1996-97
1930 1996-97
853 1996-97
705
1997-98 1848 890 725
1998-99 1998-99
1848 1998-99
890 1998-99
725
1999-00 1927 1126 1024
2000-01 2000-01
1927 2000-01
1126 2000-01
1024
2001-02 2031 1338 957
2002-07 2002-07
2031 2002-07
1338 2002-07
957
Annual Sub-period Averages
1961-1992 1662 877 241
1992-2007 1883 1009 937
1961-2007
1719
911
434 Note: PLCs, PVLCs and FINCs refer to Indian Public Limited, Private Limited and Finance/Investment companies. Sources: a. Published compendium titled’Private Corporate Business Sector in India - Selected Financial Statistics from 1950-51 to 1997-98 (All Industries)’, 2001 and RBI Bulletins (Various Issues), Reserve Bank of India, Mumbai.

20
Table 2 Descriptive Statistics Relating Return and Payout Percentages by Indian Joint Stock Companies, Year Ending 1976-2007.
Equity Dividend Return Preference Dividend Return Statistics
PLCs PVLCs FINCs PLCs PVLCs FINCs
Pre-Reform period ( 1961-1992)
Mean 12.00 7.38 7.40 7.35 3.74 4.66
Median 11.52 6.79 7.12 7.09 3.44 4.84
St. Dev 2.48 2.52 2.21 1.10 1.43 0.90
Post-Reform period (1993-2007)
Mean 18.71 7.02 8.88 4.95 2.33 3.60
Med. 17.72 6.82 6.20 4.46 1.26 3.32
StDev. 2.39 1.70 4.62 1.72 2.39 1.72
Full period (1961-2007 )
Mean 13.72 7.29 7.78 6.73 3.38 4.36
Med. 12.60 6.82 7.02 6.93 3.18 4.79
StDev. 3.83 2.33 3.02 1.65 1.81 1.27 Source and Notes: Same as in Table 1.
Table 3 Descriptive Statistics Relating Payout Percentages by Indian Joint Stock Companies, Year Ending 1976-2007.
Equity Dividend Payout Ratio Preference Dividend Payout Ratio Statistics
PLCs PVLCs FINCs PLCs PVLCs FINCs
Pre-Reform period ( 1961-1992)
Mean 53.03 50.41 54.87 3.22 1.66 3.32
Med. 55.50 46.50 47.49 3.00 1.50 2.79
StDev. 13.20 42.45 21.89 2.11 1.66 2.26
Post-Reform period (1993-2007)
Mean 42.36 28.00 134.97 0.82 0.45 11.41
Med. 43.00 23.00 49.78 1.00 0.00 3.97
StDev. 12.43 13.01 222.49 0.75 0.52 18.61
Full period (1961-2007 )
Mean 50.30 44.67 75.36 2.60 1.35 5.66
Med. 51.00 35.00 49.22 2.00 1.00 3.01
StDev. 13.70 38.32 115.72 2.13 1.54 10.54 Source: Same as in Table 1.

245
Table 4 Annual Sub-period Averages of Nominal Rupee Dividend, Dividend Return, Earnings and Payout Ratios of Indian Joint-Stock Companies by Type of Companies (Public Limited , Private Limited and Finance Companies), 1961 through 2007
Year 1961-65 1966-70 1971-75 1976-80 1981-85 1986-90 1991-95 1996-00 2001-07
Public Limited Companies
EQDIV 76.77 100.42 143.50 221.49 368.35 787.47 2058.08 4301.20 5748.33
PRFDIV 7.75 9.36 11.94 13.46 13.57 12.62 9.38 103.80 131.67
EQRET 11.42 9.66 9.86 11.22 12.63 14.67 19.13 18.67 17.83
PRFRET 6.66 6.53 6.95 7.47 7.48 8.61 6.74 5.36 3.50
SZEAR 127.65 162.67 356.99 453.69 820.28 1422.47 6090.72 11496.60 11101.33
PAT 135.40 171.50 368.93 467.15 833.85 1435.09 6100.10 11600.40 11233.00
EDPR 60.20 62.60 42.20 52.40 46.00 61.00 36.20 39.40 54.33
PDPR 5.80 5.80 3.40 3.00 1.60 1.00 0.00 1.20 1.00
Private Limited Companies
EQDIV 109.18 82.94 94.46 118.46 107.04 106.86 243.02 476.84 3690.90
PRFDIV 2.68 2.60 3.30 3.86 4.62 4.26 2.36 10.88 62.60
EQRET 12.34 7.49 6.47 7.39 5.87 5.15 7.35 6.49 6.91
PRFRET 5.71 5.06 3.60 3.41 3.28 2.34 1.99 2.91 1.23
SZEAR 168.02 153.98 242.00 261.16 396.46 402.22 1337.62 2052.10 7733.23
PAT 170.70 156.58 245.30 265.02 401.08 406.48 1339.98 2062.98 7795.83
EDPR 64.80 54.20 44.60 53.80 28.40 70.80 17.60 23.80 43.67
PDPR 1.80 1.60 1.40 1.80 1.20 2.80 0.00 0.40 1.00
Finance Companies
EQDIV 26.32 34.32 35.58 46.18 71.86 217.06 1362.74 2743.94 3426.30
PRFDIV - 3.30 2.98 3.26 4.10 4.54 20.18 244.12 294.00
EQRET 7.52 7.28 6.53 5.33 6.36 8.71 14.53 8.00 4.38
PRFRET - 5.09 4.82 4.97 4.66 3.42 3.82 4.91 2.34
SZEAR 30.38 47.40 57.06 104.92 209.14 659.38 4844.84 4845.58 3794.03
PAT 30.38 50.70 60.04 108.18 213.24 663.92 4865.02 5089.70 4088.03
EDPR 88.54 72.61 62.34 44.77 37.84 33.62 28.73 199.80 133.06
PDPR - 6.58 4.97 3.21 2.15 0.79 0.43 14.13 17.91 Notes: EQDIV, PRFDIV, EQRET, PRFRET, SZEAR, PAT, EDPR, EDPR, and PDPR refers to Total Rupee value of cash equity dividend, Preference dividend, Equity return (dividends by the book value of the respective share capital), Preference return, Size of Earnings (net profit after taxes after accounting for preference dividends) as the earnings measure for equity dividend payments, Net profit after taxes as the earnings measure for preference dividend payments, Equity dividend payout ratio (dividend by respective measure of earnings) and Preference dividend payout ratio respectively. Source: Same as in Table 1.
246
Table 5 Annual Percentage Growth Rates of Annual Nominal Rupee Dividend Paid & Dividend Return on Shares Equity & Preference) of Indian Joint-Stock Companies by Type of Companies, 1961 through 2007
Instantaneous Linear Trend Annually Compounded Variables
1961-92 1993-07 1961-07 1961-92 1993-07 1961-07 1961-92 1993-07 1961-07
Type of Regression
Public Limited Companies
EQDIV 9.63 10.50 11.72 34.73 392.65 122.41 10.11 11.07 12.43 Coincident
PRFDIV 1.75 34.71 5.27 0.19 16.83 2.31 1.77 41.50 5.42 Dissimilar
EQRET 1.51 -1.62 1.81 0.20 -0.31 0.25 1.52 -1.61 1.82 Dissimilar
PRFRET 0.90 -5.95 -0.88 0.07 -0.30 -0.04 0.91 -5.77 -0.88 Dissimilar
SZEAR 10.46 4.95 12.58 79.49 345.88 291.14 11.02 5.07 13.40 Parallel
PAT 10.26 5.11 12.43 79.68 362.71 293.46 10.80 5.24 13.24 Parallel
EDPR -0.82 5.55 -0.86 0.00 0.02 0.00 -0.82 5.70 -0.86 Dissimilar
PDPR -8.50 29.60 -7.15 0.00 0.00 0.00 -8.15 34.45 -6.90 Dissimilar
Private Limited Companies
EQDIV 0.70 30.39 5.57 0.80 436.23 39.49 0.70 35.51 5.73 Dissimilar
PRFDIV 0.79 43.27 2.98 0.04 7.64 0.66 0.79 54.14 3.02 Dissimilar
EQRET -2.51 -1.50 -1.13 -0.20 -0.07 -0.10 -2.48 -1.49 -1.13 Coincident
PRFRET -3.98 -6.15 -3.76 -0.13 -0.10 -0.09 -3.90 -5.97 -3.69 Coincident
SZEAR 4.16 20.55 8.08 16.90 810.74 104.36 4.25 22.81 8.42 Dissimilar
PAT 4.17 20.63 8.05 16.94 818.38 105.02 4.26 22.91 8.39 Dissimilar
EDPR -3.46 9.84 -2.51 -0.01 0.03 -0.01 -3.40 10.34 -2.48 Dissimilar
PDPR -3.38 22.64 -5.07 0.00 0.00 0.00 -3.32 25.41 -4.95 Dissimilar
Finance Companies
EQDIV 8.76 8.01 13.62 11.86 199.60 76.47 9.16 8.34 14.59 Coincident
PRFDIV 3.19 31.02 13.27 0.20 33.01 7.16 3.24 36.38 14.19 Dissimilar
EQRET 0.85 -15.21 0.33 0.09 -1.28 0.05 0.85 -14.11 0.33 Dissimilar
PRFRET -1.24 -2.04 -1.63 -0.04 -0.08 -0.05 -1.23 -2.02 -1.62 Coincident
SZEAR 12.86 -16.94 13.18 41.53 -207.85 138.46 13.72 -15.58 14.08 Dissimilar
PAT 12.77 -15.95 13.33 41.75 -174.84 144.26 13.62 -14.75 14.26 Dissimilar
EDPR -4.10 20.07 -0.07 -0.02 0.00 0.00 -4.01 22.23 -0.07 Dissimilar
PDPR -11.04 48.11 -0.62 0.00 0.00 0.00 -10.45 61.79 -0.62 Dissimilar
Notes and Source: Same as in Table 4.

1
Table 6 Relative Ranks based on Absolute and CAGR of Equity and Preference Dividend Measures by Indian Joint Stock Companies, 1976-2007.
Period 1961-1992 1993-2007 1961-2007
Type PLC's PVLC's FINC's PLC's PVLC's FINC's PLC's PVLC's FINC's
Absolute Aggregate based Ranks
EQDIV 1 2 3 1 3 2 1 2 3
PRFDIV 1 2 3 2 3 1 1 3 2
EQRET 1 2 3 1 3 2 1 2 3
PRFRET 1 3 2 1 3 2 1 3 2
SZEAR 1 2 3 1 3 2 1 2 3
PAT 1 2 3 1 3 2 1 2 3
EDPOR 2 3 1 2 3 1 2 3 1
PDPOR 2 3 1 2 3 1 2 3 1
CAGR based Ranks
EQDIV 1 3 2 2 1 3 2 3 1
PRFDIV 2 3 1 2 1 3 2 3 1
EQRET 1 3 2 2 1 3 1 3 2
PRFRET 1 3 2 2 3 1 1 3 2
SZEAR 2 3 1 2 1 3 2 3 1
PAT 2 3 1 2 1 3 2 3 1
EDPOR 1 2 3 3 2 1 2 3 1
PDPOR 2 1 3 2 3 1 3 2 1
Note: 1=Highest, 3=Lowest Rank Source: Same as in Table 4.
Table 7 Results of K-W Test to detect Differences in Dividend Related Measures due to the Impact of Economic Reforms across Indian Joint Stock Companies.
K-W Stats. EQDIV PRFDIV EQRET PRFRET SZEAR PAT EDPR PDPR
Public Limited Companies
Chi-Square 24.00 5.47 20.34 12.30 23.73 23.73 5.34 12.89
Asymp. Sig. 0.00*** 0.02** 0.00*** 0.00*** 0.00*** 0.00*** 0.02** 0.00***
Private Limited Companies
Chi-Square 24.00 0.34 0.01 7.90 23.73 23.73 6.14 15.84
Asymp. Sig. 0.00*** 0.56 0.93 0.01*** 0.00*** 0.00*** 0.01*** 0.00***
Finance Companies
Chi-Square 24.00 22.27 0.00 5.00 13.91 14.97 0.75 0.14
Asymp. Sig. 0.00*** 0.00*** 0.86 0.03** 0.00*** 0.00*** 0.39 0.71 Note and Source: Same as in Table 4.

245
Table 8 Annual Sub-Period Averages of Nominal Dividend Distributed and Dividend Return across Industry Cross-section, 1976-2007
Industry Rupee Value of Equity & Preference Dividend Equity & Preference Dividend Return Percentages
Period 1976-80 1981-85 1986-90 1991-95 1996-00 1976-80 1981-85 1986-90 1991-95 1996-00
3479.80 5315.69 11077.89 27659.84 52002.00 13.58 13.30 15.02 13.80 16.00 Basic Chemical
263.00 226.84 300.51 190.78 1068.84 11.21 7.19 12.21 5.86 7.27
700.40 879.75 1536.34 8021.73 9192.27 11.52 10.57 8.74 15.48 13.23 Cement
34.80 72.05 27.32 63.42 160.77 5.65 12.58 4.43 9.31 7.00
1047.60 1016.61 3457.27 8002.17 26921.52 14.23 12.25 14.93 13.48 17.53 Fertilizers
104.40 61.80 187.58 130.71 826.37 13.28 6.01 17.49 7.06 8.33
117.80 242.44 822.01 1695.07 3909.37 10.10 14.02 12.96 13.41 8.24 Construction
7.00 39.84 2.08 0.00 17.55 10.05 8.77 2.46 0.00 1.60
1860.40 3446.72 5718.24 6045.92 8180.32 9.76 13.47 15.76 17.51 11.95 Cotton
97.20 59.01 113.44 33.88 595.06 5.40 3.39 7.91 3.69 5.07
394.20 862.55 1359.04 4236.05 16475.06 11.68 14.40 16.35 18.54 21.74 Electricity
57.20 79.56 56.70 44.27 906.20 8.28 8.03 7.00 3.98 6.97
1702.60 2970.02 3821.23 9792.17 20509.21 11.35 13.82 11.00 13.24 14.64 Electric Mach.
80.60 72.85 48.11 60.10 436.13 9.25 8.87 6.84 5.80 3.53
552.40 922.97 1687.93 3589.43 6272.12 7.19 8.39 10.15 12.66 10.56 Metal
34.80 45.66 56.13 16.53 165.25 6.43 6.60 9.51 4.06 3.39
360.40 599.95 1576.97 9836.62 8793.97 6.51 8.31 10.32 16.03 6.78 Foundry
33.80 23.51 44.75 43.95 316.20 6.24 4.62 8.16 4.66 6.09
68.00 39.90 45.51 174.02 55.65 3.23 1.77 1.80 4.11 1.19 Jute
27.60 11.08 6.63 15.17 1.37 4.83 2.30 2.30 8.60 0.33
1748.40 3281.26 5553.31 12131.52 20496.36 12.06 14.28 14.09 19.72 21.81 Other Machinery
113.60 86.83 60.17 37.66 50.95 9.04 7.40 7.70 9.22 2.73
1046.80 1801.10 3380.38 6959.21 24785.50 16.82 14.16 16.59 19.29 37.21 Medicines
13.00 11.46 9.81 4.75 516.78 5.22 6.18 8.80 1.73 15.13
1110.00 2715.87 5800.08 13619.77 40898.77 10.34 19.55 19.63 20.43 31.50 Motor
53.20 132.27 32.23 18.65 78.47 6.08 16.62 5.56 7.54 2.15
769.60 946.95 1383.31 3129.10 2818.52 10.06 7.61 7.33 16.15 7.60 Paper
70.40 59.52 45.93 53.24 193.49 6.78 5.75 6.44 15.07 7.32
500.60 737.56 1990.34 3978.84 4438.74 11.57 10.51 16.63 20.57 15.28 Rubber
5.60 6.16 88.41 26.24 235.16 5.28 2.85 20.74 9.13 32.06
Shipping 359.40 325.24 1128.27 4873.81 5956.30 8.00 4.88 8.27 19.40 13.42

246
Continued Table 8 Annual Sub-Period Averages of Nominal Dividend Distributed and Dividend Return across Industry Cross-section, 1976-2007
Industry Rupee Value of Equity & Preference Dividend Equity & Preference Dividend Return Percentages
Period 1976-80 1981-85 1986-90 1991-95 1996-00 1976-80 1981-85 1986-90 1991-95 1996-00
3.33 8.36 5.50 89.79 191.81 2.10 1.88 1.88 5.94 9.84
523.60 3800.15 1531.47 6520.99 30533.76 13.30 167.22 10.51 14.03 20.50 Silk
55.20 51.24 39.35 52.91 895.51 7.92 47.72 10.01 11.50 3.24
211.80 281.60 735.18 1347.11 2212.52 4.95 6.94 14.59 17.24 11.15 Sugar
19.40 28.16 27.92 30.88 256.07 3.71 7.32 10.20 10.89 7.39
720.20 1412.44 4773.41 8217.93 7742.84 15.72 16.09 30.44 44.19 37.34 Tea
10.40 7.34 9.10 5.11 27.70 7.08 5.96 6.89 8.51 1.81
451.40 804.41 1160.18 1905.21 5534.99 9.60 13.30 12.69 12.38 10.22 Trading
25.60 17.50 17.58 5.77 292.34 5.68 3.28 7.20 2.20 3.85 Source: Published compendium on ‘Selected Financial Statistics on Public Limited Companies 1974-75 to 1999-2007 (Selected Industries)’ and RBI Bulletins (Various Issues), Reserve Bank of India, Mumbai.
Table 9 Annual Sub-Period Averages of Rupee Earnings measure; Size of Earnings, Profits after Taxes and Dividend Payout
Percentage’s across Industry Cross-section, 1976-2007
Period Size of Earnings & Profits after Taxes Equity & Preference Dividend Payout Ratio
Industry 1976-80 1981-85 1986-90 1991-95 1996-00 1976-80 1981-85 1986-90 1991-95 1996-00
9074.20 12708.18 20227.25 76838.10 129418.38 38.23 43.43 63.69 39.17 43.11 Basic Chemical
9337.20 12935.02 20527.76 77028.88 130487.22 2.74 1.81 1.85 0.31 0.99
946.40 4479.02 -5724.27 30977.73 19491.87 99.30 155.55 632.31 27.52 30.28 Cement
981.20 4551.06 -5696.95 31041.16 19620.49 4.77 50.70 8.56 0.26 0.24
2692.00 4557.61 5074.74 20229.71 86468.62 41.78 25.41 115.51 50.70 31.35 Fertilizers
2796.40 4607.05 5262.32 20360.42 87294.99 4.47 1.11 4.62 1.01 0.99
285.00 1081.54 1324.17 5258.89 17109.63 82.88 24.04 238.40 37.45 24.66 Construction
290.60 1121.38 1325.42 5258.89 17116.65 6.07 2.64 0.92 0.00 0.05
2191.20 2996.03 1751.85 18871.21 4411.71 218.90 232.77 349.13 123.42 91.87 Cotton
2288.40 3055.03 1865.29 18905.10 5006.77 25.95 4.28 6.46 0.27 4.97
1119.00 4061.71 7457.26 18551.79 54878.13 35.60 25.06 19.33 21.55 31.78 Electricity
1176.20 4141.27 7513.96 18578.35 55784.33 4.86 2.82 0.85 0.20 1.50
3405.20 7005.60 5567.69 24988.36 53731.96 53.45 45.24 71.32 49.20 39.93 Electric Mach.
3485.80 7078.45 5615.80 25048.46 54168.09 2.78 1.06 0.92 0.46 0.93
798.20 1324.83 3729.79 7447.85 7334.47 534.52 63.99 51.45 58.27 119.69 Metal
833.00 1370.50 3785.92 7464.38 7499.71 82.37 3.03 2.19 0.35 8.84

247
Continued Table 9 Annual Sub-Period Averages of Rupee Earnings measure; Size of Earnings, Profits after Taxes and Dividend Payout Percentage’s across Industry Cross-section, 1976-2007
Period Size of Earnings & Profits after Taxes Equity & Preference Dividend Payout Ratio
Industry 1976-80 1981-85 1986-90 1991-95 1996-00 1976-80 1981-85 1986-90 1991-95 1996-00
689.80 1405.96 3927.73 26514.81 -22859.22 119.13 80.93 46.17 58.51 33.73 Foundry
723.60 1429.48 3972.48 26558.76 -22543.02 11.97 2.59 1.43 0.41 0.66
-268.20 -1541.50 -2891.82 -1854.50 -2338.17 6.96 2.61 2.00 13.01 3.88 Jute
-240.60 -1530.42 -2885.19 -1848.43 -2337.89 3.02 0.45 0.04 0.26 0.01
4564.40 8577.82 8013.43 40540.36 49016.71 38.25 39.29 76.67 31.88 62.86 Other Machinery
4678.00 8664.65 8073.60 40578.01 49057.47 2.49 1.03 0.95 0.12 0.07
1935.40 3323.49 8052.23 29237.79 72371.63 54.88 54.54 45.66 26.19 34.05 Medicines
1948.40 3334.95 8062.03 29239.69 72785.05 0.70 0.38 0.16 0.01 0.58
3449.00 10485.95 15241.34 42727.18 155038.70 33.21 26.25 41.09 48.74 26.93 Motor
3502.20 10618.22 15273.57 42745.83 155101.48 1.74 1.42 0.28 0.05 0.05
1434.60 -398.57 -1421.94 9687.04 843.14 79.11 427.14 85.28 34.61 19.14 Paper
1505.00 -339.05 -1376.00 9740.29 1036.63 6.71 1181.67 3.37 0.66 1.07
761.40 1481.08 5108.89 8754.92 16187.37 413.61 206.50 43.51 48.47 29.94 Rubber
767.00 1487.24 5197.30 8781.15 16375.50 5.09 1.91 1.83 0.29 0.93
-327.20 -2125.37 -2310.98 7205.53 5896.89 43.14 8.46 28.25 220.61 118.62 Shipping
32.20 -1800.13 -1182.71 12079.34 11853.19 0.50 0.06 0.03 6.88 12.20
1487.40 10428.64 2855.33 21190.38 71324.62 37.41 241.76 61.43 31.39 42.36 Silk
1542.60 10479.88 2894.68 21243.30 72220.13 3.72 9.43 1.62 0.32 1.83
-346.60 89.77 3220.00 5717.00 3840.72 92.38 44.08 23.29 95.51 77.39 Sugar
-327.20 117.93 3247.92 5747.87 4045.58 11.39 4.96 1.03 2.42 8.94
1574.80 3822.87 11492.66 16287.89 18166.07 49.41 92.07 44.89 53.25 49.77 Tea
1585.20 3830.21 11501.76 16291.97 18177.15 0.71 0.66 0.08 0.02 0.04
1069.60 2094.92 3947.69 8410.09 23955.18 43.54 39.11 30.41 24.14 25.20 Trading
1095.20 2112.42 3965.26 8415.86 24247.53 2.40 0.90 0.52 0.09 1.19
Notes: The values appearing across each industry are in two rows. The upper row represents the values for Size of Earnings and Equity Dividend payout ratio respectively and in the lower row represents Profit after Taxes and Preference Dividend Ratio respectively. Source: Same as in Table 8.
248
Table 10 Annual Percentage Growth Rates of Dividend and Earning Related Measures (Equity & Preference) across Industry Cross-section of Companies, 1961 through 2007
Type Instantaneous Linear Trend Annually Compounded
Period 1961-92 1993-07 1961-07 1961-92 1993-07 1961-07 1961-92 1993-07 1961-07
Type Of Regression
Basic Industrial Chemicals
EQDIV 12.52 8.65 0.14 1028.24 3174.23 2340.57 13.34 9.04 14.99 Parallel
PRFDIV 1.38 42.23 0.05 3.14 260.55 33.68 1.39 52.55 4.93 Dissimilar
EQRET 0.91 1.24 0.01 0.00 0.00 0.00 0.92 1.25 0.59 Coincident
PRFRET -0.32 9.07 -0.02 0.00 0.00 0.00 -0.32 9.49 -2.44 Coincident
SZEAR 10.02 4.56 0.14 2114.07 1976.84 5868.49 10.54 4.67 14.61 Coincident
PAT 9.91 4.82 0.14 2117.21 2237.39 5902.17 10.41 4.94 14.50 Coincident
EDPR 2.50 4.09 0.00 0.01 0.02 0.00 2.53 4.18 0.33 Coincident
PDPR -8.53 37.41 -0.09 0.00 0.00 0.00 -8.18 45.37 -8.36 Dissimilar
Cement
EQDIV 11.03 -16.81 13.02 195.52 -1051.57 449.50 11.67 -15.47 13.90 Dissimilar
PRFDIV -2.67 -26.71 -1.30 0.56 -7.73 2.58 -2.64 -23.44 -1.29 Coincident
EQRET -1.68 -19.18 0.15 0.00 -0.02 0.00 -1.66 -17.45 0.15 Dissimilar
PRFRET -2.04 32.97 3.04 0.00 -0.01 0.00 -2.02 39.06 3.09 Coincident
SZEAR 0.79 -87.62 8.03 460.50 -7664.10 1067.87 0.79 -58.36 8.36 Parallel
PAT 0.81 -87.64 7.77 461.05 -7671.83 1070.45 0.81 -58.37 8.08 Parallel
EDPR -11.41 -10.20 -6.99 0.11 -0.02 -0.09 -10.78 -9.70 -6.75 Coincident
PDPR -26.04 65.98 -12.18 -0.02 0.00 -0.02 -22.93 93.44 -11.46 Dissimilar
Chemical Fertilizers
EQDIV 12.30 20.03 0.17 295.62 3217.27 1142.86 13.09 22.18 18.04 Coincident
PRFDIV 7.48 40.84 0.11 6.37 201.22 32.04 7.77 50.44 11.99 Dissimilar
EQRET -0.21 4.36 0.01 0.00 0.01 0.00 -0.21 4.45 0.96 Coincident
PRFRET -1.09 3.09 -0.03 0.00 0.00 0.00 -1.09 3.14 -3.22 Coincident
SZEAR 6.08 29.48 0.16 426.62 10861.22 3571.14 6.27 34.29 17.25 Concurrent
PAT 6.08 29.59 0.16 432.99 11062.45 3571.14 6.26 34.43 17.11 Concurrent
EDPR 6.22 -9.45 0.01 0.05 -0.05 0.00 6.42 -9.01 0.68 Coincident
PDPR -2.69 11.25 -0.08 0.00 0.00 0.00 -2.65 11.91 -7.98 Coincident
Construction
EQDIV 19.47 13.54 0.18 103.79 292.26 171.38 21.50 14.50 19.41 Coincident
PRFDIV 5.09 -10.70 0.06 -0.08 2.22 -0.44 5.22 -10.15 6.71 Coincident
EQRET 2.78 -16.30 -0.01 0.00 -0.01 0.00 2.82 -15.04 -1.10 Dissimilar

249
Continued Table 10 Annual Percentage Growth Rates of Nominal Rupee Dividend Paid, Dividend Return on Shares, Rupee Earning Measures and Dividend Payout Percentage’s (Equity & Preference) across Industry Cross-section of Companies, 1961 through 2007
Type Instantaneous Linear Trend Annually Compounded
Period 1961-92 1993-07 1961-07 1961-92 1993-07 1961-07 1961-92 1993-07 1961-07
Type Of Regression
PRFRET 21.81 -103.28 0.18 -0.01 0.00 -0.02 24.36 -64.40 19.61 Dissimilar
SZEAR 11.95 20.05 0.20 171.45 1726.88 727.92 12.69 22.20 22.46 Coincident
PAT 11.87 20.06 0.20 171.37 1729.10 727.48 12.60 22.22 22.35 Coincident
EDPR 5.23 -6.51 -0.02 0.08 -0.02 -0.02 5.37 -6.30 -2.44 Coincident
PDPR 17.84 -149.68 0.17 0.00 0.00 0.00 19.53 -77.61 18.10 Dissimilar
Cotton / Blended Textiles
EQDIV 10.26 4.95 0.07 386.04 330.20 303.44 10.80 5.07 7.47 Coincident
PRFDIV -3.71 75.35 0.04 -0.50 156.79 20.08 -3.64 112.45 4.11 Dissimilar
EQRET 4.95 -11.76 0.01 0.01 -0.01 0.00 5.07 -11.09 1.28 Dissimilar
PRFRET 0.40 12.77 0.00 0.00 0.00 0.00 0.40 13.62 -0.38 Coincident
SZEAR 14.95 -45.09 0.09 579.82 -3975.73 366.94 16.12 -36.30 9.06 Coincident
PAT 14.92 -45.03 0.09 579.31 -3818.94 387.03 16.09 -36.26 9.05 Coincident
EDPR 4.11 -9.20 -0.02 0.05 -0.31 -0.06 4.20 -8.79 -1.63 Coincident
PDPR -10.82 62.28 -0.05 -0.02 0.01 -0.01 -10.25 86.42 -5.21 Dissimilar
Electricity Generation and Supply
EQDIV 11.65 23.64 0.18 103.42 2369.55 710.20 12.35 26.67 19.48 Dissimilar
PRFDIV -1.27 68.56 0.08 -0.77 265.88 34.96 -1.26 98.50 8.47 Dissimilar
EQRET 3.42 -0.97 0.03 0.00 0.00 0.00 3.48 -0.97 2.84 Coincident
PRFRET -1.51 -50.85 0.05 0.00 0.01 0.00 -1.50 -39.86 4.82 Dissimilar
SZEAR 17.53 17.64 0.19 705.71 6789.58 2435.98 19.16 19.29 20.51 Coincident
PAT 17.17 18.05 0.18 113752.06 106696.60 2470.94 18.73 19.78 20.29 Coincident
EDPR -5.88 6.00 -0.01 -0.01 0.01 0.00 -5.71 6.19 -0.86 Concurrent
PDPR -18.44 -44.53 0.00 0.00 0.00 0.00 -16.84 -35.94 -0.27 Coincident
Electric Machinery
EQDIV 9.15 13.62 0.12 299.22 2040.71 888.02 9.58 14.59 13.06 Coincident
PRFDIV -2.75 52.88 0.02 -1.77 127.39 15.17 -2.71 69.70 2.41 Dissimilar
EQRET -0.67 -0.51 0.01 0.00 0.00 0.00 -0.67 -0.51 0.91 Coincident
PRFRET -3.36 -5.45 -0.05 0.00 0.00 0.00 -3.30 -5.30 -5.27 Coincident
SZEAR 7.33 14.44 0.13 433.84 3532.55 2317.37 7.61 15.54 14.11 Coincident
PAT 7.16 14.64 0.13 432.07 3659.94 2332.55 7.43 15.76 14.01 Coincident
EDPR 1.82 -0.82 -0.01 0.01 -0.01 0.00 1.84 -0.82 -0.92 Coincident

250
Continued Table 10 Annual Percentage Growth Rates of Nominal Rupee Dividend Paid, Dividend Return on Shares, Rupee Earning Measures and Dividend Payout Percentage’s (Equity & Preference) across Industry Cross-section of Companies, 1961 through 2007
Type Instantaneous Linear Trend Annually Compounded
Period 1961-92 1993-07 1961-07 1961-92 1993-07 1961-07 1961-92 1993-07 1961-07
Type Of Regression
Ferrous / Non-Ferrous Metal Products
PDPR -9.92 38.24 -0.11 0.00 0.00 0.00 -9.44 46.59 -10.18 Dissimilar
EQDIV 11.44 5.37 12.22 137.59 206.76 273.28 12.13 5.52 12.99 Coincident
PRFDIV 0.13 66.61 0.64 0.22 36.45 4.59 0.13 94.66 0.65 Dissimilar
EQRET 3.51 -9.49 2.11 0.00 -0.01 0.00 3.58 -9.05 2.13 Dissimilar
PRFRET 0.64 5.37 -6.57 0.00 0.00 0.00 0.64 5.51 -6.36 Coincident
SZEAR 20.06 -82.08 7.27 326.54 -2011.34 326.51 22.21 -55.99 7.55 Dissimilar
PAT 21.28 -82.07 7.85 326.76 -1974.90 331.10 23.71 -55.99 8.16 Dissimilar
EDPR -8.62 17.41 -2.71 -0.36 0.28 -0.16 -8.26 19.01 -2.68 Coincident
PDPR -21.14 81.52 -14.54 -0.06 0.03 -0.03 -19.06 125.97 -13.53 Dissimilar
Foundries and Engineering Workshops
EQDIV 15.79 -18.74 16.40 211.21 -1453.35 509.18 17.10 -17.09 17.82 Dissimilar
PRFDIV -0.19 60.68 7.81 0.87 33.10 10.81 -0.19 83.46 8.12 Dissimilar
EQRET 4.77 -39.10 -0.62 0.00 -0.03 0.00 4.89 -32.36 -0.62 Dissimilar
PRFRET -0.30 6.31 -3.55 0.00 0.00 0.00 -0.30 6.52 -3.49 Coincident
SZEAR 21.35 -121.66 6.72 375.76 -18697.77 -579.80 23.80 -70.38 6.95 Dissimilar
PAT 20.85 -121.66 6.42 376.63 -18664.67 -568.99 23.18 -70.38 6.63 Dissimilar
EDPR -2.67 -38.63 -6.85 -0.05 -0.08 -0.04 -2.64 -32.04 -6.62 Dissimilar
PDPR -18.51 40.87 -15.34 -0.01 0.00 0.00 -16.90 50.48 -14.22 Dissimilar
Jute Textiles
EQDIV -4.83 -23.07 1.20 -2.02 -30.11 2.82 -4.72 -20.60 1.21 Parallel
PRFDIV -10.14 -17.40 -1.72 -1.87 -0.89 -1.13 -9.64 -15.97 -1.70 Coincident
EQRET -5.99 -30.04 -2.95 0.00 -0.01 0.00 -5.81 -25.95 -2.91 Parallel
PRFRET 7.94 -28.75 27.49 0.00 -0.01 0.00 8.26 -24.99 31.64 Coincident
SZEAR -7.46 0.00 -4.98 -171.38 -58.22 -79.49 -7.19 0.00 -4.86 Coincident
PAT -7.49 0.00 -5.00 -173.24 -59.11 -80.62 -7.21 0.00 -4.88 Coincident
EDPR -10.83 -21.22 -0.58 0.00 -0.02 0.00 -10.26 -19.12 -0.58 Coincident
PDPR -0.42 -40.70 26.90 0.00 0.00 0.00 -0.42 -33.43 30.87 Coincident
Machinery other than Transport and Electrical
EQDIV 11.90 9.71 12.48 465.62 1640.11 930.32 12.64 10.20 13.29 Coincident
EQRET 2.52 3.33 3.02 0.00 0.01 0.01 2.55 3.39 3.07 Coincident
251
Continued Table 10 Annual Percentage Growth Rates of Nominal Rupee Dividend Paid, Dividend Return on Shares, Rupee Earning Measures
and Dividend Payout Percentage’s (Equity & Preference) across Industry Cross-section of Companies, 1961 through 2007
Type Instantaneous Linear Trend Annually Compounded
Period 1961-92 1993-07 1961-07 1961-92 1993-07 1961-07 1961-92 1993-07 1961-07
Type Of Regression
PRFRET -0.07 -9.03 -3.73 0.00 -0.02 0.00 -0.07 -8.64 -3.66 Coincident
PRFDIV -6.39 -15.79 -9.98 -4.59 0.91 -3.94 -6.19 -14.60 -9.49 Coincident
SZEAR 9.18 -5.80 11.68 1046.14 -1815.39 2329.73 9.62 -5.63 12.39 Parallel
PAT 9.03 -5.80 11.56 1041.55 -1814.48 2325.79 9.45 -5.63 12.26 Parallel
EDPR 2.72 15.50 0.80 0.02 0.10 0.01 2.76 16.77 0.80 Parallel
PDPR -15.42 77.27 -11.87 0.00 0.00 0.00 -14.29 116.57 -11.19 Dissimilar
Medicines and Pharmaceutical Preparations
EQDIV 11.49 25.07 15.23 255.17 4049.81 1065.83 12.18 28.49 16.45 Dissimilar
PRFDIV -10.31 60.71 9.69 -0.61 133.72 17.09 -9.79 83.50 10.17 Dissimilar
EQRET 0.26 12.40 3.79 0.00 0.04 0.01 0.26 13.20 3.86 Dissimilar
PRFRET 1.02 -95.77 16.27 0.00 0.01 3353.76 1.02 -61.62 17.67 Dissimilar
SZEAR 15.03 16.69 18.67 836.68 8099.34 3353.76 16.21 18.17 20.52 Coincident
PAT 14.97 16.88 18.65 836.07 8233.06 3370.85 16.15 18.38 20.51 Coincident
EDPR -3.53 8.38 -3.43 -0.02 0.03 -0.01 -3.47 8.74 -3.38 Dissimilar
PDPR -25.27 -127.13 13.32 0.00 0.00 0.00 -22.33 -71.95 14.25 Dissimilar
Motor Vehicles
EQDIV 16.75 19.15 17.60 603.84 4464.18 1765.06 18.24 21.11 19.24 Coincident
PRFDIV -14.57 38.95 -6.05 -5.19 18.50 -1.58 -13.56 47.63 -5.87 Dissimilar
EQRET 4.75 8.71 4.54 0.01 0.02 0.01 4.86 9.10 4.65 Coincident
PRFRET -5.83 -3.22 -1.31 0.00 -0.01 0.00 -5.66 -3.17 -1.30 Coincident
SZEAR 15.03 30.05 17.54 1539.21 16973.70 6490.36 16.22 35.06 19.18 Coincident
PAT 14.87 30.06 17.44 1534.02 16991.41 6488.44 16.03 35.06 19.06 Coincident
EDPR 1.72 -10.90 0.06 0.01 -0.07 0.00 1.73 -10.33 0.06 Dissimilar
PDPR -29.44 23.45 -15.03 0.00 0.00 0.00 -25.50 26.42 -13.96 Coincident
Paper and Paper Products
EQDIV 6.56 -15.49 6.44 79.53 -383.41 119.49 6.78 -14.35 6.65 Dissimilar
PRFDIV -1.87 -31.15 -4.58 -0.81 -1.75 3.43 -1.85 -26.76 -4.47 Coincident
EQRET 0.38 -29.55 -0.62 0.00 -0.02 0.00 0.38 -25.58 -0.61 Dissimilar
PRFRET 4.10 -66.12 -4.86 0.01 -0.01 0.00 4.19 -48.38 -4.75 Dissimilar
SZEAR -1.42 -105.57 2.50 103.52 -5113.64 68.53 -1.41 -65.21 2.53 Dissimilar

252
Continued Table 10 Annual Percentage Growth Rates of Nominal Rupee Dividend Paid, Dividend Return on Shares, Rupee Earning Measures
and Dividend Payout Percentage’s (Equity & Preference) across Industry Cross-section of Companies, 1961 through 2007
Type Instantaneous Linear Trend Annually Compounded
Period 1961-92 1993-07 1961-07 1961-92 1993-07 1961-07 1961-92 1993-07 1961-07
Type Of Regression
PAT -0.39 -0.90 3.46 102.71 -5115.40 71.96 -0.39 -0.89 3.52 Coincident
EDPR -7.45 -26.12 -9.42 -0.10 -0.05 -0.11 -7.18 -22.99 -8.99 Coincident
PDPR -17.22 -41.75 -21.92 -0.29 0.00 -0.27 -15.82 -34.13 -19.68 Coincident
Rubber and Rubber Products
EQDIV 14.39 2.65 12.07 203.74 127.73 221.26 15.47 2.68 12.83 Dissimilar
PRFDIV 17.31 45.42 12.97 4.91 64.46 8.46 18.90 57.49 13.85 Parallel
EQRET 4.71 -7.58 2.31 0.01 -0.01 0.00 4.83 -7.30 2.33 Concurrent
PRFRET 7.63 27.89 10.72 0.01 0.10 0.01 7.93 32.17 11.32 Coincident
SZEAR 25.26 15.38 19.79 618.35 2069.06 757.07 28.74 16.62 21.88 Coincident
PAT 24.92 15.62 19.61 623.26 2133.51 765.52 28.30 16.91 21.66 Coincident
EDPR -11.14 -12.73 -7.46 -0.28 -0.05 -0.17 -10.55 -11.95 -7.19 Coincident
PDPR -7.86 18.23 -0.42 0.00 0.00 0.00 -7.56 19.99 -0.42 Coincident
Shipping
EQDIV 16.13 -11.68 19.44 124.65 -417.20 298.65 17.51 -11.02 21.46 Coincident
PRFDIV 12.61 12.74 15.01 3.36 19.49 8.40 13.44 13.58 16.20 Coincident
EQRET 7.36 -19.34 9.04 0.00 -0.02 0.00 7.64 -17.59 9.46 Coincident
PRFRET 3.62 16.97 -1.47 0.00 0.00 0.00 3.69 18.50 -1.46 Coincident
SZEAR 8.24 -3.97 14.61 16.32 -1022.37 412.83 8.59 -3.89 15.73 Coincident
PAT 12.01 16.68 19.01 140.97 -1439.57 711.48 12.76 18.16 20.94 Coincident
EDPR 9.53 13.47 14.18 0.14 0.12 0.06 10.00 14.42 15.24 Coincident
PDPR 2.36 -39.06 -4.57 0.00 0.01 0.01 2.39 -32.34 -4.47 Coincident
Silk and Rayon Textiles
EQDIV 14.62 8.93 19.54 221.93 2416.99 1187.18 15.75 9.34 21.59 Coincident
PRFDIV 0.68 65.39 10.59 0.10 224.80 34.75 0.68 92.31 11.17 Dissimilar
EQRET -0.67 -8.91 -0.50 0.01 -0.01 -0.02 -0.67 -8.53 -0.50 Coincident
PRFRET 5.92 -4.68 -4.91 0.01 -0.01 -0.01 6.10 -4.58 -4.79 Coincident
SZEAR 15.40 -54.56 16.15 515.08 -3288.14 2654.50 16.65 -42.05 17.53 Coincident
PAT 14.90 -54.23 15.78 515.18 -3063.33 2689.25 16.07 -41.86 17.09 Coincident
EDPR -0.03 3.87 -2.04 -0.04 0.03 -0.05 -0.03 3.95 -2.02 Coincident
PDPR -13.48 60.21 -10.60 0.00 0.01 0.00 -12.61 82.60 -10.06 Dissimilar

253
Continued Table 10 Annual Percentage Growth Rates of Nominal Rupee Dividend Paid, Dividend Return on Shares, Rupee Earning Measures and Dividend Payout Percentage’s (Equity & Preference) across Industry Cross-section of Companies, 1961 through 2007
Type Instantaneous Linear Trend Annually Compounded
Period 1961-92 1993-07 1961-07 1961-92 1993-07 1961-07 1961-92 1993-07 1961-07
Type Of Regression
EQDIV 11.55 1.02 11.79 57.65 42.74 97.31 12.25 1.03 12.52 Coincident
PRFDIV 1.68 7.51 5.95 0.43 18.62 6.76 1.70 7.80 6.13 Coincident
EQRET 9.25 -14.30 4.57 0.01 -0.02 0.00 9.69 -13.33 4.68 Dissimilar
PRFRET 5.48 31.41 6.75 0.00 -0.02 0.00 5.64 36.90 6.98 Coincident
SZEAR 25.26 21.53 17.07 203.23 -674.46 293.94 28.73 24.03 18.62 Coincident
PAT 25.36 21.95 17.09 203.67 -655.84 300.71 28.86 24.54 18.64 Coincident
EDPR -0.27 5.82 0.49 0.00 -0.02 0.00 -0.27 5.99 0.49 Coincident
PDPR -10.98 75.28 1.44 -0.01 0.01 0.00 -10.40 112.30 1.45 Dissimilar
Tea
EQDIV 19.57 -1.25 13.08 544.22 33.54 406.92 21.62 -1.25 13.97 Dissimilar
PRFDIV -1.72 32.23 0.77 -0.05 2.97 0.00 -1.70 38.03 0.78 Dissimilar
EQRET 8.50 -1.06 5.52 0.02 0.00 0.01 8.88 -1.05 5.68 Concurrent
PRFRET 2.37 49.00 21.72 0.00 -0.01 0.00 2.39 63.23 24.26 Coincident
SZEAR 21.47 5.28 13.86 1275.38 1335.57 908.06 23.95 5.42 14.87 Coincident
PAT 21.41 5.29 13.82 1275.32 1338.54 908.06 23.87 5.43 14.82 Coincident
EDPR -1.90 -6.54 -0.78 -0.02 -0.03 -0.01 -1.88 -6.33 -0.78 Coincident
PDPR -23.12 69.86 12.46 0.00 0.00 0.00 -20.64 101.09 13.27 Coincident
Trading
EQDIV 9.89 17.80 11.70 86.03 579.41 218.23 10.40 19.48 12.41 Coincident
PRFDIV -6.60 98.30 2.49 -0.92 87.24 11.14 -6.39 167.25 2.52 Dissimilar
EQRET 1.70 -16.10 -0.76 0.00 -0.01 0.00 1.71 -14.87 -0.76 Concurrent
PRFRET -3.57 7.23 -3.69 0.00 0.00 0.00 -3.51 7.49 -3.62 Parallel
SZEAR 13.35 19.60 15.20 348.74 3400.55 1049.69 14.28 21.65 16.42 Coincident
PAT 13.17 19.90 15.20 347.81 3487.79 1060.83 14.08 22.02 16.42 Concurrent
EDPR -3.50 -1.84 -3.58 -0.01 0.00 -0.01 -3.44 -1.83 -3.52 Coincident
PDPR -19.80 78.40 -12.70 0.00 0.00 0.00 -17.96 119.02 -11.93 Dissimilar Source: Same as in Table 8.

254
Table 11 Changing Relative Ranks (1=Highest to 20=Lowest) based on Absolute (A) & CAGR (G) of Annual Nominal Rupee Dividends Paid and Dividend Return on Shares (Equity & Preference) in Year Ending, 1976 through 2007
Equity Dividend Preference Dividend Equity Return Preference Return Industry
A1 A2 A3 G1 G2 G3 A1 A2 A3 G1 G2 G3 A1 A2 A3 G1 G2 G3 A1 A2 A3 G1 G2 G3
Basic Chemical 1 1 1 8 10 9 1 1 1 6 10 10 6 10 9 13 5 13 3 9 4 14 7 12
Cement 12 10 12 15 18 11 11 14 13 13 19 16 14 12 12 19 16 14 9 5 7 17 2 8
Fertilizers 9 4 5 9 3 6 2 2 2 3 11 3 7 9 8 16 3 11 2 7 3 15 11 13
Construction 19 18 18 2 7 4 16 19 18 4 16 8 11 19 13 10 15 19 11 20 17 1 20 3
Cotton 2 12 8 16 12 18 3 5 5 15 2 11 9 11 10 4 12 10 17 17 16 11 6 9
Electricity 14 8 9 11 2 13 7 3 3 10 3 6 5 5 5 9 7 7 8 11 12 16 17 7
Electric Mach. 5 7 6 18 6 3 6 7 6 14 8 13 12 14 11 17 6 12 6 15 11 18 14 19
Metal 11 14 13 14 11 14 10 15 15 8 4 15 16 16 17 8 11 9 10 18 14 10 10 20
Foundry 15 9 11 5 19 7 12 8 8 9 7 7 17 17 19 5 20 17 15 12 15 13 9 14
Jute 20 20 20 20 20 20 17 20 19 18 18 17 20 20 20 20 19 20 19 16 20 2 16 1
Other Machinery 3 5 3 10 8 12 4 17 14 16 17 20 8 4 6 11 4 6 7 10 10 12 15 16
Medicines 7 6 7 13 1 8 18 6 7 19 6 5 4 2 3 15 1 5 13 4 9 9 19 4
Motor 4 2 2 3 4 5 5 16 16 20 12 19 3 3 4 6 2 4 5 14 8 20 12 10
Paper 13 17 17 19 17 19 8 13 9 12 20 18 18 15 18 14 18 16 16 2 5 6 18 17
Rubber 10 15 15 7 13 15 13 12 11 1 9 2 10 6 7 7 9 8 4 1 2 3 4 5
Shipping 17 13 14 4 16 2 20 11 17 2 14 1 19 8 16 3 17 1 20 6 19 7 5 11
Silk 8 3 4 6 9 1 9 4 4 7 5 4 1 7 1 18 10 15 1 8 1 4 13 18
Sugar 18 19 19 12 14 16 14 10 10 5 15 9 15 13 15 1 13 3 12 3 6 5 3 6
Tea 6 11 10 1 15 10 19 18 20 11 13 14 2 1 2 2 8 2 14 13 13 8 1 2
Trading 16 16 16 17 5 17 15 9 12 17 1 12 13 18 14 12 14 18 18 19 18 19 8 15
Notes: The letters A and G represents Absolute and Annually Compounded Growth rates respectively, the suffix 1, 2, and 3 attached to such letters indicate the Pre-reform, Post-reform and the Full-period respectively. Source: Same as in Table 8.

255
Table 12 Changing Ranks (1=Highest to 20=Lowest) based on Absolute & CAGR of Annual Nominal Rupee Earnings and Dividend Payout Percentages (Equity & Preference) in Year Ending, 1976 through 2007
Size of Earnings Profit after Taxes Equity Dividend Payout Preference Dividend Payout Industry
A1 A2 A3 G1 G2 G3 A1 A2 A3 G1 G2 G3 A1 A2 A3 G1 G2 G3 A1 A2 A3 G1 G2 G3
Basic Chemical 1 1 1 13 11 12 1 1 1 14 12 12 15 9 15 6 7 5 12 10 13 6 11 11
Cement 17 9 10 18 18 16 17 9 10 18 19 16 1 16 2 20 15 18 3 15 3 19 6 15
Fertilizers 9 3 3 17 2 8 9 3 3 17 2 8 10 10 12 2 14 3 8 6 9 4 14 10
Construction 16 14 14 12 4 1 16 15 14 13 4 1 6 14 8 3 11 13 9 20 12 1 20 2
Cotton 12 13 13 10 15 15 11 14 13 8 16 15 2 2 1 4 13 11 4 4 4 8 7 9
Electricity 8 8 8 6 6 4 8 8 8 6 6 4 18 18 19 15 5 10 11 8 10 13 18 6
Electric Mach. 5 7 7 16 9 13 5 7 7 16 10 13 11 8 13 7 9 9 13 9 14 7 10 13
Metal 14 15 15 5 17 17 14 16 16 4 18 17 4 3 3 17 1 14 2 3 2 16 1 17
Foundry 13 19 18 4 20 18 13 19 19 5 20 18 8 7 9 12 20 17 6 13 7 14 9 19
Jute 19 20 20 20 12 20 20 20 20 20 13 20 20 20 20 18 18 7 16 16 17 3 16 1
Other Machinery 3 6 5 14 14 14 3 6 5 15 15 14 14 6 14 5 2 2 14 17 16 11 3 14
Medicines 7 4 4 9 7 3 7 4 4 7 7 3 13 15 16 14 4 15 19 14 19 18 19 3
Motor 2 2 2 8 1 5 2 2 2 10 1 5 17 12 17 8 16 6 17 18 18 20 12 18
Paper 18 17 17 19 19 19 18 17 18 19 14 19 5 17 5 16 19 20 1 7 1 12 17 20
Rubber 10 12 12 1 8 2 10 12 12 2 9 2 3 11 4 19 17 19 10 12 11 5 13 7
Shipping 20 16 19 15 13 9 19 13 15 12 8 9 19 1 6 1 3 1 20 1 6 2 15 8
Silk 6 5 6 7 16 7 6 5 6 9 17 7 7 13 7 9 8 12 7 5 8 10 8 12
Sugar 15 18 16 2 3 6 15 18 17 1 3 6 12 4 10 10 6 4 5 2 5 9 4 5
Tea 4 10 9 3 10 10 4 10 9 3 11 10 9 5 11 11 12 8 18 19 20 17 5 4
Trading 11 11 11 11 5 11 12 11 11 11 5 11 16 19 18 13 10 16 15 11 15 15 2 16
Notes and Source: Same as in Table 11.

Table 13 Results of K-W Test to Detect Differences in Dividend Related Measures due to the Impact of Economic Reforms across Industry Cross-section
K-W Stats. EQDIV PRFDIV EQRET PRFRET SZEAR PAT EDPOR PDPOR
Pre-Reform periods
Chi-Square 195.23 213.54 147.73 82.61 152.37 148.76 101.31 91.99
Asymp. Sig. 0.00*** 0.00*** 0.00*** 0.00*** 0.00*** 0.00*** 0.00*** 0.00***
Post-Reform periods
Chi-Square 120.83 62.91 92.64 30.85 94.55 92.75 60.97 40.07
Asymp. Sig. 0.00*** 0.00*** 0.00*** 0.04** 0.00*** 0.00*** 0.00*** 0.00***
Notes: a. K-W Stats. denote Kruslal-Wallis test statistics b. Asymp. Sig. is Asymptotic Significance Source: Same as in Table 8.