The Origins and Persistence of Black-White Differences in ...
49
NBER WORKING PAPER SERIES THE ORIGINS AND PERSISTENCE OF BLACK-WHITE DIFFERENCES IN WOMEN'S LABOR FORCE PARTICIPATION Leah Platt Boustan William J. Collins Working Paper 19040 http://www.nber.org/papers/w19040 NATIONAL BUREAU OF ECONOMIC RESEARCH 1050 Massachusetts Avenue Cambridge, MA 02138 May 2013 This paper was prepared for the Human Capital in History conference in honor of Claudia Goldin in December 2012. We thank Nayana Bose, Francisco Haimovich, Mike Moody and Greg Niemesh for able research assistance. Members of the KALER group at UCLA provided useful comments on our initial draft. We also appreciate suggestions made by our discussant, Richard Freeman, at the Human Capital in History conference (December, 2012) and those of the conference organizers, Robert Margo and Carola Frydman. The views expressed herein are those of the authors and do not necessarily reflect the views of the National Bureau of Economic Research. NBER working papers are circulated for discussion and comment purposes. They have not been peer- reviewed or been subject to the review by the NBER Board of Directors that accompanies official NBER publications. © 2013 by Leah Platt Boustan and William J. Collins. All rights reserved. Short sections of text, not to exceed two paragraphs, may be quoted without explicit permission provided that full credit, including © notice, is given to the source.
Transcript of The Origins and Persistence of Black-White Differences in ...

NBER WORKING PAPER SERIES
THE ORIGINS AND PERSISTENCE OF BLACK-WHITE DIFFERENCES IN WOMEN'SLABOR FORCE PARTICIPATION
Leah Platt BoustanWilliam J. Collins
Working Paper 19040http://www.nber.org/papers/w19040
NATIONAL BUREAU OF ECONOMIC RESEARCH1050 Massachusetts Avenue
Cambridge, MA 02138May 2013
This paper was prepared for the Human Capital in History conference in honor of Claudia Goldinin December 2012. We thank Nayana Bose, Francisco Haimovich, Mike Moody and Greg Niemeshfor able research assistance. Members of the KALER group at UCLA provided useful comments onour initial draft. We also appreciate suggestions made by our discussant, Richard Freeman, at the HumanCapital in History conference (December, 2012) and those of the conference organizers, Robert Margoand Carola Frydman. The views expressed herein are those of the authors and do not necessarily reflectthe views of the National Bureau of Economic Research.
NBER working papers are circulated for discussion and comment purposes. They have not been peer-reviewed or been subject to the review by the NBER Board of Directors that accompanies officialNBER publications.
© 2013 by Leah Platt Boustan and William J. Collins. All rights reserved. Short sections of text, notto exceed two paragraphs, may be quoted without explicit permission provided that full credit, including© notice, is given to the source.

The Origins and Persistence of Black-White Differences in Women's Labor Force ParticipationLeah Platt Boustan and William J. CollinsNBER Working Paper No. 19040May 2013JEL No. J22,N11,N12
ABSTRACT
Black women were more likely than white women to participate in the labor force from 1870 untilat least 1980 and to hold jobs in agriculture or manufacturing. Differences in observables cannot accountfor most of this racial gap in labor force participation for the 100 years after Emancipation. The unexplainedracial gap may be due to racial differences in stigma associated with women’s work, which Goldin(1977) suggested could be traced to cultural norms rooted in slavery. In both nineteenth and twentiethcentury data, we find evidence of inter-generation transmission of labor force participation from motherto daughter, which is consistent with the role of cultural norms.
Leah Platt BoustanDepartment of Economics8283 Bunche HallUCLALos Angeles, CA 90095-1477and [email protected]
William J. CollinsDepartment of EconomicsVanderbilt UniversityVU Station B #3518192301 Vanderbilt PlaceNashville, TN 37235-1819and [email protected]

1
The twentieth-century rise in women’s labor force participation was one of the most
important social changes in American history. The growth in women’s market work was
precipitated by and, in turn, contributed to a shift in industrial composition from agriculture and
manufacturing to services, a revolution in norms and expectations about women’s careers, and
changes in marriage, fertility, and human capital investment. Writing this complex story—
documenting it, analyzing it, and placing it into its social context—has been one of Claudia
Goldin’s great contributions to scholarship.
As with so many other social trends, the levels and changes in female labor force
participation have been notably different for black and white women in the United States. Goldin
(1977, 1990) proposes that these long-standing racial differences can, in part, be traced back to a
“double legacy” of slavery. The widespread poverty and low levels of education in the black
population after the Civil War may have had a direct effect on the labor force participation of
black women relative to white women. In addition, slavery may have had an indirect effect by
shaping prevailing social norms in the black community about women’s work. In particular,
Goldin hypothesizes that because black women worked intensively under slavery, African
Americans developed norms and expectations about women’s work that were different from
those of most whites and that were carried into the post-Emancipation era.1 Goldin (1977)
demonstrates that observable economic and demographic characteristics cannot account fully for
black-white differences in women’s labor force participation in the immediate post-bellum
1 Weiss (1999) estimates an overall participation rate for black women (free and slave, over age 15) of about 82 percent in 1860. The high rates of LFP for female slaves is well-documented in the historical literature. Wayne (2007) summarizes this view: “At cotton-picking time everyone, including children and the elderly, worked in the fields. A male slave from South Carolina remembered: “Women worked in de field same as de men. Some of dem plowed jes’ like de men and boys. Couldn’t tell’em apart in de field, as dey wore pantalets or breeches.” Besides working in the field, women might be used as housekeepers, nannies for white children, laundresses, cooks, personal servants, caregivers for slave children (usually elderly women), or sexual mistresses for the master” (p. 130). See also Jones (1985).

2
period, a fact that is consistent with the idea of disparate social norms about women’s work by
race.
In this paper we explore how the intergenerational transmission of work behavior from
mother to daughter may have influenced racial differences in women’s labor force participation
well into the twentieth century. We begin by describing trends in labor force participation rates
among black and white women from 1870 to the present. Participation in market work is the
outcome of a labor supply decision that is influenced by non-labor income, market wage offers,
and non-pecuniary aspects of employment, including social stigma against women’s work in
particular kinds of jobs that may vary by race. The market wage offers to women and work
conditions, in turn, reflect evolving patterns of labor demand and discrimination, which again
may vary by race. Guided by this framework, we document the presence of a large racial gap in
participation rates even after controlling for proxies for income and wages. This suggests that
racial differences in social norms may play some role in explaining differences in market
activity.
We then present new evidence that daughters who were raised by working mothers are
themselves more likely to work. Given that social norms are transmitted, at least in part, within
families from parents to children, this intergenerational correlation may reflect racial differences
in norms about women’s work outside of the home, although it could also suggest that daughters
with working mothers develop skills, gather information, or build networks that are conducive to
their subsequent work activity. Higher labor force participation rates for black mothers, coupled
with the intergenerational correlation in work behavior between mother and daughter, can
explain one third of the racial gap in female labor force participation in the early twentieth
century and around 10 percent of the remaining gap in the mid-twentieth century. This aspect of

3
our paper contributes to the growing literature on the role of “culture” in explaining variation in
female labor force participation across groups (e.g., Reimers 1985, Farré and Vella 2007,
Fernández and Fogli 2009, and Blau et al. 2012).
1. Trends in female labor force participation by race
In this section, we begin by presenting trends in labor force participation (henceforth
“LFP”) among black and white women. We confirm and extend patterns that are familiar to
readers of Goldin (1990, chapter 2). Our data are drawn from the Integrated Public Use
Microdata Series (IPUMS, Ruggles et al. 2010), which are based on the federal Census of
Population manuscripts.2 Some of our analysis will focus specifically on participation by
married women, where the changes for whites have been largest, but for the most part we present
data for all women regardless of marital status to give a wider perspective on the range of
women’s activities.
The characterization of changes in LFP over such a long period is, of course,
accompanied by some caveats. The modern concept of labor force participation was
implemented with the 1940 census, whereas earlier censuses collected occupational information
for “gainful workers.” Complete consistency between these two concepts is impossible due to
inherent differences in their definitions and year-to-year variation in enumerator instructions and
practices. In addition to these conceptual differences, the late nineteenth-century censuses appear
to undercount female workers relative to later years, particularly among married white women
living on farms and those taking in boarders in urban areas. Goldin (1990, appendix to chapter 2)
explores this issue in depth, drawing on a variety of sources to adjust figures for 1890. She
2 The 2010 data are from the American Community Survey. See dissertations by Matthew Sobek (1997) and Evan Roberts (2007) for detailed discussion of the census data on women’s work.

4
concludes that the LFP for married women was understated by at least 10 percentage points in
that year; for all women (single and married), the undercount is at least 7 percentage points. Most
of our description and analysis relies on the IPUMS-based labor force variable without
modification, but we have attempted some adjustments (discussed below) to get a sense of the
potential magnitude of miscounting.
Figures 1A and 1B show participation rates in samples of black and white women, ages
25 to 54 from 1870 to 2010, taking the IPUMS coding of LFP at face value. In each census year,
women are in one of four mutually exclusive categories: in the labor force and married (with
spouse present); in the labor force and not married (or spouse not present); not in the labor force
and not married; and not in the labor force and married. The combination of the first two groups
yields the overall share of women in the labor force. Appendix Table A1 provides the data that
underlie Figure 1, along with some additional summary statistics.
A few key facts are clear from Figures 1A and 1B. First, the conventionally measured
participation rate among black women was much higher than among white women in the late
nineteenth and early twentieth centuries. From 1870 to 1900, black LFP was around 40 percent,
whereas white LFP was below 15 percent, with the vast majority of white workers consisting of
unmarried women. Even in our upward adjusted LFP rates, discussed below, the overall white
participation rate did not reach 40 percent until 1960, almost a full century later than for blacks.3
Second, whereas an increase in the number of married workers drove the twentieth-
century rise in white women’s participation, an increase in the number of unmarried workers
3 For perspective, it is important to recognize that the LFP rate for black women was much higher before Emancipation. As mentioned above, Weiss (1999) estimates an overall participation rate for black women (free and slave, over age 15) of about 82 percent in 1860, compared to 35 percent in 1870. The sharp postwar decline reflects the end of coercion under slavery (Ransom and Sutch 1977) and may also reflect a fall in southern wages and labor productivity (Margo 2004). Whether the remaining black-white gap is attributable to differences in observable socioeconomic variables is explored in the next section.
5
accounts for most of the rise in black women’s participation, especially after 1970.4 This is not
because the participation rate within the group of married black women fell or stagnated (to the
contrary it increased), but rather because the share of black women who were married (with
spouse present) declined sharply, from more than 60 percent through 1960 to just 29 percent in
2010. Focusing exclusively on married women would miss this important aspect of black
women’s labor market participation. Although selection into marriage is outside the focus of this
paper, the trend among black women is likely to be connected in complex ways to the declining
share of black men in the labor force (Wilson 1990).
Third, and shown directly in Figure 1C, the racial gap in women’s LFP narrowed
significantly between 1920 and 1950 (from 27 to 14 percentage points), as the white rate
increased over this period while the black rate remained nearly constant. As we discuss below,
the rise among white women reflects both a shifting demand for clerical workers, as firms and
the federal government grew larger and more complex, and a shifting supply of high-school
educated white women. Black women, on the other hand, were generally barred from the
expanding clerical sector, and relatively few had had the opportunity to attend high school.5
After 1950, both black and white rates rose steeply and almost in parallel until 1970.
Over the next few decades, the overall gap narrowed again and was nearly eliminated by 1990. It
is notable that the gap in LFP narrowed as much between 1920 and 1950 as it did between 1950
4 The overall LFP among whites increased by 61 percentage points from 1900 to 2000, of which 47 points can be attributed to higher participation by married women (subject to caveats about undercounts of married women’s work circa 1900). Among blacks, the overall LFP increased by 32 percentage points from 1900 to 2000, of which only 13 points can be attributed to married women. From 1970 to 2010, the share of married-and-working women declined among blacks by 8 points (despite rising participation within the married group), but this was more-than-offset by the growth of the not-married-and-working group in driving an increase in overall participation. 5 There were remarkably few public high schools for black students in the South in the early decades of the twentieth century.

6
and 1990. It is worth re-emphasizing that the entire gain in white LFP between 1920 and 1950
came from an increase in married workers.
Our attempts to account for under-enumeration of women’s work, particularly on farms
or in boarding houses, are reported in Appendix Table A2. In the microdata, we simply
reassigned LFP for women who lived on farms or had boarders present (and were “head of
household” or “spouse-of-head”, substituting the LFP rate observed in the same
race/region/farm/married/boarder-status cells for later census years (1920, 1940, or 1960), all of
which had more careful enumerator instructions about how to count female workers. For white
women between 1870 and 1900, the adjusted rates are 1 to 15 percentage points higher,
depending on the year chosen as the basis for the adjustment. Because within-cell rates are
substantially higher in 1960 than previously (particularly on farms), using 1960 as the base year
leads to the largest adjustments. For black women, however, the modifications lead to relatively
small differences in LFP. Thus, the magnitude of the racial gap at any point in time is sensitive to
adjustments for differential undercounting of white women, but it remains in all cases a sizable
difference.
Stigma, the rise of white-collar work, and the rise of women’s LFP
Goldin explains that, “The social stigma against wives working in paid manual labor
outside the home is apparently widespread and strong… The stigma is a simple message. Only a
husband who is lazy, indolent, and entirely negligent of his family would allow his wife to do
such labor” (1995, p. 71). In a static model of women’s labor supply, building on Gronau (1977),
Goldin (1995) shows how such a stigma may affect a woman’s likelihood of entering the labor

7
force. The key idea is simply that when the household’s utility loss from the stigma is greater
than the utility gain from working outside the home, then a woman will not enter the labor force.
In this framework, a higher level of stigma would lead to a lower rate of labor force
participation for married women, all else the same. A higher level of family income, conditional
on existing levels of stigma, would also lower the likelihood of a wife’s participation in the labor
market because the utility gain from her marginal income would be low (e.g., a high income
husband is unlikely to have a wife working in a factory).6 On the other hand, a higher market
wage for women, perhaps associated with higher levels of (or returns to) education or
experience, or improving non-pecuniary job characteristics would tend to pull women into the
labor force. In this sense, changes on the demand-side of the labor market may be critical to
drawing women into the labor force.
For white women, rising levels of education and the growing availability of “clean jobs”
offered the opportunity to work without incurring the stigma associated with physically
demanding or dirty tasks. Figure 2A shows the occupational distribution for white women,
including a category for not-in-labor-force to provide a broad view of the range of women’s
activities. It is striking that white women’s participation increased almost in lockstep with the
rise in white-collar work (professional, clerical, manager, and sales occupations). Clerical work
was a key component of this growth up to 1970 (Appendix Table A3), and clerical sector
experience early in a woman’s career was relatively conducive to persistent labor force
participation (Goldin 1989). Even women who left the workforce to raise children found that
they could re-enter clerical jobs later in life.
6 A goal of Goldin (1995) is to explain not only the twentieth-century rise in women’s LFP, but also the apparent decline in the late nineteenth century. The model with stigma attached to women’s manual labor predicts that, as average income rises in the late nineteenth century, women’s LFP will fall, thereby explaining the downward portion of the U-shaped pattern.

8
The rise of black women’s labor force participation over the twentieth century was
associated with some of the same forces that influenced white women, but this rise also differed
in key respects. One important difference is that black women completed high school in large
numbers a full generation after white women. This educational delay was due, in large part, to
the black population’s concentration in the South, which lagged behind the rest of the country in
education in general and under-supplied schools for black children (Collins and Margo 2006). As
a result, a relatively small share of black women was prepared for office work in the early
twentieth century. In addition, on the demand-side of the market, discrimination against black
women in clerical work delayed the rise in black women’s work in this sector until the 1960s
even as their educational attainment increased (Sundstrom 2000).7 Figure 2B shows that the rise
in black women’s LFP did coincide with a rise in white-collar work, but only after 1950. The
jump in black women’s clerical employment from 4 percent of all black women in 1960 to 18
percent by 1980 is especially noteworthy (Appendix Table A4); this includes a sizable increase
in government employment from 1.6 to 5.3 percent of all black women.
A second salient feature of Figure 2B is that black women were heavily concentrated in
agriculture and domestic service until the latter part of the 20th century, exactly the kind of
arduous labor that was heavily stigmatized for married white women. Thus, not only were black
women far more likely to be in the labor force than white women, but they were also far more
likely to endure difficult working conditions once in the labor force.
One possible explanation for the gap in women’s LFP is that black families were poorer
than white families, implying that the marginal income from female employment was more
valuable. In combination with low levels of human capital and hiring discrimination in the
7 Goldin (1990, p. 147) cites the prevalence of racial discrimination in clerical employment revealed in a Women’s Bureau survey of firms in 1940. Collins (2003) finds that anti-discrimination laws implemented at the state level in the 1940s and 1950s had positive effects on black women’s labor market outcomes.

9
clerical sector, this would lead to a concentration of black women in “dirty jobs.” Another
potential explanation is that the stigma associated with married women’s work applied to a
smaller share of black women because fewer black women were married. In addition, women’s
work in arduous tasks may have been less subject to stigma in the black community, which leads
us back to Goldin’s hypothesis—that the historically high rates of women’s work under slavery
may have shaped attitudes towards married women’s work in the black community. We explore
this hypothesis in more detail in the next two sections.
2. Observables and racial differences in women’s LFP, 1870-2010
This section explores the extent to which differences in observables can account for the
racial gap in LFP over the last 140 years. In a simple model of labor supply, a person’s decision
to enter the labor force depends on a comparison of the available market wage and the person’s
reservation wage. The reservation wage, in turn, depends on the level of non-labor income,
wealth, costs associated with taking up work, and preferences. Therefore, one might expect large
racial differences in women’s labor force participation to be accounted for by differences in
education, location, family composition, and household economic characteristics. We argue that
the portion of the gap in LFP that cannot be explained by these socio-economic factors may be
due to unobservable differences in the stigma associated with market work between white and
black populations.
The 1870 Census of Population is an especially interesting place to start our
investigation. It is, of course, the first post-Emancipation census, and unlike all subsequent
censuses, it includes information about the value of personal and real property (i.e., wealth).
Goldin (1977) collected a random sample of census manuscripts from seven southern cities in

10
1870 and 1880, and found that large black-white differences in LFP remained after adjusting for
differences in observable characteristics. We use the national IPUMS one-percent sample for
1870 to present simple regressions that confirm Goldin’s conclusion in a broader dataset, yield
some additional insights, and dovetail with our analysis for later years.
Given the scarcity of individual wage and non-wage income data in this period, we do not
attempt to estimate a standard labor supply equation.8 Rather, our goal is simply to determine
whether an extensive set of personal and household observables can account for the large
difference in black and white LFP rates. These observables may control for a large part of
slavery’s “direct effect” on labor market behavior, operating through low family income, wealth,
place of birth, education, and family structure. The residual difference in LFP may then reflect
differences in norms or expectations about women’s work outside the home, potentially an
“indirect” product of slavery. Of course, given the scope for omitted variables and endogeneity,
interpreting the residual requires caution and qualification. For example, black women may have
been more likely to work than white women (controlling for observables) because they expected
a higher likelihood of marital instability or believe that their husbands have a higher risk of
unemployment or mortality, expectations that we cannot observe in the census data.
Table 1 reports coefficients from separate linear probability model regressions of LFP on
an indicator for race (black=1) in 1870.9 The base sample in Panel A includes all women, age 25
8 In addition to Goldin (1990), see Fraundorf (1979) and Rotella (1980) for efforts to estimate women’s labor supply equations with historical data. A large literature on the topic emerged in the 1960s, including notable contributions from Mincer (1962) and Bowen and Finegan (1969). See Heckman and Killingsworth (1986) for a review of this literature and Blau and Kahn (2007) for more recent evidence. 9 The analyses in Tables 1 and 2 are pooled regressions (black and white women) with a race indicator and controls for observables. The coefficient on the race indicator can be interpreted as the “unexplained” portion of a version of the Blinder-Oaxaca decomposition in which the intercepts for each group are constrained to be equal but opposite. See Fortin (2008) for elaboration. In this setting, we see that the unexplained portion of the gap is large relative to the overall gap in LFP. We have implemented a version of this decomposition with a detailed breakdown within the explained and unexplained categories such

11
to 54; Panel B presents results for a subsample of married women. Within each panel, we
estimate separate regressions for samples from the entire U.S., the South, and the non-farm South
to see if narrowing the basis of comparison affects the main results. Column 1’s specification
includes only the race dummy, reflecting the unadjusted racial difference in participation rates.
Column 2 adds fixed effects for state of birth and age, our limited set of clearly exogenous
background variables. Column 3 adds controls for several other observables, including literacy,
the number of own children in the household (separate categorical variables for children under
and over 5 years of age), city-resident status, farm-resident status, household wealth (four
categories), and husband’s status (9 occupational categories and a no-husband-present category).
Among women in the South, the racial difference in LFP is approximately 32 percentage
points in 1870. Our extensive set of control variables and fixed effects account for very little of
the racial difference, approximately 5 percentage points out of 32. The levels are slightly
different in the other rows of Panel A (all U.S. and non-farm South), but the basic story is
unchanged: observables account for little of the large racial gap in women’s labor force
participation in the wake of the Civil War.
Among married women who reside with their spouse, the magnitude of the base racial
gap is smaller (Panel B, Column 1) than in Panel A. This sample composition effect reflects both
the relatively high level of participation among unmarried black women and the relatively large
share of unmarried women among blacks. Adjusting for observables can explain more of the
racial LFP gap for married women in Panel B than for all women in Panel A. Nonetheless, the
residual gap in women’s LFP is still greater than 15 percentage points, more than half of the
unadjusted gap. The large residual gap is notable because the 1870 data provide a measure of
that the breakdown is invariant to the choice of omitted categories (Jann 2008). Much of the unexplained portion of the gap is located in the differences in the constant terms, as opposed to differences in responsiveness to observables.

12
household wealth, which is typically an omitted variable in contemporary studies of women’s
labor force participation.10 The presence of a large residual gap in women’s LFP, as Goldin
(1977) found, is consistent with differences in social norms or stigma associated with women’s
work by race, which may be an indirect legacy of slavery.
The “unexplained” gap in women’s labor force participation persisted for more than 100
years, although this residual narrowed alongside the overall gap. Figure 3A plots three sets of
coefficients from regressions that are similar to those described above for a national sample of
black and white women: one plot simply shows the difference in black-white LFP at each census
date (unadjusted), whereas the other two show adjusted differences in LFP rates (i.e., the
coefficient on black, conditional on observables). One of the adjusted plots begins in 1940
because that year is the first in which we can observe women’s educational attainment in detail
(as opposed to just “literacy” in earlier years).11 Censuses after 1870 do not provide measures of
wealth, but husband’s occupation and the other covariates should capture wealth differences to
some extent.12
Consistent with earlier depictions of LFP levels, Figure 3A documents a large but
declining unadjusted difference in black-white LFP. The new information in this graph is
conveyed by the plots showing the size of the racial gap conditional on observables. Until 1930,
controlling for observables makes little difference in the size of the racial gap. Around mid-
10 Relative to households with zero wealth (about one quarter of the sample) and controlling for other observables (including husband’s status), women from wealthier households were more likely to be in the labor force, though the coefficients vary across the subsamples of Table 1. This could simply reflect the endogeneity of household wealth with respect to women’s past work. 11 For the “adjusted” plot that runs from 1880 to 2010 we have a literacy variable in all specifications. Up to 1930, this is based on the ability to read and write, as reported by the census enumerator. From 1940 onward, when the census did not inquire about literacy but did inquire about educational attainment, we code women as literate if they went beyond fourth grade. 12 Results from the fully specified regressions for married women in 1870 are not much different if the categorical wealth controls are omitted.

13
century (1940-70), observable differences begin to account for a larger portion of the gap, both
absolutely and relative to the gap’s unadjusted size. By 1990, however, the overall black-white
gap is very small by historical standards, and, in contrast to the earlier years, adjustments for
observables tend to increase the racial gap.13
For reference, at 20-year intervals, coefficients for key variables from linear probability
models of LFP are reported in Table 2, where the omitted “husband category” consists of women
who were “single, never married.” By 1940, there is a strong positive link between educational
attainment and women’s LFP, even after controlling for husband’s occupation. Relative to never-
married women, LFP for married women declines from 1880 to 1920 across all categories of
husbands’ occupations, but then the pattern reverses, such that by 2000 the differences between
married and unmarried women are small by historical standards. Blinder-Oaxaca decompositions
corresponding to the regression specifications in Table 2 are reported in Appendix Table A5.14
In this setting, differences in husband’s presence and occupation may account for some portion
of the racial difference in women’s LFP, which is consistent with the expectation that for most of
U.S. history single women and women married to men in relatively low-earning occupations are
more likely to work for pay than others. The estimated contribution ranges from 4 percentage
points in the early twentieth century to 7 percentage points in 1960, but differences in other
observables tend to have little explanatory power. As noted earlier, given that education is
13 Starting in 1940, we are able to add more detailed educational attainment variables as controls (up to this point, literacy is the only human capital variable). Higher educational attainment is associated with higher labor force participation rates. In each year, black women lower educational attainment (on average) than white women. Therefore, adjusting for educational attainment tends to increase the coefficient on the black indicator variable. 14 The usual caveats about decompositions apply here, as well. See Fortin, Lemieux, and Firpo (2011) for an extended discussion. In addition to the mechanical (but important) issues related to the choice of coefficient vectors, omitted categories, and linear versus non-linear methods, we note that some of the variables in our regressions are likely endogenous to women’s labor force participation. We present the decomposition results for descriptive purposes.

14
positively associated with LFP, racial differences in educational attainment cannot explain the
relatively high level of black women’s participation.
Figure 3B shows that the racial gap in the likelihood of working “dirty jobs” was large
throughout most of the twentieth century, even with controls for marital status, husband’s
occupation, number of children, birthplace, and literacy or highest grade of education. From
1940 onward, we see that controlling for years of educational attainment accounts for a sizable
share of the gap, though a nontrivial share remains unexplained despite a pronounced decline in
agricultural and household-service employment as a share of all women’s work (Bailey and
Collins 2006).15
In sum, for at least 100 years after Emancipation, black women participated in the labor
force at significantly higher rates than white women. Prior to 1950, observable characteristics
fail to account for most of this gap, suggesting that something else that is correlated with race
mattered, and that it mattered more in the decades immediately after the Civil War than later in
the twentieth century. . Differences between blacks and whites in the strength of the stigma
against married women’s work in physically demanding jobs, reflecting an indirect legacy of
slavery, might help account for this pattern. To be a persuasive interpretation of the patterns
described above, this influence would have to be found to persist across generations. The next
section looks for traces of intergenerational transmission in attitudes towards women’s work.
15 Restricting the sample to non-Hispanic whites has little impact on the size of the conditional gap in the late twentieth century relative to what is shown in Figure 3B.

15
3. Evidence on intergenerational transmission
Thus far, we have presented indirect evidence that racial differences in social norms
about women’s work may have contributed to the generation and perpetuation of the racial gap
in female LFP. In particular, we interpreted the presence of a residual in a regression of women’s
LFP on a set of socio-economic traits as suggestive evidence that other factors, including social
norms, are needed to explain the racial participation gap. In this section, we present more direct
evidence about the role of historical differences in women’s work activity by race, stemming
from the era of slavery, in sustaining the racial gap in women’s work behavior over time. We
demonstrate a strong association between the work activity of mothers and daughters in both the
late nineteenth century, a generation after Emancipation, and in the mid-twentieth century. As a
result, initial differences in women’s work behavior have persisted over time. The link between
mothers’ and daughters’ behavior is large enough to explain up to a third of the black-white gap
in female LFP a generation or more after slavery.
Racially distinct attitudes and expectations about women’s work outside the home
provide one explanation for the observed correlation in work behavior between mothers and
daughters. Social norms about women’s work (and many other social phenomena) are
transmitted to children, in part, through interactions with their parents (Moen, et al., 1997). These
norms may be transmitted tacitly, as young women observe the work behavior of their mother, or
they may be actively conveyed through conversation and exhortation. Alternatively, working
mothers may provide their daughters with skills or a labor market network, which could increase
her economic return to market work. Although we cannot econometrically distinguish between
the transmission of attitudes and norms, on the one hand, or of skills and information on the
other, estimating the reduced-form relationship between the work behavior of mothers and

16
daughters is interesting in its own right and may help account for racial differences in the
propensity to work outside of the home.
Our analysis is related to a series of recent papers that has investigated the role that
“culture,” broadly defined as beliefs or preferences, plays in explaining differences in women’s
market work across groups (Fernandez and Fogli, 2009; Blau, Kahn, Liu and Papps, 2012; Farré
and Vella, 2007). Because attitudes about women’s work are formed in a particular economic
context, it is an empirical challenge to disentangle the effect of culture on female LFP from the
role of economic conditions. For this reason, the recent literature has focused on the work
behavior of immigrant women. Immigrants leave the economic environment in which their
preferences were first formed but may still carry with them specific attitudes or norms shaped in
their source country. Consistent with this hypothesis, Fernandez and Fogli (2009) show that the
LFP of immigrant women is correlated with lagged female LFP in their source country, and
Blau, et al. (2012) find an association between the LFP of first- and second-generation immigrant
women from the same country of origin.
Nineteenth-century data
We begin our analysis of the intergenerational correlation of women’s work behavior by
investigating the generation of daughters born immediately after Emancipation. We focus on the
birth cohorts of 1866 to 1884, members of which were old enough to participate in the labor
force in 1900. For this group, we ask whether women whose mothers were born into slavery
were themselves more likely to engage in market work in adulthood. Data are drawn from the
five-percent IPUMS sample of 1900. Although mother’s slave status is unknown, we assume that

17
black daughters whose mothers were born in the South are the direct descendants of slaves (see
also Sacerdote, 2005).16
In particular, we estimate:
I(daughter works) = α + β1 I(black) + β2 I(mother born in South) + (1)
β3 [I(mother born in South) * I(black)] +
γ1 I(born in South) + γ2 [I(born in South) * I(black)] + (X') Δ + ε.
The dependent variable is an indicator equal to one if the daughter participates in the labor force
in 1900. The coefficient β1 identifies the racial gap in labor force participation. β2 compares the
work behavior of all women, both white and black, whose mothers were born in the South. The
coefficient of interest is β3, which isolates any additional effect of having a mother who was born
in the South for black women. We interpret the additional effect in β3 as reflecting the effect of
being a descendant of slaves. Daughters of former slaves differ from daughters of free blacks
both in the likelihood that their own mothers worked, which may have influenced their own
attitudes about the value and suitability of women’s work, and also, perhaps, in other aspects of
family background such as accumulated wealth. β3 estimates the net effect of these various
differences between the descendants of slave and free blacks.
Daughters of southern-born mothers are themselves more likely to live in the South. We
therefore control for the daughter’s own place of birth (alone and interacted with race) to account
for contemporaneous regional differences in industrial composition or agricultural practice that
may influence women’s labor force participation. We also include a quadratic in age and a
dummy variable for literacy in the vector X.
16 The youngest daughter in the sample was 16 years old in 1900. As long as her mother was 20 years old at the time of her birth, her mother would have been born under slavery.

18
Results for this estimation are reported in Table 3. The first column uses an expansive
definition of the South, while the second column excludes the “border states.”17 In both cases,
we find that black daughters whose mothers spent their first few decades (or more) under slavery
are themselves 5 to 9 percentage points more likely to be in the labor force, even after controlling
for daughter’s region. The relationship is stronger if we contrast daughters whose mothers grew
up in the Deep South to mothers who grew up either under freedom or in a border state. In both
cases, we find that white daughters whose mothers came of age in the antebellum South were
less likely to work outside the home, perhaps because they absorbed a white southern attitude
that work outside of the home was fit only for slaves.18
In the early twentieth century, black women were 27 percentage points more likely than
white women to be in the labor force (see Figure 1C). Therefore, our estimates imply that up to
33 percent of the black-white gap in female LFP may be attributed to the inter-generational
effects of slavery, which include both the direct effect of slavery on household wealth as well as
the indirect effect of slavery on attitudes towards women’s work (= 9/27).
Columns 3 and 4 provide suggestive evidence that mother’s slave status influences
daughter’s work behavior through transmission of attitudes, skills or networks between mother
and daughter, rather than through the direct effect of slavery on later socio-economic status.
Column 3 considers an older cohort of daughters born between 1836 and 1855. Members of this
cohort were old enough to have worked as slaves and absorbed the bundle of norms about and
17 The expansive definition of the South includes all states in the three southern Census regions. The narrower definition excludes the District of Columbia, Delaware, Maryland, Missouri, Oklahoma and West Virginia. Despite the fact that slavery was legal in the border states, the slave population in these areas was unlikely to work on large plantations or in the cultivation of cotton where the norm of women’s work was the most well-developed (Jones, 1985). 18 In the antebellum South, white women primarily engaged in home production. “Southern white women of all classes managed farms, homes, children, and sometimes slaves… they were responsible for tasks such as organizing the household, food production, attending to the medical needs of their families, and educating their own children” (Wayne, 2006, p. 135).

19
skills related to women’s work inherent in the slave system on their own. Therefore, after
controlling for daughter’s own place of birth, we do not expect mother’s place of birth to have an
additional effect on daughter’s work behavior due to transmission between mother and daughter–
and, indeed, we find no association between mother’s slave status and daughter’s labor force
participation in this older cohort. Column 4 looks instead at sons born after Emancipation. We do
not expect a mother’s slave status to influence her son’s propensity to work given the strong
norm of near-universal male LFP in both the slave and non-slave economy. Reassuringly,
mother’s slave status has no effect on son’s behavior either.
Mid-twentieth century data
The nineteenth century data allow us to observe work behavior of the descendants of
slaves and free people in the first generation after Emancipation. It is also of interest to assess
whether the intergenerational continuity of the higher participation rates under slavery lasted
beyond the first generation of black women and can help explain the racial gap in LFP in the
second or third generation after slavery. For this, we examine data from the first cohort of young
women in the National Longitudinal Survey (NLS), which was initiated in 1968. These women
(the daughters, in our analysis) were born between 1944 and 1954; their mothers were typically
born between 1910 and 1930. In other words, many of their mothers belonged to the second
generation after Emancipation, while they belong to the third (or fourth) generation.
At the survey’s inception, women were asked a series of questions about their family
background, including whether or not their mother worked for pay during their own teenage
years. Women were then re-surveyed and asked to report on aspects of their own work and
family life every three years. We investigate a series of associations between the work behavior
20
of a mother and her daughter, asking: Does growing up with a working mother change a
daughter’s expectations about working for pay? Are women whose mothers worked during their
formative years more likely to work themselves? And is this relationship equally strong for all
women or is it particularly powerful for black women, perhaps because the values transmitted by
a working mother are reinforced by more affirming attitudes towards women’s work in the wider
black community?
We address these questions in a set of regressions relating a daughter’s work behavior to
an indicator for whether or not her mother worked when she was 14 years old. In particular, we
estimate:
Daughter’s behavioriy = α + β I(black)i + γ1 I(mother worked at age 14)i + (2)
γ2 [I(mother worked)i * I(black)i] + (X1i ') Δ + (X2iy') Θ + εiy
Our main dependent variable is an indicator variable equal to one if daughter i works for pay in
calendar year y. We estimate this relationship in six separate years, beginning in 1977 when the
typical respondent was 28 years old and ending in 1993, when she was 44 years old. We also
consider other aspects of a daughter’s work and family life that could be influenced by her
mother’s work behavior, including her expectations about engaging in market work in 1968 (at
the modal age of 19) and her marital and fertility history.
The explanatory variable of interest is an indicator for whether a respondent’s mother
worked for pay when she was 14 years old (in the modal year of 1963). We interact this indicator
with a race variable equal to one for black respondents to test whether the association between
mother’s and daughter’s work behavior was stronger in the black community. In some
specifications, we also include vectors of family background characteristics (X1i) or
contemporaneous measures of a daughter’s economic circumstance (X2iy). The family

21
background characteristics include mother’s and father’s educational attainment, father’s
occupation (in four categories), a dummy variable for whether the daughter lived with both of
her parents at age 14, and an indicator for whether the daughter had a library card at age 14, a
common measure of family resources and commitment to education.19 Contemporaneous
economic measures consist of the daughter’s educational attainment, her marital status and the
presence of children in her household. All regressions are weighted to account for the fact that
the NLS oversampled poor households.
Table 4 reports characteristics for the 3,565 daughters in our sample, 24 percent of whom
are black. In 1977, at the average age of 28, 55 percent of the white women and 61 percent of the
black women were in the labor force, a 6 percentage-point gap in participation by race. By 1991,
when the typical respondent was 42 years old, the labor force participation rate rose to 72 percent
for whites and 74 percent for blacks.
The racial gap in LFP was larger among mothers of sample women: 36 percent of white
mothers and 50 percent of black mothers worked for pay when their daughters were 14, in the
modal year of 1963. These figures, which are derived from daughters’ recollections in the first
survey period (1968), match labor force participation rates for married women for this year
reasonably well (according to interpolations between the 1960 and 1970 census years, 35 percent
of white married women and 45 percent of black married women were in the labor force in
1963).
Our family background measures reveal large differences in the socio-economic status of
the households in which white and black respondents were raised. Only 50 percent of black
women held a library card at age 14, compared to 79 percent of white women, and the mothers of
19 We classify father’s occupation into four categories as follows: high white collar (professional, managerial), low white collar (clerical, sales), high blue collar (craftsmen, operatives), low blue collar (service, labor).

22
black women had two fewer years of education than their white counterparts (9.2 versus 11.2
years). By the daughters’ generation, the racial gap in educational attainment had declined but
had not disappeared entirely. Black daughters completed one fewer year of schooling than white
daughters (12.4 versus 13.4 years). In addition, black daughters were more likely to have
children in their twenties (despite little difference in the probability of ever having a child), and
were less likely to be married both in their twenties and in their thirties.
Table 5 investigates the relationship between a daughter’s labor force participation and
her mother’s work behavior in 1977 at the average age of 28. Model 1 contains only dummy
variables for race and for having a working mother during one’s teenage years, and the
interaction between the two. We find that daughters of working mothers are 3.4 percentage
points more likely to be working themselves at age 28; this relationship is statistically significant
at the 10 percent level. Having a working mother has an even stronger effect on one’s own
propensity to be in the labor force for black women although the interaction between race and
mother’s work cannot be statistically distinguished from zero.
These estimates suggest that eight percent of the black-white labor force participation gap
in 1977 can be explained by inter-generational transmission of labor force behavior from mother
to daughter. Black mothers were 14 percentage points more likely than white mothers to be in
the labor force in 1963, and, by our estimate, women with working mothers are 3.4 percentage
points more likely to be in the labor force themselves. Together, these figures imply that inter-
generational transmission can explain eight percent of the black-white participation gap in 1977
(= [0.14 mother’s gap * 0.034 effect of mother’s work] / 0.06 gap).20
20 In Model 1, which contains limited controls, it appears that the effect of mother’s work may be stronger for black daughters. However, after controlling for family background in Model 2, this interaction disappears.

23
Model 2 controls for our family background measures to account for the fact that growing
up with a working mother may be an indication of a family’s socio-economic circumstances,
which could itself influence a daughter’s propensity to work, either through attitudes or through
a daughter’s acquisition of human capital. Daughters from families of higher socio-economic
status – those with a library card or those whose father graduated from high school – are more
likely to work, perhaps because they have more skills and thus can earn higher wages for doing
so. However, these factors have no effect on the core relationship between mother’s and
daughter’s propensity to work.21
Model 3 controls for a daughter’s own educational attainment to assess whether mother’s
work behavior has a direct effect on a daughter’s LFP beyond any indirect effects it may have on
a daughter’s human capital acquisition.22 Daughters who have graduated from high school
(college) are 12 (24) percentage points more likely to be in the labor force than are high school
dropouts. Yet, adding daughter’s educational attainment to the model does not weaken the
relationship between mother’s work behavior and daughter’s labor force attachment. However,
we do note that accounting for a daughter’s educational attainment eliminates any association
between our family background measures and a daughter’s propensity to be in the labor force,
suggesting that the relationship between socio-economic status and labor force participation
operates through investments in human capital.
Model 4 demonstrates that a daughter’s labor force participation is strongly related to her
own family circumstance. Daughters with children in the household are 36 percentage points less
likely to be currently in the labor force. Daughters who never married (or who are widowed or
21 Model 2 requires us to drop the 557 women who do not report one or more of the family background items. Results are nearly unchanged if we re-run Model 1 for this reduced sample. 22 A daughter’s educational aspirations could be directly influenced by her mother’s work behavior; in this sense, educational attainment is an endogenous variable (as are marital and fertility history in Model 4).

24
divorced) are 13 (25) percentage points more likely to be in the labor force than are those who
are currently married. Somewhat surprisingly, accounting for a daughter’s domestic situation
increases the association between a daughter’s and her mother’s labor force participation by 60
percent. This pattern is consistent with findings below demonstrating that daughters of working
mothers are more likely to be currently married and to have a child living at home.
Thus far, we have considered the effect of a mother’s work behavior on her daughter’s
outcomes in 1977 when daughters were in their mid- to late-twenties. The influence of one’s
mother’s example may be strongest in these years because daughters are still relatively young
and thus turning to their parents for guidance. In addition, women’s labor force participation
tends to increase over the lifecycle as their children age, leaving less scope for individual factors
(like differences in mother’s work behavior) to generate differences in outcomes (Goldin, 1990).
Figure 4 graphs the estimated effect of having a working mother on a daughter’s
propensity to be in the labor force according to the baseline specification (Model 1) in six survey
years: 1977, 1982, 1985, 1988, 1991 and 1993. We find a strong and stable association between
a mother’s work behavior and her daughter’s labor force attachment in the 1970s and early
1980s. In these years, daughter in the NLS cohorts are still likely to have young children at home
(average ages of 28, 33 and 36). However, in the late 1980s and 1990s, when the daughters are
older, we no longer find that a daughter’s labor force participation is related to her mother’s
work behavior. The coefficient on mother’s work at age 14, as well as the interaction between
mother’s work and race, fall nearly to zero for daughters between the ages of 39 and 45. Because
we are only able to follow a single cohort in the NLS, we cannot identify whether the declining
association between mother’s and daughter’s work behavior is a period or an age effect. Our data
are consistent with the possibility that the example set by one’s own mother has become less

25
relevant over time as female LFP became more commonplace. Alternatively, it could be that
having a working mother as a role model is particularly important to a woman’s decision to
couple work with childrearing but is less relevant for women without children or women with
older children, many more of whom work outside of the home.
Table 6 explores the channels through which a mother’s work behavior influences her
daughter’s own labor force attachment. Following Goldin (2006), we suspect that having a
working mother changes daughters’ expectations about the course of their own lives. Rather than
presuming that they will marry and specialize in home production, daughters of working mothers
may expect that they too will work outside of the home, as their mothers did. As a result, they
may be more likely to invest in human capital to increase the return to this market work and may
delay marriage until after completing their schooling.
We find some evidence consistent with these conjectures but other patterns that are quite
contrary to them. As expected, column 1 demonstrates that daughters of working mothers are 4.9
percentage points less likely to expect that they will be employed as a housewife when they
reach the age of 35, even after controlling for other family background measures. These
expectations are elicited in the first survey wave when the daughters are, on average, 19 years
old. Yet despite holding more ambitious expectations in their teenage years, daughters of
working mothers do not attain more years of education on average and are no more likely to
graduate from college or attain a post-baccalaureate degree (last result not shown). Even more
surprisingly, mother’s work is associated with a higher probability of ever marrying and, among
those who do marry, with earlier ages of first marriage and first child birth (by 0.5 to 0.6 of a

26
year).23 In contrast, having a father or mother who graduated from high school raises the age of
first marriage and first birth by one to two years, respectively; moreover, living with both parents
in childhood and having a library card at age 14 are also associated with delay of childbearing.
The positive association between mother’s work and early marriage is somewhat of a
puzzle. Perhaps daughters whose mothers worked outside of the home have adopted a more
equitable view of marriage and do not associate marriage with specialization in home production.
In that case, the cost of marrying in terms of foregone earnings or independence would be lower
and therefore these daughters would be more likely to marry and to do so at younger ages.
Alternatively, this early marriage may simply reflect the fact that poorer families are more likely
to have two working parents and that daughters from a lower socio-economic status background
are more likely to marry and engage in childbearing at younger ages (although this interpretation
would be difficult to reconcile with the higher levels of educational attainment at the top end of
the attainment distribution).
4. Conclusion
Large racial differences in women’s labor force participation persisted for more than 100
years after the Civil War. Following Goldin (1977), we hypothesize that these differences might,
in part, reflect an indirect legacy of slavery that operated through differences in social norms
about women’s work in arduous occupations. We find that well into the twentieth century only a
portion of the racial difference in women’s LFP (or in their work specifically in physically
demanding jobs) can be attributed to differences in observable characteristics, which is
23 That daughters of working mothers marry at younger ages (and, for this reason, are less likely to be in the labor force) explains why controlling for marital status augments the relationship between mother’s work and daughter’s labor force participation in Table 5.

27
consistent with the presence of some persistent propensity toward work outside of the home that
initially derived from the institution of slavery.
Two separate analyses further test the inter-generational transmission of female labor
force participation. In 1900, it appears that women born to ex-slaves were significantly more
likely than other black women to be in the labor force. Later in the twentieth century, the NLS
data reveal that daughters of working mothers were more likely to work themselves even when
controlling for a number of background characteristics.
The structural transformation of the US economy and rapid gains in educational
attainment greatly expanded the scope for women’s work in relatively “clean” jobs. White
women started moving into such jobs in the early decades of the twentieth century, but black
women did not make large inroads in white-collar work until after World War II. Thereafter,
participation rates for both white and black women increased as white-collar jobs became more
prevalent, such that by the end of the twentieth century, the racial gap in women’s labor force
participation had greatly narrowed. A small residual difference remained in terms of employment
in more arduous occupations, perhaps a last trace of a long-standing difference in social norms
with respect to such work.

28
References Bailey, Martha J. and William J. Collins. 2006. “The Wage Gains of African-American Women in the 1940s.” Journal of Economic History 66, 3: 737-777. Blau, Francine D., Lawrence M. Kahn, Albert Yung-Hsu Liu, and Kerry L. Papps. 2012. “The Transmission of Women’s Fertility, Human Capital and Work Orientation Across Immigrant Generations.” Journal of Population Economics. Blau, Francine D. and Lawrence M. Kahn. “Changes in the Labor Supply Behavior of Married Women: 1980-2000.” Journal of Labor Economics 25: 393-438
Bowen, William G. and T. Aldrich Finegan. 1969. The Economics of Labor Force Participation. Princeton, NJ: Princeton University Press. Collins, William J. 2003. “The Labor Market Impact of State-level Anti-discrimination Laws, 1940-1960.” Industrial and Labor Relations Review 56 (2): 244-272. Collins, William J. and Robert A. Margo. 2006. “Historical Perspectives on Racial Differences in Schooling in the United States.” In E. Hanushek and F. Welch (eds.), Handbook of the Economics of Education, Volume 1, 107-154. Amsterdam: North-Holland. Farré, Lidia and Francis Vella. 2007. “The Intergenerational Transmission of Gender Role Attitudes and Its Implications for Female Labor Force Participation.” IZA Discussion Paper 2802. Fernández, Raquel and Alessandra Fogli. 2009. “Culture: An Empirical Investigation of Beliefs, Work, and Fertility.” American Economic Journal: Macroeconomics 1(1): 146-177. Fortin, Nicole M. 2008. “The Gender Wage Gap among Young Adults in the United States: The Importance of Money versus People.” Journal of Human Resources XLIII (4): 884-918. Fortin, Nicole M., Thomas Lemieux, and Sergio Firpo. 2011. “Decomposition Methods.” In O. Ashenfelter and D. Card (eds.), Handbook of Labor Economics, Volume 4A, 1-102. Amsterdam: North-Holland. Fraundorf, Martha Norby. 1979. “The Labor Force Participation of Turn-of-the-Century Married Women.” Journal of Economic History 39: 401-418. Goldin, Claudia. 1977. “Female Labor Force Participation: The Origin of Black and White Differences, 1870 to 1880.” Journal of Economic History 37, 1: 87-108. Goldin, Claudia. 1989. “Life-Cycle Labor Force Participation by Married Women: Historical Evidence and Implications.” Journal of Labor Economics 7: 20-47. Goldin, Claudia. 1990. Understanding the Gender Gap: An Economic History of American Women. New York, NY: Oxford University Press.

29
Goldin, Claudia. 1995. “The U-Shaped Female Labor Force Function in Economic Development and Economic History.” In T. Paul Schultz, ed., Investment in Women’s Human Capital. Chicago, IL: University of Chicago Press. Gronau, Reuben. 1977. “Leisure, Home Production, and Work—the Theory of the Allocation of Time Revisited.” Journal of Political Economy 85, 6: 1099-1124. Jann, Ben. 2008. “The Blinder-Oaxaca Decomposition for Linear Regression Models.” Stata Journal 8 (4): 453-479. Jones, Jacqueline. 1985. Labor of Love, Labor of Sorrow: Black Women, Work, and the Family from Slavery to the Present. New York: Basic Books. Killingsworth, Mark R. and James J. Heckman. 1986. “Female Labor Supply: A Survey.” In O. Ashenfelter and R. Layard (eds.), Handbook of Labor Economics, Volume 1, pp. 103-204. Amsterdam: Elsevier. Margo, Robert A. 2004. “The North-South Wage Gap Before and After the Civil War.” In D. Eltis, F. Lewis, and K. Sokoloff (eds.), Slavery in the Development of the Americas, pp. 324-351. New York: Cambridge University Press. Mincer, Jacob. 1962. “Labor Force Participation of Married Women.” In Aspects of Labor Economics. National Bureau of Economic Research. Princeton, NJ: Princeton University Press. Moen, Phyllis, Mary Ann Erickson and Donna Dempster-McClain. 1997. “Their Mother’s Daughters? The Intergenerational Transmission of Gender Attitudes in a World of Changing Roles.” Journal of Marriage and the Family 59(2): 281-293. Ransom, Roger L. and Richard Sutch. 2001 [1977]. One Kind of Freedom: The Economic Consequences of Emancipation. New York, NY: Cambridge University Press. Reimers, Cordelia W. 1985. “Cultural Differences in Labor Force Participation among Married Women.” American Economic Review, Papers and Proceedings 75, 2: 251-255. Roberts, Evan Warwick. 2007. Her Real Sphere? Married Women’s Labor Force Participation in the United States, 1860-1940. Ph.D. thesis, University of Minnesota. Rotella, Elyce. 1980. “Women’s Labor Force Participation and the Decline of the Family Economy in the United States.” Explorations in Economic History 17: 95-117. Ruggles, Steven, Trent Alexander, Katie Genadek, Ronald Goeken, Matthew B. Schroeder, and Matthew Sobek. 2010. Integrated Public Use Microdata Series: Version 5.0 [Machine-readable database]. Minneapolis, MN: University of Minnesota.

30
Sacerdote, Bruce. 2005. “Slavery and the Intergenerational Transmission of Human Capital.” Review of Economics and Statistics 87, 2: 217-234. Sobek, Matthew Joseph. 1997. A Century of Work: Gender, Labor Force Participation, and Occupational Attainment in the United States, 1880-1990. Ph.D. thesis, University of Minnesota. Sundstrom, William A. 2000. “From Servants to Secretaries: The Occupations of African-American Women, 1940-1980.” Unpublished paper, Santa Clara University. Wayne, Tiffany K. 2006. Women’s Roles in Nineteenth Century America. Santa Barbara, CA: ABC-Clio. Weiss, Thomas. 1999. “Estimates of White and Nonwhite Gainful Workers in the United States by Age Group, Race, and Sex: Decennial Census Years, 1800-1900.” Historical Methods 32: 21-35. Wilson, William Julius. 1990. The Truly Disadvantaged: The Inner City, the Underclass, and Public Policy. Chicago, IL: University of Chicago Press.

31
Figure 1A: White Women’s Labor Force Participation, 1870-2010
Figure 1B: Black Women’s Labor Force Participation, 1870-2010
0
10
20
30
40
50
60
70
80
90
100
1870
1880
1890
1900
1910
1920
1930
1940
1950
1960
1970
1980
1990
2000
2010
Married and In Labor Force Not Married and In Labor Force
Not Married and Not In Labor Force Married and Not In Labor Force
0
10
20
30
40
50
60
70
80
90
100
1870
1880
1890
1900
1910
1920
1930
1940
1950
1960
1970
1980
1990
2000
2010
Married and In Labor Force Not Married and In Labor Force
Not Married and Not In Labor Force Married and Not In Labor Force

32
Figure 1C: Levels and Gaps in Overall LFP among Women, 1870 to 2010
Notes: The sample includes women ages 25 to 54. From 1870 to 1930, “participation” is determined by whether the person reported a “gainful occupation”. See the text for discussion of this issue. The 1910 census counted gainful occupations (especially for black women in agriculture) in a manner that appears to be inconsistent with earlier or later practice and is therefore omitted here. We define “married” as “married and spouse present.” In 1870, the IPUMS does not include a marital status variable, and so “married” is determined by whether the relation to household head is “spouse.”
0
10
20
30
40
50
60
70
80
90
100
1870
1880
1890
1900
1910
1920
1930
1940
1950
1960
1970
1980
1990
2000
2010
White LFP Black LFP
gap=27gap=14

33
Figure 2A: White Women’s LFP and Occupational Distribution, 1870-2010
Figure 2B: Black Women’s LFP and Occupational Distribution, 1870-2010
0
10
20
30
40
50
60
70
80
90
100
1870
1880
1890
1900
1910
1920
1930
1940
1950
1960
1970
1980
1990
2000
2010
Professional/Clerical/Manager/Sales Agricultural
Craft/Operative/Laborer Household and Non-HH Service
Not In Labor Force
0
10
20
30
40
50
60
70
80
90
100
1870
1880
1890
1900
1910
1920
1930
1940
1950
1960
1970
1980
1990
2000
2010
Professional/Clerical/Manager/Sales Agricultural
Craft/Operative/Laborer Household and Non-HH Service
Not In Labor Force

34
Figure 3A: Regression-Adjusted Black-White Gap in Labor Force Participation, All Women
Figure 3B: Regression Adjusted Black-White Gap in “Dirty Jobs,” All Women
Notes: “Dirty jobs” are defined as craft, operative, laborer, household service, and non-household-service (e.g., janitors, cleaners, hospital attendants, cooks, waitresses), as opposed to “clean jobs” in the categories of professional, clerical, managerial, and sales, and the not-in-labor force category.
-0.05
0.00
0.05
0.10
0.15
0.20
0.25
0.30
0.35
1880
1890
1900
1910
1920
1930
1940
1950
1960
1970
1980
1990
2000
2010
Unadjusted gap Adj. gap (lit) Adj. gap (educ)
-0.05
0.00
0.05
0.10
0.15
0.20
0.25
0.30
0.35
1880
1890
1900
1910
1920
1930
1940
1950
1960
1970
1980
1990
2000
2010
Unadjusted gap Adj. gap (lit) Adj. gap (educ)

35
Figure 4: Relationship Between Work Behavior of Mothers and Daughters, Coefficients from Regressions using NLS data, 1977-1993
Notes: Coefficients on ‘mother works’ and the interaction of ‘mother works’ and a dummy variable for ‘black.’ Estimates of regression reported in Table 5, Model 4 for each survey wave between 1977 and 1993. Modal daughter is 28 years old in 1977 and 44 years old in 1993.

36
Table 1: Race and Labor Force Participation in 1870 Dependent variable =1 if in labor force 1 2 3 Panel A: All women, 25-54 All U.S. 0.284
(0.0288) 0.284
(0.0230) 0.243
(0.0333) All South 0.320
(0.0277) 0.303
(0.272) 0.269
(0.0196) Non-farm South 0.329
(0.0344) 0.307
(0.0317) 0.289
(0.0269) Panel B: Married women, 25-54 All U.S. 0.233
(0.0357) 0.212
(0.0316) 0.171
(0.0245) All South 0.253
(0.0364) 0.234
(0.0349) 0.167
(0.0234) Non-farm South 0.283
(0.0411) 0.245
(0.0372) 0.193
(0.0270) Controls for age and birthplace no yes yes Additional controls no no yes Notes and sources: Data are from the IPUMS (Ruggles et al. 2010) sample for 1870. The IPUMS coding of labor force participation is taken at face value. Standard errors are clustered by state of birth. The base sample includes all white and black women age 25 to 54. Column 1’s specification includes only the race dummy, giving the unadjusted difference in participation rates. Column 2 adds fixed effects for state of birth and age. Column 3 adds controls for several other observables, including literacy, the number of own children under 5, the number of own children over 5 (in household), marital status, city-resident status (based on IPUMS “metro” variable), farm-resident status, household wealth (four categories), and (if married with spouse present) husband’s occupation. Wealth is the combination of real and personal property value.

37
Table 2: Linear Probability Models of LFP, 1880-2000
Dependent variable=1 if in labor force 1880 1900 1920 1940a 1940b 1960 1980 2000
Black 0.267
(0.019) 0.223
(0.011) 0.230
(0.009) 0.112
(0.008) 0.120
(0.008) 0.076
(0.008) 0.054
(0.009) 0.001
(0.011) Husband Categories
Absent spouse -0.091 -0.133 -0.176 -0.179 -0.165 -0.236 -0.101 -0.097 Separated --- --- --- --- --- -0.013 0.016 0.017 Divorced -0.012 0.033 0.016 0.007 0.019 0.080 0.109 0.047 Widowed -0.087 -0.055 -0.110 -0.129 -0.115 -0.031 -0.017 -0.064 Professional -0.359 -0.501 -0.574 -0.497 -0.501 -0.311 -0.097 -0.051 Farmer -0.261 -0.440 -0.482 -0.452 -0.439 -0.319 -0.159 -0.015 Craftsmen -0.362 -0.500 -0.572 -0.507 -0.490 -0.288 -0.087 -0.020 Operatives -0.363 -0.494 -0.550 -0.468 -0.448 -0.233 -0.056 -0.015 Service (hh) 0.015 -0.206 -0.292 -0.206 -0.189 -0.126 0.092 Service (non-hh) -0.386 -0.510 -0.535 -0.455 -0.438 -0.197 -0.015 0.015 Farm Laborer -0.297 -0.461 -0.501 -0.446 -0.426 -0.224 -0.084 -0.010 Laborer -0.365 -0.496 -0.538 -0.490 -0.468 -0.230 -0.048 -0.010 Doesn’t work -0.336 -0.453 -0.497 -0.403 -0.389 -0.253 -0.136 -0.146
Literate -0.016 -0.009 0.001 0.049 --- --- --- --- Years of school
N/A or none --- --- --- --- -0.131 -0.347 -0.366 -0.299 1-4 years --- --- --- --- -0.070 -0.182 -0.216 -0.206 5-8 years --- --- --- --- -0.049 -0.095 -0.175 -0.257 9 years --- --- --- --- -0.036 -0.051 -0.148 -0.214 10 years --- --- --- --- -0.026 -0.035 -0.113 -0.173 11 years --- --- --- --- -0.026 -0.016 -0.081 -0.160 12 years (omitted) --- --- --- --- 1 year college --- --- --- --- 0.012 0.012 0.041 0.063 2-3 years college --- --- --- --- 0.040 0.028 0.050 0.103 4 years college --- --- --- --- 0.068 0.074 0.077 0.110 5+ years college --- --- --- --- 0.123 0.179 0.161 0.170
1 child under 5 -0.022 -0.026 -0.061 -0.138 -0.139 -0.221 -0.223 -0.129 2 child under 5 -0.032 -0.040 -0.075 -0.162 -0.162 -0.303 -0.383 -0.253 3+ child under 5 -0.036 -0.042 -0.087 -0.173 -0.171 -0.341 -0.462 -0.333 1 child over 4 -0.021 -0.016 -0.034 -0.076 -0.071 -0.057 -0.038 0.011 2 children over 4 -0.021 -0.013 -0.041 -0.106 -0.099 -0.105 -0.075 -0.012 3+ children over 4 -0.029 -0.011 -0.034 -0.111 -0.101 -0.124 -0.105 -0.056 N 81662 131920 198743 277727 277727 342983 423501 537356 Notes and sources: Data are from IPUMS (Ruggles et al. 2010), and we take the IPUMS coding of labor force participation at face value. The sample includes all women, age 25 to 54. All regressions include fixed effects for state of birth and age, city-resident status (based on IPUMS “metro” variable), and farm-resident status. The omitted “husband category” consists of single, never married women. Occupation categories are based on the IPUMS “occ1950” codes. The omitted educational attainment category (highest grade completed) is 12 years. Standard errors clustered by state of birth are reported under the coefficient for “black”; others are omitted to save space but the full results are available on request.

38
Table 3: Mother’s slave status and daughter’s LFP, 1900
Dependent variable = 1 if in the labor force Gender Women Women Women MenBirth cohort Born after Born after Born before Born afterRegion Full South Deep South Deep South Deep SouthMother south * black 0.045 0.092 0.004 0.004 (0.014) (0.012) (0.013) (0.008) Mother born in south -0.092 -0.105 -0.002 -0.004 (0.003) (0.004) (0.003) (0.002) Born south * black 0.186 0.113 0.046 0.045 (0.013) (0.011) (0.013) (0.007) Born in south -0.054 -0.044 0.029 0.011 (0.003) (0.004) (0.003) (0.002) Black 0.094 0.134 0.234 -0.017 (0.010) (0.006) (0.007) (0.004) N 440,177 440,177 220,497 445,387Ages in 1900 16-34 16-34 45-64 16-34Notes: Estimates from 1900 IPUMS 5 percent sample. Columns (1) and (2) include daughters born after Emancipation (birth cohorts of 1866 to 1884). Column (3) contains daughters born before Emancipation (birth cohorts of 1836 to 1855). Column (4) contains sons born after Emancipation. In column (1), the ‘South’ includes all states in the three southern Census regions. In columns (2)-(4), the ‘South’ excludes the border states of DC, DE, MD, MO, OK and WV. All regressions include a quadratic in sons or daughter’s age and an indicator for literacy.

39
Table 4: Summary statistics for NLS sample
Variable Whites Blacks Age in 1977 27.71 27.63 (3.13) (3.11) 2731 834 LFP in 1977 0.55 0.61 (0.50) (0.49) LFP in 1991 0.72 0.74 (0.45) (0.44) 2236 592 Mother worked at age 14 0.36 0.50 (0.48) (0.50) Years of education (1982) 13.37 12.36 (2.42) (2.48) 2421 718 Any children in 1977 0.66 0.73 (0.47) (0.44) Any children in 1991 0.73 0.74 (0.44) (0.44) Currently married in 1977 0.76 0.50 (0.43) (0.50) Currently married in 1991 0.74 0.40 (0.44) (0.49) Library card at age 14 0.79 0.50 (0.41) (0.50) Mother's years of education 11.23 9.25 (2.74) (3.03) 2530 701
Notes: Cells report sample means with standard deviations in parentheses. The number of observations used to calculate means for selected variables are reported in italics to demonstrate attrition over time.

40
Table 5: Mother’s work and daughter’s LFP in 1977 (At average age = 28) Dependent variable = 1 if in labor force
Model 1 Model 2 Model 3 Model 4
Mother worked (R aged 14) 0.034* 0.036* 0.033* 0.054*** (0.018) (0.020) (0.020) (0.018) Mother worked x black 0.031 0.007 0.006 0.014 (0.056) (0.064) (0.063) (0.058) Black 0.041 0.087* 0.078* 0.034 (0.039) (0.046) (0.046) (0.042) Library card at 14 0.041* 0.009 -0.009 (0.024) (0.024) (0.022) Mother’s education 9-12 -0.003 -0.031 -0.028 (0.026) (0.026) (0.024) Mother’s education >12 0.005 -0.056 -0.063* (0.036) (0.036) (0.033) Father’s education 9-12 0.037 0.017 0.000 (0.024) (0.024) (0.022) Father’s education > 12 0.078** 0.034 -0.003 (0.033) (0.033) (0.031) Lives w/ both parents (age 14) 0.011 -0.016 -0.010 (0.040) (0.039) (0.036) Own education = 12 0.124*** 0.112*** (0.031) (0.029) Own education >13 0.258*** 0.165*** (0.033) (0.031) Any children -0.360*** (0.021) Previously married 0.251*** (0.027) Never married 0.133*** (0.027)

41
Constant 0.487*** 0.319*** 0.237*** 0.594*** (0.030) (0.059) (0.060) (0.044) Dummies for father’s occup. N Y Y Y Observations 3565 2994 2994 2990 * significant at 10%; ** significant at 5%; *** significant at 1%
Notes: Cells report coefficients from a regression of daughter’s labor force participation in 1977 on mother’s work and other covariates for the NLS sample. Standard errors are reported in parentheses. In addition to the reported covariates, all regressions include dummy variables for daughter’s age in 1977 (average = 28 years old). Mother’s work activity and other family background characteristics are reported by the daughter in 1968 and refer to the year in which the daughter was 14 years old. The daughter characteristics added in Models 3 and 4 are measured in 1977.

42
Table 6: Mother’s work and other daughter outcomes
Dependent variables
Expectation housewife
Highest grade
College degree
Evermarried
Age at first marriage
Age at firstbirth
Mother worked -0.049** 0.017 -0.006 0.017* -0.637*** -0.491** (0.019) (0.091) (0.017) (0.010) (0.187) (0.243) Mom work x black 0.015 0.005 0.042 0.009 -0.290 0.028 (0.064) (0.300) (0.056) (0.031) (0.647) (0.770) Black -0.237*** 0.145 0.007 -0.096*** 1.695*** -0.520 (0.046) (0.218) (0.041) (0.023) (0.476) (0.561) Library card at 14 0.005 0.891*** 0.064*** -0.011 0.585*** 0.825*** (0.023) (0.110) (0.021) (0.011) (0.223) (0.287) Mother’s educ 9-12 0.052** 0.602*** 0.050** 0.021* -0.227 0.925*** (0.026) (0.120) (0.023) (0.012) (0.246) (0.315) Mother’s educ > 12 0.035 1.641*** 0.240*** 0.024 0.583* 2.679*** (0.035) (0.165) (0.031) (0.017) (0.342) (0.440) Father’s educ 9-12 -0.006 0.432*** 0.053** -0.029** 1.140*** 0.521* (0.023) (0.110) (0.021) (0.011) (0.225) (0.288) Father’s educ > 12 -0.001 1.122*** 0.184*** -0.043*** 1.659*** 1.585*** (0.032) (0.153) (0.029) (0.016) (0.315) (0.407) Lived with 2 parents -0.028 0.770*** 0.101*** -0.004 0.072 1.049** (0.039) (0.182) (0.034) (0.019) (0.373) (0.477) Constant 0.588*** 11.348*** 0.088* 0.972*** 20.102*** 20.369*** (0.057) (0.274) (0.052) (0.029) (0.561) (0.705)Observations 2735 2636 2636 2913 2720 2608* significant at 10%; ** significant at 5%; *** significant at 1% Notes: Regression follow the format of Model 2 in Table 5, with the exception of the dependent variables. ‘Expectation housewife’ is measured from a survey question of what the daughters expect to be doing at age 35. The question is asked in 1968, when the daughters were, on average, 19 years old. ‘Highest grade’ and ‘ever married’ are measured in 1982 when the daughters were, on average, 33 years old. ‘College degree’ is constructed from ‘highest grade’ and is equal to one for women who completed 16 years or more of schooling.

43
Appendix Table A1: Women’s Labor Force Participation, by Race, 1870-2010
1870 1880 1900 1920 1930 1940 1950 1960 1970 1980 1990 2000 2010 Panel A: White women, age 25-54 In LF and married 0.60 1.27 1.58 4.15 6.42 10.09 17.99 27.62 34.48 43.04 49.53 48.29 44.71 In LF and not married 7.93 8.05 13.02 14.72 14.66 16.15 13.88 12.31 13.60 19.22 25.22 26.90 32.32 Not in LF and not married 20.52 17.08 13.77 9.76 8.88 8.70 6.53 4.90 5.25 4.96 4.93 6.14 7.86 Not in LF and married 70.96 73.61 71.63 71.36 70.03 65.06 61.60 55.17 46.66 32.78 20.32 18.68 15.11 Overall LFP 8.52 9.31 14.60 18.88 21.08 26.24 31.87 39.93 48.08 62.26 74.75 75.18 77.03 Percent of married in LF 0.83 1.69 2.16 5.50 8.40 13.43 22.60 33.36 42.50 56.77 70.91 72.11 74.74 Percent of not-married in LF 27.87 32.02 48.60 60.14 62.26 64.99 68.01 71.55 72.13 79.49 83.64 81.41 80.44 Share of married in pop. 71.55 74.88 73.21 75.52 76.46 75.16 79.59 82.79 81.15 75.83 69.84 66.96 59.82 Panel B: Black women, age 25-54 In LF and married 13.81 17.59 13.68 20.61 19.84 17.72 21.90 28.39 31.97 32.51 29.56 26.89 23.89 In LF and not married 23.10 21.66 27.12 24.89 26.56 27.15 23.98 25.01 27.14 36.09 45.35 46.19 55.68 Not in LF and not married 16.60 11.01 7.78 6.97 8.71 12.38 14.80 13.35 16.22 17.33 17.14 18.23 15.19 Not in LF and married 46.49 49.74 51.42 47.53 44.89 42.75 39.31 33.26 24.67 14.07 7.95 8.69 5.24 Overall LFP 36.91 39.25 40.80 45.50 46.40 44.87 45.88 53.40 59.11 68.60 74.91 73.08 79.56 Percent of married in LF 22.90 26.12 21.02 30.25 30.65 29.30 35.78 46.05 56.44 69.80 78.80 75.57 82.00 Percent of not-married in LF 58.20 66.30 77.70 78.13 75.30 68.68 61.83 65.21 62.59 67.56 72.57 71.70 78.56 Share of married in pop. 60.30 67.33 65.10 68.14 64.74 60.47 61.21 61.64 56.64 46.58 37.51 35.58 29.13 Panel C: U.S.-born white women, age 25-54 In LF and married 0.47 1.01 1.47 3.85 6.37 9.94 18.02 27.61 34.65 43.43 50.04 49.17 45.63 In LF and not married 6.40 6.96 12.86 15.26 15.24 16.66 13.86 12.16 13.55 19.32 25.36 27.32 32.80 Not in LF and not married 23.22 18.88 14.70 10.38 9.20 8.62 6.29 4.83 5.13 4.67 4.78 5.83 7.67 Not in LF and married 69.91 73.15 70.97 70.51 69.19 64.77 61.84 55.39 46.67 32.58 19.82 17.68 13.90 Overall LFP 6.87 7.97 14.33 19.11 21.61 26.60 31.87 39.77 48.20 62.75 75.40 76.49 78.43 Percent of married in LF 0.67 1.36 2.03 5.18 8.43 13.31 22.56 33.26 42.61 57.13 71.63 73.56 76.66 Percent of not-married in LF 21.60 26.93 46.65 59.51 62.35 65.89 68.78 71.57 72.53 80.54 84.15 82.41 81.05 Share of married in pop. 70.38 74.17 72.44 74.36 75.56 74.71 79.85 83.00 81.32 76.01 69.86 66.85 59.53
Notes and sources: Microdata are from IPUMS (Ruggles et al. 2010). “Overall LFP” is the sum of “In LF and married” and “In LF and not married” categories. Participation rate conditional on marital status are reported in row labeled “Percent of married in LF” and so on.

44
Appendix Table A2: Alternative Series of Women’s Labor Force Participation, by Race, 1870-1920
1870 1880 1900 1910 1920 1930 1940 Based on 1920 cell-specific rates White Women 11.47 12.14 15.75 17.80 18.88 20.77 25.51
Married 2.79 3.11 3.24 4.78 5.50 8.09 12.48 Single 37.16 39.04 49.94 55.52 60.14 61.93 64.94
Black Women 40.39 41.86 43.95 49.52 45.50 47.65 47.66 Married 28.05 29.06 25.92 33.80 30.25 32.16 31.80 Single 62.81 68.23 77.60 81.54 78.13 76.08 71.93
Based on 1940 cell-specific rates White Women 13.07 13.72 17.09 19.07 19.94 21.69 26.24
Married 4.91 5.24 5.08 6.49 6.88 9.27 13.43 Single 37.21 39.00 49.90 55.55 60.21 62.02 64.99
Black Women 38.37 38.71 39.73 45.60 41.39 44.45 44.87 Married 26.72 26.20 22.06 30.09 26.51 29.37 29.30 Single 59.53 64.50 72.68 77.19 73.20 72.13 68.68
Based on 1960 cell-specific rates White Women 22.48 23.13 25.04 26.00 26.08 26.71 30.69
Married 15.58 15.98 14.23 14.47 13.93 14.94 18.52 Single 42.89 44.45 54.59 59.45 63.54 64.96 67.51
Black Women 40.25 42.06 43.18 49.22 45.02 47.42 47.29 Married 30.69 32.26 29.09 36.88 33.34 35.21 34.45 Single 57.62 62.26 69.46 74.35 70.00 69.82 66.93
Notes and sources: Microdata are from IPUMS (Ruggles et al. 2010). To create an alternative LFP series back to 1870, we first estimate within-cell participation rates for all women (25-54) in 1920, 1940, and 1960 categorized by interactions of race, farm, south, married, and has-boarders status. “Has boarders” is 1 for women who are household heads or spouses of household heads who reside with at least one person whose relation is coded “other non-family” in the IPUMS. Then, for women who lived on farms or had boarders in each census year, we replaced their IPUMS reported LFP with the cell-specific rate observed in 1920, 1940, or 1960.
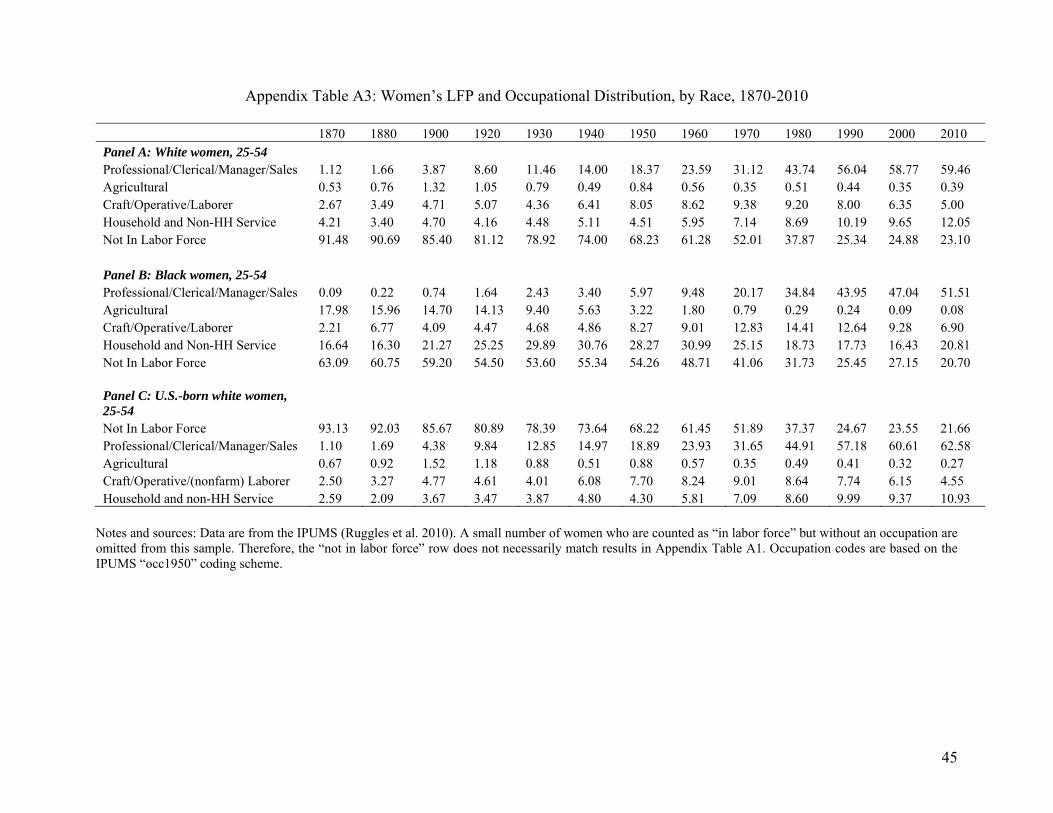
45
Appendix Table A3: Women’s LFP and Occupational Distribution, by Race, 1870-2010
1870 1880 1900 1920 1930 1940 1950 1960 1970 1980 1990 2000 2010 Panel A: White women, 25-54 Professional/Clerical/Manager/Sales 1.12 1.66 3.87 8.60 11.46 14.00 18.37 23.59 31.12 43.74 56.04 58.77 59.46 Agricultural 0.53 0.76 1.32 1.05 0.79 0.49 0.84 0.56 0.35 0.51 0.44 0.35 0.39 Craft/Operative/Laborer 2.67 3.49 4.71 5.07 4.36 6.41 8.05 8.62 9.38 9.20 8.00 6.35 5.00 Household and Non-HH Service 4.21 3.40 4.70 4.16 4.48 5.11 4.51 5.95 7.14 8.69 10.19 9.65 12.05 Not In Labor Force 91.48 90.69 85.40 81.12 78.92 74.00 68.23 61.28 52.01 37.87 25.34 24.88 23.10 Panel B: Black women, 25-54 Professional/Clerical/Manager/Sales 0.09 0.22 0.74 1.64 2.43 3.40 5.97 9.48 20.17 34.84 43.95 47.04 51.51 Agricultural 17.98 15.96 14.70 14.13 9.40 5.63 3.22 1.80 0.79 0.29 0.24 0.09 0.08 Craft/Operative/Laborer 2.21 6.77 4.09 4.47 4.68 4.86 8.27 9.01 12.83 14.41 12.64 9.28 6.90 Household and Non-HH Service 16.64 16.30 21.27 25.25 29.89 30.76 28.27 30.99 25.15 18.73 17.73 16.43 20.81 Not In Labor Force 63.09 60.75 59.20 54.50 53.60 55.34 54.26 48.71 41.06 31.73 25.45 27.15 20.70 Panel C: U.S.-born white women, 25-54 Not In Labor Force 93.13 92.03 85.67 80.89 78.39 73.64 68.22 61.45 51.89 37.37 24.67 23.55 21.66 Professional/Clerical/Manager/Sales 1.10 1.69 4.38 9.84 12.85 14.97 18.89 23.93 31.65 44.91 57.18 60.61 62.58 Agricultural 0.67 0.92 1.52 1.18 0.88 0.51 0.88 0.57 0.35 0.49 0.41 0.32 0.27 Craft/Operative/(nonfarm) Laborer 2.50 3.27 4.77 4.61 4.01 6.08 7.70 8.24 9.01 8.64 7.74 6.15 4.55 Household and non-HH Service 2.59 2.09 3.67 3.47 3.87 4.80 4.30 5.81 7.09 8.60 9.99 9.37 10.93
Notes and sources: Data are from the IPUMS (Ruggles et al. 2010). A small number of women who are counted as “in labor force” but without an occupation are omitted from this sample. Therefore, the “not in labor force” row does not necessarily match results in Appendix Table A1. Occupation codes are based on the IPUMS “occ1950” coding scheme.

46
Appendix Table A4: Women’s Detailed Occupational Distribution, 1870-2010
1870 1880 1900 1920 1930 1940 1950 1960 1970 1980 1990 2000 2010 Panel A: White women, 25-54 0 Not in Labor Force 91.48 90.69 85.40 81.12 78.92 74.00 68.23 61.28 52.01 37.87 25.34 24.88 23.10 1 Professional 0.73 1.06 2.01 3.03 3.83 4.12 4.57 5.62 8.71 13.79 20.04 23.77 25.36 1.5 Teacher 0.57 0.80 1.32 1.77 2.24 2.26 2.03 2.44 3.34 4.78 5.62 5.54 5.81 1.6 Other professions 0.16 0.27 0.68 1.26 1.59 1.86 2.54 3.18 5.37 9.02 14.42 18.23 19.55 2 Clerical 0.03 0.05 0.73 3.37 4.80 6.45 9.15 12.73 16.73 21.21 22.19 20.01 18.92 3 Craft 0.32 0.30 0.39 0.44 0.37 0.45 0.65 0.61 0.98 1.49 1.70 1.47 1.13 4 Operative 2.31 3.04 4.11 4.25 3.65 5.71 7.19 7.81 7.97 6.99 5.36 4.20 3.17 4.5 Manufacturing 0.87 1.19 1.54 2.71 2.55 4.53 5.90 6.68 6.61 5.51 3.66 2.62 1.64 4.6 Laundry 0.01 0.05 0.09 0.20 0.31 0.35 0.44 0.36 0.23 0.12 0.12 0.09 0.07 4.7 Other Operatives 1.43 1.80 2.48 1.34 0.79 0.83 0.84 0.77 1.13 1.36 1.59 1.50 1.45 5 Laborer 0.04 0.15 0.21 0.37 0.33 0.25 0.22 0.20 0.42 0.72 0.94 0.67 0.70 6 Service Household 3.80 2.76 3.20 2.31 2.15 2.20 0.91 0.93 0.61 0.40 0.41 --- --- 7 Service Non-Household 0.41 0.65 1.50 1.85 2.32 2.91 3.60 5.02 6.52 8.29 9.78 9.65 12.05 8 Manager 0.25 0.39 0.53 0.73 0.96 1.29 1.65 1.73 1.87 4.68 9.01 10.29 10.48 9 Sales 0.10 0.16 0.60 1.46 1.87 2.14 3.01 3.51 3.80 4.05 4.80 4.71 4.69 10 Farmers and farm laborers 0.53 0.76 1.32 1.05 0.79 0.49 0.84 0.56 0.35 0.51 0.44 0.35 0.39
Panel B: Black women, 25-54 0 Not in Labor Force 63.09 60.75 59.20 54.50 53.60 55.34 54.26 48.71 41.06 31.73 25.45 27.15 20.70 1 Professional 0.02 0.12 0.43 0.95 1.53 2.12 2.77 4.13 7.92 12.23 14.76 17.11 19.46 1.5 Teacher 0.02 0.10 0.37 0.76 1.15 1.69 1.72 2.36 3.52 4.72 4.44 3.81 4.09 1.6 Other professions 0.00 0.01 0.06 0.20 0.38 0.44 1.04 1.77 4.39 7.52 10.32 13.30 15.37 2 Clerical 0.00 0.01 0.05 0.25 0.31 0.50 1.90 3.97 9.96 18.40 21.54 20.15 19.99 3 Craft 0.00 0.06 0.05 0.07 0.14 0.21 0.32 0.42 0.93 1.65 2.09 1.69 1.25 4 Operative 0.54 0.85 1.65 3.02 3.54 4.02 7.10 8.00 11.07 11.43 9.27 6.66 4.81 4.5 Manufacturing 0.12 0.15 0.15 1.04 1.13 1.85 3.71 4.58 7.97 9.16 6.73 4.37 2.47 4.6 Laundry 0.00 0.06 0.43 0.62 1.45 1.21 2.35 2.26 1.53 0.51 0.38 0.25 0.15 4.7 Other Operatives 0.42 0.63 1.06 1.36 0.96 0.95 1.04 1.16 1.57 1.77 2.17 2.04 2.18 5 Laborer 1.67 5.87 2.38 1.38 1.00 0.64 0.84 0.59 0.84 1.33 1.27 0.93 0.85 6 Service Household 14.30 12.91 15.01 21.02 24.85 26.07 19.24 18.82 9.70 2.40 1.00 --- --- 7 Service Non-Household 2.34 3.39 6.26 4.23 5.04 4.69 9.04 12.17 15.45 16.34 16.73 16.43 20.81 8 Manager 0.03 0.07 0.15 0.32 0.41 0.43 0.71 0.60 0.72 2.39 5.03 6.48 8.18 9 Sales 0.04 0.03 0.11 0.13 0.18 0.35 0.60 0.78 1.58 1.81 2.62 3.31 3.87 10 Farmers and farm laborers 17.98 15.96 14.70 14.13 9.40 5.63 3.22 1.80 0.79 0.29 0.24 0.09 0.08

47
Appendix Table A5: Decompositions of Differences in LFP, 1880-2000
1880 1900 1920 1940A 1940B 1960 1980 2000 White 0.0931 0.1460 0.1888 0.2624 0.2606 0.3837 0.5932 0.7228 Black 0.3925 0.4080 0.4550 0.4487 0.4487 0.5325 0.6591 0.7005 Difference -0.2994 -0.2620 -0.2663 -0.1863 -0.1881 -0.1488 -0.0659 0.0223 Explained (due to differences in Xs)
Literacy or education -0.0109 -0.0044 0.0002 0.0119 0.0221 0.0307 0.0230 0.0282 Children 0.0018 0.0005 -0.0046 -0.0119 -0.0115 -0.0033 0.0062 -0.0015 Husband -0.0229 -0.0385 -0.0422 -0.0547 -0.0591 -0.0712 -0.0345 -0.0111 Age -0.0063 -0.0028 -0.0039 -0.0074 -0.0070 -0.0011 -0.0033 -0.0030 Farm and metro 0.0006 0.0090 0.0192 0.0092 0.0085 -0.0072 0.0026 0.0036 Birth states 0.0055 -0.0025 -0.0046 -0.0217 -0.0206 -0.0145 -0.0083 0.0101
Total explained -0.0321 -0.0387 -0.0358 -0.0746 -0.0676 -0.0667 -0.0143 0.0263 Total unexplained -0.2673 -0.2233 -0.2304 -0.1117 -0.1204 -0.0821 -0.0516 -0.0040
Notes: In this context “explained” refers to the differences in LFP accounted for by racial differences in observables weighted by a vector of coefficients that corresponds to the regressions in table 2. Negative values in the “explained” rows imply that racial differences in that set of characteristics contribute to the racial gap (e.g., differences in husband’s presence and occupation tend to “explain” part of the LFP gap). The subcategories under “explained” each represented several variables. For instance, “children” captures the influence racial differences summed across all the relevant “child” variables in Table 2. The decomposition method follows Fortin (2008) and is implemented with Stata’s “Oaxaca” command with “pooled” and “categorical” options applied, as described by Jann (2008). This approach dovetails with Table 2, but of course other decomposition methods could be chosen.