THE ORGANIZATION, CASELOADS, AND COSTS OF … · THE ORGANIZATION, CASELOADS, AND COSTS OF...
25
• • • THE ORGANIZATION, CASELOADS, AND COSTS OF PROBATION AND PAROLE IN ILLINOIS AND THE UNITED STATES Prepared for the Research and Policy Committee of the Illinois Criminal Justice Information Authority Prepared by the Research and Analysis Unit of the Illinois Criminal Justice Information Authority NCJRS April 11, 1995 SEP 19 1995 Illinois Criminal Justice Information Authority If you have issues viewing or accessing this file contact us at NCJRS.gov.
Transcript of THE ORGANIZATION, CASELOADS, AND COSTS OF … · THE ORGANIZATION, CASELOADS, AND COSTS OF...

•
•
•
THE ORGANIZATION, CASELOADS, AND COSTS OF PROBATION AND PAROLE IN ILLINOIS AND THE UNITED STATES
Prepared for the Research and Policy Committee of the Illinois Criminal Justice Information Authority
Prepared by the Research and Analysis Unit of the Illinois Criminal Justice Information Authority
NCJRS April 11, 1995
SEP 19 1995
Illinois Criminal Justice Information Authority
If you have issues viewing or accessing this file contact us at NCJRS.gov.

•
•
•
Acknowledgements
This report was prepared by staff of the Authority's Research and Analysis Unit, including:
Andrea Kushner Anthony Mata Mark Myrent David Olson
Roger Przybylski Jeff Travis
U.S. Department of Justice National Institute of Justice
156072
This document has been reproduced exactly as received from t~,e person or organization originating it. Points of view or opinions stated in thiS d~~umen~ are those ?f the authors and do not necessarily represent the offiCial position or policies of the National Institute of Justice.
Permission to reproduce this copyrighted material has been granled by •
.LLLmOlS Criminal Justice Information Authority
to the National Criminal Justice Reference Service (NCJRS).
Further reproduction outside of the NCJRS system requires permission of the copyright owner.
Illinois Criminal Justice Infonnation Authority 120 South Riverside Plaza - Suite 1016
Chicago, Illinois 60606 (312) 793-8550

•
•
•
Section
1.
II.
m.
IV.
v.
VI.
VII.
Table of Contents
Introduction and Summary of Findings ............................... 1
The Organization and Responsibility of Probation in the United States ......... 3
Probation and Parole Caseloads in the United States ...................... 9
Probation and Parole Expenditures and Costs in the United States ............ 12
The Effect and Impact of Combined Probation and Parole Services in the United States ........................................... 16
Bibliography ................................................ 19
Organizations Contacted ........................................ 20
list of Tables
1. Branch of Government Administering Primary Probation Services in the Ten I..argest States, 1992 .................................... 4
2. State and Local Provision of Adult Probation Services in the Ten I..argest States, 1992 ............................ 0 •••••••••••• 5
3. Primary Source of Funding for Probation Services in the Ten l..argest States, 1992 .................................... 6
4. Caseload Supervisory Responsibility of Adult Probation Services Departments in the Ten I..argest States, 1992 .................................... 7
5. Adult Probation and Parole Cases Per 100,000 Population in 1993 and the Percent Change Between 1986 and 1993 ....................... 11
1

listofNgtm!S • Fiwze 1. 1993 Probation Cases Per 100,000 Population .......................... 9
2. 1993 Parole Cases Per 100,000 Population ............................ 10
3. Percent Change in Criminal Justice Expenditures in the United States, 1979 to 1990 ................................... 12
4. Per-Case Probation Costs in the United States, 1992 ..................... 13
5. Per-Case Parole Costs in the United States, 1992 ....................... 14
6. Ratio of Probation and Parole Cases Per Supervisory Officer, 1993 ........... 15
7. Per-Case Expenditures for Probation and Parole Caseloads, 1990 ............ 18
•
.. 11 •

•
•
•
L IN1RODUCI1ON AND SUMMARY OF FINDINGS
By far, probationers account for the majority of offenders under correctional supervision in the United States. At year-end 1993, there were more than 2.8 million adults on probation in the United States, compared to 671,000 on parole, 454,620 in jail and 909,185 in prison (Bureau of Justice Statistics, 1994: 6). These 1993 probation and parole populations represent a dramatic increase from 1985. Between 1985 and 1993, the nwnber of people on probation in the United· States increased 54 percent, from 1.8 million to 2.8 million. Even more dramatically, parole populations in the United States more than doubled during the same period, going from less than 261,000 to more than 627,000, a 141 percent increase. In 1990, the most recent year for which comprehensive data are available, more than $2.5 billion was spent on probation and parole activities by state and local units of government, or 4 percent of aU justice system expenditures that year (Bureau of Justice Statistics, forthcoming: 106).
In Illinois, the population of adult offenders under the supervision of probation departments increased from 59,231 at year-end 1986 to 73,520 in 1993 (Administrative Office ofllie Illinois Courts, 1994: 18). Of the 73,520 active probation cases at year-end 1993, more than one-half (41,794) were convicted of a felony. On that same date in 1993, there were 34,358 inmates in prison and 24,177 on mandatory supervised release in Illinois (Illinois Department of Corrections, 1995).
The purpose of this report is to summarize the organization, caseload levels, and costs of probation and parole systems in Illinois relative to the rest of the United States. Specifically, this report is intended to document the extent to which probation and parole are administered under single agencies in the United States, how caseload levels vary across states, and the extent to which the organizational structure impacts the costs and effectiveness of these community supervision services. However, it is important to note that the comparisons presented in this report do not take into accotUlt differences in state resources, caseload composition and complexity, or "effectiveness." Also, because much of the data have been collected through national surveys, it is difficult to ensure that states used consistent definitions, have similar caseload responsibilities, or include the same elements within reported expenditures and budgets.
Although much of the report will be descriptive in nature, various methods to detennine the impact of probation and parole organizational structures on the effectiveness and efficiency of the systems were attempted. Based on a review of various reports on the organization of probation and parole systems, analyses of nationally collected data, and telephone calls to various organizations and states across the country, the report provides a foundation for the discussion of probation and parole in Illinois .
The Orgcnizaion, Case/oafs, aui Costs of Probaion end Paole P~el

The following are the most significant findings resulting from our initial research:
• Illinois is one of 18 states where probation services are the responsibility of a judicialbranch agency. However, among the 10 largest states in the country (which includes Illinois), one-half of probation departments are judicial-branch agencies and one-half are executive-branch agencies;
• Illinois is one of 15 states where adult probation services are provided either exclusively or primarily at the local government leveL However, among the 10 largest states in the country, seven provide probation services either exclusively or primarily at the local level;
• Illinois is one of 12 states where the probation department supervises adult and juvenile probationers, but no parolees. However, among the ten largest stztes, five provided probation and parole activities through separate agencies. In 30 states, adult probation and parole services are provided through the same agency;
• Although probation caseload rates per a:1uJt population were relatively low in nlinois, probation and parole caseload rates per officer in Illinois were among the highest in the COUi1.try. In 1993, there were 852 probationers per 100,000 adults in Illinois, compared to 1,468 per 100,000 in the United States. Illinois' adult probation rate per population ranked 36th among the 50 states. However, the ratio of probationers and parolees to supervision officers in Illinois was among the highest in the country. In
•
1993, there were 147 active probation and parole cases per officer in illinois, ranking • 14th in the country.
• Although Illinois ranked 16th in the country with respect to its parole cmeloai rate per adult population, per-case parole expenditures ranked 46th in the coun1Iy;
• Considering the government level, brnnch, combined versus separate agencies for probation/parole services, but no other factors, per-case costs for combined probation and parole activities were higher in those states where probation was: 1) carried out at the local level, 2) by executive branch agencies, and 3) in states where the two functions are carried out by separate agencies;
• There is very little research available on the impact of combined probation and parole services on expenditures or operational effectiveness.
The Orgcniztiion, Ca;eloais. end Costs of Probction end Pcrole Page 2 •

•
•
•
llTIIE ORGAN12'AlION AND R~PONSmlUlY OF PROBAlI(X\i IN mE UNfIEI) STA'IES
In general terms, probation is the conditional freedom granted by a judicial officer to an alleged or adjudged adult or juvenile offender, as long as the person meets certain conditions of behavior (Bureau of Justice Statistics, 1981: 170). Parole, on the other hand, is the status of an offender conditionally released from a prison by discretion of a paroling authority prior to expiration of sentence, required to observe conditions of parole, and placed under the supervision of a parole agency (Ibid: 144).
There are a number of ways to differentiate how probation systems are organized in the United States. Organizational structure can be considered by: 1) the branch of government under which the program operates (e.g., executive versus judicial), 2) the level of government under which the program operates (e.g., state versus local), 3) fimding sources, and, 4) caseload responsibilities. In this section, the organizational structure of probation is analyzed across these dimensions. In order to put Illinois' organizational structure into perspective, the organizational structure of probation is considered nationally, and for the ten largest states in the country.l Most of the infonnation presented in this section were summarized from the National Institute of Corrections' Stae and Local Probction Systems in the United Stdes: A Swvey of Current Proctice report, published in July 1993.
Brazch of Government Providing Probation SeIVices
Nationally, most probation services were administered by an agency lUlder the executive branch of government in 1992. In 34 states, probation services were the responsibility of an executive-branch agency, compared to a judicial-branch agency in 18 states (National Institute of Corrections, 1993: 4).2
Executive-branch probation agencies may be located within the stcte corrections department or may exist as a separate state entity, or they may operate at the locd level within the COlUlty or city government. In those instances where the probation agency is operated by an executive-branch agency, the sentencing court places the offender under the supervision of the probation agency, but the agency itself lies outside the judicial process.
Judicial-branch probation agencies work within the court system. State and local courts enforce compliance with court judgements - with court administrative offices or designated
1 The ten larg~1 states include California, Florida, Illinois, Michigan, North Carolina, New Jersey, New York, Ohio, Pennsylvania, and Texas.
2 In two states (Minnesota and Oregon) probation activities are a combination of executive and judicial branch responsibilities .
The Orgcnizaion, Caseloafs, auf Costs of Probction auf Pcrole PageJ

staff monitoring various fonns of monetary collections, including crime victim restitution, court-ordered child support, and court fees and fines. Judicially based probation services are • administered as part of this enforcement fimction.
Illinois was one of the 18 states operating probation services under a judicial-branch agency in 1992. Although the majority of states (34 of 50 or two-thirds) operated probation through an executive-branch agency, this was not the case when the country's largest states were considered. Among the ten largest states, one-half of the states provided probation services through an executive-branch agency and the other half through a judicial-branch agency (Table 1).
Table 1 Branch of Government Administering Primary
Probation Services in the Ten Largest States, 1992
Executive Brnnch .bticial Branch
Florida, Michigan, North Carolina, Dlinois, New Jersey,. Ohio, California, New York Pennsylvania, Texas
Level of Government Providing Prolxtion Se1Vices
In addition to there being differences across states as to which brrnch of government provided probation services, there were also differences in what level of government provided these services. In terms of the level of government responsible for probation services delivery, states employ one of four basic patterns of probation service deliVery:
1. Probation supervision is a fimction of a centralized state agency;
2. Probation supervision is primarily a state fimction, but some local jurisdictions provide their own felony and/or misdemeanor probation services;
3. Probation supervision is primarily a local fimction, but the state has some supervisory responsibility for certain offenders - such as interstate compact cases, or offenders supervised in specific local jurisdictions, especially rural; Of,
4. Probation supervision is a fimction of local agencies. Even in these states, however, a central corrections or probation/parole agency usually provides training, technical assistance, support for particular programs, and/or setting of standards.
The Orgcnizaion, Caseioais, aui Costs of Prolxtion end Pavie Page-l
.. --_._ .... _..._._. - . __ .- .. -_._---.-~-
•
•
•
•
•
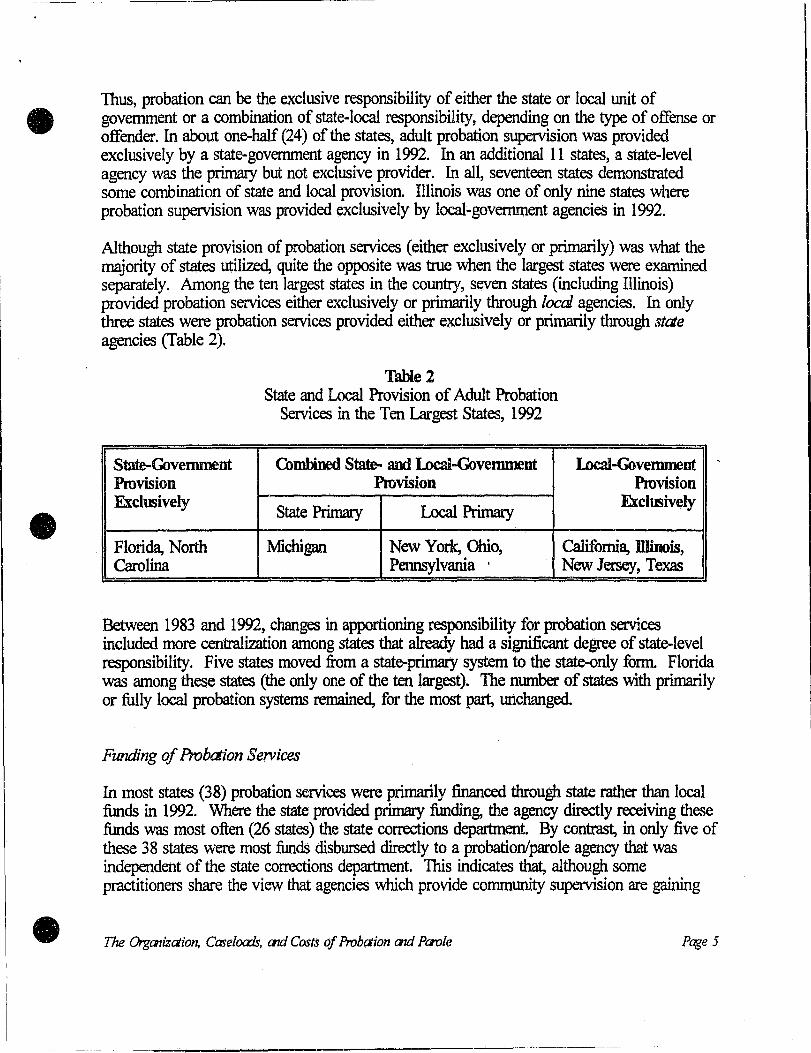
Thus, probation can be the exclusive responsibility of either the state or local unit of government or a combination of state-local responsibility, depending on the type of offense or offender. In about one-half (24) of the states, adult probation supervision was provided exclusively by a state-government agency in 1992. In an additional 11 states, a state-level agency was the primary but not exclusive provider. In all, seventeen states demonstrated some combination of state and local provision Illinois was one of only nine states where probation supervision was provided exclusively by local-government agencieS in 1992.
Although state provision of probation services (either exclusively or primarily) was what the majority of states utilized, quite the opposite was true when the largest states were examined separately. Among the ten largest states in the country, seven states (including Illinois) provided probation services either exclusively or primarily through local agencies. In only three states were probation services provided either exclWlively or primarily through state agencies (Table 2).
State-Government Provision Excl~ively
Florida, North Carolina
Table 2 State and Local Provision of Adult Probation
Services in the Ten Largest States, 1992
Combined State- and Locai-Glvemment Provision
State Primary Local Primary
Michigan New York, Ohio, Pennsylvania '
I.ncal-Glvemment Provision
Exclusively
California, lllinois, New Jersey, Texas
Between 1983 and 1992, changes in apportioning responsibility for probation services included more centralization among states that already had a significant degree of state-level responsibility. Five states moved from a state-primary system to the state-only form. Florida was among these states (the only one of the ten largest). The number of states with primarily or fully local probation systems remained, for the most part, unchanged.
Fiouling of Probaion SelVices
In most states (38) probation services were primarily financed through state rather than local fimds in 1992. Where the state provided primary fimding, the agency directly receiving these fimds was most often (26 states) the state corrections department By contrast, in only five of these 38 states were most fimds disbursed directly to a probation/parole agency that was independent of the state corrections department. This indicates that, although some practitioners share the view that agencies which provide community supervision are gaining
The Orgcnizaion, Caseioals, end Costs of Probction end Pcroie Puge5

greater independence from institutional corrections, most states continued to consider probation a component of the larger correctional system rather than an independent fimction. •
In 1992, counties provided primary fimding for probation services in seven states - including Illinois, though most of these agencies also receive significant state support. In fact, in some states - including Ohio and Texas - fimding responsibility for probation was almost equally shared between state and local units of government under a community corrections act Supplemental state fimding for primarily locally fimded probation services was provided through state legislative appropriations for specific programs, voucher systems, workload fonnula-based payments, support for personnel or facility costs, and/or federal grants for specific programs.
Although most states relied primarily on state fimding for probation activities in 1992, when the ten largest states were considered separately, there was much more balance between state and local ftmding. In five of the 10 largest states, most probation activities were supported with local funds, while in two other states there was an equal amount provided by both the state and local level. In only three of the 10 largest states were the majority of probation activities financed by the state (Table 3).
Table 3 Primary Source of Funding for Probation Services in the Ten Largest States, 1992
State Local I~---------------+---------
Florida, Michigan, North California, DIinois, New Jersey, Carolina, Ohio (partial), New York, Ohio (partial), Texas (partial) Permsylvania, Texas (partial)
Several states made changes in their fimding of probation services between 1983 and 1992. Generally, central state corrections agencies assmned a greater role in probation fimding, as a result of centralizing services or adding support to specific programs. States also ina'easingly implemented supervision fees as a mechanism for raising additional revenue. Twelve more agencies did this in 1992 than in 1983, bringing the total to 33 states.
Cmeloal SupelVisory Responsibility
Similar to differences in the branch and level of government providing probation services or financing in the United States, states' primary probation agencies also vary in their supervisory responsibility - the broad categories of cases their "probation" officers manage .
The Orgcnizction, Caseioais, end Costs of Probction end Paule Page 6
•
•
--------------.---------~---------
•
•
•
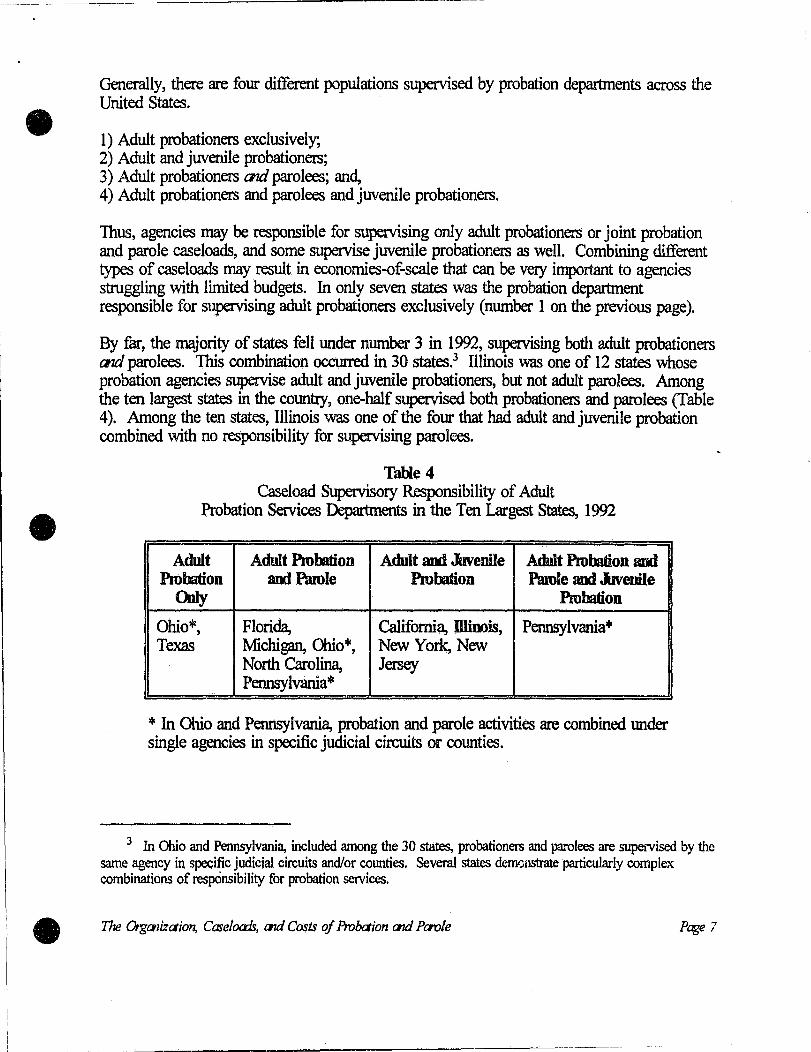
Generally, there are four different populations supervised by probation departments across the United States .
1) Adult probationers exclusively; 2) Adult and juvenile probationers; 3) Adult probationers end parolees; and, 4) Adult probationers and parolees and juvenile probationers.
Thus, agencies may be responsible for supervising only adult probationers or joint probation and parole caseloads, and some supervise juvenile probationers as well. Combining different types of caseloads may result in economies-of-sca1e that can be very important to agencies struggling with limited budgets. In only seven states was the probation department responsible for supervising adult probationers exclusively (number 1 on the previous page).
By far, the majority of states fell under number 3 in 1992, supervising both adult probationers end parolees. This combination occurred in 30 states.3 Illinois was one of 12 states whose probation agencies supervise adult and juvenile probationers, but not adult parolees. Among the ten largest states in the COtmtry, one-half supervised both probationers and parolees (Table 4). Among the ten states, Illinois was one of the four that had adult and juvenile probation combined with no responsibility for supervising parolees.
Table 4 Caseload Supervisory Responsibility of Adult
Probation Services Departments in the Ten Largest States, 1992
Adult Adult Pmbdion Adult and Juvenile Adult ProbJtion and Probation and Parole Probation Paro;e and .lwenile
Only Probation
Obi * o , Florida, California, DJinois, Pennsylvania· Texas Michigan, Ohio"', New York, New
North Carolina, Jersey Pennsylvania·
* In Ohio and Pennsylvania, probation and parole activities are combined tmder single agencies in specific judicial circuits or counties.
3 In Ohio and Pennsylvania, included among the 30 states, probationers and parolees are supervised by the same agency in specific judicial circuits and/or comties. Several states del'J'ltJIlstrnte particularly complex combinations of respcinsibility for probation services .
The OrgCllizction, Caseloals, end Costs of Probction end Pavle Page 7

Between 1983 and 1992, a number of states changed the responsibilities of their probation agencies, either adding or reducing responsibilities for specific caseloads. Although there was • no clear pattern to states' addition or removal of specific caseload responsibilities during that period, 11 states changed the types of caseloads supervised by their primary probation agencies. In five of the states, caseloads were added, and in four states one or more caseloads were eliminated from their responsibility.
Four states combined parole and probation responsibilities lUlder a single agency - 10Wd, New Hampshire, and portions of Ohio and Pennsylvania None of the states that had probation and parole supervision responsibilities combined in 1983 had separated the two by 1992. In most of the other states, the changes had to do with the removal or addition of juvenile probationers to the probation agency caseloads.
The Orgazizaion, Caseloals. end Costs of Probaion end Pavle Page 8
-~- --- -~- - -- ~--~-- ----~ -~ --
•
•

~~~~~~~----~~~~~~-.~~-----------------
•
•
•
m PROBAnOO" AND PAROIE CASEWADS IN 1HE UNITED STAlES
As was stated in the introduction, the majority of offenders tmder correctional supervision in the United States are on probation. In 1993, there were 1,468 probationers for every 100,000 adults in the COWltry as a whole (Bureau of Justice Statistics, 1994: 4). However, when individual states were compared, there was a wide range in the number of probationers per 100,000 adult population (Figure 1).
In order to compared Illinois' probation caseload rate to the rest of the country, both active and total caseloads (active plus administrative) rates were used for Illinois.4 Illinois' 1993 crtive probation caseload rate of 852 probationers per 100,000 adults was 42 percent lower than the national average and 46 percent lower than the rate for the 10 largest states in the country. Illinois' active probation caseload rate per population ranked 36th in the COtmtry (Figure 1). Illinois' 1993 totd probation caseload rate of 1,099 per 100,000 adults was 18 percent lower than the national average and 31 percent lower than the rate of the 10 largest states. The total caseload rate ranked 27th in the COtmtry (Figure 1).
o
Figure!
1993 Probation Cases per 100,000 Population
500
I I
, I I---.... oo/y , I I I I I I I
1000 1500 2000 Rate per 100,000 Adults
2500 300
4 It is not clear from the Bureau of Justice Statistics' report if other states include only active or both active and administrative caseloads. Therefore, both rates were calculated for Illinois using data available from the Administrative Office of the Illinois Courts' Probation Division.
The Orgcnizction, Caseloafs, end Costs of Probction end Paule Page 9

Considering pcrole caseloads, in 1993 there were 329 parolees per 100,000 adults in the United States (Ibid: 5). As with probation caseload rates, there was a wide range in parole • caseload rates when all the states were compared (Figure 2). In 1993, there were 280 parolees per 100,000 adults in Illinois, 15 percent lower than the national average and 32 percent lower than the average for the 10 largest states combined. Illinois ranked 16th in the cmmtry with respect to its parole caseload rate.
Figure 2
1993 Parole Cases per 100,000 Population
o 200 400 600 800 1000 1200 1400 1600 Rate per 100,000 Adults
Table 5 includes the percent change in the probation caseload rate between 1986 and 1993 for Illinois, the ten largest states, and the nation. As can be seen, Illinois' total probation caseload rate increased 24 percent between 1986 and 1993, while caseloads in the ten largest
The Orgcnizction, Caseloafs, end Costs of Frobaion end Pcroie Pcge 10
•
•

•
•
•
states and the nation as a whole increased 27 and 28 percent respectively.s During that same period, Illinois' paule caseload rate increased slightly more than in the nation as a whole, and slightly less than in the ten largest states.
Table 5 Adult Probation and Parole Cases Per 100,000 Population in 1993
and the Percent Change Between 1986 and 1993
Adult Pmbltion Adult Parole Pen:ent OJange Cases Per Cases Per '86-93 in 100,000 100,000 Probation Cases
DIinois 852 280 +24%
Ten Largest States 1571 411 +2~1o
United States 1468 329 +28%
Pereent Olange '86-93 in Parole
Cases
+93%
+1()901o
+89%
5 Probation caseload data for Illinois were taken from the Administrative Office of the Illinois Cowts' Annual Statistical Reports. One interpretative aspect that must be noted is that although Illinois' totd (misdemeanor end felony) adult probation caseload rate increased 24 percent between 1986 and 1993, thefelOlfY probation caseload rate in Illinois increased 32 percent during that period.
The Orgcnizction, Ca;eloals, aui Costs of Probction end Paule Page II

IV. PROBATIOO AND PAROlE EXPENDITURES, (Xl;TS, AND STAFFING IN mE UNITED STAlES
Although expenditures for corrections increased dramatically over the past decade, based on surveys of criminal justice officials, probation and parole agency budgets may not have increased sufficiently. Based on the National Assessment Program survey sponsored by the National Institute of Justice, "there was a strong indication that probation and'parole agencies had not shared as greatly in the recent corrections budget expansions as had jails and prisons (National Institute of Justice, 1992: 7)." In 1990, almost three-quarters of respondents from probation and parole agencies reported inadequate fimding, compared to one-half of police departments (Ibid: 7).
In 1990, $2.5 billion was spent by state and local units of government for probation and parole activities in the United States, accoWlting for 4 percent of total justice expenditures. As indicated in the survey results above, the increase in expenditures for probation and parole were considerably lower than those for correctional institutions, but higher than those for police and the cotnts (Figure 3). Between 1979 and 1990, per-capita probation and parole expenditures in the United States increased 40 percent, compared to a 113 percent increase in per-capita expenditures for correctional institutions.
Figure 3
Percent Change in U.S. Per-Capita Expenditures Between 1979 and 1990
-2! .!! 120% "0 c 1: 100% J!! :g 80% o
(.)
c 60% ::.. Q)
~ 40% tV J: (.) 20% .... c Q)
~ 0% CI)
ll. Justice Function
The Orgcnizcti.on, Case/oals, end Costs of Probaion end Paole Page 12
•
•
•

•
•
•
Just as there are dramatic differences in per-capita probation and parole CtlSeloa:Js across the United States, expenditw'es per-probationer or parolee also varies considerably across states. In 1992, the national average expenditure per-probation case was $696, and ranged from less than $250 to almost $3,000.6 As can be seen in Figure 4, Illinois' $997 per probation case ranked 10th in the COtnltry, 43 percent above the national average, but only 9 percent higher than the average for the 10 largest states in the COtnltIy. However, it is important to note that the caseload responsibilities and compositions vary considerably across states, which may result in more being spent to supervise more serious offenders. Per-case expenditures are considerably higher for felony than misdemeanor cases, and intensive probation supervision costs are dramatically higher than traditional felony case supervision costs. In addition, it is not possible to detennine if states included administrative cases in their reported figures, which would dramatically lower per-case costs in these states. .
Figure 4
Per-Case Probation Costs in the United States, 1992
I DW ... ...,.nWid-
$0 $500 $1,000 $1,500 $2,000 Per-Case Costs
$2,500 $3,000
6 Per-case costs were calculated by dividing the annual probation budgets by the munber of active cases on January 1, 1993 (Criminal Justice Institute, Inc. 1993:19). In those states where probation and parole expenditures were included in one budget, the total budget was divided by the total nwnber of active probation au:i parole cases. Therefore, in those states 'Where the two fimctions are funded through a single budget, per-case costs for probation and parole are the same .
The Orgcnizction, Caseloais, end Costs of Prolxtion end Pcrole Page 13

..
Overall, per-case pcro/e expenditures were higher than per-case probation expenditures in the United States in 1992. The national average expenditure per-pcro/e case in 1992 was $1,069 • and also varied considerably across the United States, ranging from $100 to more than $3,600. As can be seen in Figure 5, Illinois' $212 per parole case ranked 46th in the COtUltry, 80 percent lower than the national average and 79 percent lower than the ten largest states in the country. As with per-case probation costs, per-case parole costs are also dependent on the level of supervision, the composition of the caseloads, and whether administrative cases are also reported in the caseload figures.
$0
FigureS
Per-Case Parole Costs in the United States, 1992
$1,000 $2,000 $3,000 Per-Case Costs
$4,000
Another way to analyze and compare probation and parole resources is to look at the average number of cases each probation or parole officer supervises. 'When the total probation and parole cases wer:e divided by the total probation and parole officers in each state, the national average was 104 cases per officer in 1992. In Illinois, there were 147 active probation and
The OrgCl1izaion, Caseloafs. auJ Costs of Probction end Paole Page 1-1
•
•

~-~---~--~--------~------------------------
•
•
•
parole cases per officer that year, 41 percent higher than the national average (Figure 6). Considering only active probaion cases per probation officer, the Illinois average was 117 cases per officer.' Overall, the 1992 ratio of active probation and parole cases per officer in Illinois ranked 14th highest in the country (Figure 6).
o
Figure 6
Probation and Parole Cases per Officer, 1992
200 400 Cases per Officer
600 80
7 The Administrative Office of the Illinois Cowts' Probation Division uses a much more complex fonnula to detennine staffing levels than simply the ratio of cases to officers. Adult probation workload in Illinois is determined by applying the Adult Investigative and Classification System and its differential supervision contact standards.
The Orgcnizction, Cme/oais, aui Costs of Prohaion end Pcrole Page 15

v. 1HE EFfiECTIIMPACf OF COMBINED PROBATIOO AND PAROlE SERVICES
As a result of an extensive search of the National Criminal Justice Reference Service's • Document Data Base on CD-ROM, and searches conducted by staff at the Justice Research and Statistics Association (JRSA) and the American Probation and Parole Association (APPA), no studies or evaluations were found that tested or determined if probaion and parole were more effective or efficient when operated under a separate or a consolidated agency. The hypothesis that having government services provided llhlre centrally would result in lower per-capita costs as a result of sca1es-of-economy has been tested for some government services, but never for probation and parole activities. There is no real evidence to suggest that centralized states-states in which the state government dominates direct spending and revenue mising-spend more efficiently, effectively, and responsibly (Walker, 1969).
To test such a hypothesis specific to probation and parole would require not only developing more specific measures of cost and effectiveness than are currently available, but also differences in caseload composition (e.g., more felonies versus misdemeanors), availability of resources (e.g., states with higher per-capita income and tax capacity), crime rates, and various other soci<Hlemographic characteristics that have been fomd to explain differences in per-capita government expenditures. In addition, standard measures of effectiveness or efficiency would need to be developed.
Since the development of such an elaborate study was beyond the scope of this exploratory and initial assessment, telephone calls were made to a number of states that had recently • moved from a system where probation and parole were separate to one where these fimctions are combined under one agency. According to the National Institute of Corrections' 1993 report State au:l Locd Probdion Systems in the United Staes: A Survey of Current Prrxtice, four states switched to a combined system of probation and parole between 1983 and 1992: Iowa, New Hampshire, and parts of Ohio and Pennsylvania. Telephone calls were made to these states during February 1995 by staff from the Research and Analysis Unit to discuss the proc.ess by which this shift was accomplished, to determine if fonnal studies or evaluations of the new system had been completed, and to get the perceptions of officials in those states as to the benefits or problems associated with the switch to the new organization. When Pennsylvania was contacted, they said they had not combined these services, although it appears that they operate a system similar to Ohio's.
Iowa
The board of parole, within the Iowa Department of Corrections, oversees the fimding of probation and parole through the state's eight judicial districts (used for geographic boundaries only). Each district has a Community Corrections Division, which oversees all sanction programs excluding state incarceration. The combination of probation and parole took place in 1984, but was seen as a logical extension of the movement toward community corrections
The Orgarizction, Case/oafs, end Costs of Probction auJ Pao/e Page 16 •

•
•
•
agencies established in the mid-1970s. Officers are trained to handle both probation and parole caseloads, although in three of the urban areas officers are assigned to either probation or parole cases exclusively. One infonnation system is used to monitor all connnunity correction caseloads.
New Hampshire
Although plans for the movement from separate probation and parole agencies to combined services began in the early 19708, it wasn't until 1983 that legislation was passed combining the state department of corrections, parole, and probation under the New Hampshire Department of Corrections. There was a wide range of support and dissent from all three separate agencies, as well as members of the legislature, before the merger. It took about two years to get the separate agencies working together. One of the most significant benefits cited by officials in the state were the probation and parole officers were retrained so as to be able to handle both types of cases. The department of corrections operates a single infonnation system that allows information to be shared across probation, parole, and the state correctional institutions. There has not been an evaluation done of the combination of responsibilities or any assessment of the financial impact on the correctional programs.
Ohio
The Ohio Adult Parole Authority, an agency of the Division of Parole and Community Services of the state corrections department, provides probation services to 40 counties on a contractual basis, ranging from full services to partial services. The majority of counties contracting with the state are rural counties. Thirty-eight counties have county probation departments and 10 counties have a combination of state and county probation services. For example, in some cow ties the DOC provides only pre-sentence investigations, while in others they provide complete case supervision. Each contract is unique, based on the services to be provided. The services are provided by parole officers, who not only supervise prison releasees, but also conduct PSIs and supervise probation caseloads. Although the Nle report states that this change has taken place recently, it has been going on since the early 1970s. Information is the big selling point. Pre-Sentence Investigations follow the offender into prison and the state prison system has access to probation case files through their agents.
In order to provide at least a starting point for a discussion of the relative cost of providing probation services under the various mechanisms in place, per-case probation and parole expenditures were compared for those states carrying out probation activities Wlder separate versus combined, local versus state, and judicial- versus executive-branch agencies. It is important to note that these comparisons do not take into account differences in state resources, caseload levels or compositions, or effectiveness. Also, higher per-case costs may not necessarily indicate inefficiency, but rather, agencies operating WIder the various organizations may be in better positions to get more resources for their operations .
The Orgcnizction, Caseloafs, aui Costs of Probaion end Paule Page 17

As a result of calculating per-case probation and parole expenditures for states utilizing various combinations of organization, per-case costs were higher in states vmere probation • was carried out by separate agencies (e.g., not combined under one agency), states where probation was carried out by local units of government, and states where probation operated under an executive-branch agency (Figure 7).
Flgure 7
Per Case Expenditure of Probation and Parole Case loads, 1990
Separate
Combined
Local
State
Judicial
Executive
$0 $500 $1,000
The Orgcnizction, CaJeioals, end Costs of Probciion end Pcroie
$1,500
Pcge I~
•
•

• VL BmuOGRAPHY
Administrative Office of the Illinois Courts' Probation Division (1994): Prolxtion Statistics 1993.
Bureau of Justice Statistks (1981), Dictionay of Criminal Justice ilia Tenninology: Second Edition.
Bureau of Justice Statistics (forthcoming): Justice Expenditure au:l Employment in the United States, 1990
Bureau of Justice Statistics (1986 to 1994): Prolxtion au:l Pcmle
Bureau of Justice Statistics, the National Criminal Justice Reference Service (NCTRS) Document Data Base on CD-ROM
Criminal Justice Institute, Inc. (1993): The Con-ections Yeabook: Prolxtion end Pcmle, 1993.
Illinois Department of Corrections (1995): Telephone conversation with Robert Jones, February 23, 1995.
• National Institute of Justice (1992): Assessing Crimina Justice Needs.
•
National Institute of Corrections (1993): Stae av:1 Locd Prolxtion Systems in the United Staes: A SUlVey of cwrent Prrxtice
Walker, J. (1969). The diffiJsion of innovation among the American states. Americaz Political Science Review 63:880-889 .
The Orgcnizaion, Caseloa:ls, aul Costs of Prolxtion aui Paole Puge /9

VB. ORGANl1ATIOO"S CONTACIED
Telephone survey of probation and parole administrators in the United States conducted by staff from the Authority's Research and Analysis Unit from February 10, 1995 through February 24, 1995, and calls to the Justice Research and Statistics Association (JRSA) and the American Probation and Parole Association (APPA).
Board of Parole Des Moines, IA contact: Barbara Freeman (administration) (515) 281- 4817 February 24, 1995
Department of Corrections Des Moines, IA contact: Jeanette Bucklew (administration) (515) 281 - 4806 February 24, 1995
Office of the Commission of Probation Boston, MA contact: Linda Scalfani (administration )and Sandra Adanm (research) (617) 727-5307 February 15, 1995
American Probation and Parole Association Reno, NV contact: Harry Boone, Jr. Ph.D. (research) (702) 784-4989 February 10, 1995
Department of Corrections Concord, NH contact: Donald Parrish (administration) (603) 271 - 5652 February 24, 1995
Board of Probation and Parole Harrisburg, PA contact: Calvin Ogletree (administration) (717) 783-4666 February 17, 1995
The Orgcnizction, Caseloats, end Costs of Prolxtion cnd Pcrole
----- ---- ---~~-----~~~-
Page 20
•
•
•

..
•
•
•
-------~----~.----------------
Justice Research and Statistics Association Washington, DC contact: Craig Cussimanio (research) (202) 624 - 8560 February 10, 1995
U.S. Department of Justice, Bureau of Justice Statistics Washington, D.C. Patrick Langan, (research) (202) 301 - 2464 February 15, 1995
The Orgcnizction, Case/oafs, aui Costs of Probction aut Pav/e Page 21