
The Open Construction and Building Technology Journal
13
1874-8368/20 Send Orders for Reprints to [email protected] 111 DOI: 10.2174/1874836802014010111, 2020, 14, 111-123 The Open Construction and Building Technology Journal Content list available at: https://openconstructionandbuildingtechnologyjournal.com RESEARCH ARTICLE Assessment of the Seismic Performance for a Low-Code RC Shear Walls Structure in Bucharest (Romania) Florin Pavel 1,* and Radu Vacareanu 1 1 Seismic Risk Assessment Research Centre, Technical University of Civil Engineering Bucharest, Bd. Lacul Tei, 122-124, Bucharest, Romania Abstract: Background: Low-code RC shear walls structures house a significant proportion (over 20%) of the inhabitants of Bucharest. Objective: In this research, the seismic performance of a low-code reinforced concrete shear walls structure located in various sites in Bucharest (Romania) is assessed. Methods: The seismic performance is assessed using both static and dynamic nonlinear time-history analyses, as well as detailed sectional analysis of the RC shear walls. Results: The results show that the structure has significant capacity differences in the two principal directions. Moreover, it has been observed that the maximum top displacements obtained from nonlinear time history analyses are larger in the transversal direction. Conclusion: Considering the behaviour of such structures during the 1977 Vrancea earthquake, the fact that these structures are already 40 – 50 years old and given the results of some of the analyses shown in this study, it can be concluded that immediate seismic rehabilitation measures are needed in order to correct, at least partially the structural issues of this section type. Keywords: OD section type, Shear force, Drift, Ground motion recordings, Rotated ground motions, Nonlinear analysis. Article History Received: January 07, 2020 Revised: March 20, 2020 Accepted: May 12, 2020 1. INTRODUCTION The Vrancea intermediate-depth earthquake of March 4, 1977 (moment magnitude M W = 7.4 and focal depth h = 94 km) is one of the most important milestones in the development of earthquake engineering and seismic design in Romania. A comprehensive description of the economic and social impact of this seismic event at the national level and for Bucharest, the capital city of Romania, can be found in the papers of Georgescu and Pomonis [ 1 - 3]. In the aftermath of the earthquake, a damage survey was performed on a sample of 18000 buildings from various parts * Address correspondence to this author at the Seismic Risk Assessment Research Centre, Technical University of Civil Engineering Bucharest, Bd. Lacul Tei, 122-124, Bucharest, Romania; E-mail: [email protected] of Bucharest [ 4]. Among the three residential buildings seismically designed that collapsed in Bucharest, one had a structural system consisting of thin Reinforced Concrete (RC) shear walls (section type OD), the second one had a soft and weak ground storey structure [4] and the structural system of the third one consisted in columns and flat slabs. This section type was extensively built in Bucharest (a total number of 161 individual buildings with more than 8000 dwellings) during the 1960s and 1970s. Out of the total number of 161 buildings, one completely collapsed (by overturning in the transversal direction) and another seven sustained heavy or very heavy damage; nineteen other buildings experienced extensive damage according to the damage survey performed in the aftermath of the earthquake [4]. After the 1977 seismic
Transcript of The Open Construction and Building Technology Journal
1874-8368/20 Send Orders for Reprints to [email protected]
111
DOI: 10.2174/1874836802014010111, 2020, 14, 111-123
The Open Construction and BuildingTechnology Journal
Content list available at: https://openconstructionandbuildingtechnologyjournal.com
RESEARCH ARTICLE
Assessment of the Seismic Performance for a Low-Code RC Shear WallsStructure in Bucharest (Romania)
Florin Pavel1,* and Radu Vacareanu1
1Seismic Risk Assessment Research Centre, Technical University of Civil Engineering Bucharest, Bd. Lacul Tei, 122-124, Bucharest, Romania
Abstract:
Background:
Low-code RC shear walls structures house a significant proportion (over 20%) of the inhabitants of Bucharest.
Objective:
In this research, the seismic performance of a low-code reinforced concrete shear walls structure located in various sites in Bucharest (Romania) isassessed.
Methods:
The seismic performance is assessed using both static and dynamic nonlinear time-history analyses, as well as detailed sectional analysis of the RCshear walls.
Results:
The results show that the structure has significant capacity differences in the two principal directions. Moreover, it has been observed that themaximum top displacements obtained from nonlinear time history analyses are larger in the transversal direction.
Conclusion:
Considering the behaviour of such structures during the 1977 Vrancea earthquake, the fact that these structures are already 40 – 50 years old andgiven the results of some of the analyses shown in this study, it can be concluded that immediate seismic rehabilitation measures are needed inorder to correct, at least partially the structural issues of this section type.
Keywords: OD section type, Shear force, Drift, Ground motion recordings, Rotated ground motions, Nonlinear analysis.
Article History Received: January 07, 2020 Revised: March 20, 2020 Accepted: May 12, 2020
1. INTRODUCTION
The Vrancea intermediate-depth earthquake of March 4,1977 (moment magnitude MW = 7.4 and focal depth h = 94 km)is one of the most important milestones in the development ofearthquake engineering and seismic design in Romania. Acomprehensive description of the economic and social impactof this seismic event at the national level and for Bucharest, thecapital city of Romania, can be found in the papers ofGeorgescu and Pomonis [1 - 3].
In the aftermath of the earthquake, a damage survey wasperformed on a sample of 18000 buildings from various parts
* Address correspondence to this author at the Seismic Risk Assessment ResearchCentre, Technical University of Civil Engineering Bucharest, Bd. Lacul Tei,122-124, Bucharest, Romania; E-mail: [email protected]
of Bucharest [4]. Among the three residential buildingsseismically designed that collapsed in Bucharest, one had astructural system consisting of thin Reinforced Concrete (RC)shear walls (section type OD), the second one had a soft andweak ground storey structure [4] and the structural system ofthe third one consisted in columns and flat slabs.
This section type was extensively built in Bucharest (atotal number of 161 individual buildings with more than 8000dwellings) during the 1960s and 1970s. Out of the total numberof 161 buildings, one completely collapsed (by overturning inthe transversal direction) and another seven sustained heavy orvery heavy damage; nineteen other buildings experiencedextensive damage according to the damage survey performedin the aftermath of the earthquake [4]. After the 1977 seismic
112 The Open Construction and Building Technology Journal, 2020, Volume 14 Pavel and Vacareanu
event, all the damaged structures were only locally repaired (nostrengthening was performed) [3] and subsequent damageoccurred during the Vrancea seismic events of August 19861977 (MW = 7.1 and h =131 km) and May 1990 (MW = 6.9 andh =91 km).
Consequently, in this paper, we aim at evaluating theseismic performance of the OD section type using both staticand nonlinear dynamic analyses, as well as detailed sectionalanalyses of the RC shear walls. In addition, the impact of theangle of incidence on the seismic response of the analysedstructure is also assessed. The impact of the angle of incidenceon the seismic response of various structural systems has beenanalysed by other authors considering several engineeringdemand parameters [5 - 7].
2. MATERIALS AND METHODS
2.1. Structural Model
The OD section type has a structural system consisting ofRC shear walls placed on the two principal orthogonaldirections. The analysed building has 11 stories of 2.75 m eachand planar dimensions of 11 x 27 m. The design bases shearcoefficient is around 2 - 3% of the total weight of the structure(the values are similar for both the P13-63 and P13-70 seismicdesign codes enforced in Romania at that time). The mostimportant characteristics of the structural system for the ODsection type can be summarized as follows:
The thickness of all the shear walls is 14 cm, leadingthus to a ratio of the area of the shear walls to the totalfloor area of roughly 1.1% in the longitudinal directionand 3.8% in the transversal direction;The boundary elements of the transversal shear walls
are 22 cm in width and 30 cm in depth;The coupling beams have a height of 58 cm (in somecases 28 cm) and a thickness equal with that of the RCshear walls (14 cm);The concrete class is in the range C8/10 – C12/15,while the reinforcement consists of smooth bars ofsteel grade OB37 (similar to S235);The cast-in-place RC slabs have a thickness of 12 cm;The edge beams have a cross-section of 30 x 30 cm.
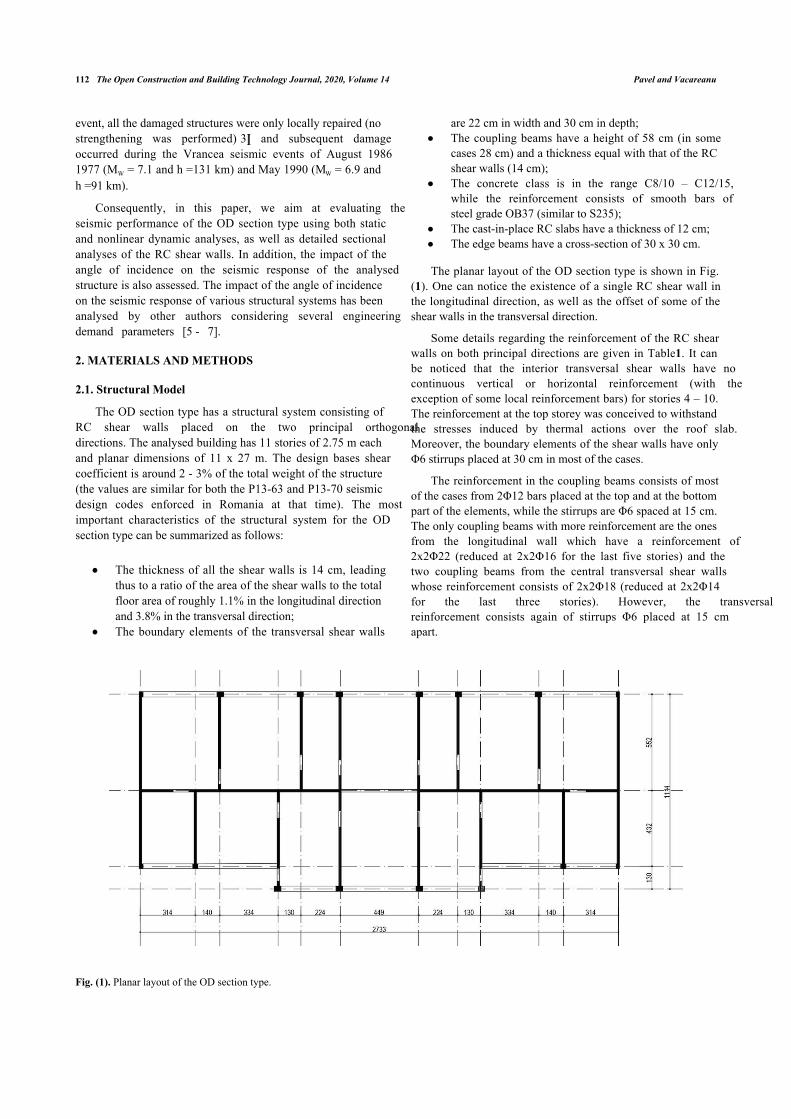
The planar layout of the OD section type is shown in Fig.(1). One can notice the existence of a single RC shear wall inthe longitudinal direction, as well as the offset of some of theshear walls in the transversal direction.
Some details regarding the reinforcement of the RC shearwalls on both principal directions are given in Table 1. It canbe noticed that the interior transversal shear walls have nocontinuous vertical or horizontal reinforcement (with theexception of some local reinforcement bars) for stories 4 – 10.The reinforcement at the top storey was conceived to withstandthe stresses induced by thermal actions over the roof slab.Moreover, the boundary elements of the shear walls have onlyΦ6 stirrups placed at 30 cm in most of the cases.
The reinforcement in the coupling beams consists of mostof the cases from 2Φ12 bars placed at the top and at the bottompart of the elements, while the stirrups are Φ6 spaced at 15 cm.The only coupling beams with more reinforcement are the onesfrom the longitudinal wall which have a reinforcement of2x2Φ22 (reduced at 2x2Φ16 for the last five stories) and thetwo coupling beams from the central transversal shear wallswhose reinforcement consists of 2x2Φ18 (reduced at 2x2Φ14for the last three stories). However, the transversalreinforcement consists again of stirrups Φ6 placed at 15 cmapart.
Fig. (1). Planar layout of the OD section type.
Assessment of the Seismic Performance for a Low-Code The Open Construction and Building Technology Journal, 2020, Volume 14 113
Table 1. Characteristics of the reinforcement of the RC shear walls.
DirectionReinforcement TypeVertical Horizontal
Longitudinal web - 2Φ10/30 (or 2Φ8/30 for stories 3 – 11)flange - 12Φ12 (or 12Φ10 for stories 3 – 11)
web - 2Φ8/30 (or 2Φ6/30 for stories 3 – 11)flange – Φ6/30
Transversal – edge RC shearwalls
web - 2Φ8/30flange - 4Φ16 (4Φ14 for storey 2, 4Φ12 for storey 3 – 11)
web - 2Φ8/30 (or 2Φ6/30 for stories 3 – 11)flange - Φ6/30
Transversal – interior RC shearwalls
web - 2Φ8/30 (2Φ6/30 for storey 3 and 11, no verticalreinforcement for stories 4-10)flange - 4Φ12 (4Φ10 for storey 3 – 11)
web - 2Φ8/30 (2Φ6/30 for storey 3 and 11, no verticalreinforcement for stories 4-10flange - Φ6/30
The eigenperiods associated with the first two eigenmodesof the structure are 0.57 s (translation in the transversaldirection) and 0.42 s (translation in the transversal direction),respectively.
3. NONLINEAR STATIC AND DYNAMIC ANALYSES
In order to assess the seismic performance of the analysedstructure, both static nonlinear, as well as dynamic nonlinearanalyses are performed. This approach was also employed inthe study of Repapis [8] considering RC buildings withoutseismic detailing. The analyses are conducted using thesoftware SeismoStruct [9] and employing the full 3D structuralmodel. Inelastic force-based plastic hinges (concentrating theinelasticity at the ends of the structural elements) are assignedfor all the structural elements. The Mander et al. [10] modelwas applied for the concrete fibres, while the reinforcement ismodelled by using the stress-strain relationship proposed by
Menegotto and Pinto [11] and implemented by Monti et al.[12].
3.1. Nonlinear Static Analyses
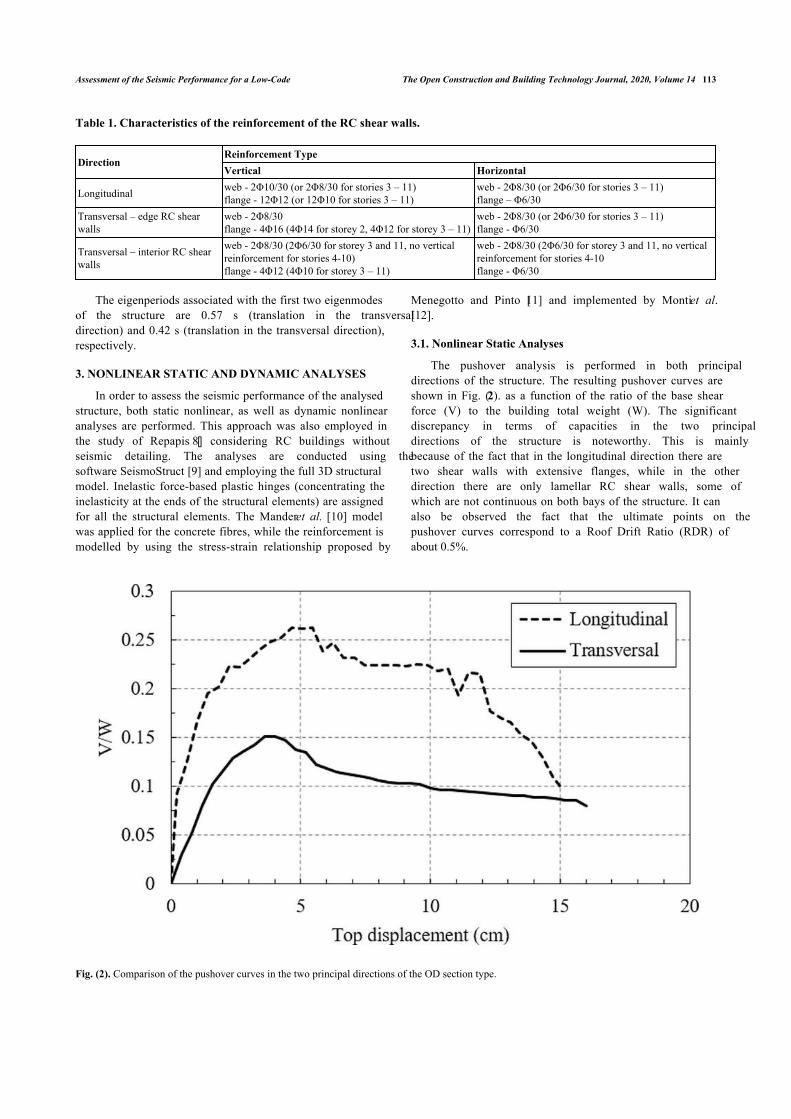
The pushover analysis is performed in both principaldirections of the structure. The resulting pushover curves areshown in Fig. (2). as a function of the ratio of the base shearforce (V) to the building total weight (W). The significantdiscrepancy in terms of capacities in the two principaldirections of the structure is noteworthy. This is mainlybecause of the fact that in the longitudinal direction there aretwo shear walls with extensive flanges, while in the otherdirection there are only lamellar RC shear walls, some ofwhich are not continuous on both bays of the structure. It canalso be observed the fact that the ultimate points on thepushover curves correspond to a Roof Drift Ratio (RDR) ofabout 0.5%.
Fig. (2). Comparison of the pushover curves in the two principal directions of the OD section type.

114 The Open Construction and Building Technology Journal, 2020, Volume 14 Pavel and Vacareanu
3.2. Spectral Analysis
The Nonlinear Time History Analyses (NTHAs) areperformed using the two horizontal components recorded atINCERC station in the eastern part of Bucharest during theVrancea earthquake of March 4, 1977. Besides the nonlineartime history analyses conducted with the as-recordedhorizontal components, additional analyses are performedconsidering the rotated components. The pair of horizontalcomponents originally recorded at INCERC station wererotated in the clockwise direction every 5° between 0° and180° leading thus to more than 30 individual time series. Thistype of analysis was also applied by Pavel and Nica [13] in thecase of regular shear walls structures designed according to themost recent version of the Romanian seismic design code. Themean and mean ± one standard deviation acceleration anddisplacement response spectra for all the rotated componentsare illustrated in Fig. (3).
The simplified method of Verdugo et al. [14] is applied inorder to evaluate the damage levels (in terms of roof drift ratio)sustained by the OD section type when subjected to thehorizontal components recorded at INCERC station during theVrancea 1977 earthquake. In addition, the damage levelsassociated with the ground motions recorded during thesubsequent Vrancea seismic events of 1986 and 1990 are alsoassessed using the same method. The core of the method is therelation between the lateral displacement and the fundamentaleigenperiod of the structure. Thus, the displacement at the topof the structure is in Equation 1 [7]:
(1)
where T is the fundamental eigenperiod of the structure inthe considered direction, 2.75 is the story height of the ODsection type, λ is a parameter used for the simplified estimationof the period as a function of the number of stories (its value isto be determined subsequently) and RDR is a threshold for theroof drift ratio. The values of the parameter λ are taken as 11
(the number of stories)/0.57 (first eigenperiod in the transversaldirection) = 19.3 for the transversal direction and 11/0.42 =26.2 for the longitudinal direction. A smaller value λ = 12which leads to a fundamental eigenperiod of 0.92 s is also usedin the analysis for comparison purposes.
In Fig. (4) the demand is illustrated as the acceleration anddisplacement response spectra for all the rotated components ofthe ground motion recorded at INCERC station during theVrancea intermediate-depth earthquake of March 1977. Inaddition, the threshold spectral acceleration and displacementobtained for a roof drift ratio RDR = 0.5% are also shown inorder to better evaluate the impact of the rotated horizontalcomponents. The limit RDR = 0.5% was taken based on theresults of the pushover analysis shown in the previous sectionof the paper. It is obvious that the demand imposed by theseground motion recordings is smaller than the limit RDR =0.5% even for the more flexible direction of the structure (thetransversal direction). It can be noticed that the displacementdemand imposed by these rotated ground motion recordingsreaches and even exceeds the limit RDR = 0.5% only for long-period structures both for λ = 12 and λ = 19.3.
The same type of analysis was applied for the groundmotions recorded in the Bucharest area during the Vranceaintermediate-depth earthquakes of August 1986 and May 1990.The results are shown in Fig. (5) and Fig. (6) and in this case,the spectral acceleration and displacement obtained for an RDR= 0.25% are also shown in order to better evaluate the impactof the rotated horizontal components. It is noticeable the factthat the 1986 earthquake imposed larger displacement demandsthan the 1990 earthquake. However, the displacement demandcorresponding to the limit RDR = 0.25% is reached only in thecase of the more flexible structure with λ = 12. Thus, it can beconcluded that the damage level induced to this section type bythe Vrancea intermediate-depth earthquakes of August 1986and May 1990 is much smaller than the one due to the priorseismic event of March 1977.
Fig. (3). Mean and mean ± one standard deviation acceleration (left) and displacement (right) response spectra for all the rotated components of theground motion recorded at INCERC station during the Vrancea 1977 earthquake.
2.75 RDR T

Assessment of the Seismic Performance for a Low-Code The Open Construction and Building Technology Journal, 2020, Volume 14 115
Fig. (4). Acceleration (left) and displacement response spectra (right) for all the rotated components of the ground motion recorded at INCERCstation during the Vrancea 1977 earthquake. The spectral accelerations and displacements corresponding to an RDR = 0.5% and λ =12, 19.3 and 26.2are also illustrated on the plots.
Fig. (5). Acceleration (left) and displacement (right) response spectra for all the horizontal components recorded in the Bucharest area during theVrancea 1986 earthquake. The spectral acceleration and displacement corresponding to an RDR = 0.25% and λ =12, 19.3 and 26.2 are also illustratedon the plots.
Fig. (6). Acceleration (left) and displacement (right) response spectra for all the horizontal components recorded in the Bucharest area during theVrancea 1990 earthquake. The spectral acceleration and displacement corresponding to an RDR = 0.25% and λ =12, 19.3 and 26.2 are also illustratedon the plots.
3.3. Nonlinear Time History Analyses
The first series of nonlinear time history analyses wereconducted using as input the rotated components of the ground
motion recorded at INCERC station during the Vrancea inter-mediate-depth earthquake of March 4, 1977. The set of rotatedground motions is the same as the one used in the previous
116 The Open Construction and Building Technology Journal, 2020, Volume 14 Pavel and Vacareanu
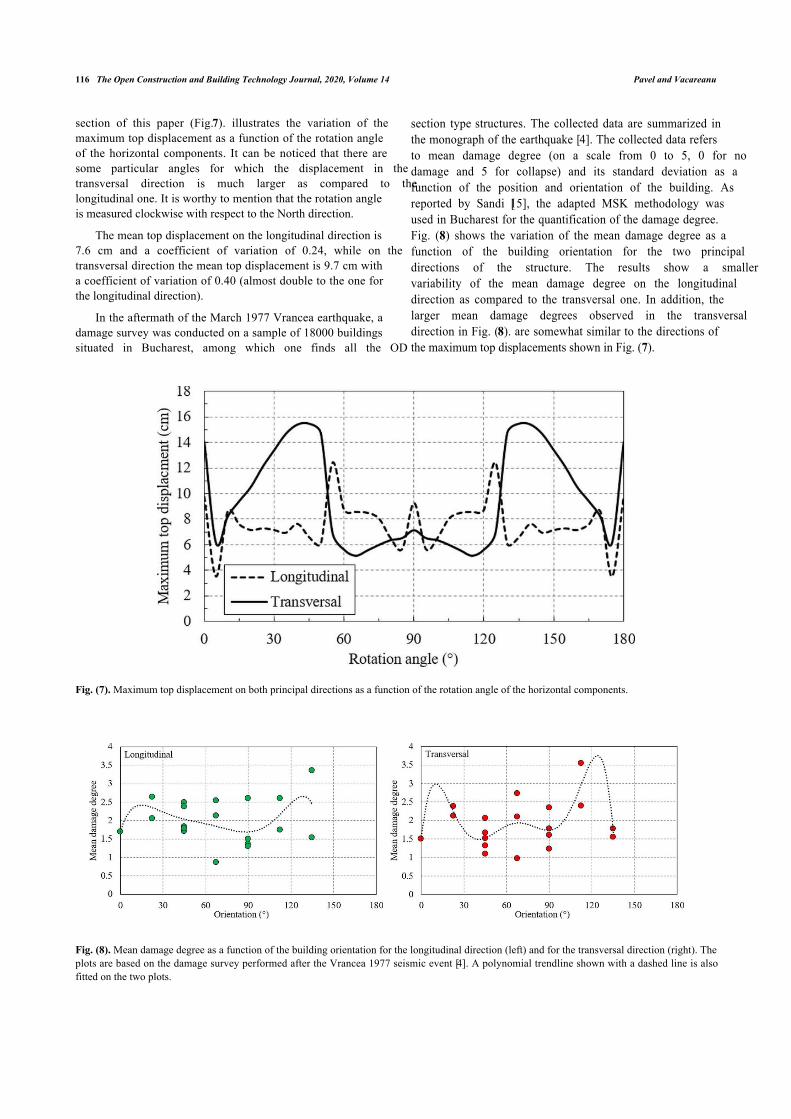
section of this paper (Fig. 7). illustrates the variation of themaximum top displacement as a function of the rotation angleof the horizontal components. It can be noticed that there aresome particular angles for which the displacement in thetransversal direction is much larger as compared to thelongitudinal one. It is worthy to mention that the rotation angleis measured clockwise with respect to the North direction.
The mean top displacement on the longitudinal direction is7.6 cm and a coefficient of variation of 0.24, while on thetransversal direction the mean top displacement is 9.7 cm witha coefficient of variation of 0.40 (almost double to the one forthe longitudinal direction).
In the aftermath of the March 1977 Vrancea earthquake, adamage survey was conducted on a sample of 18000 buildingssituated in Bucharest, among which one finds all the OD
section type structures. The collected data are summarized inthe monograph of the earthquake [4]. The collected data refersto mean damage degree (on a scale from 0 to 5, 0 for nodamage and 5 for collapse) and its standard deviation as afunction of the position and orientation of the building. Asreported by Sandi [15], the adapted MSK methodology wasused in Bucharest for the quantification of the damage degree.Fig. (8) shows the variation of the mean damage degree as afunction of the building orientation for the two principaldirections of the structure. The results show a smallervariability of the mean damage degree on the longitudinaldirection as compared to the transversal one. In addition, thelarger mean damage degrees observed in the transversaldirection in Fig. (8). are somewhat similar to the directions ofthe maximum top displacements shown in Fig. (7).
Fig. (7). Maximum top displacement on both principal directions as a function of the rotation angle of the horizontal components.
Fig. (8). Mean damage degree as a function of the building orientation for the longitudinal direction (left) and for the transversal direction (right). Theplots are based on the damage survey performed after the Vrancea 1977 seismic event [4]. A polynomial trendline shown with a dashed line is alsofitted on the two plots.
Assessment of the Seismic Performance for a Low-Code The Open Construction and Building Technology Journal, 2020, Volume 14 117
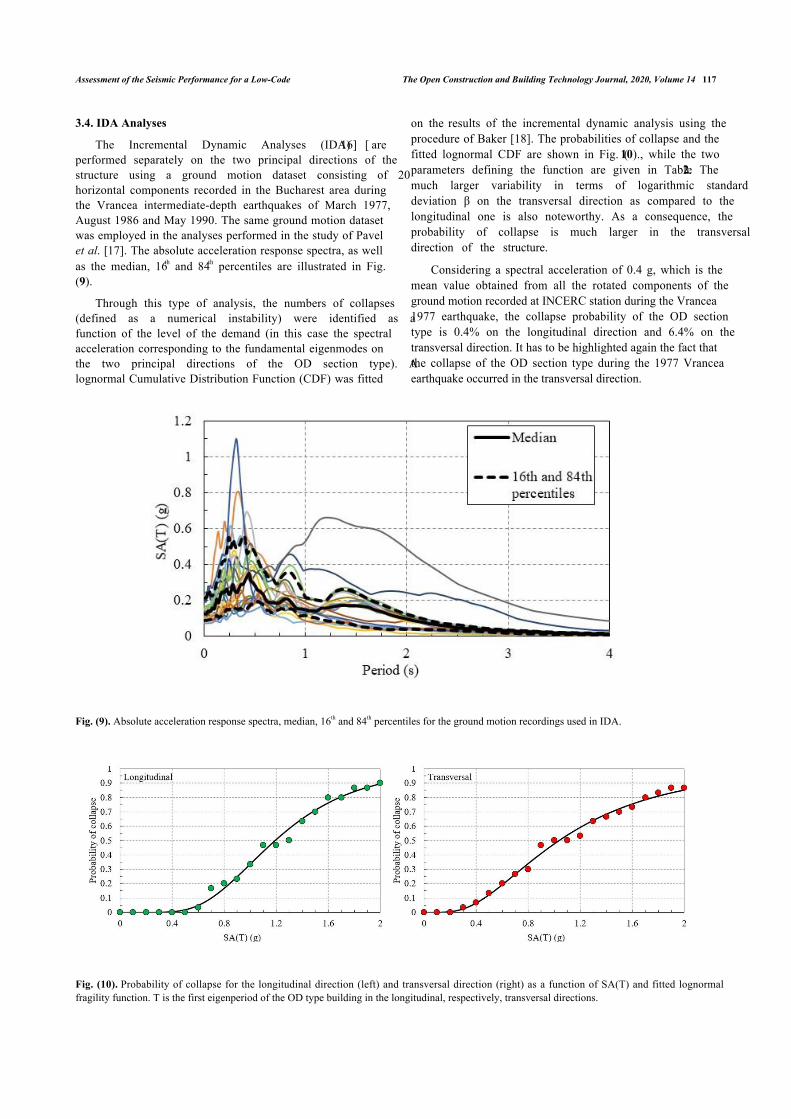
3.4. IDA Analyses
The Incremental Dynamic Analyses (IDA) [16] areperformed separately on the two principal directions of thestructure using a ground motion dataset consisting of 20horizontal components recorded in the Bucharest area duringthe Vrancea intermediate-depth earthquakes of March 1977,August 1986 and May 1990. The same ground motion datasetwas employed in the analyses performed in the study of Pavelet al. [17]. The absolute acceleration response spectra, as wellas the median, 16th and 84th percentiles are illustrated in Fig.(9).
Through this type of analysis, the numbers of collapses(defined as a numerical instability) were identified as afunction of the level of the demand (in this case the spectralacceleration corresponding to the fundamental eigenmodes onthe two principal directions of the OD section type). Alognormal Cumulative Distribution Function (CDF) was fitted
on the results of the incremental dynamic analysis using theprocedure of Baker [18]. The probabilities of collapse and thefitted lognormal CDF are shown in Fig. (10)., while the twoparameters defining the function are given in Table 2. Themuch larger variability in terms of logarithmic standarddeviation β on the transversal direction as compared to thelongitudinal one is also noteworthy. As a consequence, theprobability of collapse is much larger in the transversaldirection of the structure.
Considering a spectral acceleration of 0.4 g, which is themean value obtained from all the rotated components of theground motion recorded at INCERC station during the Vrancea1977 earthquake, the collapse probability of the OD sectiontype is 0.4% on the longitudinal direction and 6.4% on thetransversal direction. It has to be highlighted again the fact thatthe collapse of the OD section type during the 1977 Vranceaearthquake occurred in the transversal direction.
Fig. (9). Absolute acceleration response spectra, median, 16th and 84th percentiles for the ground motion recordings used in IDA.
Fig. (10). Probability of collapse for the longitudinal direction (left) and transversal direction (right) as a function of SA(T) and fitted lognormalfragility function. T is the first eigenperiod of the OD type building in the longitudinal, respectively, transversal directions.

118 The Open Construction and Building Technology Journal, 2020, Volume 14 Pavel and Vacareanu
Table 2. Parameters of the lognormal fragility functions for the two principal directions of the structure.
DirectionParameters of Lognormal Fragility Function
Median θ (g) Logarithmic Standard Deviation βLongitudinal 1.19 0.41Transversal 1.02 0.63
4. RESULTS AND DISCUSSION
4.1. Experimental Results
A series of five experimental tests were performed at theBuilding Research Institute in Tsukuba (Japan) and at theTechnical University of Civil Engineering Bucharest in themid-2000s in the framework of the Japan InternationalCooperation Agency (JICA) Project in Romania [19]. Three ofthe specimens were designed so as to fail in shear, while theother two exhibited a flexural type of failure. The specimensmeasured 1.8 m x 1.8 m and had a thickness of 10 cm. Theconcrete class and the reinforcement were similar to those usedfor structures built before 1977. The Axial Load Ratio (ALR)was 0.13 for four of the specimens and 0.26 for the last one.The first four specimens did not have horizontal or vertical webreinforcement with the exception of a beam placed at mid-height. The last specimen had a similar percentage (0.30%) ofhorizontal and vertical web reinforcement. The verticalreinforcement from the boundary elements consisted of either8Φ12 bars for the first three specimens or 4Φ8 for the last two
specimens.
Two methods namely, the modified UCSD methodproposed by Krolicki et al. [20] and which is based on theoriginal UCSD method of Kowalsky and Priestley [21] and theDisturbed Stress Filed Model (DSFM) proposed by Vecchio etal. [22] and implemented in VecTor2 [23] and VecTor4 [24]are applied using as input data the above-discussedexperimental results.
The proposed relation for assessing the shear strengthcapacity from the modified UCSD shear model in equation 2[20, 21].
(2)
where VC- is the shear component taken by the concrete, VS
is the shear component taken by the horizontal reinforcementand VP is the component due to the axial force. The parametersnecessary for the computation of each of the three componentsfor RC shear walls are given in the paper of Krolicki et al. [20]and will not be discussed hereafter.
Fig. (11). Comparison between the experimental and numerical results for the first three specimens which failed in shear.
cap C S PV V V V

Assessment of the Seismic Performance for a Low-Code The Open Construction and Building Technology Journal, 2020, Volume 14 119
Fig. (12). Comparison between the experimental and numerical results for the last two specimens which failed in flexure.
VecTor2 [23] and VecTor4 [24] are nonlinear finiteelement modelling software able to capture the 2D and 3Dbehaviour, respectively, of RC elements. Both of theseprograms have already been used in many studies referring tothe modelling of RC shear walls [25 - 27]. The basic materialmodels from VecTor2 [23] were used in order to model thebehaviour of the five experimental RC shear walls. Thecomparisons between the experimental value (envelope of theresults) and the numerical ones for the first three RC shearwalls (the ones which failed in shear) are shown in Fig. (11).The comparisons between the experimental results and thenumerical ones for the last two specimens (which failed due toflexure) are shown in Fig. (12).
The modified UCSD method [20] is capable of predictingthe failure mode of each of the five specimens. In addition, itcan be seen from both Fig. (11). and Fig. (12). that bothmethods are able to replicate quite accurately in some cases theenvelope of the force-displacement curve obtained from theexperimental results. As such, both methods are to be appliedsubsequently in order to evaluate the failure modes of some ofthe RC shear walls of the OD section type structure.
4.2. Numerical Analyses
The numerical analyses shown in this section aim atassessing the failure mode and the capacity of some of theindividual RC shear walls of the OD section type structure.Three types of RC shear walls namely, two lamellar transversalwalls (one edge wall and one interior wall) and the longitudinalone, are to be evaluated numerically using VecTor2 [23] andVecTor4 [24], as well as the modified UCSD method [20].
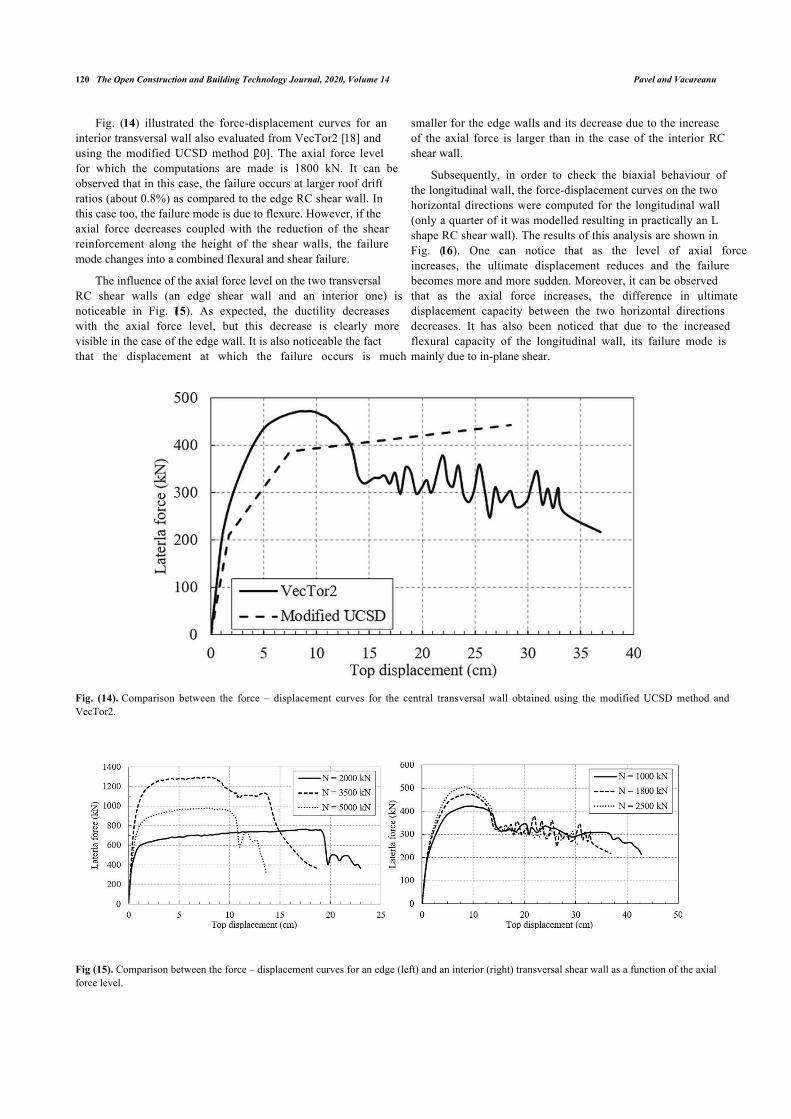
Fig. (13) shows the force – displacement curves obtainedfrom VecTor2 [23] and using the modified UCSD method [20]for the transversal edge wall (the single individual wallspanning on both bays in the transversal direction) subjected toan axial force level of 3500 kN. It can be observed that bothmethods provide the same capacity for this shear wall, withfailure occurring at a roof drift ratio of around 0.5 – 0.6%.Moreover, the failure mode of this wall is in flexure. The mainreasons for this type of failure are related to the fact that theboundary elements are small (22 x 30 cm) and theirconfinement reinforcement is extremely small (Φ6 stirrupsplaced at 30 cm).
Fig. (13). Comparison between the force – displacement curves for the edge transversal wall obtained using the modified UCSD method andVecTor2.
120 The Open Construction and Building Technology Journal, 2020, Volume 14 Pavel and Vacareanu
Fig. (14) illustrated the force-displacement curves for aninterior transversal wall also evaluated from VecTor2 [18] andusing the modified UCSD method [20]. The axial force levelfor which the computations are made is 1800 kN. It can beobserved that in this case, the failure occurs at larger roof driftratios (about 0.8%) as compared to the edge RC shear wall. Inthis case too, the failure mode is due to flexure. However, if theaxial force decreases coupled with the reduction of the shearreinforcement along the height of the shear walls, the failuremode changes into a combined flexural and shear failure.
The influence of the axial force level on the two transversalRC shear walls (an edge shear wall and an interior one) isnoticeable in Fig. (15). As expected, the ductility decreaseswith the axial force level, but this decrease is clearly morevisible in the case of the edge wall. It is also noticeable the factthat the displacement at which the failure occurs is much
smaller for the edge walls and its decrease due to the increaseof the axial force is larger than in the case of the interior RCshear wall.
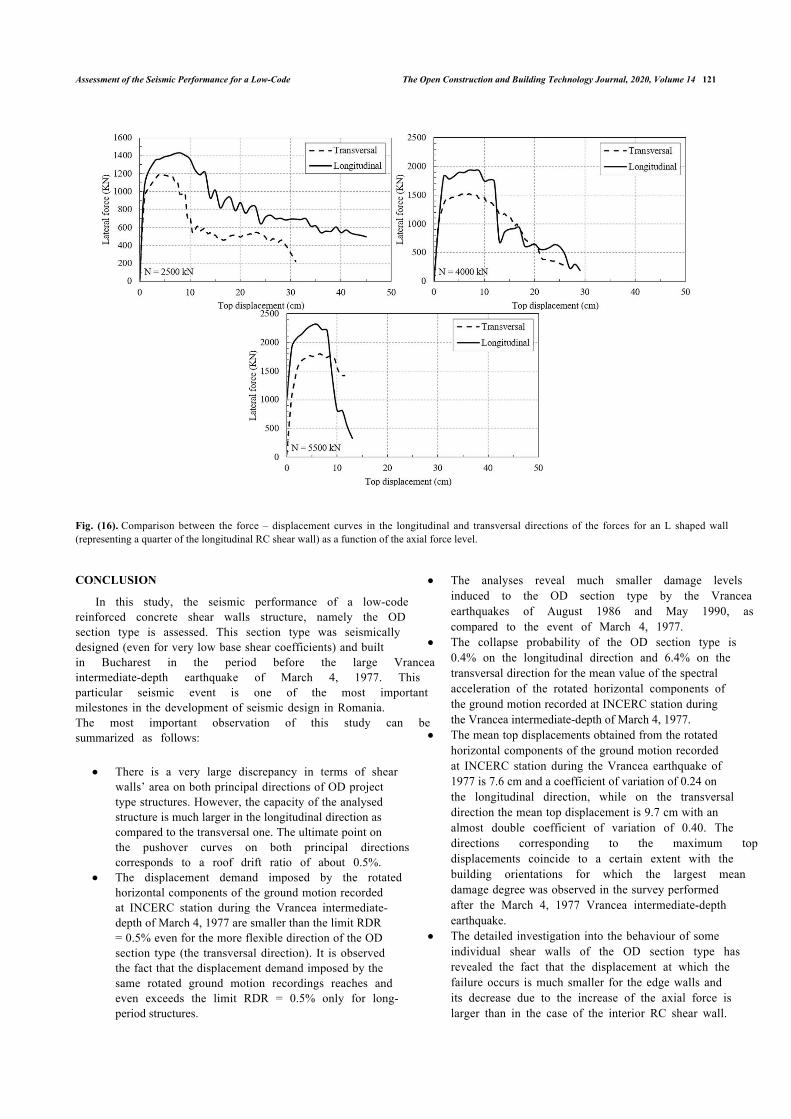
Subsequently, in order to check the biaxial behaviour ofthe longitudinal wall, the force-displacement curves on the twohorizontal directions were computed for the longitudinal wall(only a quarter of it was modelled resulting in practically an Lshape RC shear wall). The results of this analysis are shown inFig. (16). One can notice that as the level of axial forceincreases, the ultimate displacement reduces and the failurebecomes more and more sudden. Moreover, it can be observedthat as the axial force increases, the difference in ultimatedisplacement capacity between the two horizontal directionsdecreases. It has also been noticed that due to the increasedflexural capacity of the longitudinal wall, its failure mode ismainly due to in-plane shear.
Fig. (14). Comparison between the force – displacement curves for the central transversal wall obtained using the modified UCSD method andVecTor2.
Fig (15). Comparison between the force – displacement curves for an edge (left) and an interior (right) transversal shear wall as a function of the axialforce level.
Assessment of the Seismic Performance for a Low-Code The Open Construction and Building Technology Journal, 2020, Volume 14 121
Fig. (16). Comparison between the force – displacement curves in the longitudinal and transversal directions of the forces for an L shaped wall(representing a quarter of the longitudinal RC shear wall) as a function of the axial force level.
CONCLUSION
In this study, the seismic performance of a low-codereinforced concrete shear walls structure, namely the ODsection type is assessed. This section type was seismicallydesigned (even for very low base shear coefficients) and builtin Bucharest in the period before the large Vranceaintermediate-depth earthquake of March 4, 1977. Thisparticular seismic event is one of the most importantmilestones in the development of seismic design in Romania.The most important observation of this study can besummarized as follows:
There is a very large discrepancy in terms of shearwalls’ area on both principal directions of OD projecttype structures. However, the capacity of the analysedstructure is much larger in the longitudinal direction ascompared to the transversal one. The ultimate point onthe pushover curves on both principal directionscorresponds to a roof drift ratio of about 0.5%.The displacement demand imposed by the rotatedhorizontal components of the ground motion recordedat INCERC station during the Vrancea intermediate-depth of March 4, 1977 are smaller than the limit RDR= 0.5% even for the more flexible direction of the ODsection type (the transversal direction). It is observedthe fact that the displacement demand imposed by thesame rotated ground motion recordings reaches andeven exceeds the limit RDR = 0.5% only for long-period structures.
The analyses reveal much smaller damage levelsinduced to the OD section type by the Vranceaearthquakes of August 1986 and May 1990, ascompared to the event of March 4, 1977.The collapse probability of the OD section type is0.4% on the longitudinal direction and 6.4% on thetransversal direction for the mean value of the spectralacceleration of the rotated horizontal components ofthe ground motion recorded at INCERC station duringthe Vrancea intermediate-depth of March 4, 1977.The mean top displacements obtained from the rotatedhorizontal components of the ground motion recordedat INCERC station during the Vrancea earthquake of1977 is 7.6 cm and a coefficient of variation of 0.24 onthe longitudinal direction, while on the transversaldirection the mean top displacement is 9.7 cm with analmost double coefficient of variation of 0.40. Thedirections corresponding to the maximum topdisplacements coincide to a certain extent with thebuilding orientations for which the largest meandamage degree was observed in the survey performedafter the March 4, 1977 Vrancea intermediate-depthearthquake.The detailed investigation into the behaviour of someindividual shear walls of the OD section type hasrevealed the fact that the displacement at which thefailure occurs is much smaller for the edge walls andits decrease due to the increase of the axial force islarger than in the case of the interior RC shear wall.

122 The Open Construction and Building Technology Journal, 2020, Volume 14 Pavel and Vacareanu
Thus, it is likely that the collapse of the OD sectiontype during the Vrancea intermediate-depth earthquakeof March 4, 1977 was initiated through the flexuralfailure of the boundary elements in the edgetransversal RC shear walls.
The main conclusion of the study is that considering thebehaviour of the analysed type of structures during the Vrancea1977 event, the fact that these 40 – 50 years old structures arein large numbers in Bucharest and thus house many people andgiven the results of some of the analyses shown in this study,immediate seismic rehabilitation measures are needed in orderto correct, at least partially the structural issues of this sectiontype, in order to prevent their local or total collapse.
CONSENT FOR PUBLICATION
Not applicable.
AVAILABILITY OF DATA AND MATERIALS
Not applicable
FUNDING
None.
CONFLICT OF INTEREST
The authors declare no conflict of interest, financial orotherwise.
ACKNOWLEDGEMENTS
The first author wishes to thank Dr. Trevor Hrynyk forproviding the VecTor4 software used in some of the analysesperformed in this paper, as well as for its guidance forperforming the numerical analyses with VecTor4. Theconstructive comments from two anonymous Reviewers andfrom the Editor-in-Chief are greatly appreciated as they helpedus to considerably improve the quality of the originalmanuscript.
REFERENCES
E.S. Georgescu, and A. Pomonis, "The Romanian earthquake of March[1]4, 1977 revisited: New insights into its territorial, economic and socialimpacts and their bearing on the preparedness for the future", In:Proceedings of the 14th World Conference on Earthquake Engineering,2008.Beijing, ChinaE.S. Georgescu, and A. Pomonis, "Building damage vs. territorial[2]casualty patterns during the Vrancea (Romania) earthquakes of 1940and 1977", In: Proceedings of the 15th World Conference onEarthquake Engineering, 2012.Lisbon, PortugalE.S. Georgescu, and A. Pomonis, New archival evidence on the 1977[3]Vrancea, Romania earthquake and its impact on disaster managementand seismic risk.Seismic hazard and risk assessment – updatedoverview with emphasis on Romania., Springer InternationalPublishing, 2018, pp. 281-295.[http://dx.doi.org/10.1007/978-3-319-74724-8_19]S. Balan, V. Cristescu, I. Cornea, Eds., The Romanian earthquake on[4]March 4, 1977., Ed. Academiei: Bucharest, 1982. (in Romanian)A.B. Rigato, and R. Medina, "Influence of angle of incidence on[5]seismic demands for inelastic single-storey structures subjected to bi-directional ground motions", Eng. Struct., vol. 29, pp. 2593-2601,2007.[http://dx.doi.org/10.1016/j.engstruct.2007.01.008]N.D. Lagaros, "The impact of the earthquake incident angle on the[6]seismic loss estimation", Eng. Struct., vol. 32, pp. 1577-1589, 2010.
[http://dx.doi.org/10.1016/j.engstruct.2010.02.006]J.C. Reyes, and E. Kalkan, "Significance of rotating ground motions[7]on behavior of symmetric-and asymmetric-plan structures: Part I.Single-story structures", Eq. Spectra, vol. 31, pp. 1591-1612, 2015.[http://dx.doi.org/10.1193/072012EQS241M]C.C. Repapis, "Seismic performance evaluation of existing RC[8]buildings without seismic details. Comparison of nonlinear staticmethods and IDA", Open Constr. Build. Technol. J., vol. 10, pp.158-179, 2016.[http://dx.doi.org/10.2174/1874836801610010158]Seismosoft, SeismoStruct - A computer program for static and[9]dynamic nonlinear analysis of framed structures,2018.http://www.seismosoft.comJ.B. Mander, M.J.N. Priestley, and R. Park, "Theoretical stress-strain[10]model for confined concrete", J. Struct. Eng., vol. 114, pp. 1804-1826,1988.[http://dx.doi.org/10.1061/(ASCE)0733-9445(1988)114:8(1804)]M. Menegotto, and P.E. Pinto, "Method of analysis for cyclically[11]loaded R.C. plane frames including changes in geometry and non-elastic behaviour of elements under combined normal force andbending", In: Symposium on the resistance and ultimate deformabilityof structures acted on by well-defined repeated loads, InternationalAssociation for Bridge and Structural Engineering, 1973, pp.15-22.Zurich, SwitzerlandG. Monti, C. Nuti, and S. Santini, CYRUS - Cyclic response of[12]upgraded sections, Report No. 96-2, University of Chieti, Italy, 1996.F. Pavel, and G. Nica, "Influence of rotating strong ground motions on[13]the response of doubly symmetrical RC wall structures in Romaniaand its implication on code provisions", Int. J. Civ. Eng., vol. 17, pp.969-979, 2018.[http://dx.doi.org/10.1007/s40999-018-0346-4]R. Verdugo, F. Ochoa-Cornejo, J. Gonzales, and G. Valladares, "Site[14]effect and site classification in areas with large earthquakes", Soil Dyn.Earthq. Eng., vol. 126, p. 105071, 2019.[http://dx.doi.org/10.1016/j.soildyn.2018.02.002]H. Sandi, "WG Vulnerability and risk analysis for individual structures[15]and systems", In: Report to the 8th European Conference onEarthquake Engineering, 1986.Lisbon, PortugalD. Vamvatsikos, and C.A. Cornell, "Incremental dynamic analysis",[16]Earthquake Eng. Struct. Dynam., vol. 31, pp. 491-514, 2002.[http://dx.doi.org/10.1002/eqe.141]F. Pavel, A. Pricopie, and G. Nica, "Collapse assessment for a RC[17]frame structure in Bucharest (Romania)", Int. J. Civ. Eng., vol. 17, pp.1373-1381, 2019.[http://dx.doi.org/10.1007/s40999-019-00398-2]J.W. Baker, "Efficient analytical fragility function fitting using[18]dynamic structural analysis", Eq Spectra, vol. 31, pp. 579-599, 2015.[http://dx.doi.org/10.1193/021113EQS025M]M. Pavel, M. Seki, C. Pavel, and T. Kaminosono, "Experimental[19]research on low-reinforced concrete walls", Orizonturi Universitare,Ed., Proceedings of the International Symposium on Seismic RiskReduction – the JICA Technical Cooperation Project in Romania,2007 pp. 243-252 TimisoaraJ. Krolicki, J. Maffei, and G.M. Calvi, "Shear strength of reinforced[20]concrete walls subjected to cyclic loading", J. Earthquake Eng., vol.15, no. S1, pp. 30-71, 2011.[http://dx.doi.org/10.1080/13632469.2011.562049]M.J. Kowalsky, and M.J.N. Priestley, "Improved analytical model for[21]shear strength of circular reinforced concrete columns in seismicregions", ACI Struct. J., vol. 97, no. 3, pp. 388-396, 2000.F. Vecchio, D. Lai, W. Shim, and J. Ng, "Disturbed stress field model[22]for reinforced concrete: Formulation", J. Struct. Eng., vol. 126, no. 9,pp. 1070-1077, 2000.[http://dx.doi.org/10.1061/(ASCE)0733-9445(2000)126:9(1070)]P. Wong, F. Vecchio, and H. Trommels, Vector2 and FormWorks user[23]manual., Department of Civil Engineering, University of Toronto:Toronto, 2012.T.D. Hrynyk, "Behaviour and modelling of reinforced concrete slabs[24]and shells under static and dynamic loads", PhD thesis, University ofToronto, Toronto, Canada, 2013.I. Ghorbani-Renani, N. Velev, R. Tremblay, D. Palermo, B.[25]Massicotte, and P. Léger, "Modeling and testing influence of scalingeffects on inelastic response of shear walls", Struct. J., vol. 106, no. 3,pp. 358-367, 2009.H. Luu, I. Ghorbanirenani, P. Léger, and R. Tremblay, "Numerical[26]modeling of slender reinforced concrete shear wall shaking table testsunder high-frequency ground motions", J. Earthquake Eng., vol. 17,

Assessment of the Seismic Performance for a Low-Code The Open Construction and Building Technology Journal, 2020, Volume 14 123
no. 4, pp. 517-542, 2013.[http://dx.doi.org/10.1080/13632469.2013.767759]R.D. Hoult, H.M. Goldsworthy, and E. Lumantarna, "Plastic hinge[27]
analysis for lightly reinforced and unconfined concrete structuralwalls", Bull. Earthquake Eng., vol. 16, no. 10, pp. 4825-4860, 2018.[http://dx.doi.org/10.1007/s10518-018-0369-x]
© 2020 Pavel and Vacareanu
This is an open access article distributed under the terms of the Creative Commons Attribution 4.0 International Public License (CC-BY 4.0), a copy of which isavailable at: (https://creativecommons.org/licenses/by/4.0/legalcode). This license permits unrestricted use, distribution, and reproduction in any medium, providedthe original author and source are credited.