
THE ONOMIC E C C A SE FOR HS 2
76
THE ECONOMIC CASE FOR HS2 PFM v4.3: Assumptions report October 2013
Transcript of THE ONOMIC E C C A SE FOR HS 2

The economic case For hs2PFM v4.3: Assumptions report
October 2013

The economic case For hs2PFM v4.3: Assumptions report
October 2013

High Speed Two (HS2) Limited has been tasked by the Department for Transport (DfT) with managing the delivery of a new national high speed rail network. It is a non-departmental public body wholly owned by the DfT.
High Speed Two (HS2) Limited,2nd Floor, Eland House,Bressenden Place,London SW1E 5DU
Telephone: 020 7944 4908
General email enquiries: [email protected]
Website: www.hs2.org.uk
High Speed Two (HS2) Limited has actively considered the needs of blind and partially sighted people in accessing this document. The text will be made available in full on the HS2 website. The text may be freely downloaded and translated by individuals or organisations for conversion into other accessible formats. If you have other needs in this regard please contact High Speed Two (HS2) Limited.
© High Speed Two (HS2) Limited, 2013, except where otherwise stated.
Copyright in the typographical arrangement rests with High Speed Two (HS2) Limited.
This information is licensed under the Open Government Licence v2.0. To view this licence, visit www.nationalarchives.gov.uk/doc/open-government-licence/version/2 or write to the Information Policy Team, The National Archives, Kew, London TW9 4DU, or e-mail: [email protected]. Where we have identified any third-party copyright information you will need to obtain permission from the copyright holders concerned.
Document code: S&A 20

Contents
1 Introduction 1
2 Forecasting assumptions 1
2.1 Forecasting approach 1
2.2 Rail demand growth 1
2.3 Rail demand forecasts 8
2.4 Highway demand forecasts 11
2.5 Air demand forecasts 13
3 Appraisal 14
3.1 Background 14
3.2 Price base 14
3.3 Appraisal period 14
3.4 Parameters 14
4 Network changes – air and highway 20
4.1 Background 20
4.2 DM and DS highway network 20
4.3 DM and DS air networks 21
5 ‘Do Minimum’ rail network 23
5.1 Background 23
6 ‘Do Something’ rail changes 42
6.1 Introduction 42
6.2 HS2 service patterns 42
6.3 Phase Two and the full network 43
6.4 Released capacity 45
7 Reliability assumptions 69
7.1 PFMv4.3 Assumptions 69
8 General model assumptions 70
8.1 Introduction 70

PFMv4.3: Assumptions Report
1
1 Introduction 1.1.1 The PLANET Framework Model, or PFM, has been developed by HS2 Ltd as a tool to
forecast the demand and benefits of HS2. The current version of PFM is known as version 4.3 or PFMv4.3 and its methodology is separately described in the report Planet Framework Model (PFMv4.3) – Model Description.
1.1.2 This document provides a summary of the input and forecasting assumptions used by PFMv4.3 to generate what is known as the HS2 standard case, as presented in the separate Economic Case for HS2 document.
2 Forecasting assumptions 2.1 Forecasting approach
2.1.1 Separate forecasts of ‘Do Minimum’ (without scheme) demand are produced by mode and purpose. These make use of the recommended DfT modal forecasting procedures for air, car and rail.
Rail forecasts are generated in line with WebTAG using DfT's EDGE1 model.
Car forecasts are generated using the National Trip End Model in TEMPRO2.
Domestic air forecasts are generated using the DfT Aviation Model3.
2.1.2 The following sections in this chapter outline the input assumptions used by these models to produce ‘Do Minimum’ forecasts for each of these modes.
2.2 Rail demand growth
Elasticities
2.2.1 Rail demand growth is generated by DfT's EDGE model, which is based on current WebTAG4 guidance for forecasting rail demand. This uses PDFH5 growth elasticities for all variables except fares that are based on PDFH4 elasticities.
Demand drivers
2.2.2 HS2 Ltd’s use of the EDGE model and PDFH utilises 14 different demand drivers, which feed into the future year forecasts of rail demand. The base year of PFM represents the financial year 2010/11 (described in this report as 2010) so the drivers are provided as a change from this base to the two forecast years as defined above. The demand drivers for the modelling were provided by the Department for
Transport, and the following sections detail the source data and assumptions used for each of these drivers.
1 EDGE= Exogenous Demand Growth Estimation. Details are given in WebTAG TAG Unit 3.15.4 Rail Passenger Demand Forecasting Methodology. 2 Refer to WebTAG TAG Unit 3.15.2: Use of Tempro Data. 3 The Model is described in ‘UK Aviation Forecasts, DfT, January 2013. 4 WebTAG TAG unit 3.15.4: Rail Passenger Demand Forecasting Methodology, August 2012.

PFMv4.3: Assumptions Report
2
Population growth
2.2.3 The growth in population has been sourced from October 2011 Office of National Statistics (ONS) National Forecasts (low migration variant)5, with regional shares based on July 2012 data provided by the Centre for Economics and Business Research (CEBR). Table 2-1 below presents the GB population for 2010 and the predicted growth for 2026 and 2036.
Table 2-1: Regional population growth used in rail demand forecasts – PFMv4.3
Region Growth in Population from 2010
2026 2036
North East 3.3% 5.6%
North West 7.6% 9.3%
Yorkshire & Humberside 7.5% 13.4%
East Midlands 13.2% 19.4%
West Midlands 9.9% 13.5%
East of England 13.1% 20.5%
London 17.8% 25.0%
South East 8.7% 13.9%
South West 7.4% 13.6%
Wales 6.4% 9.1%
Scotland 5.4% 5.9%
Great Britain 9.8% 14.5%
Employment growth
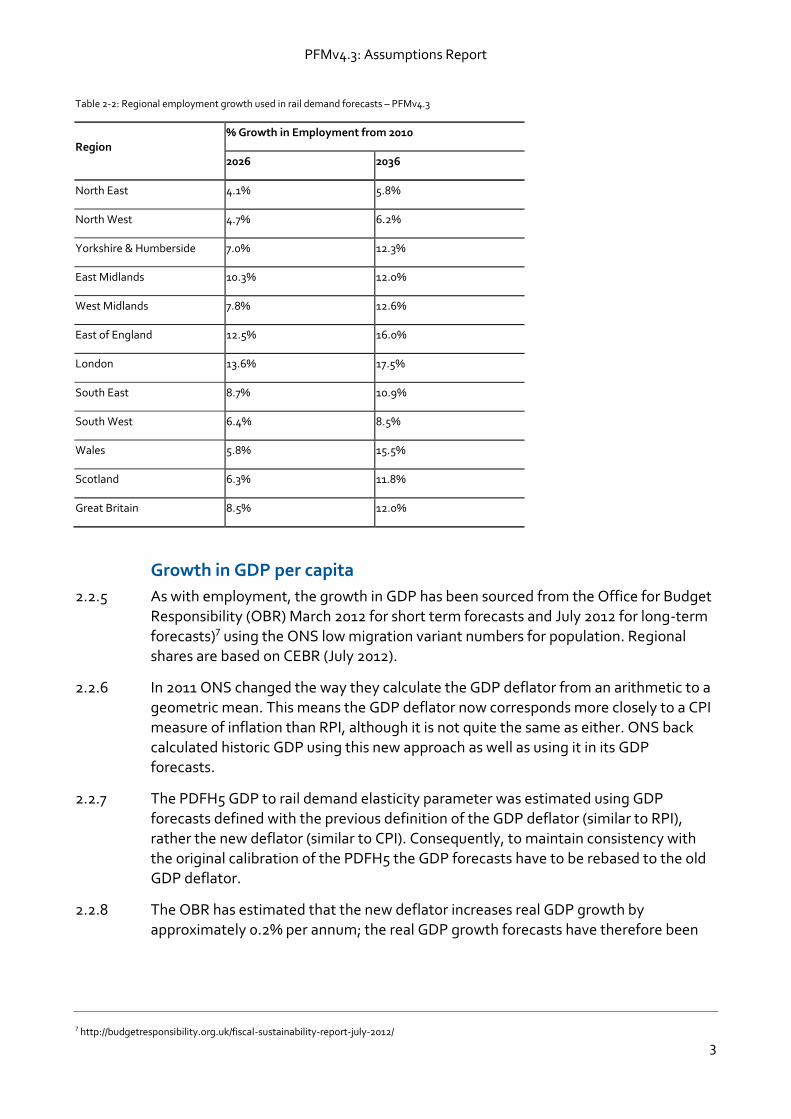
2.2.4 The growth in employment has been sourced from the Office for Budget Responsibility (OBR) March 2012 for short term forecasts and July 2012 for long-term forecasts)6 using the ONS low migration variant numbers for population. Regional shares are based on CEBR (July 2012). Table 2-2 below presents the GB employment for 2010 and the predicted growth for 2026 and 2036.
5 http://www.ons.gov.uk/ons/rel/npp/national-population-projections/2010-based-projections/stb-2010-based-npp-principal-and-key-variants.html#tab-Variant-population-projections. Accessed 25 October 2013. 6 http://budgetresponsibility.org.uk/fiscal-sustainability-report-july-2012/. Accessed 25 October 2013.
PFMv4.3: Assumptions Report
3
Table 2-2: Regional employment growth used in rail demand forecasts – PFMv4.3
Region % Growth in Employment from 2010
2026 2036
North East 4.1% 5.8%
North West 4.7% 6.2%
Yorkshire & Humberside 7.0% 12.3%
East Midlands 10.3% 12.0%
West Midlands 7.8% 12.6%
East of England 12.5% 16.0%
London 13.6% 17.5%
South East 8.7% 10.9%
South West 6.4% 8.5%
Wales 5.8% 15.5%
Scotland 6.3% 11.8%
Great Britain 8.5% 12.0%
Growth in GDP per capita
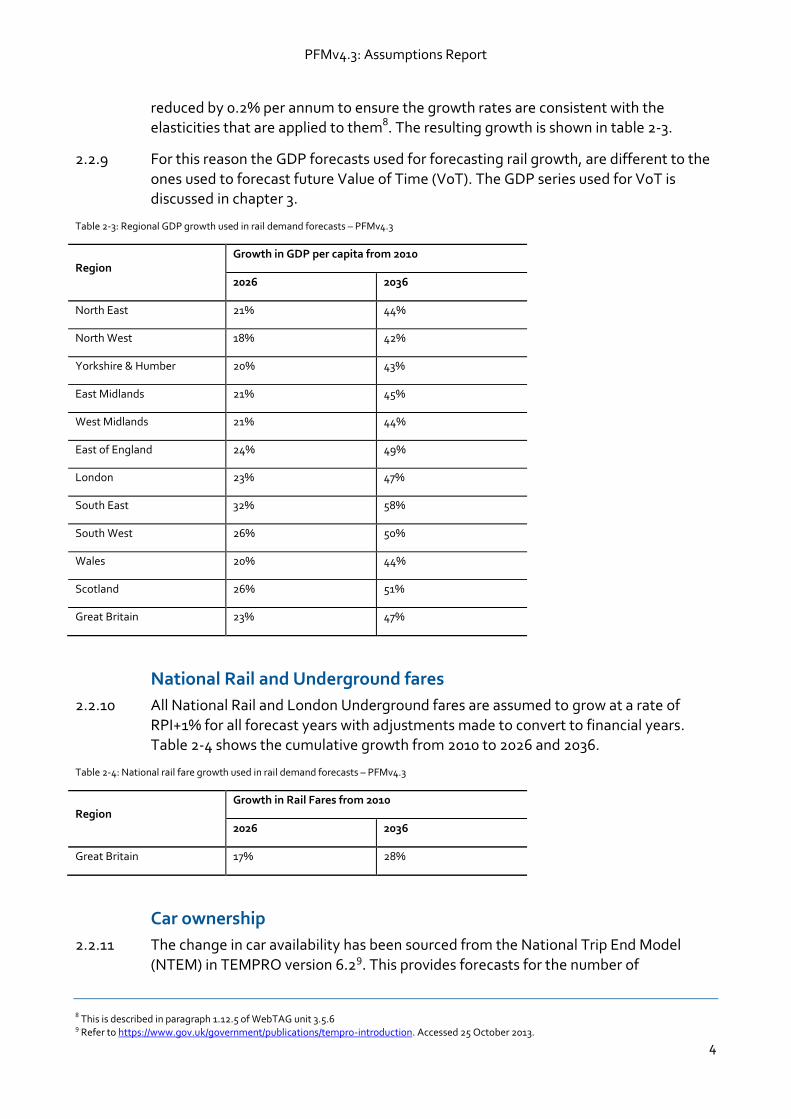
2.2.5 As with employment, the growth in GDP has been sourced from the Office for Budget Responsibility (OBR) March 2012 for short term forecasts and July 2012 for long-term
forecasts)7 using the ONS low migration variant numbers for population. Regional shares are based on CEBR (July 2012).
2.2.6 In 2011 ONS changed the way they calculate the GDP deflator from an arithmetic to a geometric mean. This means the GDP deflator now corresponds more closely to a CPI measure of inflation than RPI, although it is not quite the same as either. ONS back calculated historic GDP using this new approach as well as using it in its GDP forecasts.
2.2.7 The PDFH5 GDP to rail demand elasticity parameter was estimated using GDP forecasts defined with the previous definition of the GDP deflator (similar to RPI), rather the new deflator (similar to CPI). Consequently, to maintain consistency with the original calibration of the PDFH5 the GDP forecasts have to be rebased to the old GDP deflator.
2.2.8 The OBR has estimated that the new deflator increases real GDP growth by approximately 0.2% per annum; the real GDP growth forecasts have therefore been
7 http://budgetresponsibility.org.uk/fiscal-sustainability-report-july-2012/
PFMv4.3: Assumptions Report
4
reduced by 0.2% per annum to ensure the growth rates are consistent with the elasticities that are applied to them8. The resulting growth is shown in table 2-3.
2.2.9 For this reason the GDP forecasts used for forecasting rail growth, are different to the ones used to forecast future Value of Time (VoT). The GDP series used for VoT is discussed in chapter 3.
Table 2-3: Regional GDP growth used in rail demand forecasts – PFMv4.3
Region Growth in GDP per capita from 2010
2026 2036
North East 21% 44%
North West 18% 42%
Yorkshire & Humber 20% 43%
East Midlands 21% 45%
West Midlands 21% 44%
East of England 24% 49%
London 23% 47%
South East 32% 58%
South West 26% 50%
Wales 20% 44%
Scotland 26% 51%
Great Britain 23% 47%
National Rail and Underground fares
2.2.10 All National Rail and London Underground fares are assumed to grow at a rate of RPI+1% for all forecast years with adjustments made to convert to financial years. Table 2-4 shows the cumulative growth from 2010 to 2026 and 2036.
Table 2-4: National rail fare growth used in rail demand forecasts – PFMv4.3
Region Growth in Rail Fares from 2010
2026 2036
Great Britain 17% 28%
Car ownership
2.2.11 The change in car availability has been sourced from the National Trip End Model (NTEM) in TEMPRO version 6.29. This provides forecasts for the number of
8 This is described in paragraph 1.12.5 of WebTAG unit 3.5.6 9 Refer to https://www.gov.uk/government/publications/tempro-introduction. Accessed 25 October 2013.

PFMv4.3: Assumptions Report
5
households with access to a car. Table 2-5 shows the growth in car owning households for key RIFF10 zones within the HS2 corridor.
Table 2-5: Car ownership growth used in rail demand forecasts – PFMv4.3
Region Growth in Car Owning Households from 2010
2026 2036
Central London 10% 15%
Central Manchester 6% 8%
Rest of Manchester 5% 7%
Central Birmingham 8% 12%
Rest of West Midlands 4% 5%
Leeds 7% 9%
Rest of West Yorkshire 5% 7%
Great Britain 1% 3%
Car journey times
2.2.12 The change in average car journey times used in the EDGE model has been sourced from the DfT’s National Transport Model11. The assumptions for travel times to London from the Rest of Great Britain are shown in table 2-6.
Table 2-6: Car journey time growth used in rail demand forecasts – PFMv4.3
Region Growth in Car Journey Times from 2010
2026 2036
Rest of GB to London 5% 10%
10 RIFF Zones- These are groups of areas defined within the EDGE rail forecasting model used by the DfT. 11 Refer to https://www.gov.uk/government/collections/transport-appraisal-and-modelling-tools. Accessed 25 October 2013.

PFMv4.3: Assumptions Report
6
Car fuel price
2.2.13 Growth in car fuel prices have been sourced from DfT fuel price forecasts based upon the November 2011 DECC oil price forecasts and March 2011 budget indirect tax assumptions as set out in WebTAG12 and are shown in table 2-7.
Table 2-7: Car fuel price growth used in rail demand forecasts – PFMv4.3
Region Growth in Car Fuel Price from 2010
2026 2036
Great Britain 22% 24%
Bus and coach fares
2.2.14 Bus and coach fares are assumed to grow at a rate of RPI+2% for all years between 2010 and 2036. This is based on examination by the DfT of past trends using data from the ONS and the DfT. The growth from 2010 is shown in table 2-8.
Table 2-8: Bus and coach fare growth used in rail demand forecasts – PFMv4.3
Region Growth in Bus Costs from 2010
2026 2036
Great Britain 42% 77%
Bus and coach journey times
2.2.15 The forecast change in average bus and coach journey times has been sourced from
the DfT’s National Transport Model and is therefore consistent with the road journey times. The change from 2010 for travel times to London from the rest of Great Britain is shown in table 2-9.
Table 2-9: Bus and coach journey time growth used in rail demand forecasts – PFMv4.3
Region Growth in Bus and Coach Journey Times from 2010
2026 2036
Rest of GB to London 8% 16%
12 These assumptions are described in WebTAG 3.5.6.
PFMv4.3: Assumptions Report
7
Bus and coach frequency
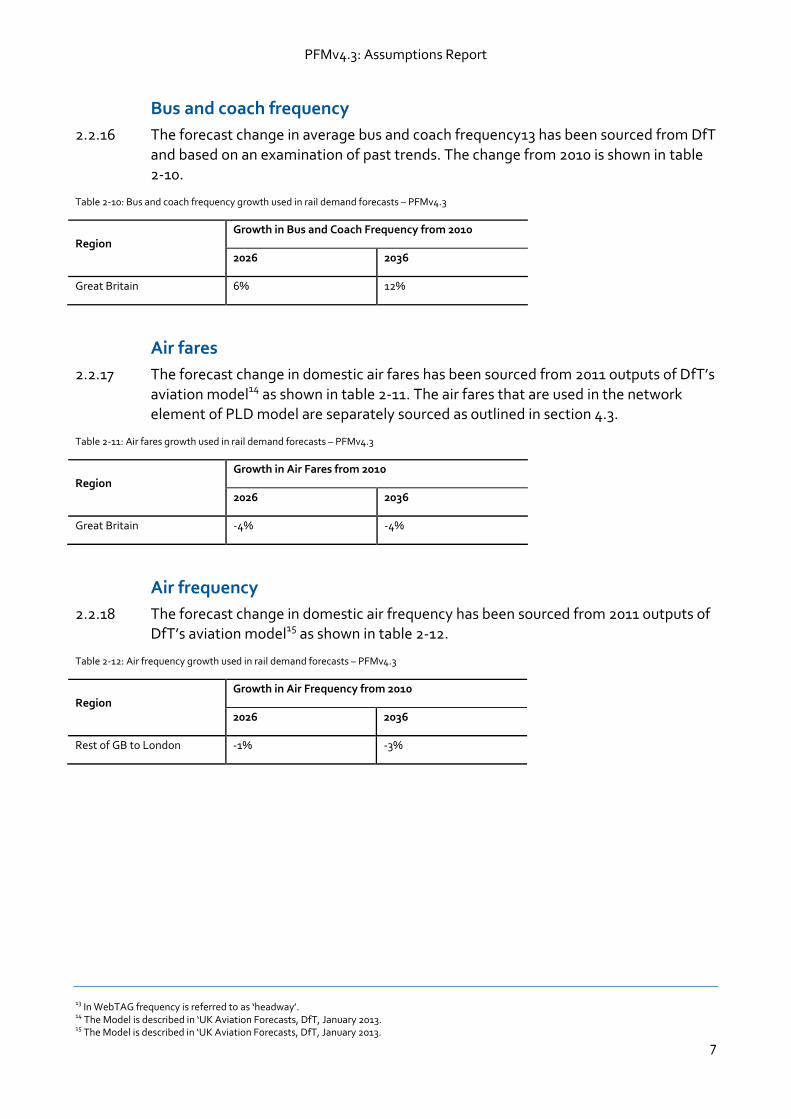
2.2.16 The forecast change in average bus and coach frequency13 has been sourced from DfT and based on an examination of past trends. The change from 2010 is shown in table 2-10.
Table 2-10: Bus and coach frequency growth used in rail demand forecasts – PFMv4.3
Region Growth in Bus and Coach Frequency from 2010
2026 2036
Great Britain 6% 12%
Air fares
2.2.17 The forecast change in domestic air fares has been sourced from 2011 outputs of DfT’s aviation model14 as shown in table 2-11. The air fares that are used in the network element of PLD model are separately sourced as outlined in section 4.3.
Table 2-11: Air fares growth used in rail demand forecasts – PFMv4.3
Region Growth in Air Fares from 2010
2026 2036
Great Britain -4% -4%
Air frequency
2.2.18 The forecast change in domestic air frequency has been sourced from 2011 outputs of DfT’s aviation model15 as shown in table 2-12.
Table 2-12: Air frequency growth used in rail demand forecasts – PFMv4.3
Region Growth in Air Frequency from 2010
2026 2036
Rest of GB to London -1% -3%
13 In WebTAG frequency is referred to as ‘headway’. 14 The Model is described in ‘UK Aviation Forecasts, DfT, January 2013. 15 The Model is described in ‘UK Aviation Forecasts, DfT, January 2013.

PFMv4.3: Assumptions Report
8
Air passengers
2.2.19 The forecast change in domestic air passengers has been sourced from 2011 outputs of DfT’s aviation model16. Table 2-13 shows forecasts growth from 2010 of air passengers by airport.
Table 2-13: Air passengers growth used in rail demand forecasts – PFMv4.3
Region Growth in Air Passengers from 2010/11
2026 2036
Gatwick Airport 16% 23%
Heathrow Airport 23% 33%
Luton Airport 113% 139%
Stansted Airport 64% 88%
Birmingham Airport 147% 189%
Manchester Airport 52% 110%
Southampton Airport 126% 345%
Cardiff Airport 9% 42%
2.3 Rail demand forecasts
Cap year
2.3.1 The forecast years with PFMv4.3 are taken as:
An opening year – assumed to be 2026; and
A cap year – currently assumed to be 2036.
2.3.2 The cap year represents the year at which long distance rail demand is forecast to reach a certain level beyond which no further demand growth (on any mode) occurs. The cap year is defined as the year in which long distance rail trips over 100 miles (within the PLD matrix) are forecast to equal 290,146 trips17. This represents an increase in rail trips over 100 miles of 79% from a 2010 base. With current growth assumptions this results with the cap year in PFMv4.3 occurring for all modes in 2036.
2.3.3 This cap definition is based on the number of trips originally predicted in the economic case published in February 2011. Capping demand in this way ensures a consistent capping assumption is applied for the standard case across different generations of the economic case.
2.3.4 Using the above rail demand drivers the EDGE model produces rail growth forecasts for 2026 (taken as the opening year of the scheme) and 2036 the year in which the
16 The Model is described in ‘UK Aviation Forecasts, DfT, January 2013 17 HS2 Ltd use the year which is the closest to this target. In PFMv4.3, the number of PLD trips greater than 100 miles in 2036 is 288,469.

PFMv4.3: Assumptions Report
9
demand cap is reached. The growth is summarised in Table 2-14: Input forecast PLD matrices – growth in rail demand by journey purpose – PFMv4.3.
Table 2-14: Input forecast PLD matrices – growth in rail demand by journey purpose – PFMv4.3
Journey Purpose
Growth in Rail Demand from 2010/11 (Note this is the growth in PLD matrices only)
2026 2036
Commuting NCA 10% 19%
Commuting CA from 34% 61%
Commuting CA to 34% 61%
Business CA from 54% 90%
Business CA to 62% 101%
Leisure NCA 15% 28%
Leisure CA from 38% 68%
Leisure CA to 40% 71%
Total 35% 62%
*Note that the car available/ non-car available split does not apply for rail business trips.

PFMv4.3: Assumptions Report
10
Table 2-15: Forecast regional PLANET matrices – growth in rail demand PFMv4.3 (2026 and 2036)
Regional Model Journey Purpose
Growth in Rail Demand from 2010/11 (Note this is the growth in Regional matrices only)
2026 2036
PL
AN
ET
So
uth
(P
S)
Commuting PA 49% 74%
Commuting AP 46% 70%
Business PA 51% 85%
Business AP 49% 82%
Leisure PA 54% 88%
Leisure AP 47% 80%
Total 49% 76%
PL
AN
ET
Mid
lan
ds
(PM
)
Commuting CA 37% 63%
Commuting NCA 15% 29%
Business CA 37% 62%
Business NCA 20% 35%
Leisure CA 38% 64%
Leisure NCA 16% 31%
Total 34% 58%
PL
AN
ET
No
rth
(P
N)
Commuting CA 33% 59%
Commuting NCA 10% 22%
Business CA 36% 66%
Business NCA 12% 26%
Leisure CA 38% 70%
Leisure NCA 14% 29%
Total 30% 55%
*PA = Production Attraction. AP= Attraction production CA= Car Available NCA = No Car available

PFMv4.3: Assumptions Report
11
2.4 Highway demand forecasts
GDP
2.4.1 The highway demand forecasts were developed using factors derived from TEMPROv6.2. To ensure consistency between these TEMPRO based forecasts and the rail forecasts, which used a more recent OBR GDP growth forecast, a GDP elasticity was applied to the matrices to correct for the discrepancy.
2.4.2 Use was made of the DfT Long Distance Model forecasts using a high and low GDP estimate to derive implied arc elasticities of highway demand to GDP. The elasticities that were derived are shown in table 2-16.
Table 2-16: Implied elasticity of highway demand to GDP
Attribute Purpose
Commuting Business Other
Implied Elasticity 0.087 0.151 0.147
2.4.3 The elasticities shown above were applied to the relative growth in GDP and global factors were calculated with these values, which are shown in table 2-17. These values were applied to the forecast matrices to correct for the change in GDP forecast.
Table 2-17: Growth applied highway demand to correct for change in GDP forecasts
Year Growth applied to TEMPROv6.2 outputs
Commuting Business Other
2026 -0.5% -0.9% -0.8%
2036 -0.6% -1% -1%
Highway forecasts for long distance trips by purpose
2.4.4 Including the adjustment described above, Table shows the highway forecasts applied to the base matrices by the three trip purposes.
Table 2-18: Highway forecasts for long distance trips used in PFM4.3
Journey Purpose
Growth in Highway Trips from 2010
2026 2036
Commuting 9% 12%
Business 10% 15%
Leisure 14% 21%
Total 12% 18%

PFMv4.3: Assumptions Report
12
Highway forecasts for short distance trips
2.4.5 Short-distance trips and good vehicles are represented as pre-loaded flows on the network. For the base year these are calculated by assigning the base year PLD matrices onto the highway network and taking the difference between the assigned flows and observed traffic flows. The traffic flow data was primarily derived from the Highways Agency TRADS database.
2.4.6 The method to calculate the preloads for the forecast years used the NTM traffic forecast component of the Road Transport Forecasts 2011 (RTF11)18. The key input assumptions to RTF11 are the following:
population and employment data – based on NTEM 5.4;
GDP forecasts – 2011-2015 from OBR projections (Budget 2011), and post 2015 growth from OBR’s July 2011 Fiscal Sustainability Report; and
fuel prices – based on DECC’s October 2011 fossil fuel price projections.
2.4.7 It is noted that the above assumptions are not consistent with those used for forecasting other modes, however, these are the latest DfT assumptions and so are the most appropriate source of data.
2.4.8 NTM forecasts traffic levels by region and road type using the DfT’s Fitting On of Regional Growth and Elasticities (FORGE) mechanism. FORGE is not a traditional assignment model, as it uses observed data on the level of traffic using each link of the road network from its 2003 base year and then applies elasticities derived from the demand model to forecast future levels of traffic.
2.4.9 The flows for the years required for the study (2010, 2026 and 2036) were derived
using interpolation and extrapolation from Table 4.3 from Road Transport Forecasts19 2011 which is also shown below in Table. The link preloads were uplifted using the following assumptions:
as the projections from the National Transport Model have a broad order of magnitude they possess a significant range of uncertainty. As this uncertainty is likely to be greater for more disaggregate results, a single factor was calculated to be applied globally to all regions.
the values calculated apply to England only; it is assumed that Wales and Scotland have the same growth factors;
as the assignment matrices are car only, the only vehicle type to be included in the calculation of the growth factor is car; and
as the nature of the network modelled is predominantly major roads, the only road types to be considered in the calculation of the growth factors are Motorway, Trunk and Principal.
18 http://assets.dft.gov.uk/publications/road-transport-forecasts-2011/road-transport-forecasts-2011-results.pdf. Accessed 25 October 2013. 19 https://www.gov.uk/government/uploads/system/uploads/attachment_data/file/4243/road-transport-forecasts-2011-results.pdf. Accessed 25 October 2013.

PFMv4.3: Assumptions Report
13
Table 2-19: Highway Forecasts by Vehicle Type and Road type, England
Growth from 2010
to 2036 Motorway Trunk Principal Other Roads All Roads
Cars 43% 40% 35% 35% 37%
LGV 88% 88% 87% 88% 87%
HGV 45% 43% 40% 39% 43%
Bus & Coach 0% -50% -11% -7% -11%
Total 49% 46% 42% 42% 44%
Source: NTM 2011
2.5 Air demand forecasts
2.5.1 The PLANET Framework Model (PFM v4.3) – Model Description report provides a detailed description of the DfT Aviation Model and its components. The demand drivers such as GDP are consistent with those adopted for the rail forecasts. The resulting matrix growth used is shown Table 2-20.
Table 2-20: DfT Aviation Matrices – Growth in Domestic Air Passengers in PFMv4.3 (annual domestic trips)
Journey Purpose
Growth in Domestic Air Passengers from 2010
2026 2036
Business 39% 74%
Leisure 32% 63%
Total 36% 69%
Note: There is no Air Passenger Commuting Matrix in PFMv4.3.

PFMv4.3: Assumptions Report
14
3 Appraisal 3.1 Background
3.1.1 The appraisal of HS2 requires a range of assumptions to compare costs and benefits in accordance with WebTAG guidance. This section outlines the assumptions that have been adopted and their source.
3.1.2 The economic appraisal uses outputs from the ‘Do Minimum’ and with HS2 scenarios run in PLD and the regional Planet models to produce a 60-year appraisal of the economic performance of the Phase One and Phase Two schemes.
3.1.3 The section breaks the assumptions down into different elements used in the appraisal.
3.2 Price base
3.2.1 The costs and benefits presented in the appraisal of HS2 are based on 2011 prices using the Office of National Statistics (ONS) GDP deflator as a measure of inflation. The definition of this deflator has been changed from being more consistent with a Retail Price Index (RPI) to being more consistent with a Consumer Price Index (CPI) metric.
3.3 Appraisal period
3.3.1 In line with WebTAG guidance the appraisal period is 60 years.
3.3.2 The key assumptions used in the modelling and appraisal by PFMv4.3 are
Phase One – Opening Year 2026
Phase Two – Opening Year 2033
First Forecast Modelled Year – 2026
Second Forecast Modelled Year – 2036
3.4 Parameters
Within the PFMv4.3 appraisal process there are a series of weights that are applied to each element by purpose. These are shown in table 3-1. The comparable weights used in the PFMv4.3 model are given in Chapter 8.

PFMv4.3: Assumptions Report
15
Table 3-1: Generalised cost element weights for rail – PFMv4.3
Rail Element Business Commute Other
In Vehicle Time 1.0 1.0 1.0
Wait Time 1.0 2.5 2.5
Access/Egress Costs PLD 1.0 1.0 1.0
Access/Egress Costs Regional Planets 1.0 2.0 2.0
Board Time Penalty (mins) 30.0 30.0 30.0
Values of time
3.4.1 The values of time in the appraisal are assumed to increase with income. The measure of income used is GDP per capita (as recommended by WebTAG Unit 3.5.6)20.
3.4.2 The appraisal is based on the same GDP and population sources that feed into the PFM demand (choice) model’s forecasts as outlined in chapter 2.
3.4.3 The precise inputs to the appraisal are OBR’s UK GDP growth forecasts published in June 2012 and the ONS low migration population growth projection for the UK. GDP growth is measured in real terms using the GDP deflator which is based on CPI (see Table).
3.4.4 These inputs to the appraisal differ slightly from their use in the demand model which are based on mainland Great Britain, that is, excluding the Scottish Islands and
Northern Ireland, and with income growth adjusted for inflation using the retail prices index.
Table 3-2: Growth in GDP used to derive values of time in the appraisal – PFMv4.3
Attribute Growth from 2010
2026 2036
GDP, UK, GDP deflator 44% 83%
Population, UK
(low migration variant) 10% 15%
GDP per person, UK 31% 60%
3.4.5 The values of time used in PFMv4.3 are based on forthcoming WEBTAG guidance21 and are given in table 3-3.
20 WebTAG TAG unit 3.5.6 Values of Time and Operating Costs 21 WebTAG TAG unit 3.5.6 Values of Time and Operating Costs

PFMv4.3: Assumptions Report
16
Table 3-3: Values of time – PFMv4.3
Mode Values of Time by Purpose (£/hr) PFMv4.3 Model (2010 prices)
Business Commute Other
Rail £31.90 per hour £6.81 per hour £6.04 per hour
Car £25.28 per hour £6.81 per hour £6.04 per hour
3.4.6 In line with forthcoming guidance (TAG 3.5.6) the values of working and non-working time are assumed to increase with income with an elasticity of 1.0.
Annualisation factors
3.4.7 PFMv4.3 provides outputs for an average weekday. In order to undertake an appraisal of the HS2 scheme these weekday values are annualised to represent a calendar year. Table 3-4 shows the annualisation factors that have been derived for each mode and journey purpose for use in PLD.
3.4.8 The factors for rail and air are consistent with the method adopted to de-annualise weekday demands from annual matrices. In the case of highway there is no de-annualisation in the matrix development process and the factors have been sourced from an analysis of NTS.
Table 3-4: Annualisation factors – PFMv4.3 PLD
Purpose Rail Air Highway
Business 256 313 275
Commuting 254 n/a 282
Other 416 313 361
Average 309 313 306
3.4.9 In addition there a set of factors used to annualise information from the regional Planet models which are given in table 3-5. The regional Planet models represent the morning peak period and so higher annualisation factors are used.

PFMv4.3: Assumptions Report
17
Table 3-5: Regional PLANET annualisation factors – PFMv4.3
Purpose 7AM to 10 AM 10AM to 4PM 4PM to 7PM 7PM to 7AM Total (incl.
Weekend)
Business User 304 539 365 169 1,376
Commuting User 278 86 260 73 697
Leisure User 303 1,181 602 476 2,562
Business Crowding 253 0 304 0 557
Commuting Crowding 253 0 237 0 490
Leisure Crowding 253 0 503 0 756
Fares
3.4.10 In accordance with WebTAG, benefits and costs in the appraisal are presented in real terms using the GDP deflator. As such the definition of inflation used in the calculation of revenue (RPI) and the definition of inflation used in the rest of the appraisal (GDP deflator) are inconsistent.
3.4.11 In order to define fares growth on the basis of the GDP deflator, revenues are uplifted by the difference in the RPI and GDP deflator indices over time. The difference between these indices is around 0.9% per annum, and in effect, this means real fares growth defined on the basis of RPI+1% per annum is equivalent to growth of the GDP deflator+1.9% per annum. By 2036 this difference is 28%.
3.4.12 For the purpose of our modelling, all National and London Underground fares are assumed to grow at a rate of RPI+1% for all years between 2010 and the second modelled year. Within the appraisal there is no further real growth in fares for the remainder of the appraisal period beyond that point.
3.4.13 The regional uni-modal models do not contain a fares matrix, and revenue is therefore calculated on the basis of average fares per km as shown in Table 3-6.
Table 3-6: Fares yield – PFMv4.3
Purpose Fares £/pass km (2010 Prices)
Planet South Planet Midlands Planet North
Business £0.138 £0.155 £0.148
Commuting £0.129 £0.139 £0.157
Other £0.125 £0.142 £0.138
Ramp-up effects
3.4.14 In order to reflect the demand and revenue assumptions in the early years of the HS2 scheme, a series of ramp up assumptions for demand benefits are applied within the appraisal as shown by table 3-7.

PFMv4.3: Assumptions Report
18
Table 3-7: Assumptions related to ramp-up effects
Year After Opening Year Phase One Year Phase Two
Growth adjustment
applied to Demand and
Benefits
0 2026 2033 -20%
1 2027 2034 -10%
2 2028 2035 -5%
3 and beyond 2029 2036 0%
Discount rates
3.4.15 In line with WebTAG Unit3.5.4 (August 2012)22 a series of discount rates are applied from 2011. The annual discount rates assumed are:
Until 2043: annual discount rate = 3.5%
Between 2044 and 2088: annual discount rate = 3.0%
Beyond 2089: annual discount rate = 2.5%
Highway factors used in the appraisal
3.4.16 Vehicle operating costs are derived using the approach outlined in WebTAG (Unit 3.5.6) 23. Fuel consumption is estimated using the function:
L= a/v + b + c.v + d.v2
Where
L= fuel consumption, expressed in litres per kilometres;
v= average speed in kilometres per hour; and
a,b,c,d are parameters defined for each vehicle category.
3.4.17 The vehicle operating cost parameters adopted within the HS2 appraisal are based on the parameters used by WebTAG (Unit 3.5.6)24. The appraisal uses an average speed of 50mph in all appraisal years.
3.4.18 In line with WebTAG3.9.5 (August 2012)25 the benefits of road decongestion are assessed. The assumptions used to derive Highway External Costs have been sourced from WebTAG3.9.5 (August 2012). The values for 2026 and 2036 are presented in table 3-8. These have been derived by interpolation of the values quoted in TAG3.9.5.
22 WebTAG TAG unit 3.5.4 Cost Benefit Analysis August 2012. 23 WebTAG TAG unit 3.5.6 Values of Time and Operating Costs. 24 WebTAG TAG unit 3.5.6 Values of Time and Operating Costs. 25 WebTAG TAG unit 3.9.5 MSA-Decongestion Benefits August 2012.

PFMv4.3: Assumptions Report
19
Table 3-8: Highway external costs (p/car km)
Element
Pence/ car km (2010) Pence/ car km (2026) Pence/ car km (2036)
Motorways A roads Other
Roads Motorways
A
roads
Other
Roads Motorways
A
roads
Other
Roads
Congestion (London) 0.1 69.2 48.4 1.2 149.9 80.4 3.2 221.1 108.5
Congestion (Conurbations) 2.9 35.2 24.5 6.0 60.2 45.3 11.4 88.0 64.5
Congestion (Other Urban) n/a 13.6 11.2 n/a 24.4 16.9 n/a 34.8 21.6
Congestion (Rural) 1.1 2.3 2.8 4.1 4.3 6.1 10.6 6.4 8.6
Infrastructure (London) 0.0 0.1 0.1 0.0 0.1 0.1 0.0 0.2 0.2
Infrastructure (Conurbation) 0.0 0.1 0.1 0.0 0.1 0.1 0.0 0.2 0.2
Infrastructure (Other Urban) n/a 0.1 0.1 n/a 0.1 0.1 n/a 0.2 0.2
Infrastructure (Rural) 0.0 0.1 0.1 0.0 0.1 0.1 0.0 0.2 0.2
Accident (London) 0.0 3.0 3.0 0.0 3.9 3.9 0.0 4.7 4.7
Accident (Conurbations) 0.0 3.0 3.0 0.0 3.9 3.9 0.0 4.7 4.7
Accident (Other Urban) n/a 3.0 3.0 n/a 3.9 3.9 n/a 4.7 4.7
Accident (Rural) 0.0 0.7 0.7 0.0 0.9 0.9 0.0 1.1 1.1
Local Air Quality (London) 0.3 0.3 0.3 0.1 0.0 0.0 0.1 0.0 0.0
Local Air Quality (Conurbations) 0.2 0.1 0.1 0.0 0.0 0.0 0.0 0.0 0.0
Local Air Quality (Other Urban) n/a 0.1 0.1 n/a 0.0 0.0 n/a 0.0 0.0
Local Air Quality (Rural) 0.1 0.0 0.0 0.0 0.0 0.0 0.0 0.0 0.0
Noise (London) 0.2 0.2 0.2 0.3 0.3 0.3 0.3 0.3 0.3
Noise (Conurbations) 0.2 0.2 0.2 0.3 0.3 0.3 0.3 0.3 0.3
Noise (Other Urban) n/a 0.2 0.2 n/a 0.3 0.3 n/a 0.3 0.3
Noise (Rural) 0.0 0.0 0.1 0.0 0.0 0.1 0.0 0.0 0.2
Greenhouse Gases (London) 0.9 1.0 1.2 0.7 0.8 1.0 1.1 1.3 1.5
Greenhouse Gases (Conurbations) 0.9 0.9 1.0 0.7 0.7 0.8 1.1 1.1 1.2
Greenhouse Gases (Other Urban) n/a 0.8 0.9 n/a 0.7 0.8 n/a 1.0 1.2
Greenhouse Gases (Rural) 0.9 0.8 0.8 0.7 0.7 0.7 1.1 1.0 1.0
Indirect Taxation (London) -5.3 -5.6 -7.1 -3.9 -4.4 -5.4 -3.5 -4.1 -5.0
Indirect Taxation (Conurbations) -5.2 -5.2 -5.7 -3.7 -3.9 -4.4 -3.4 -3.6 -3.9
Indirect Taxation (Other Urban) n/a -4.8 -5.4 n/a -3.6 -4.0 n/a -3.3 -3.7
Indirect Taxation (Rural) -5.3 -4.8 -4.7 -3.8 -3.5 -3.5 -3.4 -3.2 -3.2

PFMv4.3: Assumptions Report
20
4 Network changes – air and highway 4.1 Background
4.1.1 Within PLD and the regional PLANET models are a series of networks for the ‘Do Minimum’ and ‘Do Something’ scenarios. This chapter outlines the assumptions made for the forecast air and highway networks. Chapters 5 and 6 outline the assumptions related to the rail networks.
4.2 DM and DS highway network
4.2.1 For PFMv4.3 no additional highway schemes were added between 2026 and 2036, hence the 2026 and 2036 (cap year) networks were identical. In addition, they are also identical in the ‘Do Minimum’ and ‘Do Something’ scenarios.
4.2.2 The schemes that were included in the PFMv4.3 model are listed in table 4-1.
Table 4-1: Highway Schemes in PFMv4.3- 2026 and 2036
Scheme Assumed
A1 Bramham – Wetherby A11 Fiveways to Thetford Improvement
A3 Hindhead Improvement A160 / A180 Improvements, Immingham
A421 Bedford to M1 Junction 13 A465 Dualling Scheme between Abergavenny and Hirwaun
M1 Junctions 25-28 Widening Scheme A556 Knutsford to Bowdon Environmental Improvement
M25 Junctions 16-23 Widening M1 Junctions 28-31 Managed Motorways
M25 Junctions 27-30 Widening M1 Junctions 32-35a Managed Motorway
M27 J3-4 Widening M1 Junctions 39-42 Managed Motorway
M42 J7-9 HSR M25 Junctions 23-27 Managed Motorways
M6 J4-5 HSR M25 Junctions 5-7 Managed Motorways
M6 Junctions 8-10A Managed Motorways (Birmingham Box
Phase 2) M60 Junctions 15-12 Lane Gain
M74 Completion M60 Junctions 8-12 Managed Motorways
M80 Stepps to Haggs M62 Junctions 18-20 Managed Motorway
A1 Dishforth to Leeming Improvement Scheme (A1 Dishforth
to Barton) M8 M73 M74 Motorway Improvements
A23 Handcross to Warninglid A453 Widening (M1 Junction 24 to A52 Nottingham)
A46 Newark to Widmerpool Improvement A494 Drome Ewloe Improvement
M1 Junction 10-13 Improvements A5-M1 Link (A505 Dunstable Northern Bypass)
M4 Junction 19-20 and M5 Junction 15-17 Managed Motorways A9 Dualling
M4 Junction 3-2 Bus Lane Suspension Scheme M3 Junctions 2-4a Managed Motorway

PFMv4.3: Assumptions Report
21
Scheme Assumed
M6 Junctions 5-8 Managed Motorways (Birmingham Box Phase
3) M4 Junctions 3-12 Managed Motorway
M62 Junctions 25 to 30 Managed Motorway M54 to M6 / M6 (Toll) Link Road
M6 Junction 10A - 13 Managed Motorway
4.3 DM and DS air networks
4.3.1 The air passenger supply in PFM represents domestic air services wholly within mainland Britain, thus excludes services to Northern Ireland, the Channel Islands, Isle of Man and Scottish Islands. Within PFMv4.3 the networks for all years were taken directly from the DfT Aviation Model.
4.3.2 Table 4-2 shows the changes in routes between the various forecast years used in PFMv4.3.
Table 4-2: Air Network Changes in PFMv4.3
2026 Routes added relative to 2010 2026 Routes removed relative to 2010
Aberdeen – London City Aberdeen – Gatwick
Luton – Manchester Aberdeen – Luton
Newquay – Leeds Bradford* Edinburgh – Gatwick*
Newquay – Manchester* Gatwick – Manchester
Glasgow – Luton
Glasgow – Stansted
London City – Edinburgh*
Prestwick – Stansted
2036 Routes added relative to 2026 2036 Routes removed relative to 2026
Edinburgh – Gatwick* Edinburgh – Stansted*
Edinburgh – Inverness Gatwick – Glasgow
Exeter – Aberdeen* Glasgow – Leeds Bradford
Glasgow – Stansted* Inverness – Luton
Inverness – London City Newquay – Manchester*
Leeds Bradford – Prestwick Southampton – Glasgow*
Norwich – Exeter*
Norwich – Newquay*
Note: * = route operates one way

PFMv4.3: Assumptions Report
22
Air fares
4.3.3 The networks in PFMv4.3 take the base year domestic air fare matrix unadjusted from the DfT Aviation Model which provides air fares between all modelled airports in constant 2008 prices and values. These are adjusted to the 2010 base year and the forecast years using the index of changes in real domestic business and leisure fares supplied by the DfT.
4.3.4 The index of changes in real fares is shown in table 4-3.
Table 4-3: Real Fare Index Factors – Air Fares
Purpose Growth in Rail Fares from 2008
2010 2026 2036
Business 2% 0% 0%
Leisure 6% 0% 0%

PFMv4.3: Assumptions Report
23
5 ‘Do Minimum’ rail network 5.1 Background
5.1.1 The rail networks within PFMv4.3 include a representation of a timetable and its associated capacity. The ‘Do Minimum’ provides a reference against which the ‘Do Something’ HS2 option is compared.
5.1.2 With a few exceptions, the ‘Do Minimum’ timetable assumptions are based on committed schemes only. The ‘Do Minimum’ makes use of information provided by the DfT for Network Rail services and Transport for London (TfL) for London Underground Limited (LUL) services. The rail and LUL ‘Do Minimum’ networks are assumed to be identical in the 2026 and 2036 (cap year models).
5.1.3 These assumptions are designed only for the purpose of providing an indicative reference case for the appraisal of HS2. It should be noted that no decisions have yet been taken about train service requirements – or which stock will operate them – in any of the relevant franchises, and therefore these service patterns should be considered to be indicative.
5.1.4 In the PLD model these assumptions relate to the average service pattern on weekdays. Information used within the Regional Planet models relates to services during the Morning Period. Within these assumptions, no work has been undertaken to review the local commuter services.
5.1.5 A summary of the key assumptions used within PLD for the strategic Train Operating Companies are given in this chapter.
Chiltern Railway
5.1.6 The assumed future year ‘Do Minimum’ timetable includes Evergreen 3, which allows for new London Marylebone-Oxford services via Bicester Town to be introduced, as well as a small amount of train lengthening on some peak services between Aylesbury and High Wycombe.
5.1.7 The key changes arising in the service specification between 2010 and 2026 are:
An additional two trains per day each way operating from London Marylebone to Aylesbury (via Denham);
Diversion of services between Banbury and London Marylebone to instead
start from Oxford due to Evergreen 3 (Banbury continues to be served by Birmingham services to London Marylebone and a Birmingham to London Paddington service);
Revision of services between Bicester North and London Marylebone (Bicester North continues to be served by Birmingham services and the introduction of Oxford services provides trains stopping at Bicester Town);
The introduction of services between Birmingham Moor Street and Leamington Spa; and

PFMv4.3: Assumptions Report
24
The introduction of services between London Marylebone and Oxford
(Evergreen 3).
5.1.8 Figure 5-1 shows a summary of the service and service pattern assumed in the ‘Do Minimum’.
Figure 5-1: Chiltern- Average Service Pattern used in PFMv4.3 – ‘Do Minimum’
Cross Country
5.1.9 The future year ‘Do Minimum’ timetable includes electrification, with an all-electric fleet, but with locomotive hauled service on non-electrified routes or sections of routes. The timetable assumes no significant changes in journey times except where services are diverted via East-West Rail (e.g. Bournemouth to Manchester Piccadilly).
5.1.10 There are small changes in the future year ‘Do Minimum’ timetable from the modelled base year with the notable exception being the addition of an hourly service between Manchester and Birmingham International which was added due to extra train paths becoming available as a result of some Cross Country services being re-routed via East-West Rail and to maintain Stockport/Macclesfield/Stoke-on-Trent frequencies to Birmingham New Street and Birmingham International.

PFMv4.3: Assumptions Report
25
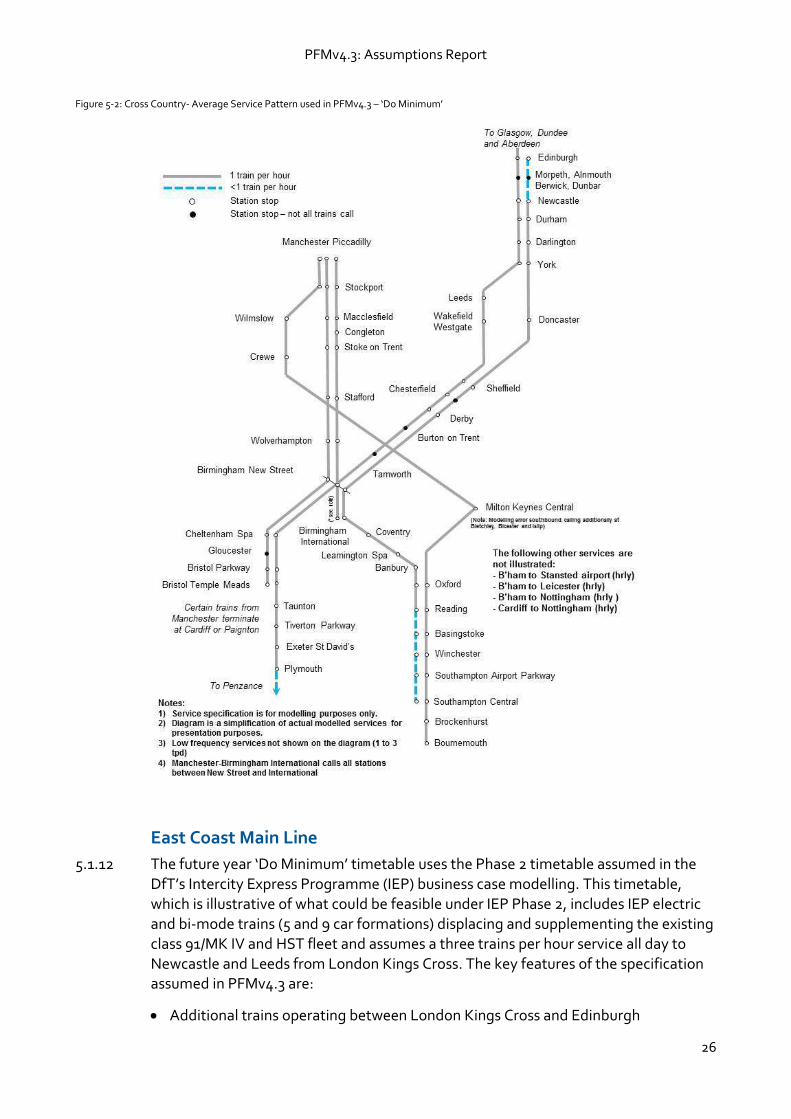
5.1.11 Figure 5-2 shows a summary of the service and stopping pattern assumed in the ‘Do Minimum’ for Cross Country services.
PFMv4.3: Assumptions Report
26
Figure 5-2: Cross Country- Average Service Pattern used in PFMv4.3 – ‘Do Minimum’
East Coast Main Line
5.1.12 The future year ‘Do Minimum’ timetable uses the Phase 2 timetable assumed in the
DfT’s Intercity Express Programme (IEP) business case modelling. This timetable, which is illustrative of what could be feasible under IEP Phase 2, includes IEP electric and bi-mode trains (5 and 9 car formations) displacing and supplementing the existing class 91/MK IV and HST fleet and assumes a three trains per hour service all day to Newcastle and Leeds from London Kings Cross. The key features of the specification assumed in PFMv4.3 are:
Additional trains operating between London Kings Cross and Edinburgh

PFMv4.3: Assumptions Report
27
Waverley (an additional 13 services southbound and 15 services northbound
per day);
Reduction of services operating each way between Glasgow Central and London Kings Cross;
Additional trains operating between London Kings Cross and Leeds (14 additional trains each way per day); and
Additional trains operating between London Kings Cross and Newcastle (4 additional trains each way per day).
5.1.13 Bi-mode IEPs trains are assumed to run on services to non-electrified destinations in Yorkshire and north of Edinburgh as per the current timetable though with some potential journey time benefits.
5.1.14 The PFMv4.3 ‘Do Minimum’ specification journey time reductions of 15 minutes and 9 minutes between London Kings Cross to Edinburgh and Leeds respectively.
5.1.15 Figure 5-3 shows a summary of the service and stopping pattern assumed in the ‘Do Minimum’ for East Coast Main Line services.

PFMv4.3: Assumptions Report
28
Figure 5-3: East Coast Main Line – Average Service Pattern used in PFMv4.3 – ‘Do Minimum’
Great Western
5.1.16 The key points of the specification assumed for PFMv4.3 are:
The introduction of an hourly service operating between Birmingham New Street and London Paddington to back fill for the diversion of Cross Country services via East West rail;
Doubling the service frequency between Bristol Temple Meads and London
Paddington;

PFMv4.3: Assumptions Report
29
Increased service frequency operating between Cheltenham and London
Paddington;
Increased service frequency operating between Hereford and London Paddington;
Removal of services to/from London Paddington starting/finishing at Didcot Parkway;
A reduction in services operating between Oxford and London Paddington with new services introduced between Oxford and London Marylebone as part of Chiltern Line service pattern; and
Replacement of local services operated by Great Western between Reading
and London Paddington by service operated by extending Heathrow Express services to Reading.
5.1.17 Figure 5-4 shows a summary of the service and stopping pattern assumed in the ‘Do Minimum’ for Great Western services.

PFMv4.3: Assumptions Report
30
Figure 5-4: Great Western – Average Service Pattern used in PFMv4.3 – ‘Do Minimum’
London Midland (LM)
5.1.18 The London Midland future year ‘Do Minimum’ timetable allows for 110mph running on the fast lines, and therefore provides some improvements to journey times. Three of the LM trains in each hour are scheduled to run at 110mph between London Euston and Ledburn Junction (south of Leighton Buzzard) which means that all Crewe services, most Northampton services, and some of the through Birmingham services benefit from accelerated journey times. However, the Watford Junction call is omitted from the Crewe services, resulting in some loss of direct-train connectivity to/from Watford Junction.
5.1.19 The timetable includes the additional path created by the future year West Coast timetable, with a consequent increase in service frequency between London Euston
and Northampton. There is also some train lengthening assumed in the future year timetable.
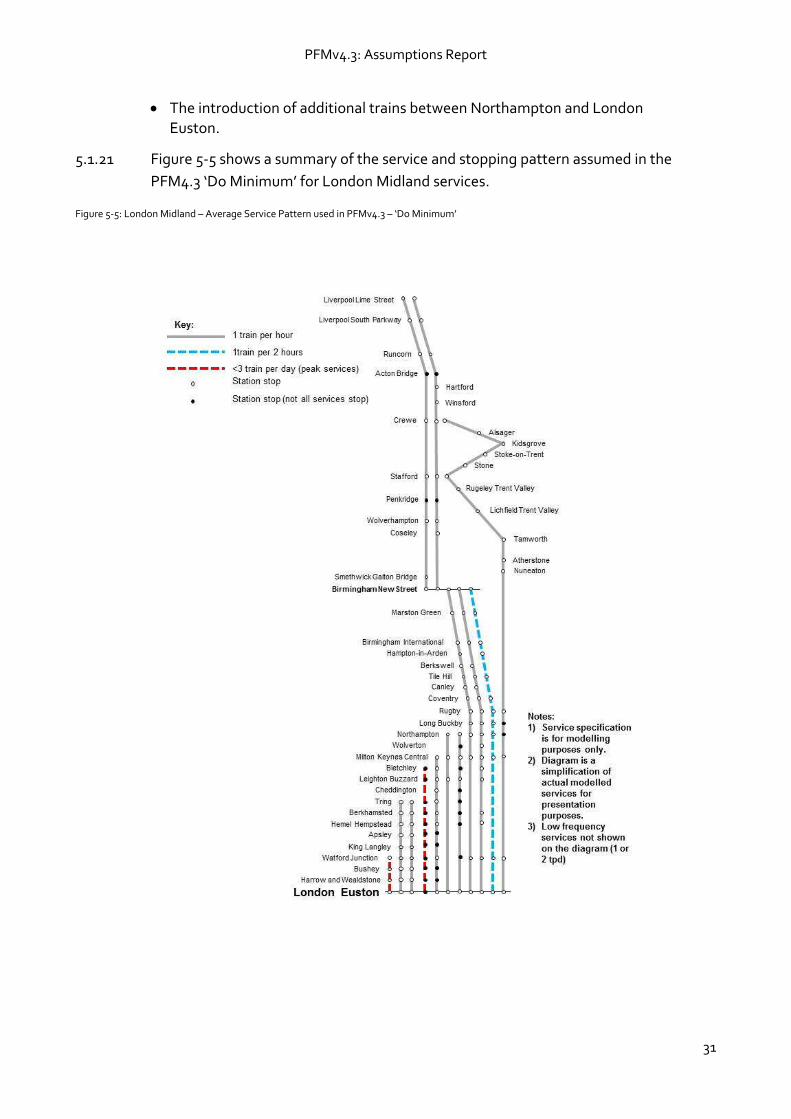
5.1.20 The key points of the specification are:
The introduction of additional trains between Birmingham New Street and
London Euston; and
PFMv4.3: Assumptions Report
31
The introduction of additional trains between Northampton and London
Euston.
5.1.21 Figure 5-5 shows a summary of the service and stopping pattern assumed in the
PFM4.3 ‘Do Minimum’ for London Midland services.
Figure 5-5: London Midland – Average Service Pattern used in PFMv4.3 – ‘Do Minimum’

PFMv4.3: Assumptions Report
32
East Midland
5.1.22 The future year ‘Do Minimum’ PFMv4.3 timetable assumes electrification takes place, with appropriate shortening of the handful of services that currently originate (or terminate) on non-electrified routes (Leeds, Lincoln and York). The post-electrification timetable includes the following:
two trains per hour between Corby and London St Pancras;
two trains per hour between Nottingham and London St Pancras; and
two trains per hour between Sheffield and London St Pancras.
5.1.23 The timetable assumes all services into London St Pancras operate using electric stock with a mixture of formations, which results in an increase in capacity. Furthermore, the longer distance services stop less frequently, with related journey time benefits.
5.1.24 The PFMv4.3 specification assumes substantial journey time improvements along the Midland Mainline, with reductions in journey time of 10 to 20 minutes.
5.1.25 Figure 5-6 shows a summary of the service and stopping pattern assumed in the ‘Do Minimum’ for East Midland services.

PFMv4.3: Assumptions Report
33
Figure 5-6: East Midland – Average Service Pattern used in PFMv4.3 – ‘Do Minimum’
West Coast Main Line
5.1.26 An indicative future year ‘Do Minimum’ timetable was prepared by DfT which utilises the remaining spare capacity on the southern half of the West Coast Main Line. In
each off-peak, contra-peak and most shoulder peak hours there are two additional arrivals and departures at London Euston. One of these paths is allocated to London Midland and another to Inter City West Coast (ICWC).
5.1.27 It is assumed the additional ICWC path provides a new train in each hour to Preston, making the London Euston-Preston service half-hourly all day, with one extension to/from Blackpool North every two hours. The hourly Warrington and Wigan stops are transferred from the Glasgow services to the new trains, enabling London Euston-Glasgow services to be accelerated.

PFMv4.3: Assumptions Report
34
5.1.28 An all-electric fleet is assumed, with electric trains being loco-hauled (with new diesel
locomotives capable of rapid coupling/uncoupling manoeuvres) on non-electrified routes. Most routes are assumed to use a mix of nine-car and eleven-car units, with the Birmingham to Scotland route using new-build six-car units.
5.1.29 Figure 5-7 shows a summary of the service and stopping pattern assumed in the ‘Do
Minimum’ for West Coast Main Line services.
Figure 5-7: West Coast Main Line – Average Service Pattern used in PFMv4.3 – ‘Do Minimum’

PFMv4.3: Assumptions Report
35
TransPennine
5.1.30 The indicative Northern Hub timetable was prepared by DfT for PFMv4.3 modelling purposes only. It includes timetable changes resulting from:
Increased capacity between Liverpool and Manchester (via Chat Moss);
A fourth platform at Manchester Airport;
Increased capacity on the Castlefield corridor and additional through platforms at Manchester Piccadilly;
Ordsall Chord enabling services to run direct between Manchester Piccadilly and Manchester Victoria stations;
A new turn-back facility at Rochdale;
Increased capacity on the Hope Valley Line between Sheffield and Manchester; and
Line speed improvements on routes between Liverpool and Leeds,
Manchester and Blackpool North, Manchester and Bradford, and Manchester and Sheffield.
5.1.31 On the North TransPennine route the future year timetable assumes the following services through the Manchester – Leeds core:
two trains per hour between Liverpool – York/Newcastle, both routed via Manchester Victoria;
two trains per hour between Manchester Airport – York;
one train per hour between Chester – Hull;
two trains per hour between Manchester Piccadilly – Leeds (all stations Stalybridge to Huddersfield);
one train per hour between Huddersfield – Leeds (all stations); and
one train per hour between Manchester Victoria – Calder Valley Route – Brighouse – Leeds).
5.1.32 Figure 5-8 shows a summary of the service and stopping pattern assumed in the ‘Do Minimum’ for TransPennine services.

PFMv4.3: Assumptions Report
36
Figure 5-8: TransPennine – Average Service Pattern used in PFMv4.3 – ‘Do Minimum’
Northern Trains
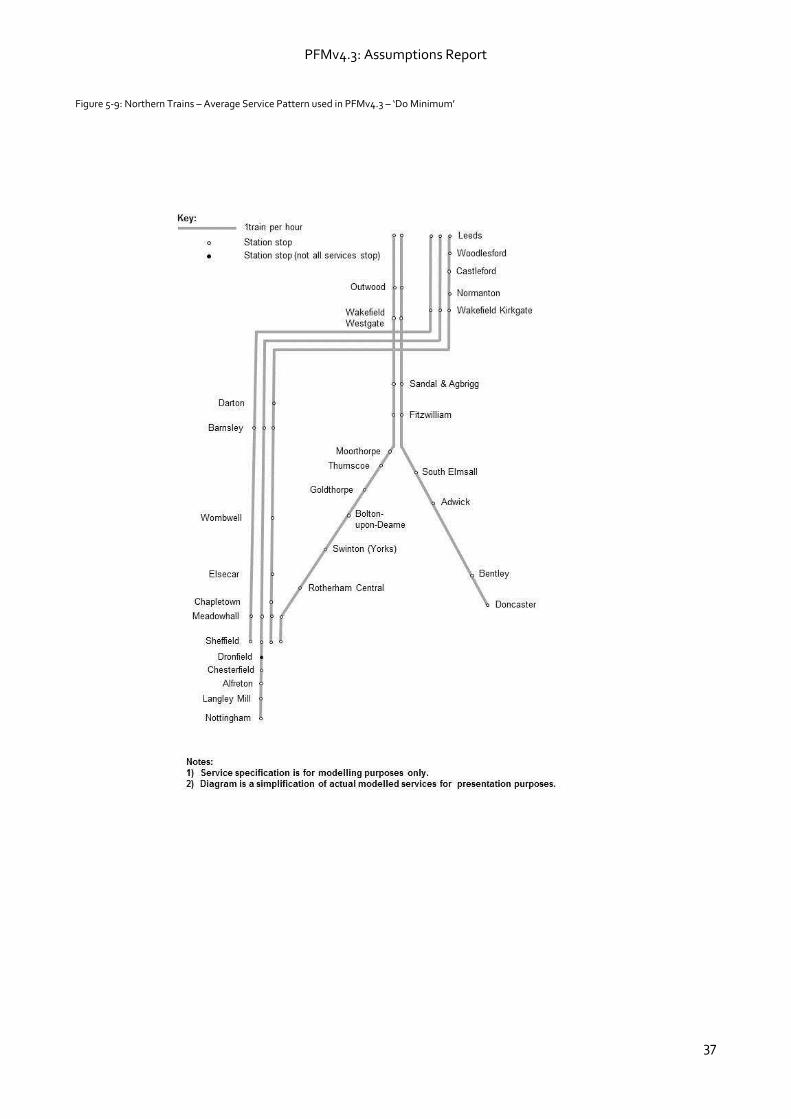
5.1.33 The indicative Northern Trains timetable was prepared by DfT for PFMv4.3 modelling purposes only and is based on using the capacity provided by the Northern Hub. Figure 5-9 shows a summary of the service and stopping pattern assumed in the ‘Do Minimum’ for Northern Trains services on the South Manchester and Leeds to Doncaster corridors.
PFMv4.3: Assumptions Report
37
Figure 5-9: Northern Trains – Average Service Pattern used in PFMv4.3 – ‘Do Minimum’

PFMv4.3: Assumptions Report
38
East-West Rail
5.1.34 The East-West Rail western section (between Oxford and Bletchley) is assumed within PFMv4.3 based on the DfT view of the likely service patterns as late 2012. Figure 5.10 shows a summary of the service pattern assumed in the ‘Do Minimum’ for East-West Rail services. This assumes hourly services as follows:
Oxford and Bedford;
Oxford and Milton Keynes; and
Aylesbury and Milton Keynes.

PFMv4.3: Assumptions Report
39
Figure 5-10: East- West Rail – Average Service Pattern used in PFMv4.3 – ‘Do Minimum’
Other services
5.1.35 Crossrail services are assumed in the PFMv4.3 forecasts based upon the late 2012 view of likely service patterns supplied by the DfT operating between Maidenhead, Shenfield and Abbey Wood.
5.1.36 A Western access to London Heathrow has been included within PFM4.3. The Heathrow Express service pattern is assumed to utilise this. Figure 5-11 shows a summary of the service pattern assumed in the ‘Do Minimum’ for Heathrow Express services.

PFMv4.3: Assumptions Report
40
Figure 5-11: Heathrow Express – Average Service Pattern used in PFMv4.3 – ‘Do Minimum’
London Underground transit line data
5.1.37 In addition to updating National Rail services the PFMv4.3 rail network also included updating both the base year and forecast year LUL network and services. TfL supplied LUL transit line data extracted from TFL’s Railplan model which was combined with vehicle type data extracted from Railplan.
National Rail update – rolling stock
5.1.38 PFM holds only a selection of rolling stock types as defined vehicles within the model. These are generally units that are used for strategic services that are generally not combined with other units. The assumptions used are shown in table 5-1 and have been sourced from the DfT MOIRA model.
5.1.39 To allow for combinations of units to be modelled, for example, a two-car unit joined to a three-car unit, or to allow for changes in type of units during a modelled period,
bespoke capacities can be input on the transit line as user defined transit line attributes. These are attributed vehicle type 888 within the model.
Table 5-1: Rolling Stock Capacity Assumed in PFMv4.3
Rolling stock type Seated capacity Total capacity
Class 91 9-car 477 747
Class 170 2-car 117 205
Class 170 3-car 191 326
Class 170 4-car 234 409
Class 170 5-car 308 531
Class 180 5-car 284 434
Class 185 3-car 169 301
Class 185 6-car 338 602
Class 220 4-car 190 310
Class 221 5-car 252 410

PFMv4.3: Assumptions Report
41
Rolling stock type Seated capacity Total capacity
Class 222 4-car 190 310
Class 222 5-car 252 410
Class 222 7-car 343 520
Class 319 3-car 217 294
Class 319 4-car 289 392
Class 350 4-car 226 396
Class 365 4-car 269 391
Class 365 8-car 538 782
Class 365 12-car 807 1173
Class 377 3-car 185 294
Class 377 4-car 247 392
Class 377 5-car 309 490
Class 377 8-car 494 784
Class 377 12-car 741 1176
Class 380 4-car 275 399
Class 380 8-car 550 798
Class 390 6-car 335 518
Class 390 9-car 440 715
Class 390 11-car 597 933
HST 5-car 271 436
HST 6-car 325 523
HST 8-car 446 658
IEP 03E15 313 465
IEP 07E18 539 814
IEP 14Bi5 313 465
IEP 14Bi5 x2 627 916
IEP T16 626 930
57 9-car 539 814
PFMv4.3: Assumptions Report
42
6 ‘Do Something’ rail changes 6.1 Introduction
6.1.1 To understand the costs and benefits of the scheme our modelling requires assumptions on a service specification for HS2 and a service specification for released capacity on the classic network. These assumptions are set out in the following sections. The assumptions set out here have been derived for transport modelling purposes only. They are not a future proposed service specification.
There are many potential options for future service specifications across the network. DfT’s strategic case sets out the high level principles that will be followed in making best use of released capacity, including:
to ensure that all places with a direct London service today retain a broadly comparable or better service after HS2 opens;
to provide additional commuter capacity where it is most needed;
to spread the benefits of long distance and inter-regional services to the many towns and cities that can be served by the capacity created on the existing rail network;
to fully integrate HS2 services into the wider national rail network;
to provide capacity for the growing rail freight sector; and
to improve performance by making timetables more robust.
6.1.2 Decisions on future services will be taken much nearer the time. What is set out here are a set of assumptions for modelling purposes.
6.1.3 In the following sections the HS2 service assumptions and assumptions on the classic network are set out separately. Within the PFMv4.3 model the impacts of these are combined.
6.2 HS2 service patterns
Phase One
6.2.1 There are four stations assumed on the Phase One route; Birmingham Curzon Street, Birmingham Interchange, Old Oak Common and London Euston. Phase One would also include a link to HS1 north of Euston and St Pancras.
6.2.2 The Phase One service pattern is shown in Figure and comprises:
London Euston to Birmingham Curzon Street; and
a series of services that are ‘classic compatible’, i.e. they use the HS2 link
between London and its connection with the West Coast Main Line and then switch to the classic network;

PFMv4.3: Assumptions Report
43
London Euston to Manchester Piccadilly (three trains per hour);
London Euston to Liverpool Lime Street (two trains per hour);
London Euston to Preston (one train per hour); and
London Euston to Glasgow Central (one train per hour)
Figure 6-1: HS2 Service Pattern used in PFMv4.3 – Phase One
6.3 Phase Two and the full network
6.3.1 Since the August 2012 Economic Update, plans for the full network have been developed considerably. A consultation of the preferred route for Phase Two was launched on 17 July 2013. Phase One and Phase Two together will form the full Hs2 network, which is the extent of the high-speed network that is currently being considered.
HS2 Phase 1 HS service pattern for demand modelling.KEY = Captive (GC gauge) HS train.
= Classic Compatible (UK gauge) HS train.
Edinburgh = Path not timetabled or modelled.
Waverley
Haymarket = station call.
Glasgow
Central
Motherwell
Carstairs
Lockerbie
Carlisle
Penrith
Oxenholme
Lancaster
Preston
Wigan North
Western
Warrington
Bank Quay
Liverpool
Lime Street
Runcorn
MANCHESTER
PICCADILLY
Stockport
Wilmslow
Crewe
Stafford
BIRMINGHAM
CURZON STREET
Birmingham
Interchange
OLD OAK
COMMON
LONDON
EUSTON

PFMv4.3: Assumptions Report
44
6.3.2 A decision on the Government’s preferred route for Phase Two is expected by the end
of 2014. Within PFMv4.3 we have assumed the proposed route that was released for public consultation on 17 July 2013.
6.3.3 The Phase Two service pattern is shown in figure 6-2 and comprises:
HS2 services:
London Euston to Birmingham Curzon Street (three trains per hour);
London Euston to Manchester Piccadilly (three trains per hour);
London Euston to Leeds (three trains per hour*);
Birmingham Curzon Street to Manchester Piccadilly (two trains per hour); and
Birmingham Curzon Street to Leeds (two trains per hour);
And a series of services that are classic compatible, i.e. they use the HS2 link
from London Euston and switch to the classic network at the appropriate location:
London Euston to Liverpool Lime Street (two trains per hour);
London Euston to Preston ( one train per hour);
London Euston to Glasgow Central/ Edinburgh Waverley (two trains per hour);
Birmingham Curzon Street to Glasgow Central/ Edinburgh Waverley (one train per hour);
Birmingham Curzon Street to Newcastle (one train per hour);
London Euston to Leeds/ York (one train per hour*); and
London Euston to Newcastle (two trains per hour).
Note*: One of the Leeds trains and the York train combine/split at Meadowhall
6.3.4 The specification in PFMv4.3 has removed the services to Heathrow, but retained the two paths for future use to reflect that consideration of the Heathrow spur is currently paused, while the Airports Commission conducts its review

PFMv4.3: Assumptions Report
45
Figure 6-2: HS2 Service Pattern used in PFMv4.3 – Phase Two
6.4 Released capacity
6.4.1 With the introduction of HS2 the specification of some classic rail services has been amended:
to remove any duplication between classic and HS2 services;
to ensure that HS2 and classic rail services are fully integrated; and
to make use of the capacity freed up by the introduction of HS2 to improve the
rail services to certain locations.
6.4.2 These changes to the classic rail services are referred to as the released capacity specification.
6.4.3 Assumptions about released capacity have been included within the PFMv4.3 modelling. There are many other potential combinations of released capacity. The assumptions in PFMv4.3 represent one possible set of assumptions for business case
HS2 Phase 2 HS service pattern for demand modelling.KEY = Captive (GC gauge) HS train.
= Classic Compatible (UK gauge) HS train.
= Path not modelled.
Edinburgh
Waverley
Haymarket = station call.
Glasgow = station call timetabled, but demand model not
Central able to differentiate from main station nearby.
Motherwell
Carstairs
TRAIN DIVIDES Newcastle
Either Or upon Tyne
Lockerbie
Durham
Carlisle
Darlington
Penrith
York
Oxenholme
LEEDS
Lancaster
Meadowhall
East Midlands
Interchange
Preston
Wigan North
Western
Warrington
Bank Quay
Liverpool
Lime Street
Runcorn
MANCHESTER
PICCADILLY
MANCHESTER
AIRPORT
Crewe
Stafford
BIRMINGHAM BIRMINGHAM
CURZON STREET CURZON STREET
Birmingham Birmingham
Interchange Interchange
Heathrow Heathrow
Airport Airport
OLD OAK OLD OAK
COMMON COMMON
LONDON LONDON
EUSTON EUSTON
Hourly 200m train from Birmingham
Curzon Street serves Glasgow or
Edinburgh in alternate hours.
HS1 and beyond
Paths reserved for services on the HS1 link and to / from Heathrow have not been modelled.
Stops at Oxenholme or Penrith in
alternate hours.
Train Divides

PFMv4.3: Assumptions Report
46
modelling purposes. They have been developed for demand modelling purposes and they do not infer that this will be the specification implemented.
6.4.4 The released capacity specification varies between Phase One and Phase Two of HS2. The train operating companies (TOCs) where services are modified as a result of the introduction of HS2 in Phase One and Phase Two are summarised in table 6-1.
Table 6-1: TOCs Impacted by Released Capacity Specification
Train Operating Company Phase One Phase Two
West Coast Main Line
East Coast Main Line
London Midland
East Midland Trains
Trans Pennine Trains
Cross Country
Southern Trains
Great Northern Trains
Thameslink Trains
Northern Trains
East West Rail
Crossrail
Great Western
Heathrow Express
West Coast
6.4.5 A summary of services and stopping patterns for the West Coast is included in figure 6-3 for Phase One.
6.4.6 The service pattern for Phase Two is shown on figure 6-4.
6.4.7 The Phase One and Phase Two timetable assumes the following services to/from London Euston:
two trains per hour to Wolverhampton;
one train per hour to North Wales;
one train per peak hour in the peak direction to Crewe;
one train per hour to Northampton;
one train per hour to Scotland via Manchester (alternating between Glasgow and Edinburgh); and

PFMv4.3: Assumptions Report
47
one train per peak hour in the peak direction to Manchester.
Figure 6-3: West Coast Long Distance Services assumed in PFMv4.3 – Phase One
6.4.8 In addition, in the Phase One specification, there is an hourly service from Birmingham to Scotland (alternating between Glasgow and Edinburgh) in the phase Two specification this service only runs to Preston, as shown in Figure 6.4 below

PFMv4.3: Assumptions Report
48
Figure 6-4: West Coast Long Distance Services assumed in PFMv4.3 – Phase Two
East Coast Main Line
6.4.9 The Phase One timetable is unchanged from the ‘Do Minimum’.
6.4.10 The Phase Two timetable assumes the following services to/from London:
one train per hour to Leeds (with occasional services continuing to either Bradford, Skipton or Harrogate);
one train per hour to Edinburgh;
15 trains per day to Newcastle with one train per day to Hull;
one train per hour to Lincoln; and

PFMv4.3: Assumptions Report
49
occasional East Coast services between Edinburgh and Glasgow, Aberdeen
and Inverness (In addition to Scotrail services).
6.4.11 A summary of services and stopping patterns for East Coast Main Line in Phase Two is included in figure 6-5. Phase One is not presented as it is unchanged from the ‘Do Minimum’.
Figure 6-5: East Coast Service – Average Service Pattern used in PFMv4.3 – Phase Two
London Midland
6.4.12 The Phase One timetable assumes the following services to/from London Euston:
one train per hour to Crewe via Stoke-on-Trent;

PFMv4.3: Assumptions Report
50
two trains per hour to Birmingham New Street via Northampton;
one train per hour to Milton Keynes;
two trains per hour to Bletchley;
three trains per hour to Tring;
two trains per hour in the peak time to Northampton;
two trains per hour in the peak time to Rugby with alternate trains extended to Lichfield; and
one train per hour in the peak time to Watford Junction.
6.4.13 It also assumes the following services starting at Birmingham New Street:
two trains per hour to Liverpool Lime Street
One train per hour in the peak period to Crewe
6.4.14 The Phase Two timetable assumes the following services to/from London Euston:
one train per hour to Crewe via Stoke-on-Trent;
two trains per hour to Birmingham New Street via Northampton;
one train per hour to Milton Keynes;
two trains per hour to Bletchley;
three trains per hour to Tring;
one train per hour in the peak time to Northampton;
two trains per hour in the peak time to Rugby with alternate trains extended to
Lichfield; and
one train per hour in the peak time to Watford Junction.
6.4.15 It also assumes the following services starting at Birmingham New Street:
one train per hour to Preston (taking over the path of West Coast Birmingham-Scotland service); and
two trains per hour to Liverpool.
A summary of services and stopping patterns for London Midland services in Phase One is shown in figure 6-6 and figure 6-7 for Phase Two.

PFMv4.3: Assumptions Report
51
Figure 6-6: London Midland Service Pattern used in PFMv4.3 – Phase One

PFMv4.3: Assumptions Report
52
Figure 6-7: London Midland Service Pattern used in PFMv4.3 – Phase Two

PFMv4.3: Assumptions Report
53
East Midlands Trains
6.4.16 The Phase One timetable is as the ‘Do Minimum’.
6.4.17 The Phase Two timetable assumes:
two trains per hour between Corby26 and London;
one train per hour between Derby and London via the new East Midlands HS station;
one train per hour between Nottingham and London; and
one train per hour between Sheffield and London via Derby.
6.4.18 A summary of services and stopping patterns for East Midlands Trains in Phase Two is included in figure 6-8. Phase One is not presented as it is unchanged from the ‘Do Minimum’.
26 Corby is not a station that is modelled in PLD and therefore services are coded to/from Kettering, which is the nearest point on the network

PFMv4.3: Assumptions Report
54
Figure 6-8: East Midlands Service Pattern used in PFMv4.3 – Phase Two
TransPennine Trains
6.4.19 The Phase One timetable for TransPennine Trains assumes:
the following services to / from Manchester Airport:
one train per hour to Manchester Piccadilly (the truncation of the do minimum Manchester Airport Scotland service);
one train per hour to Blackpool North;
two trains per hour to York via Leeds; and
one train per hour to Cleethorpes via Sheffield.
PFMv4.3: Assumptions Report
55
the following services from Manchester Piccadilly:
one train per hour to Selby via Leeds;
one train per hour to Doncaster via Sheffield; and
one train per hour to Hull via Leeds.
the following services from Preston
six trains per day to Barrow-in-Furness.
Phase One also includes the following service to/from Liverpool Lime Street:
one train per hour to Newcastle via Manchester and Leeds; and
one train per hour to York via Manchester and Leeds.
6.4.20 In the Phase Two timetable, this is as the Phase One specification:
an additional one train per hour from Manchester Airport to Scotland (alternating between Edinburgh and Glasgow) assumes:
peak time services between Liverpool Lime Street and Newcastle are extended to Edinburgh;
6.4.21 A summary of services and stopping patterns for TransPennine Train services is included in figure 6-9 for Phase One and figure 6-10 for Phase Two.

PFMv4.3: Assumptions Report
56
Figure 6-9: Trans Pennine Service Pattern used in PFMv4.3 – Phase One

PFMv4.3: Assumptions Report
57
Figure 6-10: Trans Pennine Service Pattern used in PFMv4.3 – Phase Two
Cross Country
6.4.22 The Phase One timetable for Cross Country services is as assumed for the ‘Do Minimum’.
6.4.23 The Phase Two timetable is broadly the same as that in the Do Minimum except that there are additional calling points are provided as follows:
Meadowhall, Chesterfield, Burton-on-Trent and Tamworth on all services to Edinburgh and York; and
Congleton and Macclesfield on services to Manchester
Reading to Newcastle services are cut back to terminate at York (and vice
versa)
This then provides a service pattern as follows:
one train per hour between Manchester and Bournemouth via Milton Keynes;
one train per hour between Manchester and Bristol via Birmingham (with some services continuing on to Cardiff or Paignton);

PFMv4.3: Assumptions Report
58
one train per hour between Manchester and Birmingham International;
one train per hour between Plymouth and Edinburgh, with some services continuing on to Penzance in the South West or Glasgow, Dundee or Aberdeen in Scotland; and
one train per hour between Reading and Newcastle, with some services continuing on to Southampton or Guildford in the south, or Edinburgh in the north.
6.4.24 A summary of services and stopping patterns for Cross Country services in Phase Two is included in figure 6-11. Phase One is not presented as it is unchanged from the ‘Do Minimum’.
Figure 6-11: Cross Country Service Pattern used in PFMv4.3 – Phase Two
PFMv4.3: Assumptions Report
59
Southern Trains
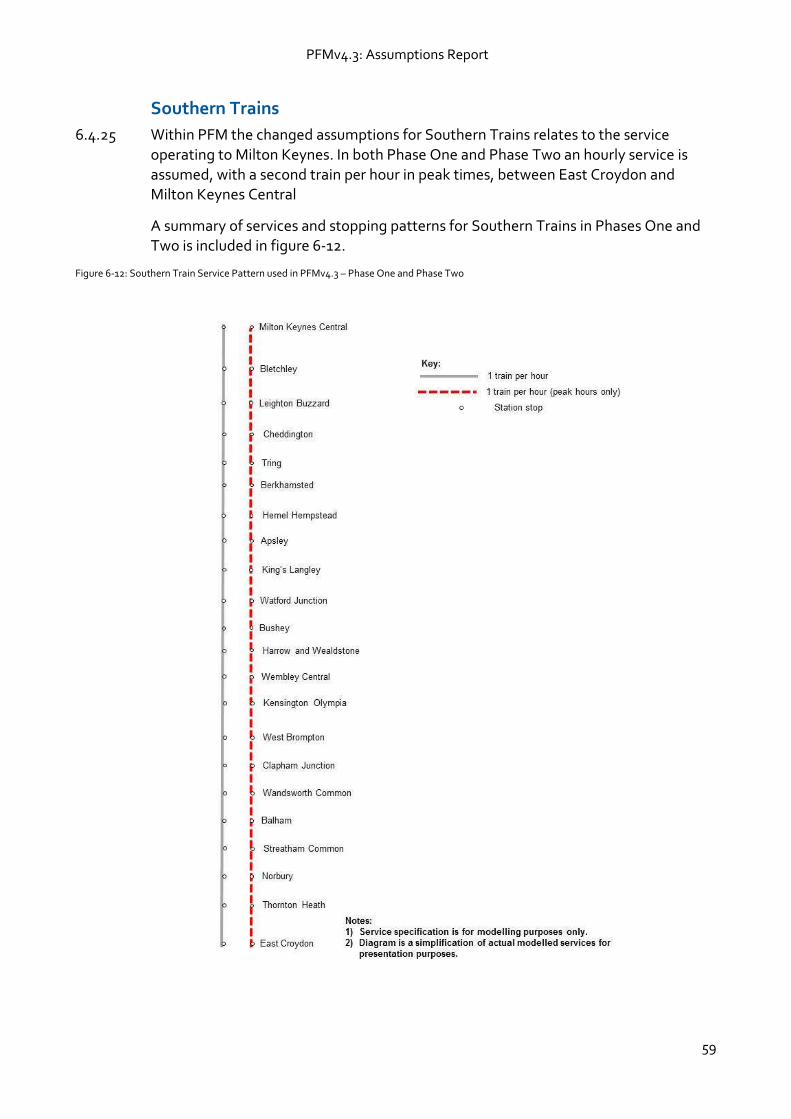
6.4.25 Within PFM the changed assumptions for Southern Trains relates to the service operating to Milton Keynes. In both Phase One and Phase Two an hourly service is assumed, with a second train per hour in peak times, between East Croydon and Milton Keynes Central
A summary of services and stopping patterns for Southern Trains in Phases One and Two is included in figure 6-12.
Figure 6-12: Southern Train Service Pattern used in PFMv4.3 – Phase One and Phase Two

PFMv4.3: Assumptions Report
60
Thameslink and Great Northern Trains
6.4.26 The Thameslink specification presented here relates to selected Thameslink services in the corridors impacted by the released capacity specification, i.e. the Midland route to Bedford and the Great Northern route to Peterborough.
6.4.27 Phase One is unchanged from the ‘Do Minimum’ and assumes the following:
On the Great Northern Peterborough corridor:
one train per hour peak only between Kings Cross and Peterborough;
two trains per hour between Three Bridges and Peterborough via Central London
and on the Thameslink Midland corridor:
four and a half trains per hour between Bedford and Brighton via Central London; and
one train per two hours between Bedford and London St Pancras.
6.4.28 Phase Two assumes the following:
On the Great Northern Peterborough corridor:
one train per hour peak only between Kings Cross and Peterborough semi fast;
one train per hour peak only between Kings Cross and Peterborough stopping service;
two trains per hour between Three Bridges and Peterborough via Central London; and
one train per hour between King’s Cross and Peterborough semi-fast.
and on the Thameslink Midlands corridor:
four and a half trains per hour between Bedford and Brighton via Central London; and
one train per hour between Bedford and London St Pancras semi-fast.
6.4.29 A summary of services and stopping patterns for Thameslink and Great Northern services is presented in figure 6-13 for Phase One and figure 6-14 for Phase Two.

PFMv4.3: Assumptions Report
61
Figure 6-13: Thameslink- Great Northern and Midlands Corridor Service Pattern used in PFMv4.3 – Phase One

PFMv4.3: Assumptions Report
62

PFMv4.3: Assumptions Report
63
Figure 6-14: Thames link- Great Northern and Midlands Corridor Service Pattern used in PFMv4.3 – Phase Two
PFMv4.3: Assumptions Report
64
Northern Trains
6.4.30 The Northern Trains specification presented here relates to selected Northern services in the corridors impacted by the released capacity specification, i.e. the Leeds Doncaster corridor and South Manchester corridors.
6.4.31 The Phase One timetable is as per the ‘Do Minimum’.
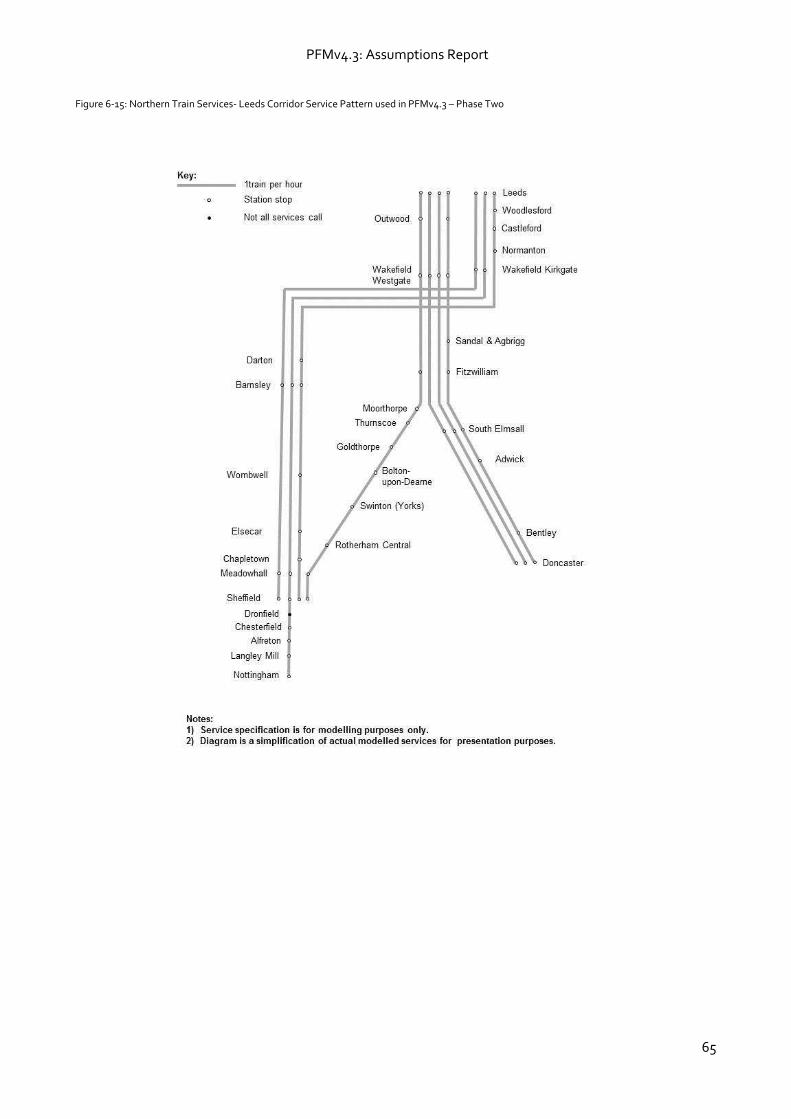
6.4.32 The Phase Tw0 timetable assumes the following for each corridor.
On the Leeds Doncaster corridor the following services to/from Leeds:
one train per hour to Nottingham
one train per hour to Sheffield
one train per hour to Sheffield via Rotherham stopping service;
one train per hour to Doncaster calling all stations; and
two trains per hour to Doncaster semi-fast (backfilling for removed East Coast capacity).
On the South Manchester corridor the following services to/from Manchester Piccadilly:
one train per hour to Crewe via Manchester Airport;
one train per hour to Crewe via Stockport;
one train per hour to Alderley Edge via Stockport;
one train per hour to Stoke on Trent stopping service;
peak extra services to Macclesfield;
one train per hour to Stoke on Trent semi-fast (backfilling for removed West Coast capacity); and
one train per hour to Crewe semi-fast (again backfilling for removed West Coast capacity).
6.4.33 A summary of services and stopping patterns for Northern services on the Leeds Corridor are presented in figure 6-15 for Phase Two. A summary of the service patterns assumed in the South Manchester corridor are shown on figure 6-16 for Phase Two. Phase One services for Northern Trains are not shown as they are as per the ‘Do Minimum’.
PFMv4.3: Assumptions Report
65
Figure 6-15: Northern Train Services- Leeds Corridor Service Pattern used in PFMv4.3 – Phase Two

PFMv4.3: Assumptions Report
66
Figure 6-16: Northern Train Services- South Manchester Corridor Service Pattern used in PFMv4.3 – Phase Two

PFMv4.3: Assumptions Report
67
East-West Rail
6.4.34 The Phase One timetable is as the ‘Do Minimum’ specification.
6.4.35 The Phase Two timetable assumes:
one train per hour between Oxford and Nottingham via Bedford (projected on from the Do Minimum Oxford-Bedford service);
one train per hour between Oxford and Milton Keynes; and
one train per hour Aylesbury and Milton Keynes.
6.4.36 A summary of services and stopping patterns for East West Rail is included in Figure 6-17. Phase One is not presented as it is unchanged from the Do Minimum.
Figure 6-17 East-West Rail Service Pattern used in PFMv4.3 – Phase Two

PFMv4.3: Assumptions Report
68
Crossrail, Great Western and Heathrow Express
6.4.37 All Crossrail, Great Western and Heathrow Express services between Paddington and the west go via Old Oak Common in both Phase One and Phase Two. The impact of stopping at Old Oak Common is an increase in journey time of three minutes.

PFMv4.3: Assumptions Report
69
7 Reliability assumptions 7.1 PFMv4.3 Assumptions
7.1.1 The approach to modelling reliability in PFMv4.3 involves making adjustments to the journey times as a proxy for changes in reliability.
7.1.2 The approach considers the potential improvement in reliability that HS2 can deliver by examining one measure of reliability – average minutes lateness (AML).
7.1.3 Improvements in AML as a result of HS2 are then converted into an equivalent journey time saving based on evidence in PDFH and WebTAG27, which suggests that passengers value 1 minute average lateness as equivalent to three minutes of journey time. This perceived reduction in journey time is then input into the model to forecast
the change in demand due to reliability improvements. The tables below show the reliability adjustments made within PFMv4.
Table 7-1: Reliability Benefits of HS2 in Phase One
HS2 Service Group AML Classic Rail Forecast AML
with HS2 Change in AML
Equivalent
Journey Time
Reduction (i.e. 3
times AML
London - Birmingham 2.6 0.1 2.5 8
London - Preston 4.8 2.8 2 6
London– Manchester 2.9 1.9 2 6
London– Liverpool 3 1 2 6
London - Scotland 4.4 2.4 2 6
Table 7-2: Reliability Benefits of HS2 extended to Leeds and Manchester
HS2 Service Group AML
Classic Rail
AML
HS2
Change in
AML
Equivalent
Journey Time
Reduction
London - Birmingham 2.6 0.1 2.5 8
London - East Midlands / Sheffield 1.8 0.1 1.7 5
London - Leeds 2 0.1 1.9 6
London - Birmingham 2.6 0.1 2.5 8
London - Manchester 2.9 0.1 2.8 8
London - Liverpool 3 0.2 2.8 8
London - Scotland 4.4 1.6 2.8 8
27 WebTAG unit 3.15.4
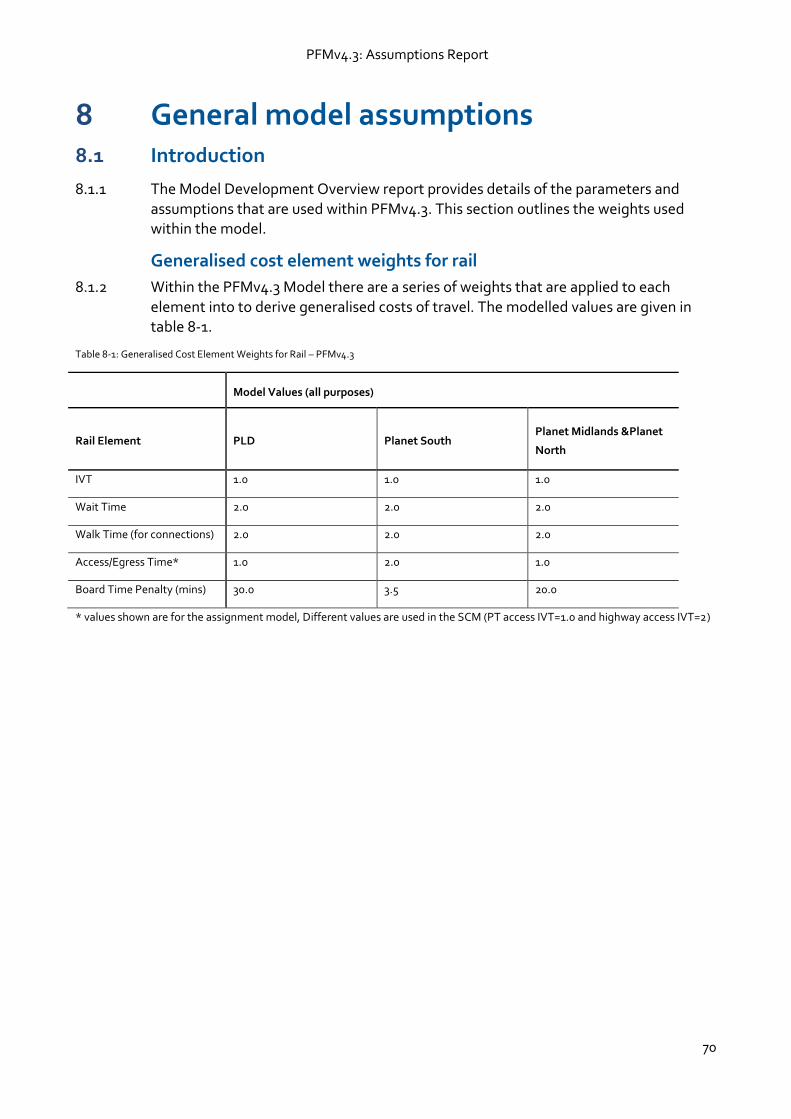
PFMv4.3: Assumptions Report
70
8 General model assumptions 8.1 Introduction
8.1.1 The Model Development Overview report provides details of the parameters and assumptions that are used within PFMv4.3. This section outlines the weights used within the model.
Generalised cost element weights for rail
8.1.2 Within the PFMv4.3 Model there are a series of weights that are applied to each element into to derive generalised costs of travel. The modelled values are given in table 8-1.
Table 8-1: Generalised Cost Element Weights for Rail – PFMv4.3
Model Values (all purposes)
Rail Element PLD Planet South Planet Midlands &Planet
North
IVT 1.0 1.0 1.0
Wait Time 2.0 2.0 2.0
Walk Time (for connections) 2.0 2.0 2.0
Access/Egress Time* 1.0 2.0 1.0
Board Time Penalty (mins) 30.0 3.5 20.0
* values shown are for the assignment model, Different values are used in the SCM (PT access IVT=1.0 and highway access IVT=2)

PFMv4.3: Assumptions Report
71
Glossary AML Average Minutes Lateness
AP Attraction to Production
ATOC Association of Train Operating Companies
CA Car Available
CAA Civil Aviation Authority
CEBR Centre for Economics and Business Research
CPI Consumer Prices Framework
DECC Department of Energy & Climate Change
DfT Department for Transport
DM Do Minimum
DS Do Something
EDGE Endogenous Demand Growth Estimator – Forecasting framework for rail demand growth in Great Britain (DfT)
GDP Gross Domestic Product
HAM Heathrow Access Model
HSR High Speed Rail
HS2 High Speed Two (the project)
HS2 Ltd HS2 project promoter
hybrid Bill Consents process for major projects deemed to be in the national interest that also affect a large number of private interests
ICWC Inter City West Coast
IEP Intercity Express Programme
LASAM London Airports Surface Access Model
LUL London Underground Limited
MOIRA Rail forecasting software and database. Maintained on behalf of ATOC members for rail demand and revenue forecasting.
NAPALM National Air Passenger Allocation Model (DfT)
NAPDM National Air Passenger Demand Model (DfT)

PFMv4.3: Assumptions Report
72
NCA Non-car available
NTEM National Trip End Model (DfT)
NTM National Transport Model (DfT)
OBR Office for Budget Responsibility
ONS Office of National Statistics
ORR Office of Rail Regulation
P/A Production/Attraction
PDFH Passenger Demand Forecasting Handbook
PFM PLANET Framework Model
PLD PLANET Long Distance
PM PLANET Midlands
PN PLANET North
PS PLANET South
PT Public Transport
RIFF Rail Industry Forecasting Framework
RPI Retail Prices Index
RTF Road Traffic Forecasts (DfT)
SCM Station Choice Model
TEMPRO Trip End Model presentation PROgram (DfT)
TfL Transport for London
TOC Train Operating Company
WebTAG DfT’s web-based documentation for Transport Appraisal Guidance


![Method of Implementation (MOI) MIPI C-PHY v2.0 HS-TX/RX ......TX) - [HS-RX] Differential Return Loss (Sdd RX) - [HS-RX] Common-Mode Return Loss (Scc RX) - [HS-RX] Mode Conversion Limits](https://static.fdocuments.us/doc/165x107/60bc2103fa7f8468867192b6/method-of-implementation-moi-mipi-c-phy-v20-hs-txrx-tx-hs-rx-differential.jpg)