
Spiegel im spiegel: Teaching reflective writing in Management Education

The Olympic Effect Andrew K. Rose and Mark M. Spiegel*
August 23, 2010
Abstract
Economists are skeptical about the economic benefits of hosting “mega‐events” such as the Olympic Games or the World Cup, since such activities have considerable cost and seem to yield few tangible benefits. These doubts are rarely shared by policy‐makers and the population, who are typically quite enthusiastic about such spectacles. In this paper, we reconcile these positions by examining the economic impact of hosting mega‐events like the Olympics; we focus on trade. Using a variety of trade models, we show that hosting a mega‐event like the Olympics has a positive impact on national exports. This effect is statistically robust, permanent, and large; trade is over 20% higher for countries that have hosted the Olympics. Interestingly however, we also find that unsuccessful bids to host the Olympics have a similar positive impact on exports. We conclude that the Olympic effect on trade is attributable to the signal a country sends when bidding to host the games, rather than the act of actually holding a mega‐event. We develop a political economy model that formalizes this idea, and derives the conditions under which a signal like this is used by countries wishing to liberalize. JEL Classification: F19, L83 Keywords: trade, liberalization, mega‐event, host, candidate, export; model, signaling, data Andrew K. Rose (correspondence) Mark M. Spiegel Haas School of Business Federal Reserve Bank of San Francisco University of California 101 Market St. Berkeley, CA USA 94720‐1900 San Francisco CA 94105 Tel: (510) 642‐6609 Tel: (415) 974‐3241 Fax: (510) 642‐4700 Fax: (415) 974‐2168 E‐mail: [email protected] E‐mail: [email protected]
* Rose is B.T. Rocca Jr. Professor of International Trade and Economic Analysis and Policy in the Haas School of Business at the University of California, Berkeley, NBER research associate and CEPR research fellow. Spiegel is Vice President, Economic Research, Federal Reserve Bank of San Francisco. We thank Christopher Candelaria for excellent research assistance, and Keith Head for help with his tetradic programs. For comments, we thank: Antonio Ciccone, John Fernald; Reuven Glick; Yuri Gorodnichenko; Pierre‐Olivier Gourinchas; Galina Hale; Dennis Novy; Assaf Razin; Glenn Rudebusch; Jay Shambaugh; Bent Sorensen; Eric Swanson; Linda Tesar; Shang‐Jin Wei; John Williams; Eric van Wincoop; two anonymous referees; and workshop participants at Berkeley, Copenhagen, FRBSF, NBER, Tsinghua, and UCSD. Shorter, earlier and current versions of this paper are posted at http://faculty.haas.berkeley.edu/arose, along with the relevant data sets and sample output. The views presented in this paper are those of authors and do not represent the views of the Federal Reserve Bank of San Francisco or the Board of Governors of the Federal Reserve.
“When the Olympic flame is lit, China will be hoping for a 17‐day festival of sport and international
friendship. It sees the games as marking not just its re‐emergence as a global economic force but also as
a country that the rest of the world treats with admiration and respect.”
Economist, August 2, 2008
1. Motivation
Economists are usually skeptical of arguments about the public provision of infrastructure for
sporting events, and rightly so. Agents that endorse the construction of new sports stadia or the staging
of mega‐events usually do so out of naivety or self‐interest. In practice, these events usually end up
imposing large costs on their hosts that are not nearly compensated by either the revenues earned
during the event or the legacy of large stadia or obscure facilities (velodromes, aquatic centers, and so
forth) that are left behind. The opening ceremonies of the 2008 Beijing Olympic games are commonly
thought to have cost at least $100 million, when over 100 million Chinese lived on less than $1/day.
Despite the fact that most economists doubt the wisdom of such policy, there is little question
that countries commit substantial resources to become candidates to host mega‐events, and much
more should they be “fortunate" enough to actually host the event. While there is usually a vocal
minority of opponents, the desire to host the Olympic games is widely held by both the masses and
political elites.
This paper examines the possibility that both sides of the argument may be right. In particular,
we show that there is a large economic benefit associated with mega‐events (justifying the public's
enthusiasm), despite the fact that much of the requisite new infrastructure is a net cost (explaining the
skepticism of economists). Succinctly, when a country wishes to enter the world stage, it can signal this
to both domestic and international constituencies by offering to host a mega‐event. We model this
narrowly by focusing on trade liberalization, but believe that the point may be more general.
It is commonly argued that hosting the Olympics will promote a nation's exports. For instance,
the International Olympic Committee (IOC) believes that potential visitors will be drawn to Olympic
venues after being exposed to them through the games. Preuss (2004) discusses how the Seoul Games
in 1988 were intended to improve international relations between South Korea and the Soviet Bloc
countries “as well as raise international awareness of Korean manufactured products” so as to promote
Korean exports. We are dubious of the practical relevance of this argument, and thus begin by
examining it empirically, using a number of different models of trade. Surprisingly, we find strong
evidence of a large persistent effect of the Olympics on both exports and overall trade. Our results
seem robust to a battery of sensitivity exercises including tetradic and matching/treatment estimation;
we show that countries which have hosted the games seem to have exports over 20% higher, ceteris
paribus. Other mega‐events such as the World Cup also have large positive effects on trade. Somewhat
surprisingly (at least to us), countries that host a mega‐event seem to realize an economic benefit in the

form of greater openness. If openness enhances growth (e.g., (Lucas, 2009), the welfare consequences
of mega‐events may be positive and large.
Our explanation seems to accord well with the facts, at least superficially. In July 2001, Beijing
was awarded the right to host the Games of the XXIX Olympiad. Just two months later, China
successfully concluded negotiations with the World Trade Organization, thus formalizing its
commitment to trade liberalization. Nor is this a once‐off coincidence. Rome was awarded the 1960
games in 1955, the same year Italy started to move towards currency convertibility, joined the UN, and,
most importantly, began the Messina negotiations that lead two years later to the Treaty of Rome and
the creation of the European Economic Community. The Tokyo games of 1964 coincided with Japanese
entry into the IMF and the OECD. Barcelona was awarded the 1992 games in 1986, the same year Spain
joined the EEC; the decision to award Korea the 1988 games coincided with Korea's political
liberalization. The correlation extends beyond the Olympics; the 1986 World Cup was held in Mexico
coincident with its trade liberalization and entry into the GATT.
While our observed effect is large, robust, and plausible, it may be argued that it is attributable
to unobservable differences between those countries that host the games and those that don't, rather
than a “hosting effect.” To address this possibility, we compare trade patterns for countries that host
the games to those that bid unsuccessfully for the games. In using this alternative group as a control,
our methodology follows a large recent literature, such as Greenstone et al (2008). In our case, the
operational assumption is that successful and unsuccessful candidates are similar in terms of proclivity
towards trade and liberalization, differing only by the experience of actually hosting the Olympic games.
Using this identification strategy, we find that countries that were unsuccessful candidates for
the games also experience a positive export effect, one similar in size to that experienced by actual
Olympic hosts. These findings cast doubt on the idea that a plausible motivation for hosting a mega‐
event is any change in a country's fundamentals induced by holding the games (such as construction
activity or the resulting infrastructure). Instead, our evidence is consistent with the conclusion that all
countries that bid for the games experience an increase in outward orientation, not just hosts. This too
seems to accord with anecdotal information; there are a number of examples of unsuccessful Olympic
candidates who liberalized. For instance, South Africa began a dramatic trade liberalization in the mid
1990s while it mounted (and lost) its bid to host the 2004 Olympics (the choice of Athens was
announced in September 1997).
This raises two puzzles. Why should bidding for the Olympics be associated with increased
openness? And if hosting the games brings no tangible benefits relative to a control group of
unsuccessful candidates, why would any country ever bid to hold an expensive mega‐event?
We offer an answer to these puzzles below. We explore the possibility that bidding to host an
international mega‐event such as the Olympics is part of a costly strategy that signals trade liberalization
and results in increased openness. We develop a theoretical political‐economy model consistent with
this conjecture. In the model, we obtain a separating equilibrium where bidding to host a mega‐event

provides a positive signal about future policy intentions. However, consistent with our empirical
findings, hosting the games in and of itself has no impact on a nation's fundamentals or trade.
Our model also suggests an answer to the question “Why a mega‐event?" as the choice of a
signal of liberalization intentions. We find that countries will be more likely to use the Olympic signal,
the greater is the incidence of the expected cost of sending the signal on the group that expects to
benefit from future liberalization. Major sporting events like the Olympics are traditionally financed by
the relevant city (usually the capital) in conjunction with the central government of the host country.
Policy makers from these groups are likely to benefit from liberalization. As such, bidding for the
Olympics may serve well as a signal because it aligns the costs and benefits of the signal. To our
knowledge, this is the first model where the distributional implications of sending the signal influence
the desirability of the signal chosen. Olympic bids are also good signals of liberalization because they
are highly visible, infrequent, and have long lead times. Still, our model does not explain all aspects of
the data. For instance, our theory provides no clear‐cut reason why open countries should bid at all to
host a mega‐event, let alone why countries bid seriously or repeatedly. Accordingly, we close on a
cautious note.
2. Literature Review
2.1 Mega‐Events
A number of studies support local subsidization of sporting events; they often predict large
economic benefits. This work is typically commissioned and is not intended for the academic audience,
but it is still influential. For example Humphreys and Plummer (1995) estimate the short‐term economic
impact to Atlanta from hosting the 1996 games to be $5.1 billion.
More rigorous studies are skeptical of the net economic benefits of hosting mega‐events; see
e.g., Owen (2005). The costs of holding such events seem considerable. Further, any enduring benefits
derive mostly from infrastructure investments that the host city could choose to make independently of
the games. Much of the spending on the event by local citizens is a substitute from a different leisure
activity or consumption good, rather than true additional spending. Moreover, the projects associated
with the games typically seem to be white elephants, such as poorly‐used sporting facilities associated
with idiosyncratic Olympic sports, or hotels and transportation infrastructure built to accommodate a
one‐time peak demand of just three weeks.
Some have argued that hosting sporting events yields a non‐pecuniary “feel good" benefit to
local citizens who are filled with civic pride following a mega‐event, even if they do not attend.
However, the very existence of this intangible spillover is uncertain, let alone its magnitude. It seems
safe to say that a majority of the profession considers it unlikely that these benefits justify the large
public expenditures involved in hosting such events (e.g. Coates, 2007).
2.2 International Signaling

The use of international signals to indicate future policy to prospective foreign investors has
been discussed in the literature. Bartolini and Drazen (1997) develop a model where governments with
asymmetric information about future fiscal positions signal their expectations through current policies
on capital account openness. Open capital accounts are more costly for countries in poor fiscal
condition, so those countries that expect to be in good fiscal condition in the future can signal their
prospects in ways that cannot be profitably mimicked by countries that expect to face future fiscal
difficulties.
The signal we consider below is of a “burning money" type, not informative in its own sense, but
informative due to the fact that sending the signal is only attractive to the set of countries that sincerely
intend to pursue liberalization. In this sense, it is similar to the costs of delay in a war of attrition model,
such as that of the delayed fiscal stabilization in Alesina and Drazen (1991). Other studies go even
farther, e.g. Krugman (1998) and Mukand (2006), who argue that countries sometimes pursue policies
that are actually perverse, in an effort to increase investor confidence. Their argument is that in a
globalized environment, policymakers may feel the need to pursue policies that would confirm foreign
investors' beliefs about what constitutes good policy. These beliefs may be biased due to herding
effects (e.g. Banerjee, 1992) or alternatively because investors may draw incorrect inferences about
their impact. As a result, perverse policies may have such an advantage in terms of their impact on
agents' expectations, that pursuing them may be superior to following the path that would yield the
best outcome in terms of domestic economic fundamentals.
One question that naturally arises in these types of models is why one form of signal might be
preferred to another. We argue that one attribute of using the Olympics as a signal is the incidence of
the cost of sending the signal within the country. In particular, it is likely that the cost of hosting the
Olympics is primarily borne by the benefactors of the signaled policy change, limiting the losses to those
not favored by the policy. Mega‐events like the Olympics are also infrequent, highly visible, and have
long lead times, attributes that lend themselves to signals of liberalization.
3. The Olympic Effect on Trade
If the direct economic benefits seem theoretically dubious, and any indirect effects highly
uncertain, the willingness of local and federal governments to heavily subsidize sporting activities is a
mystery. We now try to tackle this issue empirically. In particular, we take seriously the argument that
hosting a mega‐event provides visibility to a host country and thus may stimulate global demand for its
exports.
3.1 Specification and Data
We start our investigation by using the well‐known and widely employed “gravity" model of
international trade (later below, we corroborate our results using a variety of different approaches. This
models bilateral trade flows between a pair of countries as a function of the distance between the two
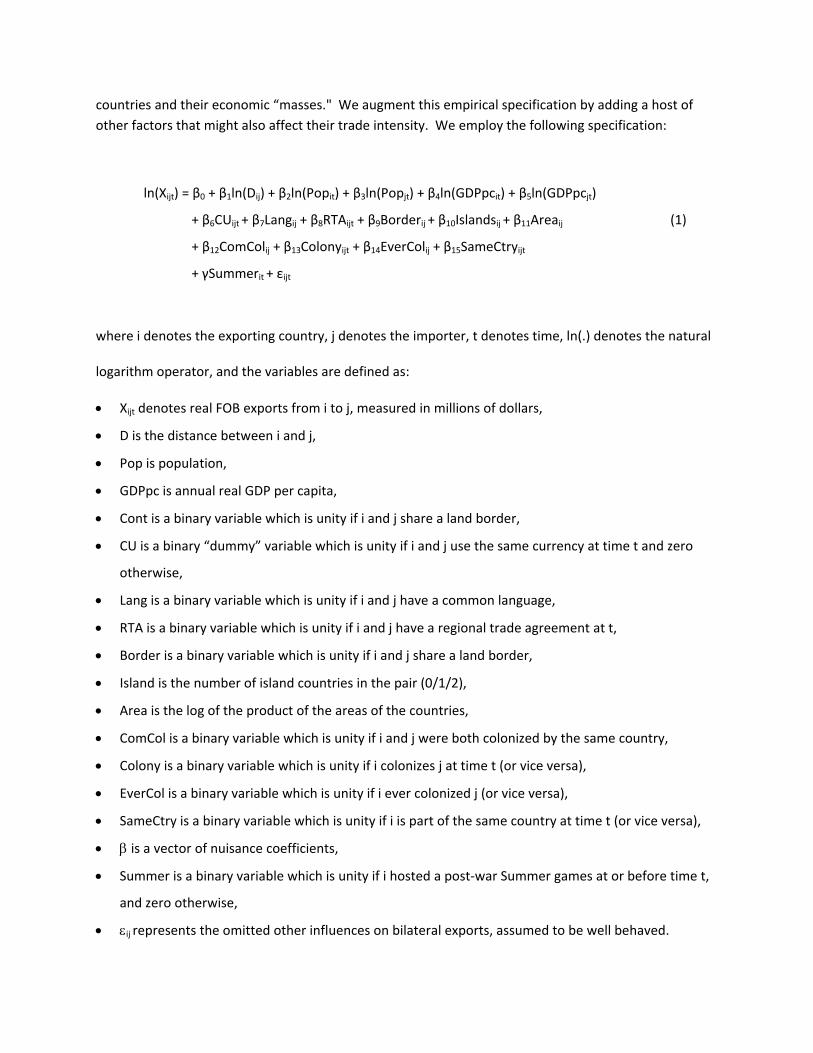
countries and their economic “masses." We augment this empirical specification by adding a host of
other factors that might also affect their trade intensity. We employ the following specification:
ln(Xijt) = β0 + β1ln(Dij) + β2ln(Popit) + β3ln(Popjt) + β4ln(GDPpcit) + β5ln(GDPpcjt)
+ β6CUijt + β7Langij + β8RTAijt + β9Borderij + β10Islandsij + β11Areaij (1)
+ β12ComColij + β13Colonyijt + β14EverColij + β15SameCtryijt
+ γSummerit + εijt
where i denotes the exporting country, j denotes the importer, t denotes time, ln(.) denotes the natural
logarithm operator, and the variables are defined as:
Xijt denotes real FOB exports from i to j, measured in millions of dollars,
D is the distance between i and j,
Pop is population,
GDPpc is annual real GDP per capita,
Cont is a binary variable which is unity if i and j share a land border,
CU is a binary “dummy” variable which is unity if i and j use the same currency at time t and zero
otherwise,
Lang is a binary variable which is unity if i and j have a common language,
RTA is a binary variable which is unity if i and j have a regional trade agreement at t,
Border is a binary variable which is unity if i and j share a land border,
Island is the number of island countries in the pair (0/1/2),
Area is the log of the product of the areas of the countries,
ComCol is a binary variable which is unity if i and j were both colonized by the same country,
Colony is a binary variable which is unity if i colonizes j at time t (or vice versa),
EverCol is a binary variable which is unity if i ever colonized j (or vice versa),
SameCtry is a binary variable which is unity if i is part of the same country at time t (or vice versa),
is a vector of nuisance coefficients,
Summer is a binary variable which is unity if i hosted a post‐war Summer games at or before time t,
and zero otherwise,
ij represents the omitted other influences on bilateral exports, assumed to be well behaved.

This data set includes annual observations between 1950 and 2006 (though with many missing
observations) for some 196 territories and localities (we refer to these as “countries" below). The
sources of our bilateral data set, along with a complete list of the countries themselves are tabulated in
the longer version of this paper.
We estimate this equation with OLS, using a robust covariance estimator (clustered by country‐
pair dyads) to handle heteroskedasticity. Throughout, we add year‐specific fixed effects so as to take
account of any time‐specific common trends or effects. We also perturb this specification in two
important ways. First, we add a comprehensive set of dyadic‐specific fixed effects (i.e., a mutually
exclusive and jointly exhaustive set of {βij} intercepts) to absorb any time‐invariant characteristics that
are common to a pair of countries. Second, we add comprehensive sets of exporter and importer fixed
effects (i.e., sets of {βi} and {βj}) to take account of any time‐invariant country‐specific factors.i We also
show below that our key results are insensitive to the use of other estimation strategies.
The coefficient of interest to us is γ. This represents the permanent export effect – the “Olympic
Effect” – associated with having hosted the post‐war Summer Olympic games, holding other export
determinants constant through the gravity model (we try hard not to interpret these coefficients as
causal). The hosts of post‐war Olympic games are tabulated in Appendix Table A3.ii
3.2 Benchmark Results
The results of estimating our default specification are presented in Table 1. The default
estimates are tabulated in the three columns towards the left, where results are presented for three
different sets of fixed effects (none, dyadic, and exporter/importer).
Before we discuss the coefficient of greatest interest to us, we briefly discuss the other
determinants of trade flows. The gravity model seems to work well. It delivers precisely estimated
coefficients that are sensible and similar to those estimated by others. For instance, β1 is consistently
estimated to be economically and statistically significant; exports between a pair of countries fall with
distance (as previous researchers have found). Similarly, the size and significance of β3 and β5 indicates
that larger and richer countries both tend to import more. Exports are larger when countries share a
money, language, trade agreement, land border, or colonial heritage. Further, the equations fit the
(largely cross‐sectional) data set well, explaining well over half of the variation in exports. While these
results are not of direct interest to us, they do reassure us that our estimates are grounded in a
statistical conditioning model that delivers sensible and significant results.
Once the standard trade determinants are accounted for by the gravity model, is there any
room left for a permanent export effect of hosting the Summer Olympics? Somewhat surprisingly (at
least initially to us), the answer is unambiguously positive. Consider the column on the extreme left‐
hand side of Table 1; the estimate of γ is positive and statistically distinguishable from zero at all
reasonable significance levels. Further, the “Olympic Effect" is economically large; the point estimate of
.33, taken literally, implies that countries that have hosted the summer games have exports that are

permanently higher by some (exp(.33) ‐ 1 = 39% ! This is big, broadly comparable in our estimates to,
e.g., the effects of a shared regional trade agreement. Reassuringly, including either dyadic or country‐
specific fixed effects does not change the key result very much.
The four columns at the right of the table provide further sensitivity analysis, adding
combinations of country‐specific fixed effects interacted with linear time trends. This allows, e.g., each
exporter (importer) to have its own trend growth rate of exports (imports), aside from any other global
time or other effects. The smallest estimate of γ appears when we include exporter‐specific time trends
and importer‐specific intercepts, but even in this case, previous hosts of the Summer games have
exports some (exp(.16)‐1=) 17% larger.
Succinctly, countries that have hosted the Summer Olympic games in the past seem to have
exports that are both economically and statistically significant higher, holding other things constant; an
effect of 20% seems a reasonable lower bound. Understanding this apparently implausible result more
deeply takes up the remainder of the paper.
4. Sensitivity Analysis
4.1 Robustness of Permanent Effect
Are the (surprisingly) strong linkages between exports and Olympic hosts fragile? Or instead, do
small perturbations to the exact sample or choice of conditioning model have a strong effect on the
results? No. We provide a battery of robustness checks in Table 2, which is intended to reassure the
skeptical reader that our results are essentially insensitive to minor changes in the exact econometric
methodology used to estimate γ. Each of the rows in the table corresponds to a different sensitivity
check, while the three columns correspond to the default three sets of fixed effects including to the left
in Table 1. We only report estimates for the coefficient of interest γ; other controls are included in the
regressions as appropriate but not reported.
The first experiment of Table 2 shows the results when exports from i to j are replaced by
imports into i from j. The coefficients remain statistically large and positive. Indeed, the point estimates
are, if anything, somewhat larger than those associated with exports. This indicates that the Olympics
are associated with an increase in the openness of an Olympic host. The games do not seem to act as
simple export promotion, but are instead associated with an increase in two‐way trade between the
host and the rest of the world.
Next we change the empirical model by stripping down the gravity model by including only
bilateral distance, importer population, and importer income as controls. However, our key finding of
strong positive γ coefficients persists. The same is true when we add regional dummy variables, taken
from the regional groupings from the World Bank (so that they include only developing countries). In
particular, we include dummy variables for: East Asia and the Pacific; Europe and Central Asia; Latin
American and the Caribbean; the Middle East and North Africa; South Asia; and Sub‐Saharan Africa. We

then successively delete observations for developing countries from: Latin America or the Caribbean;
Africa; Asia; or the Middle East. However, our results do not seem to be sensitively on observations
from a particular region of the world.
We check further for sample robustness by selectively dropping different sets of observations.
We first drop all observations for importers that are classified as “industrial” by the IMF. We then
consider only middle‐income exporters (using the 2008 World Bank definition of a country with real
annual GNI per capita between $976 and $11,905), and then only middle‐income importers. We then
drop small exporters (defining a small country as one with fewer than a million people), poor exporters
(those with real GDP per capita of less than $1000 per annum), small and then poor importers, and the
intersection of these four sets. Finally we create a more balanced sample by restricting ourselves to the
47 countries with relatively complete bilateral data. None of these robustness checks shakes the
confidence we have in our basic results; we once find a negative and significant effect of hosting, but
only in the absence of fixed effects. We then check the sensitivity of our results with respect to time.
We separately drop late (post‐2000) and early (pre‐1960) observations; again this does not destroy our
findings.
We finish up this analysis with five further experiments. First, we weight our regressions by the
log of the product of the country‐pair real GDP. Second, we drop outlier observations, defined as those
where the residual is far (more than 2.5 standard deviations) away from zero. We then redefine our key
Olympics regressor in two ways. First, we construct a variable which is 0 if neither i nor j has hosted the
Olympics at or before time t, 1 if either i or j has hosted (at or before t), and 2 if both i and j have hosted.
The last variable delivers insignificant results for hosting the summer games when fixed effects are
included; otherwise, our results are insensitive. Finally, we use the Glick‐Taylor historical data set, which
includes bilateral trade (but not export) data stretching back to 1870. Using this long data set allows us
to incorporate observations for countries that have hosted the games at any point during the modern
Olympiad era, not just from the shorter postwar period. However, our findings remain resilient;
countries seem to have permanently higher trade flows after having hosted the games.
We conclude that our results do not seem to result from some small subset of the data set, and
are robust to reasonable changes in the sample and exact specification of our empirical model.
Countries that have hosted the Summer Olympic games seem to have higher trade than others.
4.2 Endogeneity
A question arises immediately: Can the choice of venue for the Olympic games be treated as
plausibly exogenous? Perhaps only countries that are open to trade are chosen to host the games? We
attempt to address this point more directly below with a matching methodology that compares Olympic
hosts (as “treatments”) to other countries (“controls”), and we also pursue an event study of relevance.
Still, we now make several points.
First, the endogeneity critique (along with much of our analysis) is primarily cross‐sectional,
while the empirical finding of relevance to us is found in the time‐series behavior of trade.

Second, our analysis shows that countries become more open after the Olympics. However,
cities (not countries) bid to host the games. Indeed, four American cities vied for the 1948 Olympics
(which went to London); five American cities applied in 1952 (again without success), and six in 1956
(also unsuccessfully).iii
Third, the IOC provides details both on how it awards the games and why a city should be
interested. There is a long list of technical criteria which are evaluated by an IOC committee; few of
these criteria are closely associated with trade. Informally, there is also geographic balancing, and the
IOC seems to award perseverance (a number of cities have applied repeatedly). We also note in passing
that there is considerable randomness inherent in the process.
Fourth, our data does allow us to consider the issue of reverse causality directly. In particular,
we can statistically examine whether more open countries are more likely to bid for, or obtain hosting
rights to the Olympics. We conduct probit tests to that effect in Table A4 in the appendix. In addition to
including openness, we control for country size and per capita income. We find that openness enters
insignificantly throughout, suggesting that reverse causality is not an issue.
Why does the IOC think that cities should be interested in hosting the Olympics? They state:
“`Apart from the sporting events, the main reason for applying for candidacy lies in the possibilities for economic development and tourism inherent in such an event. For this reason, and also given the high infrastructure costs, only rich countries have the means to make a good return on such a large investment.”iv
“`Two main reasons seem to motivate most applicant cities, namely international recognition and increased opportunities for invigorated urban and regional development. Indeed, the host city hopes to take advantage of the event to maximize its facilities due to the considerable income generated by the Games, and to give itself an enhanced image to attract future visitors, consumers and potential investors ... Organising the Olympic Games is a fantastic advertising opportunity for the host city... Moreover, organizing the Olympic Games is an opportunity for the host city and country to show the world their ability to undertake and organise successfully such an important event. This promotional aspect is often motivated by the politicians of the host country, thereby explaining the heavy involvement of national governments in the organisation and financing of Olympic Games."
4.3 Other International `”Mega‐events”
While the Olympics are highly visible, they are not the only mega‐event. Do other events deliver
similar results? One obvious alternative to consider is the World Cup, the only serious competitor with
the Olympics for title of most important international sporting event.
Like the Olympics, the FIFA World Cup is held every four years. It began in 1930 in much the
small‐scale way as did the modern Olympics game, with thirteen (mostly Latin American) countries
participating in a tournament held in Uruguay. The 1934 and 1938 tournaments were also relatively
small and regional, being held in Europe with limited participation by the Latins. The event only really
took off in 1950 (the 1942 and 1946 events were canceled for World War II). This was due in part to a
convention of alternating the event between the Americas and Europe.v We construct dummy variables

for countries that have hosted the World Cup post‐war in a manner analogous to those for the Olympic
games, and add them to our specification. We report our results in Table 3a.
The results of Table 3a are intriguing. The effect of hosting the Olympic games remains positive
and statistically significant for all three specifications; the coefficients continue to average around .2.
The effects of hosting the FIFA World Cup are similar in sign, size, and statistical precision. Indeed, we
can never reject the hypothesis of equal trade effects of hosting the Olympics and the World Cup.
What about international events that do not involve sports? After all, international expositions
and world's fairs have an older pedigree than the modern Olympics, stretching back at least to the 1851
Great Exhibition in London's Crystal Palace. The decline of international communication and
transportation costs has largely made world's fairs obsolete, and they have declined in importance and
number throughout the post‐war period (Expo 67 in Montreal is widely considered to be the most
successful expo ever held). Still, Table 3b adds comparably constructed binary variables for (twenty)
post‐war expos and world's fairs to our default specification. In all specifications, the trade effect of
hosting a world's fair or expo is positive and statistically significant, though it is smaller than the Olympic
effect on trade.
There seem to be a number of ways in which a country can enhance its trade by hosting an
international mega‐event. The trade‐expanding effects of hosting an event like the Olympics seem to be
large, and they are broadly comparable to those associated with hosting the FIFA World Cup. Holding an
expo or world's fair also seems to have much the same effect. Given our initial doubts concerning the
benefits of hosting a mega‐event, we now dive into the issue more deeply.
5. Unsuccessful Candidates
It is difficult for us to believe that hosting the Olympics actually has such a large effect on trade,
let alone one that enhances trade permanently. Yet our sensitivity analysis shows that our results are
sturdy.
We now take a skeptical look at our results from a different angle. To estimate the effects of
the Olympics on trade in the previous section, our statistical model compared hosts with non‐hosts.
This seems a reasonable strategy, since not all countries have hosted the games (so there is cross‐
sectional variation), and the countries that host the Olympics do so at different points of time (so there
is time‐series variation). However, it may be that our regression results are implicitly comparing apples
with oranges; countries are not randomly chosen to host the Olympics. One way to get at this issue is to
compare the trade patterns of host countries with those that bid unsuccessfully for the games. We refer
to the latter as unsuccessful “candidate” countries; candidates are tabulated in Appendix Table A3. Our
implicit assumption in comparing the trade effects of Olympic hosting and candidacy is that failed
candidacies form a valid quasi‐experimental counterfactual control group for Olympic hosts (after the
inclusion of other conditioning variables).

In Table 4a, we report results when we add a set of binary variables for countries that were
unsuccessful candidates to host the Olympics. These have been constructed in the same way as our
host dummy variables. For instance, London was awarded the 1948 summer games, so the summer
host variable is unity for all British (export) observations from 1948 through the end of the sample.
Since Lausanne was an unsuccessful candidate for the 1948 games, all Swiss observations from 1948
also take the value of unity for the comparable summer candidate variable. We tabulate separate
export estimates for: a) being an unsuccessful Olympic candidate; and b) actually hosting the games.
Intriguingly, all the effects – that is, both the host and the candidate coefficients ‐ are significantly
positive and economically large. They are also similar in size; as the tests at the bottom of the panel
show, the hypothesis that host and candidate effects are equal cannot be rejected at the 1% confidence
level (though it can be at the 5% level for two of the three cases, once because of a larger hosting effect,
and once because of a smaller hosting effect). Table 4b uses narrows the set of unsuccessful being
compared to hosts; only the runner‐up to the actual host chosen is used. The results remain quite
consistent with the idea that the hosting effect on trade is similar in size to that of being an otherwise
similar but unsuccessful candidate for the Summer Olympics. Nothing below really hinges on the
magnitude of hosting being exactly equal to that of launching an unsuccessful Olympic bid, but we adopt
this assumption below for simplicity, and because it seems consistent with the gross facts.
5.1 Timing of the Olympic Effect and Exports
The statistical analysis of Table 4 indicates that bidding to host the Olympics seems to have an
export effect comparable in magnitude to that of hosting the games. We explore this result further in
Figure 1, which portrays the export effects of bidding for the Summer Olympics, either successfully or
unsuccessfully, in an event‐study. Instead of using a single dummy variable to show the post‐Olympic
hosting effect on trade (as in Tables 1‐4 above), we use an unrestricted distributed lag model, so that
the lagged impact of bidding for the games is allowed to vary depending on the number of years before
or since the bid. Since bids to host the games are typically submitted seven years before the actual
games, we mark the submission of bids with a vertical line, and consider observations up to twenty
years before and forty years after the actual games. We control for other trade effects through the
gravity model (employed above), portray results for three different sets of fixed effects, and show the
coefficients in the distributed lag model along with a +/‐ two standard error confidence interval.
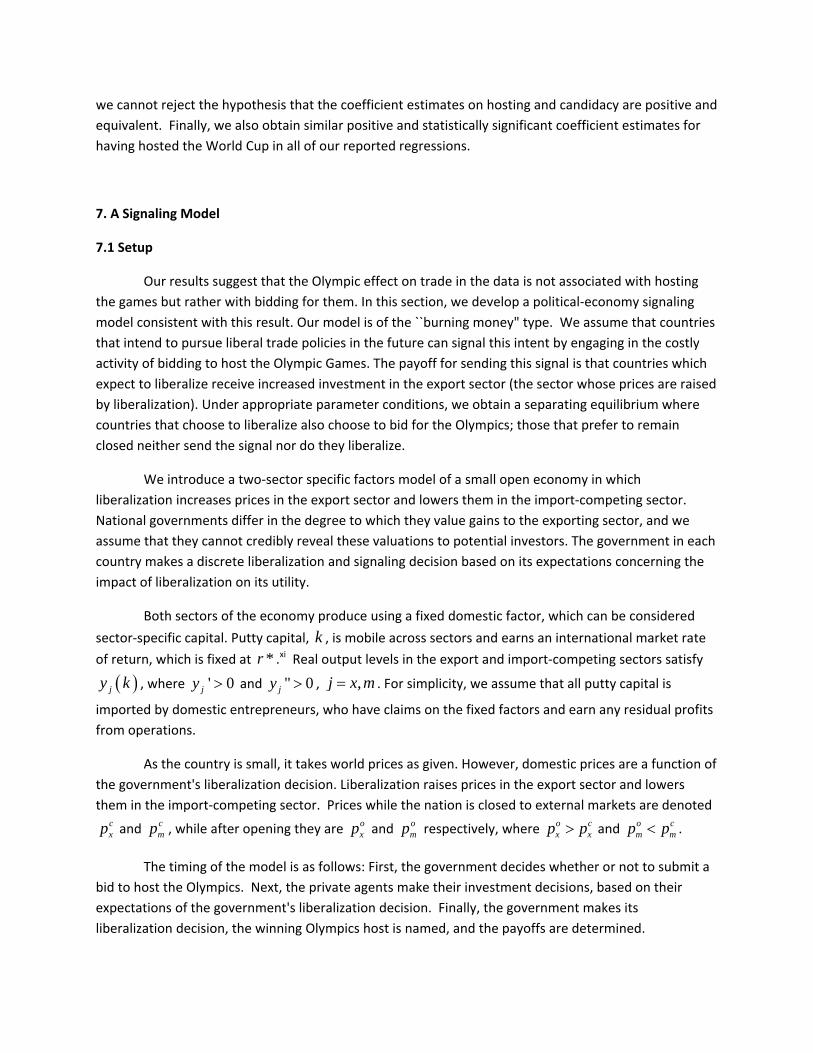
Exports seem insignificantly different for bidders and non‐bidders up until the time the time of
the Olympic bid. But after the bid – and before the actual games – exports seem to rise significantly.
Exports for Olympic bidders remain significantly higher for decades after the games; the exact size
depends on the specification of the fixed effects. This effect does not stem simply from hosting; Figure 2
is an analogue to Figure 1, but examines only unsuccessful bids for the games. The similarity between
the two figures is striking; in both cases, the export effect starts around the time of the bid, rises before
the actual games, and appears to be a highly persistent effect. Analogues to Figures 1 and 2 for imports
are available in Figures 3 and 4; they show similar patterns.vi
This is an intriguing result, one which we find reasonably consistently throughout our
investigation. It implies that the (sizeable) effect on trade seems to come not from actually hosting the

games but from being a country that bids for them. More generally, signaling that the country is
capable and willing to host the Olympics through a highly visible international bid for a mega‐event
seems to be associated with a sizeable trade‐expanding effect. Indeed, the effect of sending this signal
seems broadly comparable in size to actually hosting the games. This is consistent with our view that
any direct trade effect of hosting the games is small. Moreover, it suggests that the observed effects of
hosting a mega‐event do not seem to stem from a “big push" type of process [e.g. Murphy et. al. (1989).
We dismiss as implausible the idea that economic fundamentals (e.g., transport infrastructure) relevant
for trade have been improved by both hosts and unsuccessful candidates alike during the run‐up to a
serious Olympic bid.vii
6. Further Robustness Checks
In this section, we move beyond the conventional gravity model and briefly subject our results
to three further sensitivity tests. Given our interest in estimating and comparing the trade effects of
both hosting and bidding for a mega‐event like the Olympics, we have three particular concerns; a)
econometric issues associated with the gravity model; b) econometric issues associated with selection
bias and endogeneity; and c) the presence of our finding in multilateral data.viii
6.1 Tetradic estimates
We begin by dealing with the problem that gravity models like ours may be mis‐specified
because of “monadic" problems. These refer to omitted factors that are specific to a single country but
may vary over time, such as those associated with “multilateral resistance" to trade, e.g. Anderson and
van Wincoop (2003). To deal with the problem, we adopt the “method of tetrads" advocated by Head
et al (2010). With this method, consistent estimators of the coefficients of interest can be attained in the
presence of multilateral resistance by comparing export observations to exports for a pair of base
countries for the same year (the technique is “tetradic” since one compares trade flows for four
countries). This method avoids the large number of coefficient estimates that would be required to
estimate the monadic effects using a more conventional fixed effects method, but does not either
infeasible computational demands or non‐linear estimation; Head et. al (2010) provide more details.
One issue that arises in tetradic gravity specifications is the designation of the base countries. To
ensure that our results are robust, we use three different pairs of base countries: a) the United States
and the United Kingdom; b) Japan and France; and c) Germany and Canada. A second issue is that the
error terms in our tetrads are likely to be correlated, as error terms for individual countries appear
repeatedly across observations. We therefore use the methodology of Head et. al (2010) to correct our
standard error estimates. Finally, this estimation technique requires variation across both dyads and
time, so that the dummy variable we used for Table 1 is inadmissible; we substitute instead a dummy
which is 0 if neither i nor j has bid for the Olympics at or before time t, and 1 if either i or j has.

Our results are reported in Table 5. It can be seen that we continue to obtain positive and
statistically significant effects of either hosting or candidacy for the Olympics, regardless of our choice of
base countries; our point estimate are, if anything, implausibly large.
6.2 Matching: a Treatment Methodology
We next use a treatment methodology, comparing exports for either “treated” hosts or
candidate countries to exports for their matched “control” counterparts. Candidate and host countries
for the Olympic games are not randomly selected from our sample; instead they choose whether to
submit a bid or not. Thus there is the possibility that our results largely reflect selection bias; using a
matching technique allows us to handle this problem more effectively. We do two kinds of matching: a)
we match actual Olympic host countries to candidates; and b) we match the union of hosts and
candidates to non‐candidates. If host and candidate countries experience similar trade boosts, we
expect the first exercise to lead to small differences in exports. If bidding for a mega‐event is key, we
expect the second exercise to result in large trade effects.
The variables that we use to match country‐pair‐year observations include the logs of: distance,
exporter and importer populations, exporter and importer real GDPs per capita; and dummy variables
for sharing a common language or border. Essentially the matching estimator is trying to use these
variables to estimate two things: a) what trade would have been for bidders if they had not actually
made a bid; and b) what trade would have been for non‐bidders if they had made a bid. We match
observations using a stratification technique; Becker and Ichino (2002) provide more details and
references on the methodology.ix
Our results, along with bootstrapped standard error estimates are shown in Table 6. We find
that hosts of the Summer Olympics experience a small increase in exports compared with candidates for
the games. This effect is statistically significant at a 5% (but not 1%) confidence level. This weak result
contrasts with the comparison of hosts and candidates considered together against non‐candidate
countries. Bidders experience a considerable trade boost compared with non‐candidates. These effects
are economically large (exports rise by about 20%) and are significant at the 1% confidence level.x
6.3 Multilateral data
As a final robustness check, we examine the effect of hosting or being a candidate for the
Olympics on the aggregate export/GDP ratio; we also consider being a World Cup host. We do this by
simply regressing multilateral data (so that an observation is for a particular country and year) on the
Olympic dummies. To account for other determinants of trade as a fraction of output, we also control
for the logs of population, real GDP per capita, and include country fixed‐effects (year effects are added
as sensitivity analysis in another column).
Our results are shown in Table 7. We find that countries which have hosted the Olympics have
trade approximately 15% (=exp(.14)‐1) higher, other things being equal. We obtain a similar but slightly
large effect for unsuccessful candidacy; this effect (unlike the hosting effect) is significantly above zero
at conventional confidence levels. All in all, our aggregate results mirror those above in the sense that
we cannot reject the hypothesis that the coefficient estimates on hosting and candidacy are positive and
equivalent. Finally, we also obtain similar positive and statistically significant coefficient estimates for
having hosted the World Cup in all of our reported regressions.
7. A Signaling Model
7.1 Setup
Our results suggest that the Olympic effect on trade in the data is not associated with hosting
the games but rather with bidding for them. In this section, we develop a political‐economy signaling
model consistent with this result. Our model is of the ``burning money" type. We assume that countries
that intend to pursue liberal trade policies in the future can signal this intent by engaging in the costly
activity of bidding to host the Olympic Games. The payoff for sending this signal is that countries which
expect to liberalize receive increased investment in the export sector (the sector whose prices are raised
by liberalization). Under appropriate parameter conditions, we obtain a separating equilibrium where
countries that choose to liberalize also choose to bid for the Olympics; those that prefer to remain
closed neither send the signal nor do they liberalize.
We introduce a two‐sector specific factors model of a small open economy in which
liberalization increases prices in the export sector and lowers them in the import‐competing sector.
National governments differ in the degree to which they value gains to the exporting sector, and we
assume that they cannot credibly reveal these valuations to potential investors. The government in each
country makes a discrete liberalization and signaling decision based on its expectations concerning the
impact of liberalization on its utility.
Both sectors of the economy produce using a fixed domestic factor, which can be considered
sector‐specific capital. Putty capital, k , is mobile across sectors and earns an international market rate
of return, which is fixed at *r .xi Real output levels in the export and import‐competing sectors satisfy
jy k , where ' 0jy and " 0jy , ,j x m . For simplicity, we assume that all putty capital is
imported by domestic entrepreneurs, who have claims on the fixed factors and earn any residual profits
from operations.
As the country is small, it takes world prices as given. However, domestic prices are a function of
the government's liberalization decision. Liberalization raises prices in the export sector and lowers
them in the import‐competing sector. Prices while the nation is closed to external markets are denoted cxp and c
mp , while after opening they are oxp and o
mp respectively, where o cx xp p and o c
m mp p .
The timing of the model is as follows: First, the government decides whether or not to submit a
bid to host the Olympics. Next, the private agents make their investment decisions, based on their
expectations of the government's liberalization decision. Finally, the government makes its
liberalization decision, the winning Olympics host is named, and the payoffs are determined.

To ensure sub‐game perfection, we solve the model backwards. Subsequent to receiving the
government's signal, foreign putty capital is invested in each sector to equate the value of marginal
product in that sector to the world interest rate, such that,
* *( ) = (1 ).l l
j j jp y k r (2)
where * ; , , ,ljk j x m l c o represents the equilibrium amount of putty capital allocated to sector j .
Since * / '/ " 0; ,j j jdk dp y p y j x m it follows that * *c o
x xk k and * *c om mk k .
Given that the government's liberalization decision confirms investor expectations, the return to
the domestic entrepreneurs in each sector, lj , satisfies
* * *1 .l lj j j j jp y k r k (3)
It is easy to show that the return in the export (import‐competing) sector is greater (lower) under
liberalization.xii
We assume that the reputation cost of being awarded the games and backing out is prohibitive.
As such each nation expects to host the games conditional on being awarded them. xiii
Let h represent the cost of hosting the Olympics, net of any non‐pecuniary benefit of hosting
the games, such as national pride. Let represent the probability that a candidate will be awarded the
right to host the games conditional on having sent the signal. The expected cost of sending the signal is
therefore equal to h . The government finances the cost of sending the signal by imposing a lump‐sum
tax on each sector, where the export sector pays a share of the cost of sending the signal, h , and
the import‐competing sector pays the rest, 1 h .xiv
The government is assumed to have a utility function that is concave in earnings from each
sector. The government's utility function is assumed to satisfy
= ( ).g j jj
U u v (4)
where 0, 0u u , and ,j x m .xv For simplicity, we normalize by setting = 1m , and define x
as the measure of the degree to which government utility favors the export sector. We assume that
there is a continuum of heterogeneous countries [ , ]z z z , where a higher z indicates a higher value of
z , the value of held by the government of country z . We assume that z is symmetrically
distributed on the interval [ , ] with mean value 1. For notational simplicity, we drop the z
superscripts.

Prior to sending the signal, gU then satisfies
= ( ) ( ).c cg x mU u v u v (5)
After sending a credible signal and liberalizing, government utility, ˆgU , satisfies
ˆ = ( ) ( (1 ) ).o og x mU u v h u v h (6)
7.2 Equilibrium
An equilibrium is a set of signal and liberalization decisions by each government that maximizes
its expected utility, along with a set of investment decisions in the two sectors consistent with
maximizing the returns to the domestic entrepreneurs, conditional on the signal of the government.
In an earlier version of this paper [Rose and Spiegel (2009)], we demonstrate that the change in
government utility with liberalization is monotonically increasing in . Define * as the value of z
which leaves the government indifferent between staying closed and not sending the signal, and
sending the signal and liberalizing. By equations (5) and (6), * satisfies
* ( ) ( (1 ) )
=( ) ( )
c om m
o cx x
u v u v h
u v h u v
(7)
We next derive the conditions necessary to rule out off‐equilibrium path outcomes, where the
signal sent by the government fails to match its subsequent liberalization decision. Let *( )c c o
j j jv v k
( = , )j e m represent the value of revenues in sector j consistent with the off equilibrium path strategy
of signaling liberalization and then not liberalizing, i.e. with capital consistent with liberalization but
prices consistent with remaining closed. As shown in the longer version of this paper, a sufficient (but
not necessary) condition to ensure that this strategy is not chosen is
.c cx xv v h (8)
This restriction requires that the earnings of the export sector without liberalization are higher when the
government does not send the costly signal.
Similarly, let *( ); = ,o o c
j j jv v k j x m represent i.e. the value of revenues in sector j consistent
with not signaling liberalization and then liberalizing. A sufficient (but not necessary) condition to ensure
that this strategy is not chosen is
.o ox xv h v (9)

This restriction requires that the earnings of the export sector with liberalization are higher when the
government sends the (costly) signal. Combined, these restrictions imply that revenues in the export
sector are lower under both off‐equilibrium path strategies.
Given these restrictions, we obtain our first proposition:
Proposition 1 There exists a separating equilibrium where countries with *z send the signal and
liberalize, and countries with *<z neither send the signal nor liberalize.
Proof: First, consider the set of countries with *<z . Since the gains from liberalizing are monotonic
in and we have ruled out off‐equilibrium path strategies, these countries' governments would prefer
to not send the signal. Similarly, the countries with governments holding values of z that satisfy *z would choose to send the signal and liberalize.
7.3 Incidence of Signaling Cost
It can be seen in equation (6) that the desirability of sending the signal and liberalizing is a
function of , the export sector’s share of the cost of sending the signal. Since liberalization benefits the export sector and harms the import‐competing sector, it seems plausible that the government's
preference for liberalizing is increasing in , as it mitigates the disadvantages from liberalization to the
import‐competing sector. However, this must be balanced against the government's preference for
revenues from the export sector, parameterized by . If the government favors the export sector too
heavily, the desire for liberalization could be decreasing in .
More formally, differentiating * with respect to in (7) yields
** [ ( ) ( (1 ) )]
= .( ) ( )
o ox m
o cx x
h u v h u v h
u v h u v
(10)
The denominator is positive, so the sign of the derivative is equal to the sign of the bracketed
term in the numerator. There are three terms here: * ; the marginal utility of the export sector after
liberalization; and the marginal utility of the import sector after liberalization. The entire term will be
negative if and only if
* [ (1 ) ]
.[ ]
om
ox
u v h
u v h
(11)
Condition (11) requires that * (the relative valuation of export earnings held by the
government that is just indifferent between liberalizing and not liberalizing) is less than or equal to the
marginal rate of substitution between post‐liberalization earnings in the import‐competing and export
sectors. Intuitively, this implies that relative earnings in the import‐competing sector are sufficiently low,

even after adjusting for the relative weight placed on export earnings ( * ). For example, in the
benchmark case where the government values earnings in each sector equally *( =1) , the condition
will be satisfied if earnings net of expected signaling costs subsequent to liberalization are lower in the
export sector than in the import sector.
Given this condition, we obtain our second proposition:
Proposition 2 Given a separating equilibrium for all countries [ , ]z z z , and satisfaction of condition
(11), an increase in reduces * , raising the set of countries that choose to send the signal and
liberalize, while if (11) is violated, an increase in increases * .
The proof follows directly from equations (10) and (11). The intuition behind Proposition 2 lies in
the fact that increases in improve the alignment between the costs and benefits from liberalization.
This may favor the use of bidding for the olympics as a signal of openness intentions. The costs
of hosting the Games are traditionally borne by the host city (usually the capital) in conjunction with the
central government of the host country. Policy makers from these groups are likely to benefit from
liberalization. In terms of our model, ``mega‐events" like the Olympics may be high signals.
To summarize: our model suggests that countries choose to bid for a mega‐event in order to
signal investors about their future liberalization intentions. Under certain parameter conditions,
governments that wish to liberalize can profit from sending the costly signal of bidding to host the
games, while those that do not wish to liberalize do not; a separating equilibrium. Moreover, the
conditions imply that the probability‐weighted cost of holding the Olympics must be sufficiently large to
dissuade governments that do not wish to liberalize from sending a false signal. This motivates the
choice of a costly mega‐event as a signal of liberalization intentions.
Further, the model also demonstrates that distributional implications matter; the incidence of
the cost of the signal has an impact on its desirability. The signal must be sufficiently costly to the export
sector, the sector that would benefit from the policy change, not just costly to the nation. Also, if the
government does not favor the export sector too greatly, and liberalization has sufficient distributional
consequences, an increase in share of expected cost of hosting games borne by the export sector
increases the marginal government's willingness to bid. That is, the higher is the expected burden of
hosting the Olympics on the exportable sector, the more attractive is bidding for a mega‐event as a
signal of liberalization.
8. Conclusion
In this paper, we model this linkage between mega‐events and liberalization both theoretically
and empirically. The motivation for hosting a mega‐event like the Olympics seems elusive to
economists. Plausibly measured net economic benefits are rarely large and typically negative; claims of

non‐economic benefits are difficult to verify. Yet in practice countries compete fiercely for the right to
host such events. Why? This paper identifies one potential explanation; countries that host the games
enjoy a substantive permanent increase in trade ‐‐ the ``Olympic Effect." Similar increases in openness
are observed for countries that host other mega‐events, such as the World Cup and, until recently,
World's Fairs. For a country pursuing a trade‐oriented development strategy, such an outcome would
clearly be attractive.
Our empirical results show that the Olympic effect is robust; hosting the games tends to
increase a country's openness substantively and permanently. But we not believe that hosting the
Olympics has an actual causal effect on trade; while hosting the games is sufficient to boost trade, it is
not necessary. In practice, we find that countries that bid for the Olympics unsuccessfully also
experience a boost in trade, comparable to that received by actual Olympic hosts. This finding implies
that the Olympic Effect on trade does not stem from a change in economic fundamentals, caused by the
activity or infrastructure associated with hosting the Olympics. Instead, our empirical findings suggest
that bidding for the Olympics is a costly policy signal that is followed by future liberalization. We explore
this conjecture in a political economy model, where governments choose whether or not to signal future
liberalization by hosting a mega‐event like the Olympics. We derive the conditions for a separating
equilibrium, where only countries that value liberalization choose to send the signal and liberalize. Our
model also suggests that the size and distributional consequences of this type of signal may influence its
desirability.
We close with a number of cautions. First, our model makes no clear statement on the merit of
public support for hosting mega‐events. Second, there are other motivations for hosting mega‐events
which we have not modeled; for instance, our theory cannot easily explain the behavior of countries
that submit repeated or multiple bids for large sporting events, why open economies bid for mega‐
events, and why countries seem to spend so much effort on their bids. Finally, other signals of and
routes to liberalization exist, and our analysis does not examine the relative effectiveness of these
paths; we leave such issues to future research.

Table 1: Permanent Effect of Olympics on Log Exports in Gravity Model Summer Olympics Host (γ) .33**
(.04) .24**(.03)
.30**(.04)
.19**(.04)
.16**(.04)
.34** (.03)
.35**(.04)
Log Distance (β1) ‐1.12** (.02)
n/a ‐1.33**(.02)
‐1.26**(.02)
‐1.31**(.02)
‐1.14** (.02)
‐1.32**(.02)
Log Exp Population (β2) 1.07** (.01)
.19**(.06)
‐.25**(.06)
.80**(.02)
.78**(.02)
1.08** (.01)
‐.41**(.06)
Log Imp Population (β3) .88** (.01)
.80**(.05)
.45**(.05)
.91**(.01)
.28**(.05)
.79** (.02)
.78**(.02)
Log Exp Real GDP p/c (β4) 1.55** (.01)
1.24**(.03)
1.25**(.04)
1.16**(.02)
1.20**(.02)
1.60** (.01)
1.27**(.03)
Log Imp Real GDP p/c (β5) 1.18** (.01)
.87**(.03)
.84**(.03)
1.22**(.01)
.85**(.03)
.94** (.02)
.95**(.02)
Currency Union (β6) 1.03** (.10)
.56**(.09)
.67**(.10)
.82**(.10)
.62**(.09)
.80** (.10)
.60**(.09)
Common Language (β7) .45** (.04)
n/a .34**(.03)
.44**(.03)
.35**(.03)
.39** (.03)
.33**(.03)
RTA (β8) .27** (.03)
.29**(.02)
.43**(.03)
.33*(.03)
.46**(.03)
.42** (.03)
.47**(.03)
Common Border (β9) .68** (.08)
n/a .46**(.08)
.45**(.08)
.46**(.08)
.70** (.08)
.44**(.08)
# Islands (β10) .17** (.03)
n/a ‐3.86**(.32)
.39**(.03)
.55**(.08)
.04 (.04)
.68**(.08)
Log Product Area (β11) ‐.07** (.01)
n/a .57**(.03)
‐.06**(.01)
.02(.02)
‐.07** (.01)
‐.02(.02)
Common Colonizer (β12) .58** (.06)
n/a .75**(.05)
.58**(.05)
.77**(.05)
.74** (.05)
.74**(.05)
Currently Colony (β13) .61* (.24)
.38*(.19)
.95**(.25)
.75**(.22)
.94**(.22)
.81** (.24)
1.02**(.24)
Ever Colony (β14) 1.45** (.10)
n/a 1.42**(.09)
1.49**(.09)
1.40**(.09)
1.31** (.09)
1.43**(.09)
Common Country (β15) .09 (.71)
n/a ‐.95*(.41)
‐.41(.38)
‐.93**(.35)
‐.35 (.62)
‐.99*(.42)
Year Effects Yes Yes Yes Yes Yes Yes Yes
Dyadic Fixed Effects Yes
Exporter Fixed Effects Yes Yes
Importer Fixed Effects Yes Yes
Exporter*Time Fixed Effects Yes Yes
Importer*Time Fixed Effects Yes Yes
R2 .61 .85 .69 .66 .69 .64 .69
RMSE 2.18 1.40 1.94 2.04 1.94 2.09 1.94
449,220 bilateral annual observations covering 196 countries, 1950‐2006. Robust standard errors (clustered by dyads) in parentheses. Coefficients significant different from 0 at .05 (.01) marked with one (two) asterisk(s).

Table 2: Sensitivity Analysis of Permanent Olympics Export Effect Fixed Effects: Years Years, Dyads Years, Exporters, Importers
Substitute Imports for Exports
.62** (.04)
.50** (.04)
.65** (.05)
Stripped Down Gravity Model .30** (.04)
.22** (.04)
.27** (.04)
Add Regional Dummies .21** (.04)
.24** (.03)
.30** (.04)
Drop Latin American, Caribbean Importers
.28** (.04)
.22** (.04)
.29** (.04)
Drop African Importers .37** (.04)
.26** (.04)
.34** (.04)
Drop Asian Importers .35** (.04)
.26** (.04)
.33** (.04)
Drop Middle Eastern importers
.33** (.04)
.24** (.04)
.30** (.04)
Drop Industrial Importers .31** (.04)
.25** (.04)
.27** (.04)
Only Middle Income Exporters
‐.39** (.13)
.88** (.14)
.86** (.14)
Only Middle Income Importers
.33** (.05)
.28** (.05)
.27** (.06)
Drop Small (<1 million) Exporters
.28** (.04)
.18** (.03)
.22** (.04)
Drop Poor (<$1000 real GDP p/c) Exporters
.21** (.04)
.18** (.03)
.24** (.04)
Drop Small (<1 million) Importers
.36** (.04)
.25** (.04)
.31** (.04)
Drop Poor (<$1000 real GDP p/c) Importers
.34** (.04)
.25** (.04)
.33** (.04)
Drop all Small/Poor countries .16** (.04)
.12** (.04)
.17** (.04)
More Balanced Sample .15** (.05)
.16** (.05)
.21** (.05)
Drop Late (>2000) data .36** (.04)
.23** (.04)
.27** (.04)
Drop Early (<1960) data .32** (.04)
.17** (.04)
.24** (.04)
Weight by log product real GDP
.25** (.03)
.17** (.03)
.23** (.04)
Drop >|2.5σ| outliers .27** (.03)
.18** (.03)
.25** (.04)
Exporter or Importer Host .47** (.03)
.33** (.03)
.36** (.04)
Exporter and Importer Host .47** (.03)
.34** (.03)
.41** (.03)
Glick‐Taylor (1870‐1997) data set
.56** (.03)
.34** (.04)
.37** (.04)
Coefficient on permanent Olympic hosting effect. Standard data set includes up to 449,220 bilateral annual observations covering 196 countries, 1950‐2006. Robust standard errors (clustered by dyads) in parentheses. Coefficients significant different from 0 at .05 (.01) marked with one (two) asterisk(s). Regressand is log real bilateral exports. Controls included but not recorded: Log Distance; Log Exporter Population; Log Importer Population; Log Exporter Real GDP p/c; Log Importer Real GDP p/c; Currency Union dummy; Common Language dummy; RTA dummy; Common Land Border dummy; # Islands; Log Product Area; Common Colonizer dummy; Current Colony dummy; Ever Colony dummy; and Common Country dummy.

Table 3: The Permanent Effects of Other Mega‐Events on Log Exports A. Effects of Hosting Olympics and World Cup
Fixed Effects: Years Years, Dyads Years, Exporters, Importers
Olympic Effect .30**(.04)
.19**(.03)
.22**(.04)
World Cup Effect .31**(.03)
.18**(.03)
.27**(.03)
Olympic=World Cup Effect? (p‐value)
.80 .95 .39
B. Effects of Hosting Olympics and World’s Fair/Expo Fixed Effects: Years Years, Dyads Years, Exporters,
Importers
Olympic Effect .26**(.04)
.21**(.03)
.26**(.04)
World’s Fair/Expo Effect .19**(.04)
.07**(.03)
.09**(.03)
Olympic=World’s Fair/Expo Effect? (p‐value)
.24 .00** .00**
Coefficient on permanent effect of having hosted a mega‐event. Standard data set includes up to 449,220 bilateral annual observations covering 196 countries, 1950‐2006. Robust standard errors (clustered by dyads) in parentheses. Coefficients significant different from 0 at .05 (.01) marked with one (two) asterisk(s). Regressand is log real bilateral exports. Controls included but not recorded: Log Distance; Log Exporter Population; Log Importer Population; Log Exporter Real GDP p/c; Log Importer Real GDP p/c; Currency Union dummy; Common Language dummy; RTA dummy; Common Land Border dummy; # Islands; Log Product Area; Common Colonizer dummy; Current Colony dummy; Ever Colony dummy; and Common Country dummy.

Table 4a: The Permanent Effects of Olympic Hosting and Candidacy on Log Exports Fixed Effects: Years Years, Dyads Years, Exporters,
Importers
Olympic Hosting Effect .30**(.04)
.20**(.03)
.24**(.04)
Olympic Candidacy Effect .20**(.03)
.25**(.03)
.34**(.03)
Hosting=Candidacy Effect? (p‐value)
.02* .26 .04*
Table 4b: Effect of Hosting and being Runner‐Up on Log Exports Olympic Hosting Effect .33**
(.04) .23**(.03)
.29**(.04)
Runner‐Up Effect .09*(.04)
.22**(.04)
.31**(.04)
Hosting=Runner‐Up Effect? (p‐value)
.00** .75 .68
Coefficient on permanent effect of having hosted/been a candidate/been the leading runner‐up for the Summer Olympics. Standard data set includes up to 449,220 bilateral annual observations covering 196 countries, 1950‐2006. Robust standard errors (clustered by dyads) in parentheses. Coefficients significant different from 0 at .05 (.01) marked with one (two) asterisk(s). Regressand is log real bilateral exports. Controls included but not recorded: Log Distance; Log Exporter Population; Log Importer Population; Log Exporter Real GDP p/c; Log Importer Real GDP p/c; Currency Union dummy; Common Language dummy; RTA dummy; Common Land Border dummy; # Islands; Log Product Area; Common Colonizer dummy; Current Colony dummy; Ever Colony dummy; and Common Country dummy.
Table 5: Tetradic Permanent Effects of Olympic Hosting/Candidacy on Log Exports Base Exporter USA Japan Germany
Base Importer UK France Canada
Effect of Host/Candidacy
.44** (.04)
.45** (.04)
.76**(.04)
Observations 534,820 523,406 514.703
Bilateral data set covers 196 countries, 1950‐2006. Robust standard errors in parentheses. Coefficients significant different from 0 at .05 (.01) marked with one (two) asterisk(s). Regressors included but not recorded: Currency Union dummy; and Regional Trade Agreement dummy. Year
effects included but not recorded.

Table 6: Using a Matching Methodology for Export Effects Treatment Control Effect
Host Candidate .08*(.04)
Host or Candidate Non‐Candidate .18**(.07)
Average Effect of treatment on treated for bilateral exports, stratification estimator. Coefficients significant different from 0 at .05 (.01) marked with one (two) asterisk(s). Matching variables: Log Distance; Log Exporter Population; Log Importer Population; Log Exporter Real GDP p/c; Log Importer Real GDP p/c; Common Language dummy; and Common Border dummy. Boostrapped errors in parentheses. Annual observations on exports to developed countries.
Table 7: Permanent Mega‐Event Effects on Aggregate log(Exports/GDP) using Multilateral Data Country Fixed Effects Country, Year Fixed Effects
Hosting Summer Olympics .14 (.07)
.13* (.06)
Summer Olympic Candidacy .19** (.07)
.14 (.08)
Summer Olympic Bid (Hosting or Candidacy)
.18* (.08)
.14 (.08)
World Cup .20** (.05)
.18** (.06)
Coefficients, with robust standard errors (clustered by countries) in parentheses. Coefficients significant different from 0 at .05 (.01) marked with one (two) asterisk(s). Each cell represents a separate OLS estimation. Controls included but not recorded: log of population; log of real GDP per capita. 6,081 annual observations, 1960‐2006 for 182 countries.

Figure 1: The Olympic Effect on Exports
0.5
1
-20 Bid Games 20 40
No Fixed Effects
0.3
.6
-20 Bid Games 20 40
Country Fixed Effects
0.3
.6
-20 Bid Games 20 40
Country-Pair Fixed Effects
449,200 bilateral observations (1950-2006, 196 countries), gravity controls
Mean, with +/-2 se Confidence IntervalExport Effect of Any Summer Olympic Bid

Figure 2: Unsuccessful Olympic Bids and Exports
0.5
1
-20 Bid Games 20 40
No Fixed Effects
0.3
.6
-20 Bid Games 20 40
Country Fixed Effects
0.3
.6
-20 Bid Games 20 40
Country-Pair Fixed Effects
449,200 bilateral observations (1950-2006, 196 countries), gravity controls
Mean, with +/-2 se Confidence IntervalFailed Summer Olympic Bids and Exports
Figure 3: The Olympic Effect on Imports
0.3
.6
-20 Bid Games 20 40
No Fixed Effects
0.5
1
-20 Bid Games 20 40
Country Fixed Effects
0.3
.6
-20 Bid Games 20 40
Country-Pair Fixed Effects
475,943 bilateral observations (1950-2006, 196 countries), gravity controls
Mean, with +/-2 se Confidence IntervalImport Effect of Any Summer Olympic Bid

Figure 4: Unsuccessful Olympic Bids and Imports
0.5
1
-20 Bid Games 20 40
No Fixed Effects
0.3
.6
-20 Bid Games 20 40
Country Fixed Effects
0.3
.6
-20 Bid Games 20 40
Country-Pair Fixed Effects
475,943 bilateral observations (1950-2006, 196 countries), gravity controls
Mean, with +/-2 se Confidence IntervalFailed Summer Olympic Bids and Imports

Appendix Table A1: Data Sources
Bilateral Data Set
FOB exports and CIF imports are measured in US, taken from IMF Direction of Trade CD‐ROM,
deflated by US CPI for All Urban Consumers (CPI‐U), all items, 1982‐84=100.
Population and real GDP per capita (rgdpl) taken from PWT Mark 6.2. If PWT data are unavailable,
we use World Development Indicators.
Country‐specific data (on location, area, island‐nation status, contiguity, language, colonizer, and
independence) taken from CIA World Factbook website.
Currency‐union data taken from Glick‐Rose (2002).
Regional trade agreements taken from WTO website,
http://www.wto.org/english/tratop_e/region_e/eif_e.xls
Olympic hosts and candidate cities available from official Olympics website,
http://www.olympic.org/uk/games/past/index_uk.asp?OLGT=1&OLGY=1992@
World Cup hosting: http://www.fifa.com/worldcup/archive/index.html@
Multilateral Data Set
PWT Mark 6.2: Population; nominal GDP; nominal and real openness (exports plus imports as
percentage of GDP); real GDP p/c (PPP‐adjusted)
When PWT data are unavailable, we use World Development Indicators: Exports and Imports
(measured as percentages of GDP); Population; and Real GDP p/c (PPP).

Appendix Table A2: Country List
Afghanistan Albania Algeria American Samoa Andorra (a) Angola Antigua Barbuda Argentina Armenia Aruba Australia Austria Azerbaijan Bahamas Bahrain Bangladesh Barbados Belarus Belgium Belize Benin Bermuda Bhutan Bolivia Bosnia‐Herzegovina Botswana Brazil Brunei Bulgaria Burkina Faso Burundi Cambodia Cameroon Canada Cape Verde Cayman Islands (a) C.A.R. Chad Channel Islands (a) Chile China Colombia Comoros Congo, Dem. Rep. Congo, Republic Of Costa Rica Cote D`Ivoire Croatia Cuba Cyprus
Czech Rep Czechoslovakia (b) Denmark Djibouti Dominica Dominican Rep. Ecuador Egypt El Salvador Eq. Guinea Eritrea Estonia Ethiopia Faeroe Islands Falk Is (b) Fiji Finland Fr Guiana (b) France French Polynesia (b) Gabon Gambia Georgia Germany Ghana Gibraltar (b) Greece Greenland Grenada Guadalupe (b) Guam Guatemala Guinea Guinea‐Bissau Guyana Haiti Honduras Hong Kong Hungary Iceland India Indonesia Iran Iraq Ireland Israel Isle Of Man (a) Italy Jamaica Japan
Jordan Kazakhstan Kenya Kiribati Korea, Rep. Korea N Kuwait Kyrgyzstan Laos Latvia Lebanon Lesotho Liberia Libya Liechtenstein (a) Lithuania Luxembourg Macau Macedonia (FYR) Madagascar Malawi Malaysia Maldives Mali Malta Marshall Islands (a) Martinique (b) Mauritania Mauritius Mayotte (a) Mexico Micronesia. (a) Moldova Monaco (a) Mongolia Montenegro (b) Morocco Mozambique Myanmar Namibia Nauru (b) Nepal Netherlands Netherlands Antilles New Caledonia New Zealand Nicaragua Niger Nigeria North. Mariana Isl. (a)

Norway Oman Pakistan Palau Panama Papua New Guinea Paraguay Peru Philippines Poland Portugal Puerto Rico (a) Qatar Reunion (b) Romania Russia Rwanda Samoa (a) San Marino (a) Sao Tome Principe Saudi Arabia Senegal Serbia Seychelles Sierra Leone Singapore
Slovakia Slovenia Solomon Is. Somalia South Africa Spain Sri Lanka St. Helena (b) St. Kitts Nevis St. Lucia St. Pierre Miquelon (b) St. Vincent & Grenadines Sudan Suriname Swaziland Sweden Switzerland Syria Taiwan (a) Tajikistan Tanzania Thailand Timor‐Leste Togo Tonga Trinidad Tobago
Tunisia Turkey Turkmenistan Tuvalu U.A.E. U.K. U.S.A. Uganda Ukraine Uruguay Uzbekistan Vanuatu Venezuela Vietnam Virgin Isl. (U.S.) (a) Wallis Futuna West Bank Gaza Western Samoa Yemen Yemen N (b) Yemen S (b) Yugoslavia Zambia Zimbabwe
Notes: (a) denotes aggregate data only; (b) denotes bilateral data only.

Appendix Table A3: Hosts and Unsuccessful Candidate Cities for Post‐War Summer Olympics Games
Host Unsuccessful Candidates
1948 London, UK Baltimore, Lausanne, Los Angeles, Minneapolis, Philadelphia.
1952 Helsinki, Finland Amsterdam, Chicago, Detroit, Los Angeles, Minneapolis, Philadelphia.
1956 Melbourne, Australia
Buenos Aires, Chicago, Detroit, Los Angeles, Mexico City, Minneapolis, Philadelphia, San Francisco
1960 Rome, Italy Brussels, Budapest, Detroit, Lausanne, Mexico City, Tokyo.
1964 Tokyo, Japan Brussels, Detroit, Vienna.
1968 Mexico City, Mexico Buenos Aires, Detroit, Lyon.
1972 Munich, Germany Detroit, Madrid, Montreal.
1976 Montreal, Canada Los Angeles, Moscow.
1980 Moscow, USSR Los Angeles.
1984 Los Angeles, USA None
1988 Seoul, Korea Nagoya.
1992 Barcelona, Spain Amsterdam, Belgrade, Birmingham, Brisbane, Paris.
1996 Atlanta, USA Athens, Belgrade, Manchester, Melbourne, Toronto.
2000 Sydney, Australia Beijing, Berlin, Istanbul, Manchester.
2004 Athens, Greece Buenos Aires, CapeTown, Rome, Stockholm.
2008 Beijing, China Istanbul, Osaka, Toronto, Paris
Data available at http://www.olympic.org/uk/games/past/index_uk.asp?OLGT=1&OLGY=1992
Appendix Table A4: Determinants of Bidding for and Hosting the Summer Olympics
Treatment (1) Control (0) Log(Export/GDP) Log(Population) Log(Real GDP p/c)
Host Non‐Host ‐.43 (.31)
.24 (.13)
.68** (.20)
Bidder(Host or Unsuccessful Candidate)
Non‐Bidder ‐.31 (.20)
.42** (.09)
1.01** (.15)
Host Unsuccessful Candidate
‐.64 (.63)
‐.23 (.28)
‐.43 (.52)
Probit estimation; year effects included but not recorded. Coefficients with standard errors in parentheses;
coefficients significantly different from zero at .05 (.01) level marked with one (two) asterisk(s).

1
Appendix Figure A1: The Olympic Effect on Output
-.5
0.5
-20 Bid Games 20 40
Bid
-.5
0.5
-20 Bid Games 20 40
Unsuccessful Bid
log real GDP p/c 1950-2006, time- and country-fixed effect controls
Mean, with 90% Confidence IntervalOutput Effect of Summer Olympics

2
References
Alesina, A., and A. Drazen (1991) "Why are Stabilizations Delayed?" American Economic Review, 81, 1170‐1188.
Anderson, J. E., and E. Van Wincoop (2003) “Gravity with Gravitas: A Solution to the Border Puzzle" American Economic Review, 93(1), 170‐192.
Banerjee, A. (1992) “A Simple Model of Herd Behavior" The Quarterly Journal of Economics, 107(3), 797‐817. Bartolini, L., and A. Drazen (1997) “Capital‐Account Liberalization as a Signal" American Economic Review, 87(1), 138‐154. Becker, Sascha O. and Andrea Ichino (2002) “Estimation of Average Treatment Effects Based on Propensity Scores” The Stata Journal , 2(4), 358‐377. Coates, D. (2007) “Stadiums and Arenas: Economic Development or Economic Redistribution?" Contemporary Economic Policy, 25(4). Head, K., T. Mayer, and J. Ries (2010) “The Erosion of Colonial Trade Linkages After Independence” Journal of International Economics forthcoming. Humphreys, J. M., and M. K. Plummer (1995) “The Economic Impact of hosting the 1996 Summer Olympics" available at http://www.selig.uga.edu/forecast/olympics/OLYMTEXT.HTM. Krugman, P. (1998) “The Confidence Game" The New Republic.
Lucas, R. E. J. (2009) “Trade and the Diffusion of the Industrial Revolution," American Economic Journal: Macroeconomics, 1(1), 1‐25. Mukand, S. W. (2006) “Globalization and the 'Confidence Game'" Journal of International Economics, 70, 406‐427. Murphy, K. M., A. Shleifer, and R. W. Vishny (1989) “Industrialization and the Big Push" Journal of Political Economy, 97(5), 1003‐1026. Owen, J. G. (2005) “Estimating the Cost and Benefit of Hosting Olympic Games" The Industrial Geographer, 1(3), 1‐18. Preuss, H. (2004) The Economics of Staging the Olympics (Edward Elgar, Northampton). Wacziarg, R. and K.H. Welch (2008) “Trade Liberalization and Growth” World Bank Economic Review 22(2), 187‐231.

3
Endnotes
i Since we include both time‐ and country/dyad‐specific fixed effects, this can be viewed as a difference‐in‐differences estimator.
ii We have also estimated both separate and combined Winter and Summer Olympic effects; earlier versions of the paper contain the results. While the Winter effect is generally economically and statistically inconsequential, the combined Winter and Summer effect is quite similar to the effect associated with only the Summer games.
iii Still, support from the national authorities is now a prerequisite for a serious application.
iv P1 of Candidate Cities and Venues for the Winter Olympics available at http://multimedia.olympic.org/pdf/en\_report\_ 666.pdf
v We note in passing that there has been relatively little competition to host the World Cup, so that we are unable to plausibly compare hosts and unsuccessful candidates, as we do below for the Olympics.
vi The analogue event study for the natural logarithm of real GDP per capita (taken from the Penn World Table 6.3 with PPP‐adjustments, after controlling for fixed time‐ and country‐specific effects) is available in appendix Figure A1. It shows a slight and imprecisely estimated increase in real GDP per capita after a bid to host the summer games (even unsuccessful bids). However, so many factors affect real GDP which have not been accounted for in this figure (especially over such a long span of data), that it is hard to take much from this set of graphs.
vii The fundamentals of relevance for trade seem essentially unrelated to the characteristics of a good Olympic bid.
viii We focus our attention on the effects of mega‐events on trade rather than trade policy since the latter is difficult to measure. We have experimented with the Wacziarg‐Welch (2008) measure of trade liberalization, and find that it is positively (and often significantly) correlated with past Olympic hosting or candidacy, even after taking into account factors like country size and income time‐ and country‐effects controlling for. This result is quite consistent with the model we develop below. However, we do not consider this avenue of research to be worth pursuing until we have better empirical measures and models of trade liberalization. ix This technique will not work if an unobserved characteristic correlated with both bidding and openness remains.
x For computational reasons, we estimate our matching effects using only exports to developed countries.}
xi We assume that capital markets are open.
xii The induced capital inflows are only one example of the potential benefits that might result from sending a credible signal of the approaching liberalization. The signal may also induce additional domestic investment, or other types of cooperative behavior by domestic agents. xiii Bidding for the Olympics and not hosting them would be highly embarrassing and would adversely impact a nation's international reputation. These are infrequent, highly visible events with long lead times. We know of only one counter‐example; Denver backed out of hosting the winter games in 1976 when voters rejected a bond issue to finance the event. We also rule out signals by countries that have no chance of winning the rights to host the games as , the probability of winning hosting rights conditional on bidding, is common across countries.
xiv We assume that the probability of winning the bid is independent of national characteristics. This assumption could be relaxed if, for instance, the world “rewards” a country with a mega‐event for undertaking a liberalization that might be in the interests of both the country and the rest of the world, but hurts some domestic constituency.

4
xv The welfare function is specified in terms of earnings in each sector for simplicity. This function is assumed to encompass all proceeds in these sectors, including any redistribution of government tariff revenues and the effects of other trade distortions that yield differential valuations of domestic prices under closed and open policies.