the of in the to from Systems Sharon Cox, MT(ASCP)SC · and Automated Systems Sharon Cox,...
23
Achieving the Ideal of High Performance in the Core Lab: Leveraging Informatics to Get More from Workflow Redesign and Automated Systems Sharon Cox, MT(ASCP)SC Core Laboratory Supervisor Saint Francis Hospital Tulsa, OK EWC 2014 Saint Francis Hospital Laboratory
Transcript of the of in the to from Systems Sharon Cox, MT(ASCP)SC · and Automated Systems Sharon Cox,...

Achieving the Ideal of High Performance in the Core Lab: Leveraging Informatics to Get More from Workflow Redesign
and Automated Systems
Sharon Cox, MT(ASCP)SCCore Laboratory SupervisorSaint Francis HospitalTulsa, OK
EWC 2014
Saint Francis Hospital Laboratory

Achieving High Performance GrowthDiscussion Topics
• Creating a core laboratory using Lean methodology while experiencing high volume growth
• Continuous Improvement thru Project Selection and Management
• Leveraging Informatics to achieve Ideal Performance

Saint Francis Health System
• SNF•Home Health•Hospice•DME
Excellence • Dignity • Justice • Integrity • Stewardship
Saint Francis Health SystemAccredited Facilities
Saint Francis Urgent Care at Elm
Laureate Psychiatric Clinic and Hospital
Children’s Hospital at Saint Francis
Warren ClinicSaint Francis Hospital South
Saint Francis Heart Hospital
Saint Francis Hospital

Saint Francis Health SystemHealth Care Pressures

0
1 ,0 0 0 ,0 0 0
2 ,0 0 0 ,0 0 0
3 ,0 0 0 ,0 0 0
4 ,0 0 0 ,0 0 0
5 ,0 0 0 ,0 0 0
6 ,0 0 0 ,0 0 0
7 ,0 0 0 ,0 0 0
8 ,0 0 0 ,0 0 0
9 ,0 0 0 ,0 0 0
199519
9619
9719
9819
9920
0020
0120
0220
0320
0420
0520
0620
0720
0820
0920
10
Y e a r
No of Tests
0
2 5 0 ,0 0 0
5 0 0 ,0 0 0
7 5 0 ,0 0 0
1 ,0 0 0 ,0 0 0
1 ,2 5 0 ,0 0 0
1 ,5 0 0 ,0 0 0
1 ,7 5 0 ,0 0 0
2 ,0 0 0 ,0 0 0
Total Lab
or Hou
rs
R e p o r t a b le R e su lt sB i l le d T e s tT o t a l P a id H o u rs
R e p o r ta b le R e s u lt s
B i l le d T e s t
T o ta l P a id H o u r s
Eight‐Year SummaryVolume: 200% GrowthVolume: +5.4M TestsLabor: 25% Growth
Eight‐Year SummaryVolume: 200% GrowthVolume: +5.4M TestsLabor: 25% Growth
Saint Francis Volume by Year
Saint Francis HospitalSaint Francis – Process Improvement Journey
Analytical Improvement Informatics TrackProcess Improvement
Informatics and Hematology Expansion
Workflow and Process Improvement
• Utilize third party consultants • Drive operational efficiencies• The Dawn of Our Outreach Program
2001
2001
Front‐End Automation• Automate labor intensive operations • Improve employee morale• Automate sorting/routing of specimens
2002
2002
Consolidate Testing• Reduction of number of instruments • Start planning for future automation• Changes planned with database rolls
2003 – 2004
2003
/4
Integration of ARCHITECT Analyzers and Addition of CellDyn Sapphire Analyzers• Change Mindset of tech • Maximum return on investment• Online review of QC Paperless
2005 – 2006
2006
Middleware Implementation • Major effort from start to finish• Expanded auto‐verification criteria• Challenges training on new technology
2008
2008
Total Lab Automation • Project management drives success• 90 days start to go live• Leadership and accountability
2009
2009
Implementation of High Efficiency Hematology (HEH) and Other Informatics• Middleware connections to hematology, coagulation and urinalysis
• Migration of hematology and UA samples from APS to Pathfinder sample management system
2010
2010

St. Francis HospitalReportable Results/Laboratory Labor Hour
36.146.9
60.4 65.375.9
86.4
68.2 66.0 72.4
0.0
25.0
50.0
75.0
100.0
2002
2003
2004
2005
2006
2007
2008
2009
2010
No of Tests
139% increase in
labor utilizationover eight‐year period!
139% increase in
labor utilizationover eight‐year period!
Saint Francis HospitalSaint Francis – Stepwise Approach Results

Chemistry1,600 K+/day
Hematology1,400 CBC/day
Microbiology140 cans/day
Immunology6,400 ANA Abs/year
Blood Bank30,000 transfusions/year
Transplant/Donors50 cases per year
Pathology27,000 cases/year
Point‐of‐Care1,300 glucoses/day
Genetic800 cases/month
Outreach1,600 requisitions/day
Ranked #12 – Top U.S. Outreach Labs by Volume (g2reports.com)
Saint Francis Hospital LaboratoryDepartment Statistics
Volume8.8M Performed Tests99% In‐house Testing11% Stat Testing40% Outreach Testing267/76 Total Operations/Lab Med Tech FTE’sAverage Daily Workload1,700 Outreach Requisitions30,000 Results5,000 Specimens700 Hospital Blood DrawsSpace21,000 Laboratory (sq. ft.)12 Draw Stations

Saint Francis Hospital LaboratoryStriving for Continuous Improvement
Project Selection and Management• Identify Gaps or Areas for Improvement
• Impact on Process, Patient or Physician
• Options to Solve
• Technical Expertise Needed

Saint Francis Hospital LaboratoryStriving for Continuous Improvement
Project Selection and ManagementDate Added Tech Dept Issue/Problem Notes Pri Form Resp Person Needed Complete?
6/3/2010 JH Core Hepatitis testing move from Axsym to Architect Jay will email Charlotte the s/co ratios 1 Not needed PM/SA/CC Mar-12 Y6/3/2010 JH Core Iris Urinalysis Specs to Charlotte 10-11-10 1 SS/SA/CC Mar-12 Y6/9/2010 SC Core Installation of BioRad Unity Program SP upgrade needed - 10-20-11 2 PM/SA/SC Mar-12 Y
6/14/2010 DL STH/STW Ruby - Will do ULTICARE interface UltiCare quote $12,500 2 SS/SA/CC Mar-12 Y6/17/2010 JH Core Folate move from Axsym to Architect - ROLL NOT NEEDEFolates ready - waiting for Art 2 PM/SC/SA/CC Mar-12 Y6/17/2010 JH Core B12 move from Axsym to Architect B12 not released from Abbott yet 2 PM/SC/SA/CC Mar-12 Y6/23/2010 JH Core CA-125 and CA-15.3 Axsym to Architect Same as Folates 1 JH/SA/SC/CC Jan-138/24/2010 Immun Immunocap Interface After Ruby - Task for new IS position 1 Jun-12 Y10/8/2010 Immun New DSX Test - Cardiolipin Testing in progress 6-13-11 2 Completed SA/CC Mar-12 Y1/27/2011 Immun Immunology & Vitamin D Procedures through the track For centrifuging 3 Mar-12 Y1/28/2011 Immun Transition DSX result entry into Inst Mgr IM training prior to roll date 2 SA Mar-12 Y2/14/2011 Core Keppra - New Procedure for C8000 (with database roll) QA completed - Ready for DB roll 1 PM/SC/CC Mar-12 Y2/23/2011 Core Build AT III, Protein S, and Protein C in IM QA completed - Ready for DB roll 2 SS/CC Mar-12 Y
• Laboratory Project Selection
• Prioritization
• Accountability Assigned
• Ongoing Meetings to Monitor Success
Saint Francis Hospital LaboratoryLeveraging Informatics
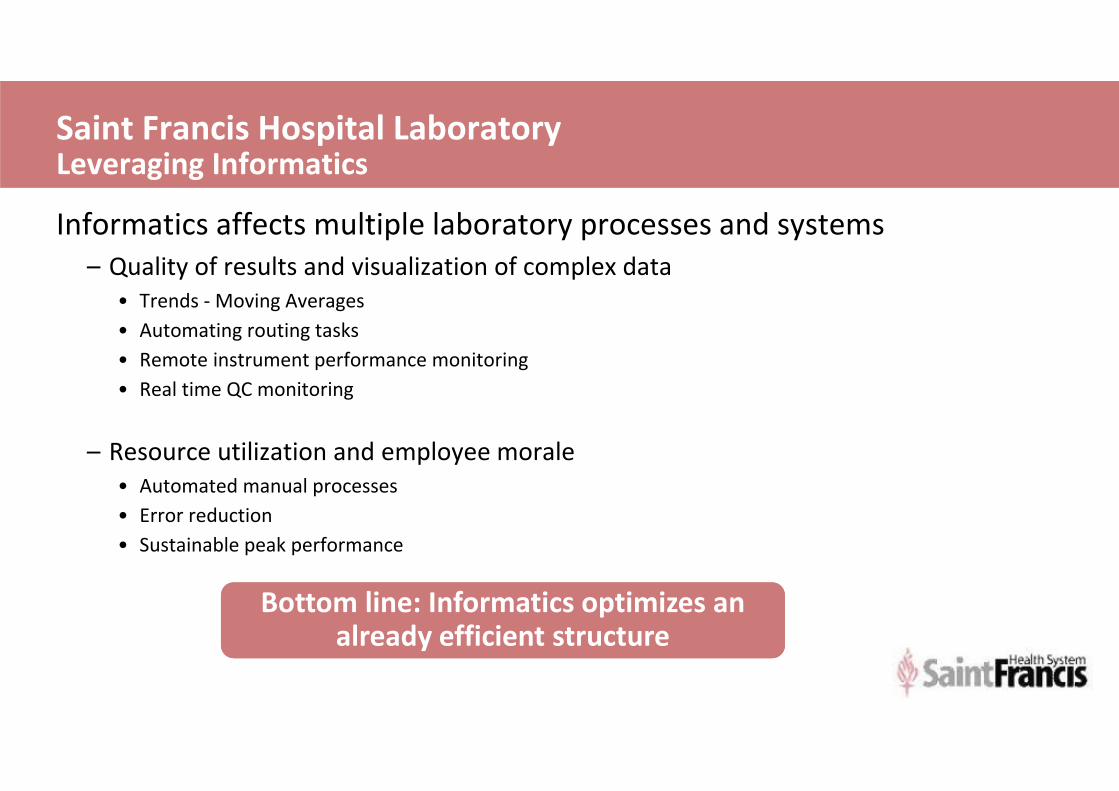
Informatics affects multiple laboratory processes and systems– Quality of results and visualization of complex data
• Trends ‐Moving Averages• Automating routing tasks• Remote instrument performance monitoring• Real time QC monitoring
– Resource utilization and employee morale• Automated manual processes• Error reduction• Sustainable peak performance
Bottom line: Informatics optimizes an already efficient structure
Bottom line: Informatics optimizes an already efficient structure

Saint Francis HospitalReal Time Monitoring of Quality Trends – Moving Averages
Visualizing trends to identify performance issues before they impact patient results

Outpatient Autoverification Rates*
*Data from March 2014 weekdays
Hematology
Immunochemistry
91.0%
85.0%
Saint Francis HospitalSaint Francis Results

Saint Francis HospitalSaint Francis STAT TAT Improvements
Total lab STAT TAT goal of 90% of core tests < 45 min - Achieved!
CBC, TnI, UA, PT, BMP,CMP
HEH Implementation
STAT Turn Around Time (TAT) Goal Compliance
*Data from April 2014 weekdays

Goal90% ED STAT orders
< 45 Minutes
Mean:94%
6 min45 min
UA Mean:98%
10 min45 min
CBC
Mean:98%
15 min45 minPT
Mean:96%
21 min45 minBMP
Mean:96%
23 min45 minCMP
TnI Mean:97%
25 min45 min
TAT Goal Achieved 100%
STAT ED Turn‐Around‐Time Performance*
*Data from March 2014
Saint Francis HospitalSaint Francis Results

Saint Francis HospitalAutomated QC Management – Unity Real Time
Analytes automatically disable if QC is not in range

Saint Francis HospitalQuality Results – Six Sigma Monitoring
Measurable Quality Results • Six Sigma Analysis
– All Assays above 3 Sigma– 68% World Class Performance – 96% Excellent Performance– Allows for QC Optimization
Test TEa Control Mean Units Bias % CV % Sigma Rules NOPSx NOPSy
Albumin 10% 2.70 g/dL 0.748 1.25 7.4 1:3s N=2 12.5 7.5Alk Phos 30% 101.25 U/L 4.662 2.10 12.1 1:3s N=2 7.0 15.5ALT 20% 97.595 U/L 7.935 1.45 8.3 1:3s N=2 7.3 39.7Amylase 30% 74.755 U/L -1.890 1.05 26.8 1:3s N=2 3.5 6.3AST 20% 35.385 U/L 4.288 1.65 9.5 1:3s N=2 8.3 21.4Bili D 20% 0.5 mg/dL 2.249 0.00 #DIV/0! 1:3s N=2 0.0 11.2Bili T 30.77 1.3 mg/dL 3.175 6.25 4.4 1:3s/2:2s N=2 0.2 0.1Calcium 8.29% 12.04 mg/dL -2.825 1.25 4.4 1:3s/2:2s N=2 15.1 34.1Chloride 5% 100.35 mmol/L 0.150 1.15 4.2 1:2.5s N=4 23.0 3.0Chol. 10% 247.95 mg/dL -0.161 0.90 9.7 1:3s N=2 9.0 1.6CK 30% 504.35 U/L 1.082 1.05 27.5 1:3s N=2 3.5 3.6CO2 20% 26.865 mmol/L -1.665 3.60 5.1 1:3s N=2 18.0 8.3Creatinine 37.20 0.8065 mg/dL -0.186 2.10 17.6 1:3s N=2 0.1 0.0GGT 30% 34.885 U/L -8.318 1.90 11.4 1:3s N=2 6.3 27.7Glucose 10% 84.165 mg/dL -0.872 1.25 7.3 1:3s N=2 12.5 8.7HDL 11.1% 84.455 mg/dL 1.150 2.05 4.9 1:3s N=2 18.5 10.4Lipase 30% 65.015 U/L 2.370 2.90 9.5 1:3s N=2 9.7 7.9Magnesium 25% 1.9 mg/dL -0.524 3.10 7.9 1:3s N=2 12.4 2.1Phosphorus 10.20% 3.005 mg/dL -1.151 2.35 3.9 1:3s/2:2s N=2 23.0 11.3Potassium 12.59 3.97 mmol/L 1.405 1.35 8.4 1:3s N=2 0.1 0.1Total Protien 10% 7.055 g/dL -0.494 0.75 12.7 1:3s N=2 7.5 4.9Sodium 3.25% 122.75 mmol/L 0.245 0.75 4.0 1:3s/2:2s/R:4/4:1s N=4 23.1 7.5Triglycerides 15% 213.2 mg/dL -0.814 1.50 9.5 1:3s N=2 10.0 5.4Urea (BUN) 9% 48.335 mg/dL -1.347 1.75 4.4 1:3s/2:2s N=2 19.4 15.0Uric Acid 17% 4.03 mg/dL -0.494 1.20 13.8 1:3s N=2 7.1 2.9
Total Number Percentage17 68%7 28%1 4%0 0%
Sigma Metric Analysis Of C16000 (c1600568) January-March 2013
Number of Sigma Values above ≥6.0Number of Sigma Values Between 5.9 - 4.0Number of Sigma Values above 3.9 - 3.0
Number of Sigma Values above ≤2.9

Saint Francis HospitalQuality Result Monitoring – Responding to ACA
Measurable Quality Results Next StepsCMS Scorecard Monitoring ‐ Dialysis
Scorecard Monitoring ‐MCHCManaging reimbursement activity
DIALYSISALBG ALBG‐%>3.6 CA FERR IPTH‐S IRON SAT PHOS HGB URR
10/7/2013 3.6 9.2 469.9 620.9 27.8 6.1 10.8 16.110/8/2013 3.6 9.0 93.1 410.9 27.8 5.9 10.8 15.811/4/2013 3.5 9.2 741.2 735.3 27.5 6.1 10.8 16.411/5/2013 3.6 9.0 455.3 668.7 26.2 5.8 11.0 14.712/2/2013 3.6 NA 9.0 791.5 542.5 28.6 6.3 10.8 16.312/3/2013 3.6 45.45% 9.0 590.8 507.4 31.0 6.0 11.1 17.11/6/2014 3.6 52.38% 9.2 178.9 708.2 26.4 6.0 11.3 13.21/7/2014 3.6 51.35% 9.3 74.9 433.8 26.7 5.4 11.2 13.42/3/2014 3.6 51.28% 9.1 N/A 768.4 30.3 6.2 11.1 16.62/4/2014 3.6 54.29% 9.1 N/A 458.3 24.2 5.7 11.0 16.73/3/2014 3.7 54.55% 9.1 737.1 NA 24.7 5.9 11.0 16.73/4/2014 3.6 39.39% 9.1 703.5 NA 23.3 6.0 11.3 16.14/7/2014 3.6 47.92% 8.9 423.5 NA 24.1 5.6 10.9 17.94/8/2014 3.5 45.95% 9.1 NA NA 28.1 5.3 10.8 17.2

Saint Francis HospitalQuality Results
Measurable Quality Results• Easy to use Custom Reports (ODBC)
– Daily CMP Reports to ensure instrument performance– Measure interlaboratory performance

Routine Median TAT
Saint Francis HospitalQuality Results with Dashboard
Measurable Quality Results• Dashboard
– Key quality indicators at a glance
STAT TAT % Compliance
STAT Median TAT

Saint Francis HospitalRemote Analyzer Monitoring
• Easy to access web portal
• Instrument error messages
• Maintenance performance
• QC and Calibration Failures

Saint Francis HospitalQuality Result Monitoring – Eco Friendly CoreLab
Calibration Monitoring
• QC and Cal Log Reports Available Through Abbott Link in uploaded file area
• Can be Stored externally in Laboratory Data Files
Paperless CoreLab!

Saint Francis Health SystemClinical Excellence
• Recipient of HealthGrades Distinguished Hospital Award for Clinical Excellence and Emergency Medicine Excellence– Only hospital in Oklahoma to earn the award in 2011, 2012 and 2013– One of only 269 hospitals in the country!– Top 5% of hospitals in the U.S. in emergency medicine
• Received the most “5 Star” ratings (12) in the state of Oklahoma in HealthGrades’ 2011 ratings
• Received PRC “5 Star” rating for Medical Staff Satisfaction for laboratory services
• Received PRC “5 Star” rating for Patient Satisfaction for inpatient care at Children’s Hospital and NICU
2011, 2012 and 2013 AwardsClinical and Emergency Excellence

THANK YOU!