The Oceanography Society | The Oceanography …...By Yiing Jang Yang, Sen Jan, Ming-Huei Chang, Joe...
11
CITATION Yang, Y.J., S. Jan, M.-H. Chang, J. Wang, V. Mensah, T.-H. Kuo, C.-J. Tsai, C.-Y. Lee, M. Andres, L.R. Centurioni, Y.-H. Tseng, W.-D. Liang, and J.-W. Lai. 2015. Mean structure and fluctuations of the Kuroshio East of Taiwan from in situ and remote observations. Oceanography 28(4):74–83, http://dx.doi.org/10.5670/oceanog.2015.83. DOI http://dx.doi.org/10.5670/oceanog.2015.83 COPYRIGHT This article has been published in Oceanography, Volume 28, Number 4, a quarterly journal of The Oceanography Society. Copyright 2015 by The Oceanography Society. All rights reserved. USAGE Permission is granted to copy this article for use in teaching and research. Republication, systematic reproduction, or collective redistribution of any portion of this article by photocopy machine, reposting, or other means is permitted only with the approval of The Oceanography Society. Send all correspondence to: [email protected] or The Oceanography Society, PO Box 1931, Rockville, MD 20849-1931, USA. O ceanography THE OFFICIAL MAGAZINE OF THE OCEANOGRAPHY SOCIETY DOWNLOADED FROM HTTP://TOS.ORG/OCEANOGRAPHY
Transcript of The Oceanography Society | The Oceanography …...By Yiing Jang Yang, Sen Jan, Ming-Huei Chang, Joe...
CITATION
Yang, Y.J., S. Jan, M.-H. Chang, J. Wang, V. Mensah, T.-H. Kuo, C.-J. Tsai, C.-Y. Lee,
M. Andres, L.R. Centurioni, Y.-H. Tseng, W.-D. Liang, and J.-W. Lai. 2015. Mean structure
and fluctuations of the Kuroshio East of Taiwan from in situ and remote observations.
Oceanography 28(4):74–83, http://dx.doi.org/10.5670/oceanog.2015.83.
DOI
http://dx.doi.org/10.5670/oceanog.2015.83
COPYRIGHT
This article has been published in Oceanography, Volume 28, Number 4, a quarterly
journal of The Oceanography Society. Copyright 2015 by The Oceanography Society.
All rights reserved.
USAGE
Permission is granted to copy this article for use in teaching and research.
Republication, systematic reproduction, or collective redistribution of any portion of
this article by photocopy machine, reposting, or other means is permitted only with the
approval of The Oceanography Society. Send all correspondence to: [email protected] or
The Oceanography Society, PO Box 1931, Rockville, MD 20849-1931, USA.
OceanographyTHE OFFICIAL MAGAZINE OF THE OCEANOGRAPHY SOCIETY
DOWNLOADED FROM HTTP://TOS.ORG/OCEANOGRAPHY

Oceanography | Vol.28, No.474
A NEW LOOK AT THE LOW-LATITUDE WESTERN PACIFIC
Mean Structure and Fluctuations of the Kuroshio East of Taiwan
from In Situ and Remote Observations
(background photo) R/V Ocean Researcher I (OR1 ) sailing in the Kuroshio east of Taiwan. (top left inset) The swift current of the Kuroshio causes a white “bubble line” on the sea surface after passing the wire con-necting the CTD. (bottom left inset) Recovered mooring with fish school surrounding the buoy. (right inset) A 45'' float with ADCP inside just popped up from 550 m depth to the sea surface. Photo credits: Sen Jan, Chen-Jia Lien, and Yiing Jang Yang
Oceanography | Vol.28, No.474
By Yiing Jang Yang, Sen Jan, Ming-Huei Chang, Joe Wang,
Vigan Mensah, Tien-Hsia Kuo, Cheng-Ju Tsai,
Chung-Yaung Lee, Magdalena Andres, Luca R. Centurioni,
Yu-Heng Tseng, Wen-Der Liang, and Jian-Wu Lai

Oceanography | December 2015 75
by impinging mesoscale eddies from the east. Using historical hydrography and recent velocity measurements obtained from Taiwan’s Ocean Data Bank (http://www.odb.ntu.edu.tw), Liang et al. (2003) and Rudnick et al. (2011) describe the cli-matological structure of the Kuroshio off the east coast of Taiwan. There have been no comprehensive, systematic obser-vations of the Kuroshio east of Taiwan since the WOCE PCM-1 observation period from 1996 to 1997; thus, progress in understanding the current in this area has been at a standstill since then.
It was not until the Observations of the Kuroshio Transports and their Variability (OKTV) program, sponsored by the Ministry of Science and Technology, Republic of China (Taiwan), from 2012 to 2015 (Jan et al., 2015), that multiple platforms observed the Kuroshio in detail along three zonal transects east of Taiwan (Figure 1). The OKTV program, in col-laboration with the US Office of Naval Research-sponsored Origins of Kuroshio and Mindanao Current (OKMC) pro-gram, aimed to measure the volume, heat, salt, and nutrient transports at the north-ern transect (Figure 1) and to quantify the flow pattern and hydrographic vari-ability of the Kuroshio east of Taiwan. Using OKTV-collected ship data, Jan et al. (2015) found that the Kuroshio
core transport ranged from 10.46 Sv to 22.92 Sv, the Kuroshio maximum veloc-ity was between 0.7 m s–1 and 1.4 m s–1, and the offshore distance of this max-imum velocity position varied greatly from 12 km to 103 km. The associ-ated heat transport referenced to 0°C was 0.838–1.793 × 10¹⁵ W, and the salt transport was 345.0–775.9 × 10⁶ kg s–1. Analysis of the Kuroshio water mass indi-cated dominance of South China Sea Tropical Water (SCSTW) on the onshore side (in the upper 250 m), Kuroshio Tropical Water (KTW) in the main stream, and West Philippine Sea Tropical Water (WPSTW) on the current’s off-shore flank. The intermediate waters have more complicated origins than do the tropical waters.
This study extends the work of Jan et al. (2015) by analyzing the extensive data set obtained from all of the observa-tional platforms during the OKTV pro-gram, and examining the time mean and standard deviation of the velocity and hydrographic structures along the three transects and the variations of water masses associated with the Kuroshio. We discuss the dynamic causes of Kuroshio variability, particularly mesoscale eddies and typhoons. To further evaluate the accuracy of high frequency (HF) radar observations and model simulations of the Kuroshio, HF radar observed surface currents and Kuroshio models are com-pared with directly measured velocities.
OBSERVATIONAL PLATFORMSThe OKTV program conducted repeated ship surveys and deployed moored instruments, drifters, and HF radars con-currently to observe the Kuroshio and its variability east of Taiwan. The ship-based survey included hydrographic measurements using conductivity- temperature-depth (CTD) sensors and velocity measurements using shipboard and lowered acoustic Doppler current profilers (Sb-ADCPs and LADCPs). The moored instruments included ADCPs and pressure-sensor-equipped inverted echo sounders (PIESs). The analyses of
INTRODUCTIONThe Kuroshio has substantial momen-tum and transports distinct water masses, heat, salt, and larval fish from east of the Philippines to southeast of Japan, greatly influencing regional oceanography, fish-eries, and climate along its route. Areas that will benefit from a fuller understand-ing of the Kuroshio range from fisher-ies management to climate and weather prediction. East of Taiwan, the Kuroshio is roughly midway through its 3,000 km journey from ~12°N to ~35°N in the western North Pacific. Knowledge of the mean state and variability of this section of the Kuroshio is crucial to delineating its downstream variability in the East China Sea and in waters south of Japan (Andres et al., 2015, in this issue).
Kuroshio formation takes place from Luzon Strait to the region northeast of Taiwan, and it becomes a relatively sta-ble current in the East China Sea (Nitani, 1972). Using two years of observations along the World Ocean Circulation Experiment (WOCE) PCM-1 line that runs from northeast of Taiwan to Ishigaki Island, Japan, Johns et al. (2001), Zhang et al. (2001), and Yang et al. (1999) con-cluded that the mean volume transport across PCM-1 was 21 Sv (1 Sv = 106 m3 s–1) with a variability of 10 Sv and strong 100-day fluctuations, presumably caused
ABSTRACT. The Kuroshio is important to climate, weather prediction, and fishery management along the northeast coast of Asia because it transports tremendous heat, salt, and energy from east of the Philippines to waters southeast of Japan. In the middle of its journey northward, the Kuroshio’s velocity mean and its variability east of Taiwan crucially affect its downstream variability. To improve understanding of the Kuroshio there, multiple platforms were used to collect intensive observations off Taiwan during the three-year Observations of the Kuroshio Transports and their Variability (OKTV) program (2012–2015). Mean Kuroshio velocity transects show two velocity maxima southeast of Taiwan, with the primary velocity core on the onshore side of the Kuroshio exhibiting a mean maximum velocity of ~1.2 m s–1. The two cores then merge and move at a single velocity maximum of ~1 m s–1 east of Taiwan. Standard deviations of both the directly measured poleward (v) and zonal (u) velocities are ~0.4 m s–1 in the Kuroshio main stream. Water mass exchange in the Kuroshio east of Taiwan was found to be complicated, as it includes water of Kuroshio origin, South China Sea Water, and West Philippine Sea Water, and it vitally affects heat, salt, and nutrient inputs to the East China Sea. Impinging eddies and typhoons are two of the principal causes of variability in the Kuroshio. This study’s models are more consistent with the observed Kuroshio than with high-frequency radar measurements.
Oceanography | Vol.28, No.476
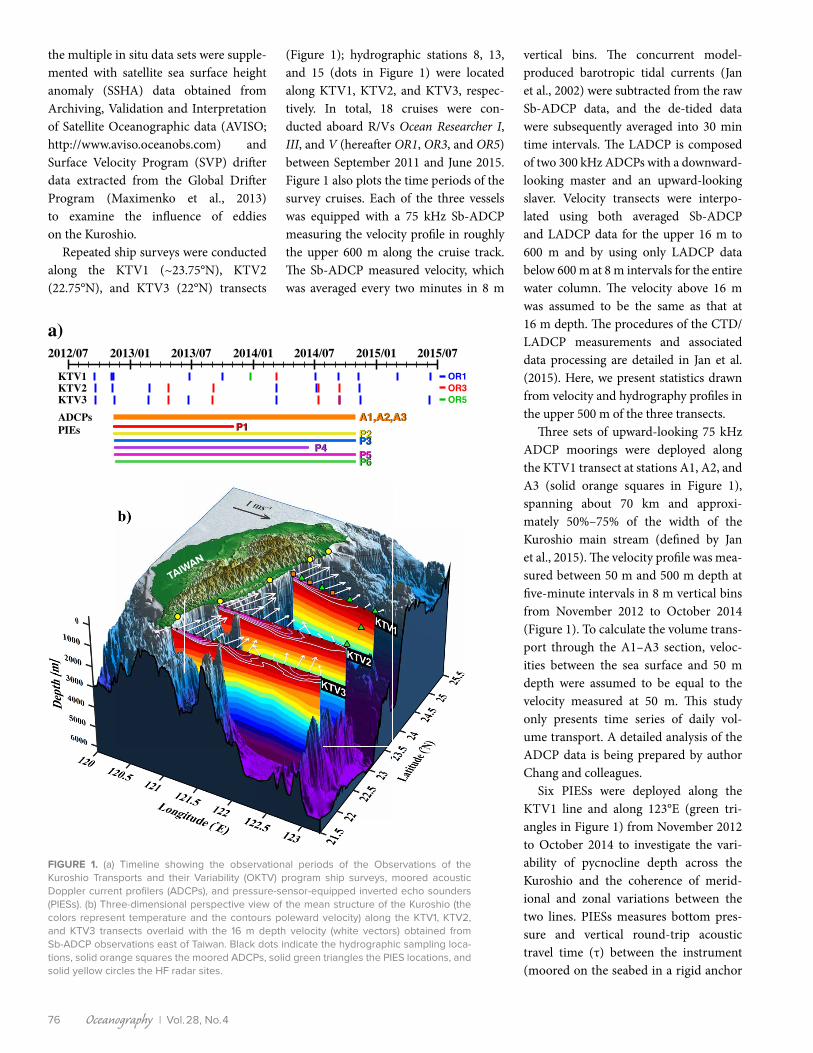
the multiple in situ data sets were supple-mented with satellite sea surface height anomaly (SSHA) data obtained from Archiving, Validation and Interpretation of Satellite Oceanographic data (AVISO; http://www.aviso.oceanobs.com) and Surface Velocity Program (SVP) drifter data extracted from the Global Drifter Program (Maximenko et al., 2013) to examine the influence of eddies on the Kuroshio.
Repeated ship surveys were conducted along the KTV1 (~23.75°N), KTV2 (22.75°N), and KTV3 (22°N) transects
(Figure 1); hydrographic stations 8, 13, and 15 (dots in Figure 1) were located along KTV1, KTV2, and KTV3, respec-tively. In total, 18 cruises were con-ducted aboard R/Vs Ocean Researcher I, III, and V (hereafter OR1, OR3, and OR5) between September 2011 and June 2015. Figure 1 also plots the time periods of the survey cruises. Each of the three vessels was equipped with a 75 kHz Sb-ADCP measuring the velocity profile in roughly the upper 600 m along the cruise track. The Sb-ADCP measured velocity, which was averaged every two minutes in 8 m
vertical bins. The concurrent model- produced barotropic tidal currents (Jan et al., 2002) were subtracted from the raw Sb-ADCP data, and the de-tided data were subsequently averaged into 30 min time intervals. The LADCP is composed of two 300 kHz ADCPs with a downward- looking master and an upward- looking slaver. Velocity transects were interpo-lated using both averaged Sb-ADCP and LADCP data for the upper 16 m to 600 m and by using only LADCP data below 600 m at 8 m intervals for the entire water column. The velocity above 16 m was assumed to be the same as that at 16 m depth. The procedures of the CTD/LADCP measurements and associated data processing are detailed in Jan et al. (2015). Here, we present statistics drawn from velocity and hydrography profiles in the upper 500 m of the three transects.
Three sets of upward-looking 75 kHz ADCP moorings were deployed along the KTV1 transect at stations A1, A2, and A3 (solid orange squares in Figure 1), spanning about 70 km and approxi-mately 50%–75% of the width of the Kuroshio main stream (defined by Jan et al., 2015). The velocity profile was mea-sured between 50 m and 500 m depth at five-minute intervals in 8 m vertical bins from November 2012 to October 2014 (Figure 1). To calculate the volume trans-port through the A1–A3 section, veloc-ities between the sea surface and 50 m depth were assumed to be equal to the velocity measured at 50 m. This study only presents time series of daily vol-ume transport. A detailed analysis of the ADCP data is being prepared by author Chang and colleagues.
Six PIESs were deployed along the KTV1 line and along 123°E (green tri-angles in Figure 1) from November 2012 to October 2014 to investigate the vari-ability of pycnocline depth across the Kuroshio and the coherence of merid-ional and zonal variations between the two lines. PIESs measures bottom pres-sure and vertical round-trip acoustic travel time (τ) between the instrument (moored on the seabed in a rigid anchor
2012/07 2013/01 2013/07 2014/01 2014/07 2015/01 2015/07
KTV1 OR1KTV2 OR3KTV3 OR5
ADCPs A1,A2,A3A1,A2,A3PIEs P1P1
P2P2P3P3P4P4P5P5P6P6
a)
FIGURE 1. (a) Timeline showing the observational periods of the Observations of the Kuroshio Transports and their Variability (OKTV) program ship surveys, moored acoustic Doppler current profilers (ADCPs), and pressure-sensor-equipped inverted echo sounders (PIESs). (b) Three-dimensional perspective view of the mean structure of the Kuroshio (the colors represent temperature and the contours poleward velocity) along the KTV1, KTV2, and KTV3 transects overlaid with the 16 m depth velocity (white vectors) obtained from Sb-ADCP observations east of Taiwan. Black dots indicate the hydrographic sampling loca-tions, solid orange squares the moored ADCPs, solid green triangles the PIES locations, and solid yellow circles the HF radar sites.
2012/07 2013/01 2013/07 2014/01 2014/07 2015/01 2015/07
KTV1 OR1KTV2 OR3KTV3 OR5
ADCPs A1,A2,A3A1,A2,A3PIEs P1P1
P2P2P3P3P4P4P5P5P6P6
a)
TAIWAN

Oceanography | December 2015 77
stand) and the overlying sea surface. The technology and applications of PIES are delineated in Rossby (1969), Watts and Rossby (1977), Watts et al. (2001), and Andres et al. (2008). In this study, 800 dbar was used as a reference level, and the PIES-measured τ at each site was converted to τ800. Then, τ’, the devia-tion of τ800 from its time mean, was con-verted to the pycnocline depth (dpyc) and used to measure the Kuroshio’s response to impinging eddies and typhoons at the PIES array. Details of the PIES observa-tions and associated data processing are described in Tsai et al. (2015).
Data acquired from six HF radar sites along the east coast of Taiwan (locations indicated by yellow circles in Figure 1) during 2013 were used to map the sea surface currents. The two northernmost radar sites are operated by the National Taiwan University/Naval Academy joint program, and the remaining four sites are operated by the Taiwan Ocean Research Institute. Each site was equipped with the coastal ocean dynamic application radar (CODAR) long-ranger model, with a practical spatial observation radius up to 220 km and horizontal resolution around 8 km in the radial direction and 2° in azimuth. CODAR signal processing is explained in Lipa et al. (2006). After subtracting the noise (from, e.g., iono-sphere effects and signals reflecting from artificial structures), we combined the radial velocities from the six radar sites to obtain the sea surface currents (u, v) east of Taiwan. To verify CODAR perfor-mance, these results were compared with the Sb-ADCP and SVP drifter obser-vations, and the averaged coefficient of determination (r2) was 0.74 (Fang et al., 2011; Lee, 2015).
TIMCOM MODELThe model simulation was based on the Taiwan Multi-scale Community Ocean Model (TIMCOM; Tseng et al., 2012; Young et al., 2012; Shen et al., 2014). The model domain covered the entire North Pacific Ocean from 30°S to 60°N and 100°E to 80°W. A dual-grid approach was
implemented so that 1/8° resolution was used in the domain west of 150°E, and 1/4° resolution was used in the domain east of 150°E. Further details on the model can be found in Tseng et al. (2012). A major difference in the setup used in this study was that the updated 30 arc sec General Bathymetric Chart of the Oceans (GEBCO) data (available at http://www.gebco.net) replaced the ETOPO2 bathymetry. The vertical resolution was linear-exponentially stretched by 26 lev-els in both the coarser and finer grids.
The 2013–2014 hindcast simulation was driven by the six-hourly 0.125° ERA-interim atmospheric reanalysis product (Dee et al., 2011). River runoff was based on an updated version of the Global River Flow and Continental Discharge Dataset (Dai and Trenberth, 2002; Dai et al., 2009). The simulated 2013 Kuroshio was analyzed and compared with observa-tions from OKTV.
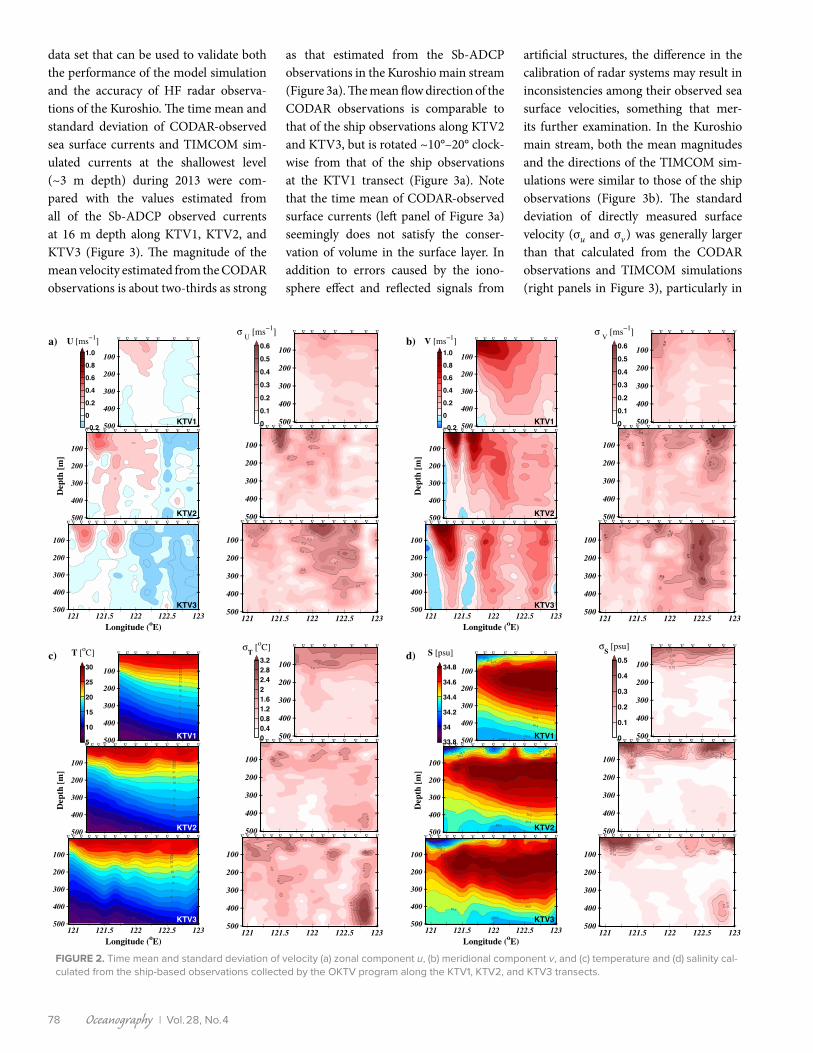
MEAN STATE AND VARIABILITY OF THE KUROSHIOFigure 2 illustrates the time mean and standard deviation of velocity (u, v), and temperature and salinity analyzed from ship survey data in the upper 500 m along the KTV1, KTV2, and KTV3 transects. The mean Kuroshio velocity transect (v) showed two velocity maxima on the KTV3 and KTV2 lines, with the Kuroshio’s pri-mary velocity core on the onshore side (Figure 2b). The mean maximum velocity was ~1.2 m s−1. Along KTV1, the mean velocity structure became a single veloc-ity maximum of ~1 m s−1 (Figure 2b). K.-C. Yang et al. (2015, in this issue) sug-gest two mechanisms that may cause the two velocity maxima (dual-core veloc-ity structure). One is the intrusion of the Kuroshio into the South China Sea (SCS) through Luzon Strait, which normally occurs during the northeast monsoon in winter. The other is the dissipation of westward-propagating anticyclonic eddies, which result in an offshore core along the Kuroshio’s east flank. The stan-dard deviation of the directly measured velocity (σv ) was ~0.4 m s−1, which is
about 33% of the mean maximum veloc-ity in the main stream of the Kuroshio. During the two-year observational period, seven mesoscale eddies were detected from the SSHA and PIES travel- time-derived pycnocline depth anomaly (Tsai et al., 2015). The larger standard devi-ation in the directly measured (u, v) near the eastern end of the KTV2 and KTV3 transects (122.5°E–122.8°E) is presum-ably affected by westward- propagating eddies impinging on the offshore (east-ern) side of the Kuroshio during the ship surveys. Figure 2a suggests that the mean zonal velocity (u) was about one- quarter of the mean poleward velocity along the three transects, with relatively large vari-ability (σu ~0.4 m s−1). The greatest vari-ability in u (σu > 0.6 m s−1) occurred along KTV2 immediately north of Green Island, which is located about 33 km off of Southeast Taiwan.
Isotherms are tilted upward toward the onshore flank of the Kuroshio (Figure 2c) as is typical for a hydrographic tran-sect of a geostrophic current. The geos-trophic current velocity estimated using OKTV CTD data and the thermal wind relation could be 6%–30% different from the directly measured velocity along the KTV1 transect (Jan et al., 2015). These differences mean that the directly mea-sured Kuroshio velocity has a sizable ageostrophic component. The standard deviation of temperature, σT, was 2°C in the upper 100 m of the KTV1 tran-sect. The highest σT, observed between 400 m and 500 m depth from 122.6°E to 122.9°E along the KTV3 line, was likely due to the influence of the same eddies that affected the velocity measurements (σu along KTV3 in Figure 2a). The mean salinity was fairly low (<34) in the upper 50 m on the onshore side of the Kuroshio (Figure 2d). The salinity maximum, indicating tropical waters, was located between 100 m and 200 m depth. The large variability in salinity with σS > 0.4 was mostly in the upper 50–100 m along the three transects (Figure 2d).
Observations collected by the OKTV program provide a new and invaluable
Oceanography | Vol.28, No.478
data set that can be used to validate both the performance of the model simulation and the accuracy of HF radar observa-tions of the Kuroshio. The time mean and standard deviation of CODAR-observed sea surface currents and TIMCOM sim-ulated currents at the shallowest level (~3 m depth) during 2013 were com-pared with the values estimated from all of the Sb-ADCP observed currents at 16 m depth along KTV1, KTV2, and KTV3 (Figure 3). The magnitude of the mean velocity estimated from the CODAR observations is about two-thirds as strong
as that estimated from the Sb-ADCP observations in the Kuroshio main stream (Figure 3a). The mean flow direction of the CODAR observations is comparable to that of the ship observations along KTV2 and KTV3, but is rotated ~10°–20° clock-wise from that of the ship observations at the KTV1 transect (Figure 3a). Note that the time mean of CODAR-observed surface currents (left panel of Figure 3a) seemingly does not satisfy the conser-vation of volume in the surface layer. In addition to errors caused by the iono-sphere effect and reflected signals from
artificial structures, the difference in the calibration of radar systems may result in inconsistencies among their observed sea surface velocities, something that mer-its further examination. In the Kuroshio main stream, both the mean magnitudes and the directions of the TIMCOM sim-ulations were similar to those of the ship observations (Figure 3b). The standard deviation of directly measured surface velocity (σu and σv) was generally larger than that calculated from the CODAR observations and TIMCOM simulations (right panels in Figure 3), particularly in
a)
KTV1
∇ ∇ ∇ ∇ ∇ ∇ ∇ ∇
−
−
−
−
−
−
−
−
−
−
500
400
300
200
100
Dep
th [m
]
KTV2
∇ ∇ ∇ ∇ ∇ ∇ ∇ ∇ ∇ ∇ ∇ ∇ ∇
−
−
−
−
−
−
−
−
−
−
500
400
300
200
100
Longitude (oE)
KTV3
∇ ∇ ∇ ∇ ∇ ∇ ∇ ∇ ∇ ∇ ∇ ∇ ∇ ∇ ∇
−
−
−
−
−
−
−
−
−
−
121 121.5 122 122.5 123500
400
300
200
100
U [ms−1]
−0.2
0
0.2
0.4
0.6
0.8
1.0
0.3
∇ ∇ ∇ ∇ ∇ ∇ ∇ ∇
−
−
−
−
−
−
−
−
−
−
500
400
300
200
100
0.30.3
0.3
0.3
0.30.40.4
0.50.6
∇ ∇ ∇ ∇ ∇ ∇ ∇ ∇ ∇ ∇ ∇ ∇ ∇
−
−
−
−
−
−
−
−
−
−
500
400
300
200
100
0.3
0.3 0.3
0.3
0.3
0.3
0.3
0.40.4
0.4
0.4
0.5
∇ ∇ ∇ ∇ ∇ ∇ ∇ ∇ ∇ ∇ ∇ ∇ ∇ ∇ ∇
−
−
−
−
−
−
−
−
−
−
121 121.5 122 122.5 123500
400
300
200
100
σ U [ms−1]
0
0.1
0.2
0.3
0.4
0.5
0.6 b)
KTV1
∇ ∇ ∇ ∇ ∇ ∇ ∇ ∇
−
−
−
−
−
−
−
−
−
−
500
400
300
200
100
Dep
th [m
]
KTV2
∇ ∇ ∇ ∇ ∇ ∇ ∇ ∇ ∇ ∇ ∇ ∇ ∇
−
−
−
−
−
−
−
−
−
−
500
400
300
200
100
Longitude (oE)
KTV3
∇ ∇ ∇ ∇ ∇ ∇ ∇ ∇ ∇ ∇ ∇ ∇ ∇ ∇ ∇
−
−
−
−
−
−
−
−
−
−
121 121.5 122 122.5 123500
400
300
200
100
V [ms−1]
−0.2
0
0.2
0.4
0.6
0.8
1.0
0.3
0.3
∇ ∇ ∇ ∇ ∇ ∇ ∇ ∇
−
−
−
−
−
−
−
−
−
−
500
400
300
200
100
0.3
0.3
0.30.30.3
0.4
0.4
0.40.5
0.6
∇ ∇ ∇ ∇ ∇ ∇ ∇ ∇ ∇ ∇ ∇ ∇ ∇
−
−
−
−
−
−
−
−
−
−
500
400
300
200
100
0.3
0.30.3
0.3
0.4
0.4
0.4
0.5
0.5
0.60.6
∇ ∇ ∇ ∇ ∇ ∇ ∇ ∇ ∇ ∇ ∇ ∇ ∇ ∇ ∇
−
−
−
−
−
−
−
−
−
−
121 121.5 122 122.5 123500
400
300
200
100
σ V [ms−1]
0
0.1
0.2
0.3
0.4
0.5
0.6
9 1011
12
131415
16
17
18
1920212223242526
27c)
KTV1
∇ ∇ ∇ ∇ ∇ ∇ ∇ ∇
−
−
−
−
−
−
−
−
−
−
500
400
300
200
100
9 1011 12
1314
15
16
17
18
19
20
2122232425 26
26 27
2728
Dep
th [m
]
KTV2
∇ ∇ ∇ ∇ ∇ ∇ ∇ ∇ ∇ ∇ ∇ ∇ ∇
−
−
−
−
−
−
−
−
−
−
500
400
300
200
100
9 910 11 12
131415
16
17
18
19202122232425
26
2728
Longitude (oE)
KTV3
∇ ∇ ∇ ∇ ∇ ∇ ∇ ∇ ∇ ∇ ∇ ∇ ∇ ∇ ∇
−
−
−
−
−
−
−
−
−
−
121 121.5 122 122.5 123500
400
300
200
100
T [oC]
5
10
15
20
25
30 1.6
2
2 2
∇ ∇ ∇ ∇ ∇ ∇ ∇ ∇
−
−
−
−
−
−
−
−
−
−
500
400
300
200
100
1.6
1.6
1.6
1.6
2
2
∇ ∇ ∇ ∇ ∇ ∇ ∇ ∇ ∇ ∇ ∇ ∇ ∇
−
−
−
−
−
−
−
−
−
−
500
400
300
200
100
1.6
1.6
1.6
1.6 1.6
1.6
1.6
2
2 2
2
222
2.4
2.8
3.2
∇ ∇ ∇ ∇ ∇ ∇ ∇ ∇ ∇ ∇ ∇ ∇ ∇ ∇ ∇
−
−
−
−
−
−
−
−
−
−
121 121.5 122 122.5 123500
400
300
200
100
σT [oC]
00.40.81.21.622.42.83.2 34.3
34.3
34.4
34.4
34.5
34.5
34.6
34.6
34.7
34.8
d)
KTV1
∇ ∇ ∇ ∇ ∇ ∇ ∇ ∇
−
−
−
−
−
−
−
−
−
−
500
400
300
200
100
34.334.3
34.3
34.434.4
34.4
34.534.5
34.5
34.634.6
34.6
34.7
34.8
Dep
th [m
]
KTV2
∇ ∇ ∇ ∇ ∇ ∇ ∇ ∇ ∇ ∇ ∇ ∇ ∇
−
−
−
−
−
−
−
−
−
−
500
400
300
200
100
3434.134.234.3
34.3
34.4
34.4
34.5
34.5
34.6
34.6
34.6
34.7
34.8
Longitude (oE)
KTV3
∇ ∇ ∇ ∇ ∇ ∇ ∇ ∇ ∇ ∇ ∇ ∇ ∇ ∇ ∇
−
−
−
−
−
−
−
−
−
−
121 121.5 122 122.5 123500
400
300
200
100
S [psu]
33.8
34
34.2
34.4
34.6
34.8 0.150.2
0.250.30.35∇ ∇ ∇ ∇ ∇ ∇ ∇ ∇
−
−
−
−
−
−
−
−
−
−
500
400
300
200
100
0.15
0.15
0.2
0.2
0.250.25
0.25
0.3
0.30.3 0.350.35 0.4
0.4 0.450.50.5
∇ ∇ ∇ ∇ ∇ ∇ ∇ ∇ ∇ ∇ ∇ ∇ ∇
−
−
−
−
−
−
−
−
−
−
500
400
300
200
100
0.150.15
0.15
0.20.2
0.2
0.2
0.25
0.250.30.35
0.40.450.5
∇ ∇ ∇ ∇ ∇ ∇ ∇ ∇ ∇ ∇ ∇ ∇ ∇ ∇ ∇
−
−
−
−
−
−
−
−
−
−
121 121.5 122 122.5 123500
400
300
200
100
σS [psu]
0
0.1
0.2
0.3
0.4
0.5
FIGURE 2. Time mean and standard deviation of velocity (a) zonal component u, (b) meridional component v, and (c) temperature and (d) salinity cal-culated from the ship-based observations collected by the OKTV program along the KTV1, KTV2, and KTV3 transects.

Oceanography | December 2015 79
the eastern half of the KTV2 and KTV3 lines. The lack of westward-propagating mesoscale eddies or appropriate eddy- Kuroshio interactions in the model may cause this model-data discrepancy. There are many other possible causes for the dif-ferences between measured and mod-eled velocities, including differences in observational methods, model grid res-olutions, and model parameterizations. The differences between the Sb-ADCP measured velocity and the CODAR mea-sured surface currents, particularly near the easternmost area of our survey, may be caused by attenuation of the reflected signals received by the HF radar at a remote distance. A detailed discussion on the causes of mismatches among different observational platforms or between the model-produced and the observed cur-rents is beyond the scope of this paper.
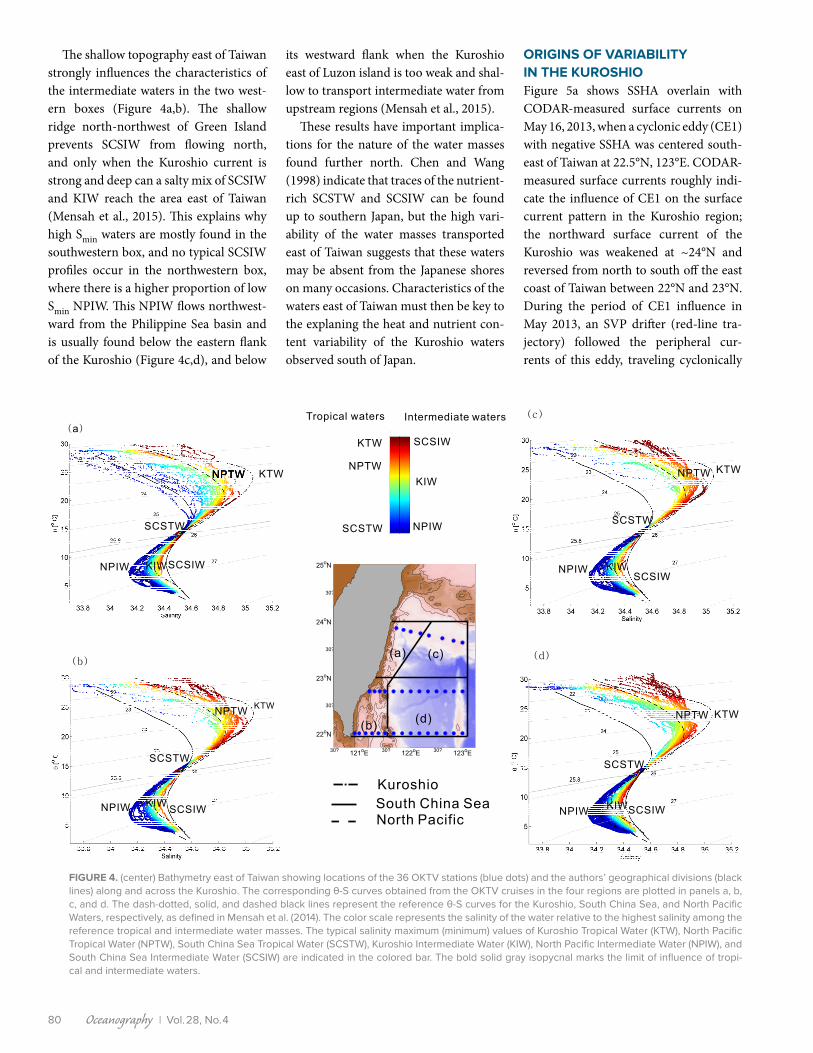
WATER MASSES ASSOCIATED WITH THE KUROSHIOThe hydrographic measurements from the 18 OKTV cruises provide a view of the complex distribution and interactions of water masses east of Taiwan. Here, we divide the region into southwestern, southeastern, northwestern, and north-eastern domains (Figure 4) to highlight the influence of the South China Sea water masses on the area west of the Kuroshio and the role of the shallow topogra-phy southeast of Taiwan. The potential temperature- salinity (θ-S) profiles of casts within all four domains were plotted sepa-rately over generic θ-S curves for Kuroshio Water, South China Sea Water, and North Pacific Water, as defined in Mensah et al. (2014). These waters can be classified as tropical and intermediate waters, with the 25.8 kg m−3 isopycnal marking their inter-faces (Figure 4). The tropical waters are distinguished by salinity maxima (Smax) at ~150 m depth (Rudnick et al., 2011), with values of 35.06, 34.85, and 34.60 for the KTW, NPTW, and SCSTW, respec-tively. The salinity minimum (Smin) typ-ical of the intermediate waters is found around 500 m to 600 m depth. Salinity minima for Kuroshio Intermediate
Water (KIW), North Pacific Intermediate Water (NPIW), and South China Sea Intermediate Water (SCSIW) are 34.31, 34.21, and 34.41, respectively.
Regarding the tropical waters, the two western boxes (Figure 4a,b) display the highest variability in water properties due to the presence of both SCSTW and NPTW/KTW. The existence of low Smax waters in these regions is explained by the advection of SCSTW along the west-ern flank of the Kuroshio (e.g., Mensah et al., 2014; Jan et al., 2015). Jan et al. (2015) demonstrate that the northward flow of SCSTW is intermittent east of Taiwan, and Mensah (2015) suggests that
westward Kuroshio intrusion in Luzon Strait is a likely factor for the reduction of the northward flow of SCSTW. The saltier Smax waters in the western boxes are likely variations of KTW, whose Smax decreased after encountering vigorous mixing in Luzon Strait and becoming more like NPTW (Mensah et al., 2014). The two eastern boxes (Figure 4c,d) display lower variability, with mostly high Smax waters present in these areas. Mesoscale eddies may advect saltier variations of NPTW (Jan et al., 2015), and some KTW may be transported northward without pass-ing through Luzon Strait, thus keeping its typical high Smax (Mensah, 2015).
FIGURE 3. Time mean and standard deviation of the surface current velocity from a year (2013) of (a) coastal ocean dynamic application radar (CODAR) observations, and (b) Taiwan Multi-scale Community Ocean Model (TIMCOM) simulations, overlain with time mean (left panels) and standard deviation (right panels) of all available ship-based ADCP observed currents at 16 m depth across the KTV1, KTV2, and KTV3 transects (blue arrows).
Oceanography | Vol.28, No.480
The shallow topography east of Taiwan strongly influences the characteristics of the intermediate waters in the two west-ern boxes (Figure 4a,b). The shallow ridge north-northwest of Green Island prevents SCSIW from flowing north, and only when the Kuroshio current is strong and deep can a salty mix of SCSIW and KIW reach the area east of Taiwan (Mensah et al., 2015). This explains why high Smin waters are mostly found in the southwestern box, and no typical SCSIW profiles occur in the northwestern box, where there is a higher proportion of low Smin NPIW. This NPIW flows northwest-ward from the Philippine Sea basin and is usually found below the eastern flank of the Kuroshio (Figure 4c,d), and below
its westward flank when the Kuroshio east of Luzon island is too weak and shal-low to transport intermediate water from upstream regions (Mensah et al., 2015).
These results have important implica-tions for the nature of the water masses found further north. Chen and Wang (1998) indicate that traces of the nutrient- rich SCSTW and SCSIW can be found up to southern Japan, but the high vari-ability of the water masses transported east of Taiwan suggests that these waters may be absent from the Japanese shores on many occasions. Characteristics of the waters east of Taiwan must then be key to the explaning the heat and nutrient con-tent variability of the Kuroshio waters observed south of Japan.
ORIGINS OF VARIABILITY IN THE KUROSHIOFigure 5a shows SSHA overlain with CODAR-measured surface currents on May 16, 2013, when a cyclonic eddy (CE1) with negative SSHA was centered south-east of Taiwan at 22.5°N, 123°E. CODAR-measured surface currents roughly indi-cate the influence of CE1 on the surface current pattern in the Kuroshio region; the northward surface current of the Kuroshio was weakened at ~24°N and reversed from north to south off the east coast of Taiwan between 22°N and 23°N. During the period of CE1 influence in May 2013, an SVP drifter (red-line tra-jectory) followed the peripheral cur-rents of this eddy, traveling cyclonically
( )aTropical waters Intermediate waters
KTW SCSIW
NPTW
KIW
SCSTW NPIW
( )c
( )b( )d
30?121
oE
30?122
oE
30?123
oE
22oN
30?
23oN
30?
24oN
30?
25oN
-2000
-2000
-2000
-1000
-1000
-1000
-1000
-1000
-1000
-1000
-500
-500
-500
-500
-500
-500
-500
-500
-500
(a) (c)
(b)(d)
Kuroshio
South China SeaNorth Pacific
KTWKTW
KTWKTW
SCSTW
SCSTWSCSTW
SCSTW
NPIW
NPIW NPIW
NPIW
KIW
KIW KIW
KIWSCSIW
SCSIW
SCSIW
SCSIW
NPTW NPTWNPTWNPTW
NPTW NPTW
FIGURE 4. (center) Bathymetry east of Taiwan showing locations of the 36 OKTV stations (blue dots) and the authors’ geographical divisions (black lines) along and across the Kuroshio. The corresponding θ-S curves obtained from the OKTV cruises in the four regions are plotted in panels a, b, c, and d. The dash-dotted, solid, and dashed black lines represent the reference θ-S curves for the Kuroshio, South China Sea, and North Pacific Waters, respectively, as defined in Mensah et al. (2014). The color scale represents the salinity of the water relative to the highest salinity among the reference tropical and intermediate water masses. The typical salinity maximum (minimum) values of Kuroshio Tropical Water (KTW), North Pacific Tropical Water (NPTW), South China Sea Tropical Water (SCSTW), Kuroshio Intermediate Water (KIW), North Pacific Intermediate Water (NPIW), and South China Sea Intermediate Water (SCSIW) are indicated in the colored bar. The bold solid gray isopycnal marks the limit of influence of tropi-cal and intermediate waters.

Oceanography | December 2015 81
from the southern tip of Taiwan and then further east.
Figure 5b shows the SSHA and CODAR measured surface currents on November 23, 2013, when another cyclonic eddy (CE2) was located south-east of Taiwan. Indeed, this negative SSHA system stalled in this region for three months (October–December 2013), and the velocity structure across the Kuroshio along the KTV1 transect was directly observed (Jan et al., 2015). The associated flow pattern was a large cyclonic Kuroshio meander east of Taiwan; Jan et al. (2015) discuss the underlying dynamics. A cor-responding SVP drifter trajectory (red-line trajectory in Figure 5b) crossed the Kuroshio main stream with the cyclonic currents of CE2, passing from the off-shore side of the Kuroshio to the east coast of Taiwan.
The influences of CE1 and CE2 were also recorded by the moored ADCP and PIES. The time series of pycnocline depth at the six PIESs in Figure 6b and the vol-ume transport calculated using the three ADCPs at A1, A2, and A3 in Figure 6c show the influence of these two cyclonic eddies. PIES observations suggest that a heaved thermocline associated with each eddy’s SSHA low (particularly on the offshore side of the current) as each arrived on the Kuroshio’s offshore edge. In addition, the transports across A1–A3 decreased from 12 Sv to 5 Sv due to each cyclonic eddy’s arrival (see a zoom-in for the variations of pycnocline depth and transport during CE1 in the inset above Figure 6b). The influence of impinging eddies on the SSHA and pycnocline depth across the Kuroshio is detailed in Tsai et al. (2015) using the PIES observations, and is thus not discussed here for brevity.
In addition to eddy influences on Kuroshio variability, typhoons may cause variations, possibly through wind- induced sea surface stress and wind-stress-curl-induced Ekman pumping at a time scale of two to three days. While the impacts of typhoons on the Kuroshio at the shelf break northeast of Taiwan have been widely studied (Chang et al., 2008;
Y.-L. Tsai et al., 2008, 2013; Morimoto et al., 2009), their impacts east of Taiwan are less well studied. The two years of observations from the PIES array east of Taiwan provide an opportunity to look into typhoon influence on the Kuroshio. Figure 6a shows eight typhoon tracks that may have affected the Kuroshio between the northern Luzon Strait and east of Taiwan during 2013 and 2014. Figure 6b shows time series of pycnocline depth (dpyc) from the six PIESs with the period when each typhoon was close to the PIES array, marked with gray vertical lines and the corresponding index num-ber of each typhoon at the top. A close-up of the response of pycnocline depth to, for example, Typhoon Sulik, in the inset above Figure 6b suggests that dpyc and transport decrease during the latter half of a typhoon’s influence. The typhoon- induced decrease in dpyc can be fur-ther classified into to “small” effects— possibly due to typhoons that passed far from the array (Typhoons 1, 3, 5, and 6; see Figure 6a), and “large” effects due to typhoons that passed closer to the array (Typhoons 2, 4, 7, and 8). Here, the dis-tance between a typhoon and PIESs was coarsely estimated from the shortest dis-tance between the typhoon track and the PIES array. Interestingly, the typhoon- induced decreases of dpyc do not appear to be related directly to the strength of the eight typhoons. The volume transport
calculated from the three ADCPs moored at A1, A2, and A3 decreased by about 2 Sv to 3 Sv during most of the eight typhoons with the exception of Typhoons 4 and 8, during which the transport appears to have increased. The difference in the change of the transport due to typhoon influence may result from the location of the typhoon tracks, which were northward for Typhoons 4 and 8 and are generally northwestward for the other six typhoons.
The observed decrease in dpyc was likely associated with either temperature or salinity (or both) decreases that typi-cally occur above the pycnocline during a typhoon passage. The direct influences of typhoons on the upper ocean include sea surface cooling due to the air-sea heat exchange, salinity decrease due to rain-fall, vertical mixing in the water mass due to wind-stress-induced stirring, and uplift of cool subsurface water due to wind-stress-curl-induced Ekman pump-ing in the upper 100 m. The combina-tion of these processes may be responsi-ble for the decrease in temperature and salinity in the upper layer of the Kuroshio, which increases (decreases) the acoustic travel time (pycnocline depth) obtained from PIES observation due to the depen-dence of sound speed on temperature and salinity. The changes in the temperature/salinity of the water column across the Kuroshio conceivably lead to variations in its (geostrophic) velocity structure, and,
FIGURE 5. Sea surface height anomaly and sea surface currents on (a) May 16 and (b) November 23, 2013. Red lines show the trajectories of the SVP drifters.
(a) (b)

Oceanography | Vol.28, No.482
in turn, in the volume transport. The dynamics responsible for the typhoon-induced decrease in pycnocline depth and associated short-term variability in the Kuroshio merit more detailed inves-tigation in the future.
CONCLUSIONThis study investigated the mean structure and variability of the Kuroshio east of Taiwan primarily based on a new data set obtained from comprehensive field observations using multi-ple platforms during the OKTV program between September
18
117oE 120
oE 123
oE 126
oE 129
oE
18oN
20oN
22oN
24oN
26oN
28oN
1
1
1
1
1
2
2
2
2
2
3
3 3 3
3
3
3
3
3
33
4
4
4
4
4
4
4
4
4
5
5
5
5
5
5
5
5
6
6
6
6
6
7
7
7
7
7
8
8
8
8
8
8
8
8
P1P2
P3
P4
P5
P6
LEEPI
SOULIK
TRAMI
KONG−REY
USAGI
FITOW
MATMO
FUNG−WONG
N D J F M A M J J A S O N D J F M A M J J A S O N
5
10
15
Tra
nsp
ort
[S
v]
100
200
300
400
dpyc
[m]
87
2012 2013 2014
CE25634CE1 21
P2
P3P4P5P6
04071013 1604071013 16
5
7
9
11
13
15
Tra
nsport
[S
v]
28 03 08 13 18 23 28 02
150
200
250
300
350
400
450
28 03 08 13 18 23 28 02
dpyc
[m]
P1
c)
(a)
(b)
(
FIGURE 6. (a) Typhoon tracks that passed near the KTV1 transect during November 2012 and November 2014. (b) Time series of pycnocline depth (dpyc) derived from PIES travel time anomalies (τ’) referenced to 800 dbar depth. (c) Daily volume transport across moored ADCP stations A1–A3, rep-resenting 50% to 75% of the total Kuroshio core transport defined by Jan et al. (2015). The numbers above the upper frame of panel (b) mark the periods of influence of the eight typhoons listed in the upper-left inset in panel (a). CE1 and CE2 indicate the two cyclonic mesoscale eddies that affected the Kuroshio in May 2013 and November 2013, respectively. The two insets above (b) show a close-up of CE1 and Typhoon Soulik influ-ences on pycnocline depth at each of the PIES stations in (b) and volume transport in (c).
2012 and June 2015. The mean Kuroshio velocity transects showed two velocity maxima along the KTV3 and KTV2 tran-sects, with the primary velocity core on the onshore side of the Kuroshio. The mean maximum velocity was ~1.2 m s−1. The mean velocity structure became a single velocity maximum of ~1 m s−1 along the KTV1 transect. The standard deviation of the directly measured poleward velocity (v) was ~0.4 m s−1 in the Kuroshio main stream. The mean zonal velocity (u) was about one-quarter of the mean poleward velocity along the three transects, with relatively large variability (stan-dard deviation σu ~ 0.4 m s−1). The largest variability in u (σu > 0.6 m s−1) occurred along the KTV2 transect immedi-ately north of Green Island.
The water masses associated with the Kuroshio con-sist of tropical and intermediate waters that originate from the upstream Kuroshio, the South China Sea, and the North Pacific. In the tropical water layer, SCSTW was found mostly on the western side of the Kuroshio, whereas a strongly mixed KTW and NPTW layer was typically found further east. The pronounced variability in tropical waters found on the eastern side of the Kuroshio is likely due to the current’s varying paths and to impinging mesoscale eddies. Topography plays a sig-nificant role in the circulation and distribution of the deeper waters in the intermediate water layer. Waters of South China Sea and Kuroshio origin are mostly found southeast of Taiwan, up to Green Island. The shallow ridge between the Taiwan coast and Green Island prevents some of the intermediate water from flowing further north, and KIW is found upstream of I-Lan Ridge only when the Kuroshio is strong enough to carry it there. As a result, NPIW was the dominant water mass observed east of Taiwan beyond 23°N.
CODAR, PIES, and ADCP observations supplemented with satellite SSHA and SVP drifter trajectories facilitated the analysis of Kuroshio variability induced by impinging eddies and typhoons. Two cyclonic eddies that impinged on the Kuroshio caused cyclonically moving surface currents in the Kuroshio observed by CODAR and SVP drifters, an increase of acoustic travel time anomalies observed by PIESs due to eddy-induced isopycnal uplift in the upper water col-umn, and a decrease in the volume transport through ADCP mooring sites A1–A3. Typhoons may cause the increases in the acoustic travel time anomaly recorded at the six PIES sta-tions. Transport across the A1–A3 transect decreased during six of eight typhoons that traveled approximately southeast to the northwest in the region. In contrast, transport increased during two northward-moving typhoons.
The unprecedented in situ data set obtained from the OKTV program, augmented by observations from the OKMC Program, is not only crucial for detailed evalua-tion of Kuroshio variability east of Taiwan but also is use-ful for validating numerical simulations and surface currents measured by HF radar.
Oceanography | December 2015 83
REFERENCESAndres, M., S. Jan, T.B. Sanford, V. Mensah,
L.R. Centurioni, and J.W. Book. 2015. Mean structure and variability of the Kuroshio from northeastern Taiwan to southwestern Japan. Oceanography 28(4):84–95, http://dx.doi.org/ 10.5670/oceanog.2015.84.
Andres, M., M. Wimbush, J.-H. Park, K.-I. Chang, B.-H. Lim, D.R. Watts, H. Ichikawa, and W.J. Teague. 2008. Observations of Kuroshio flow variations in the East China Sea. Journal of Geophysical Research 113, C05013, http://dx.doi.org/ 10.1029/2007JC004200.
Chang, Y., H.-T. Liao, M.-A. Lee, J.-W. Chan, W.-J. Shieh, K.-T. Lee, G.-H. Wang, and Y.-C. Lan. 2008. Multisatellite observation on upwelling after the passage of Typhoon Hai-Tang in the southern East China Sea. Geophysical Research Letters 35, L03612, http://dx.doi.org/10.1029/2007GL032858.
Chen, C.T.A., and S.L. Wang. 1998. Influence of inter-mediate water in the western Okinawa Trough by the outflow from the South China Sea. Journal of Geophysical Research 103:12,683–12,688, http://dx.doi.org/10.1029/98JC00366.
Dai, A., T. Qian, K.E. Trenberth, and J.D. Milliman. 2009. Changes in continental freshwater discharge from 1948 –2004. Journal of Climate 22:2,773–2,792, http://dx.doi.org/ 10.1175/2008JCLI2592.1.
Dai, A., and K.E. Trenberth. 2002. Estimates of freshwater discharge from conti-nents: Latitudinal and seasonal variations. Journal of Hydrometeorology 3:660–687, http://dx.doi.org/10.1175/1525-7541(2002)003 <0660:EOFDFC>2.0.CO;2.
Dee, D.P., S.M. Uppala, A.J. Simmons, P. Berrisford, P. Poli, S. Kobayashi, U. Andrae, M.A. Balmaseda, G. Balsamo, P. Bauer, and others. 2011. The ERA-Interim reanalysis: Configuration and performance of the data assimilation system. Quarterly Journal of the Royal Meteorological Society 137:553–597, http://dx.doi.org/10.1002/qj.828.
Fang, Y.C., J. Wang, Y.J. Yang, J.C. Mau, K.H. Thia, and M.J. Huang. 2011. Preliminary results of CODAR surface current observations northeast of Taiwan. Pp. 59–77 in Proceedings of the 2011 International Workshop on Operating System for Marine Environment Monitoring and Forecasting. Kaohsiung, Taiwan.
Jan, S., C.-S. Chern, and J. Wang. 2002. Transition of tidal waves from the East to South China Seas over the Taiwan Strait: Influence of the abrupt step in the topography. Journal of Oceanography 28:837–850, http://dx.doi.org/ 10.1023/A:1022827330693.
Jan, S., Y.J. Yang, J. Wang, V. Mensah, T.-H. Kuo, M.-D. Chiou, C.-S. Chern, M.-H. Chang, and H. Chien. 2015. Large variability of the Kuroshio at 23.75°N east of Taiwan. Journal of Geophysical Research 120:1,825–1,840, http://dx.doi.org/ 10.1002/2014JC010614.
Johns, W.E., T.N. Lee, D. Zhang, R. Zantopp, C.-T. Liu, and Y. Yang. 2001. The Kuroshio east of Taiwan: Moored transport observa-tions from the WOCE PCM-1 array. Journal of Physical Oceanography 31:1,031–1,053, http://dx.doi.org/10.1175/1520-0485(2001)031 <1031:TKEOTM>2.0.CO;2.
Lee, C.-Y. 2015. Observation of surface currents using HF radar off the east coast of Taiwan: Data quality control and preliminary results. Master’s Dissertation, National Taiwan University, Taipei, Taiwan.
Liang, W.-D., T.Y. Tang, Y.J. Yang, M.T. Ko, and W.-S. Chuang. 2003. Upper-ocean currents around Taiwan. Deep Sea Research Part II 50:1,085–1,105, http://dx.doi.org/10.1016/S0967-0645(03)00011-0.
Lipa, B.J., B. Nyden, D.S. Ullman, and E. Terrill. 2006. SeaSonde radial velocities: Derivation and internal consistency. IEEE Journal of Oceanic Engineering 31:850–861, http://dx.doi.org/10.1109/JOE.2006.886104.
Maximenko, N., R. Lumpkin, and L. Centurioni. Ocean surface circulation. Pp. 283–304 in Ocean Circulation and Climate: A 21st Century Perspective. G. Siedler, S.M. Griffies, J. Gould, and J.A. Church, eds, Academy Press, Oxford, UK.
Mensah, V. 2015. Evolution of the water masses associated with the Kuroshio from Luzon Strait to east of Taiwan. PhD Dissertation, National Taiwan University, Taipei, Taiwan.
Mensah, V., S. Jan, M.-H. Chang, and Y.-J. Yang. 2015. Intraseasonal to seasonal variability of the intermediate waters along the Kuroshio path east of Taiwan. Journal of Geophysical Research 120:5,473–5,489, http://dx.doi.org/ 10.1002/2015JC010768.
Mensah, V., S. Jan, M.-D. Chiou, T.-H. Kuo, and R.-C. Lien. 2014. Evolution of the Kuroshio Tropical Water from the Luzon Strait to the east of Taiwan. Deep Sea Research Part I 86:68–81, http://dx.doi.org/10.1016/j.dsr.2014.01.005.
Morimoto, A., S. Kojima, S. Jan, and D. Takahashi. 2009. Movement of the Kuroshio axis to the northeast shelf of Taiwan during typhoon events. Estuarine, Coastal and Shelf Science 82:547–552, http://dx.doi.org/10.1016/j.ecss.2009.02.022.
Nitani, H. 1972. Beginning of the Kuroshio. Pp. 129–163 in Kuroshio: Its Physical Aspects. H. Stommel and K. Yoshida, eds, University of Tokyo Press, Tokyo, Japan.
Rudnick, D.L., S. Jan, L. Centurioni, C.M. Lee, R.-C. Lien, J. Wang, D.-K. Lee, R.-S. Tseng, Y.Y. Kim, and C.-S. Chern. 2011. Seasonal and meso-scale variability of the Kuroshio near its ori-gin. Oceanography 24:52–63, http://dx.doi.org/ 10.5670/oceanog.2011.94.
Rossby, T. 1969. On monitoring depth variations of the main thermocline acoustically. Journal of Geophysical Research 74:5,542–5,546, http://dx.doi.org/10.1029/JC074i023p05542.
Shen, M.-L., Y.-H. Tseng, S. Jan, C.-C. Young, and M.-D. Chiou. 2014. Long-term variability of the Kuroshio transport east of Taiwan and the climate it conveys. Progress in Oceanography 121:60–73, http://dx.doi.org/10.1016/j.pocean.2013.10.009.
Tsai, C.-J., M. Andres, S. Jan, V. Mensah, T. Sanford, R.-C. Lien, and C. Lee. 2015. Eddy-Kuroshio inter-action processes revealed by mooring obser-vations off Taiwan and Luzon. Geophysical Research Letters 42:8,098–8,105, http://dx.doi.org/ 10.1002/2015GL065814.
Tsai, Y.-L., C.-S. Chern, S. Jan, and J. Wang. 2013. Numerical study of cold dome variability induced by Typhoon Morakot (2009) off northeastern Taiwan. Journal of Marine Research 71:109–132, http://dx.doi.org/10.1357/002224013807343434.
Tsai, Y.-L., C.-S. Chern, and J. Wang. 2008. Typhoon induced upper ocean cooling off northeastern Taiwan. Geophysical Research Letters 35, L14605, http://dx.doi.org/10.1029/2008GL034368.
Tseng, Y.H., M.L. Shen, S. Jan, D.E. Dietrich, and C.P. Chiang. 2012. Validation of the Kuroshio current system in the dual-domain Pacific Ocean model framework. Progress in Oceanography 105:102–124, http://10.1016/ j.pocean.2012.04.003.
Watts, D.R., and H.T. Rossby. 1977. Measuring dynamic heights with inverted echo sound-ers: Results from MODE. Journal of Physical Oceanography 7:345–358, http://dx.doi.org/10.1175/1520-0485(1977)007 <0345:MDHWIE>2.0.CO;2.
Watts, D.R., C. Sun, and S. Rintoul. 2001. A two- dimensional gravest empirical mode deter-mined from hydrographic observations in the Subantarctic Front. Journal of Physical Oceanography 31:2,186–2,209, http://dx.doi.org/ 10.1175/1520-0485(2001)031 <2186:ATDGEM> 2.0.CO;2.
Yang, K.-C., J. Wang, C.M. Lee, B. Ma, R.-C. Lien, S. Jan, Y.J. Yang, and M.-H. Chang. 2015. Two mechanisms cause dual
velocity maxima in the Kuroshio east of Taiwan. Oceanography 28(4):64–73, http://dx.doi.org/ 10.5670/oceanog.2015.82.
Yang, Y., C.-T. Liu, J.-H. Hu, and M. Koga. 1999. Taiwan current (Kuroshio) and impinging eddies. Journal of Oceanography 55:609–617, http://dx.doi.org/ 10.1023/A:1007892819134.
Young, C.-C., Y.-H. Tseng, M.-L. Shen, Y.-C. Liang, M.-H. Chien, and C.-H. Chien. 2012. Software devel-opment of the TaIwan Multi-scale Community Ocean Model (TIMCOM). Environmental Modelling and Software 38:214–219, http://dx.doi.org/10.1016/ j.envsoft.2012.05.017.
Zhang, D., W.E. Johns, T.N. Lee, C.-T. Liu, and R. Zantopp. 2001. The Kuroshio east of Taiwan: Modes of variability and relationship to inte-rior meso-scale eddies. Journal of Physical Oceanography 31:1,054–1,074, http://dx.doi.org/ 10.1175/1520-0485(2001)031<1054:TKEOTM> 2.0.CO;2.
ACKNOWLEDGMENTSThis study was sponsored by the Ministry of Science and Technology (MOST) of the ROC (Taiwan) under grants NSC 101-2611-M-002-018-MY3, NSC 101-2611-M-019-002, NSC 102-2611-M-002-017, NSC 102-2611-M-019-012, MOST 103-2611-M-002-014, and MOST 103-2611-M-002-018. MA was sponsored by the US Office of Naval Research under grant N00014-12-1-0445. YHT was supported by NSF Earth System Model (EaSM) Grant 1419292. The MOST Ocean Data Bank provided the historical CTD and Sb-ADCP data. Taiwan Ocean Research Institute provided HF radar observed surface current velocities. The SVP drifter trajectory data were downloaded from the GDP Drifter Data Assembly Center (http://www.aoml.noaa.gov/phod/dac/dacdata.php). The sat-ellite sea surface height data were obtained from AVISO (http://www.aviso.oceanobs.com/ducas). The authors would like to thank technicians W.-H. Ho, W.-H. Lee, H.-C. Hsieh, and B. Wang of the Institute of Oceanography, National Taiwan University, for work-ing tirelessly during OKTV field program. The assis-tance of the captains and the crew members of R/Vs OR1, OR3, and OR5 is greatly appreciated.
AUTHORSYiing Jang Yang ([email protected]) is Associate Professor, Sen Jan is Professor, Ming-Huei Chang is Assistant Professor, Joe Wang is Professor, Vigan Mensah is Postdoctoral Researcher, Tien-Hsia Kuo is Ocean Data Bank Member, Cheng-Ju Tsai is Research Assistant, and Chung-Yaung Lee is Research Assistant, all at the Institute of Oceanography, National Taiwan University, Taipei, Taiwan. Magdalena Andres is Associate Scientist, Woods Hole Oceanographic Institution, Woods Hole, MA, USA. Luca R. Centurioni is Associate Researcher, Scripps Institution of Oceanography, University of California, San Diego, La Jolla, CA, USA. Yu-Heng Tseng is Project Scientist,
National Center for Atmospheric Research, Boulder, CO, USA. Wen-Der Liang is Associate Professor, Department of Marine Science, Naval Academy, Kaohsiung, Taiwan. Jian-Wu Lai is Research Fellow, Taiwan Ocean Research Institute, National Applied Research Laboratories, Kaohsiung, Taiwan.
ARTICLE CITATIONYang, Y.J., S. Jan, M.-H. Chang, J. Wang, V. Mensah, T.-H. Kuo, C.-J. Tsai, C.-Y. Lee, M. Andres, L.R. Centurioni, Y.-H. Tseng, W.-D. Liang, and J.-W. Lai. 2015. Mean structure and fluctuations of the Kuroshio East of Taiwan from in situ and remote observations. Oceanography 28(4):74–83, http://dx.doi.org/10.5670/oceanog.2015.83.