THE OBJECTIVE FUNCTION OF GOVERNMENT-CONTROLLED … · THE OBJECTIVE FUNCTION OF...
31
THE OBJECTIVE FUNCTION OF GOVERNMENT-CONTROLLED BANKS IN A FINANCIAL CRISIS AJRC and HIAS joint conference March 21, 2016 Crawford School of Public Policy Australian National University Yoshiaki Ogura School of Political Science and Economics Waseda University 1
Transcript of THE OBJECTIVE FUNCTION OF GOVERNMENT-CONTROLLED … · THE OBJECTIVE FUNCTION OF...

THE OBJECTIVE FUNCTION OF GOVERNMENT-CONTROLLED BANKS IN A FINANCIAL CRISIS
AJRC and HIAS joint conference
March 21, 2016
Crawford School of Public Policy
Australian National University
Yoshiaki Ogura
School of Political Science and Economics
Waseda University
1

Japanese exporters were severely damaged by the financial crisis in early 2009 ⇒Increased cash holding
2
(source) Author’s calculation with the loan book data of the Small and Medium Enterprise Unit, Japan Finance Corporation. Aggregated the value in the accounting period ending each calendar year.
0
20
40
60
80
100
120
140
2007 2008 2009 2010 2011
(a) EBITDA/asset (2007:100)
construction mfg(elec.) mfg(other)
mfg (trans. eq.) retail service
wholesale
95
100
105
110
115
120
125
130
2007 2008 2009 2010 2011
(b) cash/asset (2007:100)
construction mfg(elec.)
mfg(other) mfg (trans. eq.)
retail service
wholesale
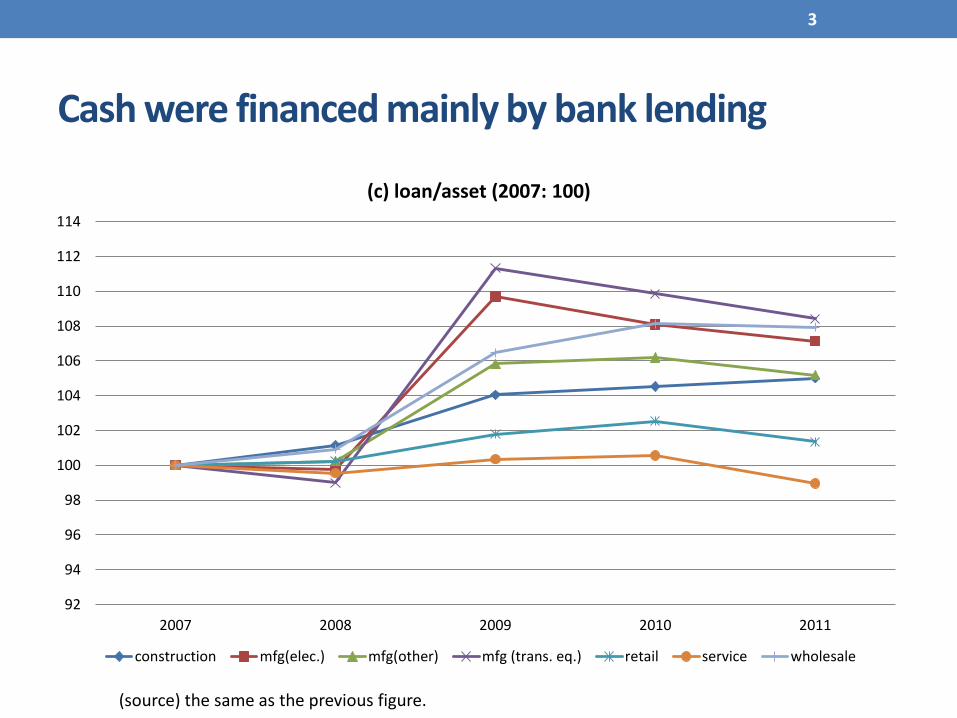
Cash were financed mainly by bank lending
3
(source) the same as the previous figure.
92
94
96
98
100
102
104
106
108
110
112
114
2007 2008 2009 2010 2011
(c) loan/asset (2007: 100)
construction mfg(elec.) mfg(other) mfg (trans. eq.) retail service wholesale

4
(source) Senior Loan Officer Opinion Survey on Bank Lending Practices at Large
Japanese Banks, Bank of Japan
-30
-20
-10
0
10
20
30
40
50
60
2001 2002 2003 2004 2005 2006 2007 2008 2009 2010 2011 2012 2013 2014
Fund Demand DI (bank loan)(ratio of “increase”) + (ratio of “increase somewhat”) /2 -(ratio of
“decrease”) - (ratio of “somewhat decrease”/2), in the last 3 months, %
large firms medium-sized firms small firms
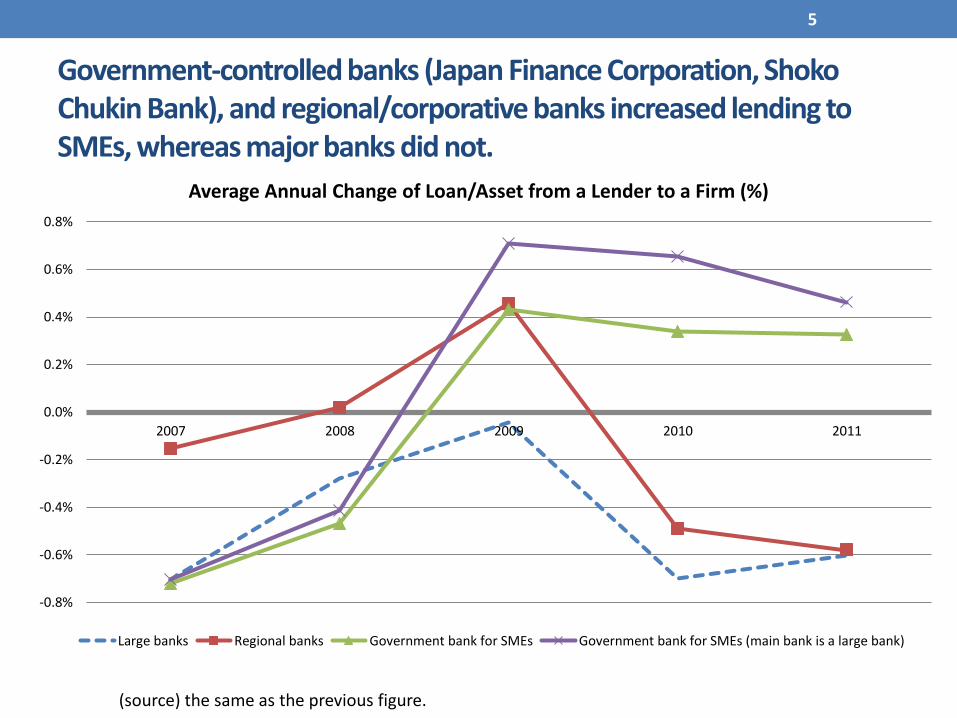
Government-controlled banks (Japan Finance Corporation, Shoko Chukin Bank), and regional/corporative banks increased lending to SMEs, whereas major banks did not.
5
-0.8%
-0.6%
-0.4%
-0.2%
0.0%
0.2%
0.4%
0.6%
0.8%
2007 2008 2009 2010 2011
Average Annual Change of Loan/Asset from a Lender to a Firm (%)
Large banks Regional banks Government bank for SMEs Government bank for SMEs (main bank is a large bank)
(source) the same as the previous figure.

SMEs whose main bank is a major (city) bank increasingly dependent on gov. banks.
6
35.0
33.5
33.1
33.6 33.6
32.8
31.531.1
31.331.0
34.4
33.3
33.4
34.1
34.7
2007 2008 2009 2010 2011
Average share of the government bank for SMEs at each firm (%)
regional banks cooporatives large banks
(source) Author’s calculation with the loan book data of the Small and Medium Enterprise Unit, Japan Finance Corporation. Aggregated the value in the accounting period ending each calendar year. The government banks for SMEs include the SME unit and the Micro Business and Individual unit of JFC, and Shoko Chukin Bank.

Relationships of SMEs and large banks are weak.
7
31.130.6
30.3 30.1 29.9
28.928.6
28.327.9
27.626.9 26.7
26.3 26.4 26.4
2007 2008 2009 2010 2011
Average share of the main bank deposit at each firm (%)
regional banks cooporatives large banks
72.8%71.6%
72.7% 72.3%71.6%
61.5%
59.6%
55.7%
58.1% 57.8%
2007 2008 2009 2010 2011
Average ratio of SME loan over total loan
regional banks large banks
(source) Nikkei NEEDS (for publicly traded banks) , Japanese Bankers’ Association Website (for privately held banks) . Regional banks includes those participating in the Regional Banks Association of Japan or the Second Association of Regional Banks.
(source) Author’s calculation with the loan book data of the Small and Medium Enterprise Unit, Japan Finance Corporation. Aggregated the value in the accounting period ending each calendar year.

Frequency of main bank switches by types of main banks
Type of the main bank in the previous year
Regional banks Large banks All
From the
previous year #obs (ratio of ii) #obs (ratio of ii) #obs (ratio of ii)
2007 i. no switch 23,082 8,171 31,253
ii. switch 474 2.1% 283 3.5% 757 2.4%
2008 i. no switch 22,517 7,835 30,352
ii. switch 446 2.0% 286 3.7% 732 2.4%
2009 i. no switch 21,489 7,499 28,988
ii. switch 567 2.6% 304 4.1% 871 3.0%
2010 i. no switch 20,874 7,579 28,453
ii. switch 490 2.3% 327 4.3% 817 2.9%
2011 i. no switch 20,367 7,594 27,961
ii. switch 282 1.4% 190 2.5% 472 1.7%
8
(source) Author’s calculation with the loan book data of the Small and Medium Enterprise Unit, Japan Finance Corporation. Aggregated the value in the accounting period ending each calendar year.

Research Question
1. Fact finding: Did gov. banks fill the excess demand due to insufficient loan supply by large main banks in the financial crisis?
a. Is it still true after controlling for firm characteristics, and other bank characteristics?
b. Is the increased dependence on gov. banks due to,
i. the surge of policy lending, or
ii. due to the reduction in lending by private banks.
2. Are this behavior of gov. banks consistent with the welfare maximization, or the profit maximization?
9

Literature: Government-Controlled Banks
10
• Negative view (developing countries, or south Europe)
La Porta et al (2002), Sapienza (2004), Dinҫ (2005), Iannotta et al (2011), Pereira et al (2013), Illueca et al (2014)
• Neutral view
Altunbas et al (2001), Lazzarini et al (2011), Cull and Martinez-Peria (2013),
• Positive view (Germany, Japan, and Brazil)
Behr et al (2013), Bertay et al (2014), Coleman and Feler(2015), Sekino et al (2014).
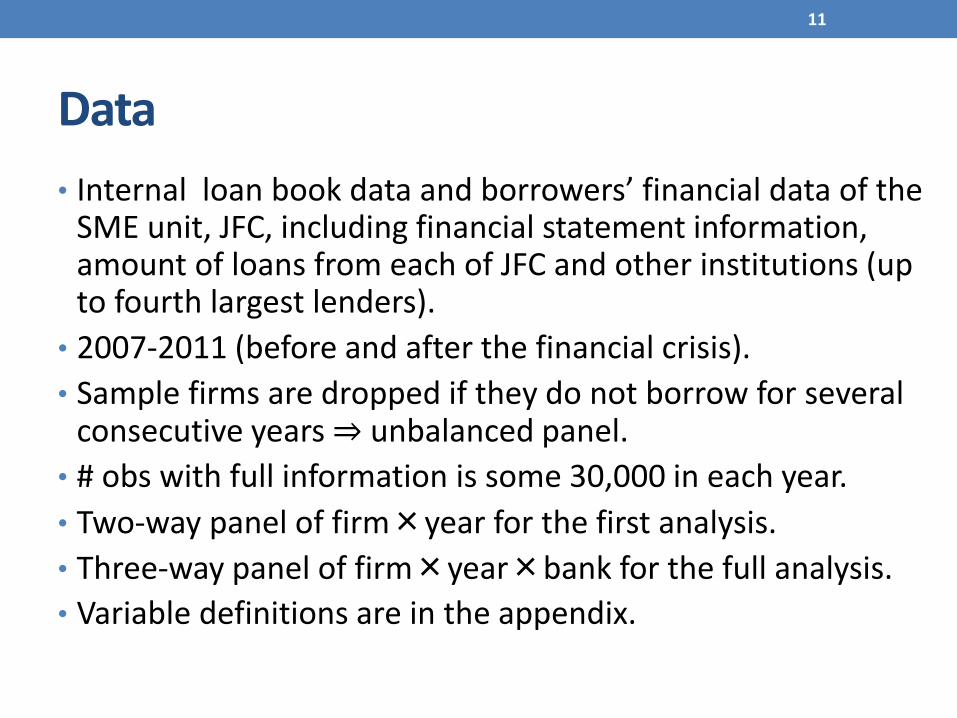
Data
• Internal loan book data and borrowers’ financial data of the SME unit, JFC, including financial statement information, amount of loans from each of JFC and other institutions (up to fourth largest lenders).
• 2007-2011 (before and after the financial crisis).
• Sample firms are dropped if they do not borrow for several consecutive years ⇒ unbalanced panel.
• # obs with full information is some 30,000 in each year.
• Two-way panel of firm×year for the first analysis.
• Three-way panel of firm×year×bank for the full analysis.
• Variable definitions are in the appendix.
11
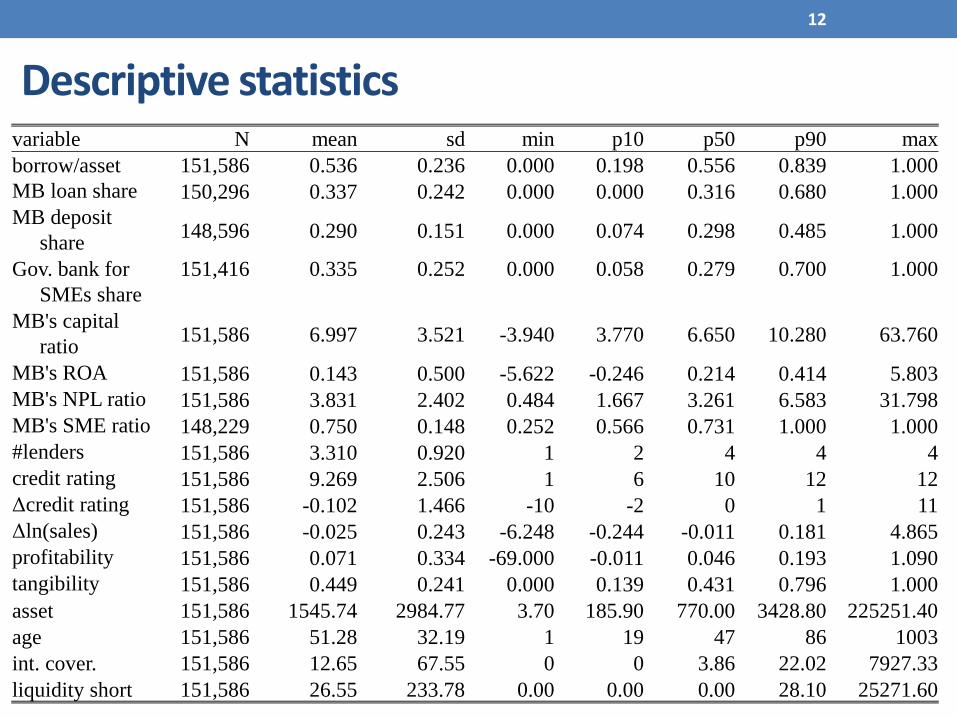
Descriptive statistics
12
variable N mean sd min p10 p50 p90 max
borrow/asset 151,586 0.536 0.236 0.000 0.198 0.556 0.839 1.000
MB loan share 150,296 0.337 0.242 0.000 0.000 0.316 0.680 1.000
MB deposit
share148,596 0.290 0.151 0.000 0.074 0.298 0.485 1.000
Gov. bank for
SMEs share
151,416 0.335 0.252 0.000 0.058 0.279 0.700 1.000
MB's capital
ratio151,586 6.997 3.521 -3.940 3.770 6.650 10.280 63.760
MB's ROA 151,586 0.143 0.500 -5.622 -0.246 0.214 0.414 5.803
MB's NPL ratio 151,586 3.831 2.402 0.484 1.667 3.261 6.583 31.798
MB's SME ratio 148,229 0.750 0.148 0.252 0.566 0.731 1.000 1.000
#lenders 151,586 3.310 0.920 1 2 4 4 4
credit rating 151,586 9.269 2.506 1 6 10 12 12
Δcredit rating 151,586 -0.102 1.466 -10 -2 0 1 11
Δln(sales) 151,586 -0.025 0.243 -6.248 -0.244 -0.011 0.181 4.865
profitability 151,586 0.071 0.334 -69.000 -0.011 0.046 0.193 1.090
tangibility 151,586 0.449 0.241 0.000 0.139 0.431 0.796 1.000
asset 151,586 1545.74 2984.77 3.70 185.90 770.00 3428.80 225251.40
age 151,586 51.28 32.19 1 19 47 86 1003
int. cover. 151,586 12.65 67.55 0 0 3.86 22.02 7927.33
liquidity short 151,586 26.55 233.78 0.00 0.00 0.00 28.10 25271.60
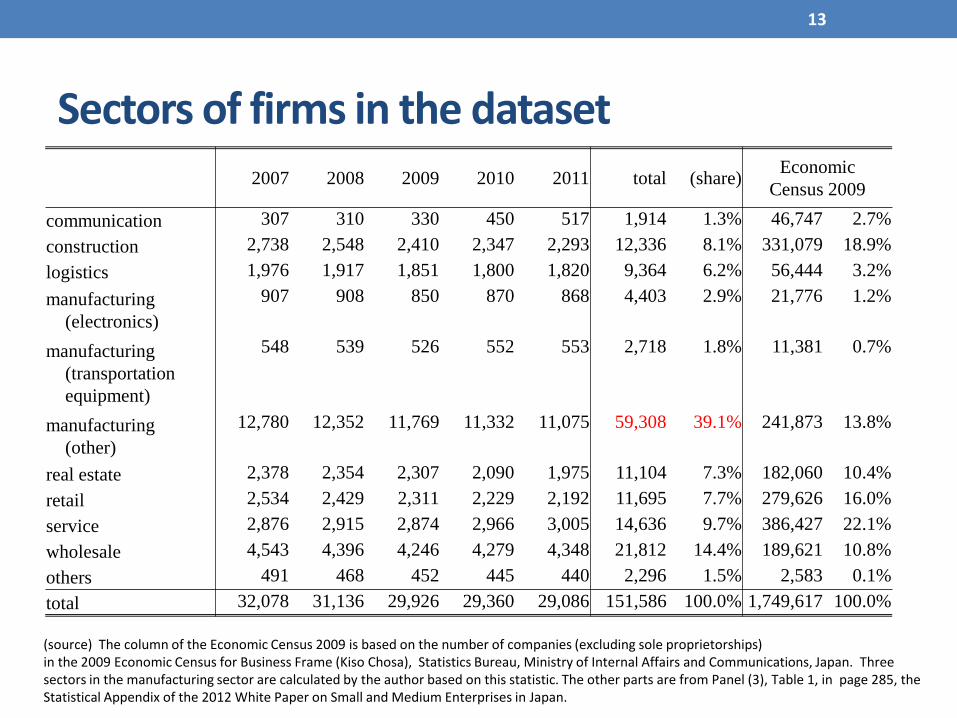
Sectors of firms in the dataset
13
2007 2008 2009 2010 2011 total (share)Economic
Census 2009
communication 307 310 330 450 517 1,914 1.3% 46,747 2.7%
construction 2,738 2,548 2,410 2,347 2,293 12,336 8.1% 331,079 18.9%
logistics 1,976 1,917 1,851 1,800 1,820 9,364 6.2% 56,444 3.2%
manufacturing
(electronics)
907 908 850 870 868 4,403 2.9% 21,776 1.2%
manufacturing
(transportation
equipment)
548 539 526 552 553 2,718 1.8% 11,381 0.7%
manufacturing
(other)
12,780 12,352 11,769 11,332 11,075 59,308 39.1% 241,873 13.8%
real estate 2,378 2,354 2,307 2,090 1,975 11,104 7.3% 182,060 10.4%
retail 2,534 2,429 2,311 2,229 2,192 11,695 7.7% 279,626 16.0%
service 2,876 2,915 2,874 2,966 3,005 14,636 9.7% 386,427 22.1%
wholesale 4,543 4,396 4,246 4,279 4,348 21,812 14.4% 189,621 10.8%
others 491 468 452 445 440 2,296 1.5% 2,583 0.1%
total 32,078 31,136 29,926 29,360 29,086 151,586 100.0% 1,749,617 100.0%
(source) The column of the Economic Census 2009 is based on the number of companies (excluding sole proprietorships) in the 2009 Economic Census for Business Frame (Kiso Chosa), Statistics Bureau, Ministry of Internal Affairs and Communications, Japan. Three sectors in the manufacturing sector are calculated by the author based on this statistic. The other parts are from Panel (3), Table 1, in page 285, the Statistical Appendix of the 2012 White Paper on Small and Medium Enterprises in Japan.
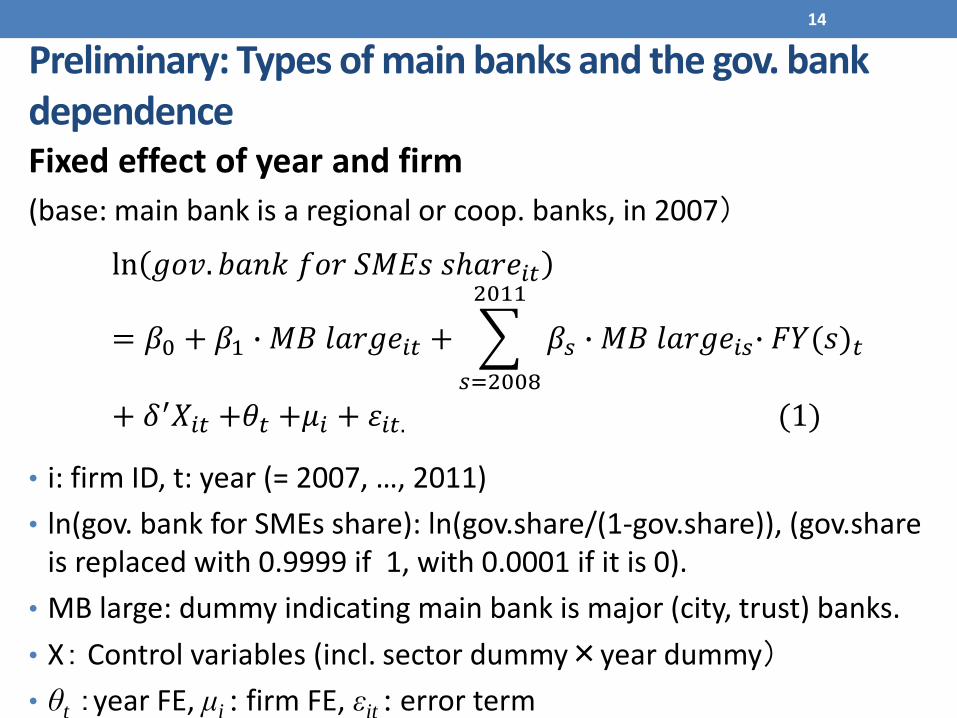
Preliminary: Types of main banks and the gov. bank dependenceFixed effect of year and firm
(base: main bank is a regional or coop. banks, in 2007)
ln 𝑔𝑜𝑣. 𝑏𝑎𝑛𝑘 𝑓𝑜𝑟 𝑆𝑀𝐸𝑠 𝑠ℎ𝑎𝑟𝑒𝑖𝑡
= 𝛽0 + 𝛽1 ∙ 𝑀𝐵 𝑙𝑎𝑟𝑔𝑒𝑖𝑡 +
𝑠=2008
2011
𝛽𝑠 ∙ 𝑀𝐵 𝑙𝑎𝑟𝑔𝑒𝑖𝑠∙ 𝐹𝑌(𝑠)𝑡
+ 𝛿′𝑋𝑖𝑡 +𝜃𝑡 +𝜇𝑖 + 휀𝑖𝑡. (1)
• i: firm ID, t: year (= 2007, …, 2011)
• ln(gov. bank for SMEs share): ln(gov.share/(1-gov.share)), (gov.shareis replaced with 0.9999 if 1, with 0.0001 if it is 0).
• MB large: dummy indicating main bank is major (city, trust) banks.
• X: Control variables (incl. sector dummy×year dummy)
• θt :year FE, μi : firm FE, εit : error term
14
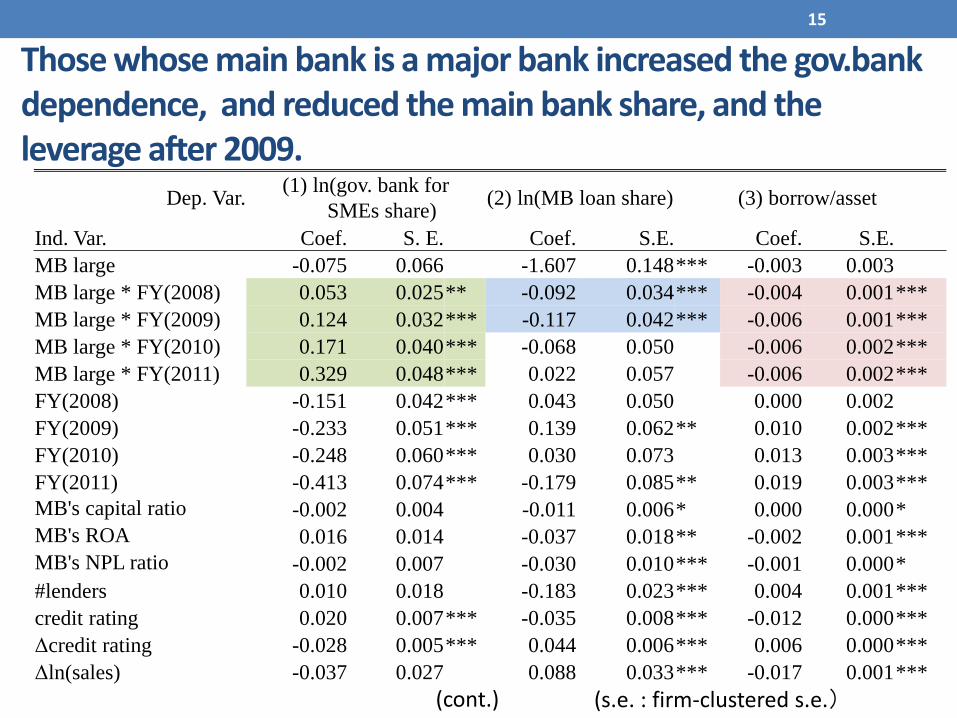
Those whose main bank is a major bank increased the gov.bankdependence, and reduced the main bank share, and the leverage after 2009.
15
(cont.) (s.e. : firm-clustered s.e.)
Dep. Var.(1) ln(gov. bank for
SMEs share)(2) ln(MB loan share) (3) borrow/asset
Ind. Var. Coef. S. E. Coef. S.E. Coef. S.E.
MB large -0.075 0.066 -1.607 0.148*** -0.003 0.003
MB large * FY(2008) 0.053 0.025** -0.092 0.034*** -0.004 0.001***
MB large * FY(2009) 0.124 0.032*** -0.117 0.042*** -0.006 0.001***
MB large * FY(2010) 0.171 0.040*** -0.068 0.050 -0.006 0.002***
MB large * FY(2011) 0.329 0.048*** 0.022 0.057 -0.006 0.002***
FY(2008) -0.151 0.042*** 0.043 0.050 0.000 0.002
FY(2009) -0.233 0.051*** 0.139 0.062** 0.010 0.002***
FY(2010) -0.248 0.060*** 0.030 0.073 0.013 0.003***
FY(2011) -0.413 0.074*** -0.179 0.085** 0.019 0.003***
MB's capital ratio -0.002 0.004 -0.011 0.006* 0.000 0.000*
MB's ROA 0.016 0.014 -0.037 0.018** -0.002 0.001***
MB's NPL ratio -0.002 0.007 -0.030 0.010*** -0.001 0.000*
#lenders 0.010 0.018 -0.183 0.023*** 0.004 0.001***
credit rating 0.020 0.007*** -0.035 0.008*** -0.012 0.000***
Δcredit rating -0.028 0.005*** 0.044 0.006*** 0.006 0.000***
Δln(sales) -0.037 0.027 0.088 0.033*** -0.017 0.001***

16
Constant term, and sector×year dummies are omitted from the report. Sectors include communication, logistics, manufacturing(electronics, transportation equipment, and other), real estate, retail, service, wholesale, and others (base: construction).
ln(asset) -0.476 0.078*** 1.030 0.081*** 0.040 0.004***
ln(firm age) -0.630 0.241*** 0.274 0.244 -0.077 0.008***
profitability 0.027 0.030 0.055 0.037 0.005 0.002**
tangibility 0.189 0.184 0.679 0.197*** 0.229 0.009***
ln(int.cover) 0.119 0.015*** -0.173 0.015*** -0.026 0.000***
ln(liquid.short) 0.005 0.003* -0.019 0.004*** 0.002 0.000***
Firm fixed effect yes yes yes
N 151,416 150,296 151,586
#groups 40,838 40,722 40,852
R-sq: within 0.013 0.022 0.208
between 0.051 0.093 0.254
overall 0.046 0.084 0.252

THEORY OF MIXED OLIGOPOLY
17

(Sketch of the model)
• Main bank undertakes relationship banking. The service is differentiated. E.g.: Expectation that the main bank is willing to support the firm under a temporary financial distress (Chemmanur et al 1994, Dinҫ 2000).
-> loan demand for the main bank is less price-elastic.
• Compare the loan supply functions in the following cases. A gov. bank decides its supply
1. to maximize its own profit (Cournot),
2. to maximize the social surplus (sum of bank profits and borrowers profits) in the loan market (mixed Cournot).
18
Mixed oligopoly: private banks and a government-controlled bank are operating.

• Loan demand function of a firm (Lm: loan by main bank, Lo:loan by non-main banks, Lg:loan by gov. banks, )
where, .
• Key: demand for main bank loan is less price-elastic.
• Using the inverse demand function based on these functions, calculate the Nash equilibrium in the two cases.
Mixed Cournot: 1 main bank, n-2 other banks, and 1 government-controlled bank
19
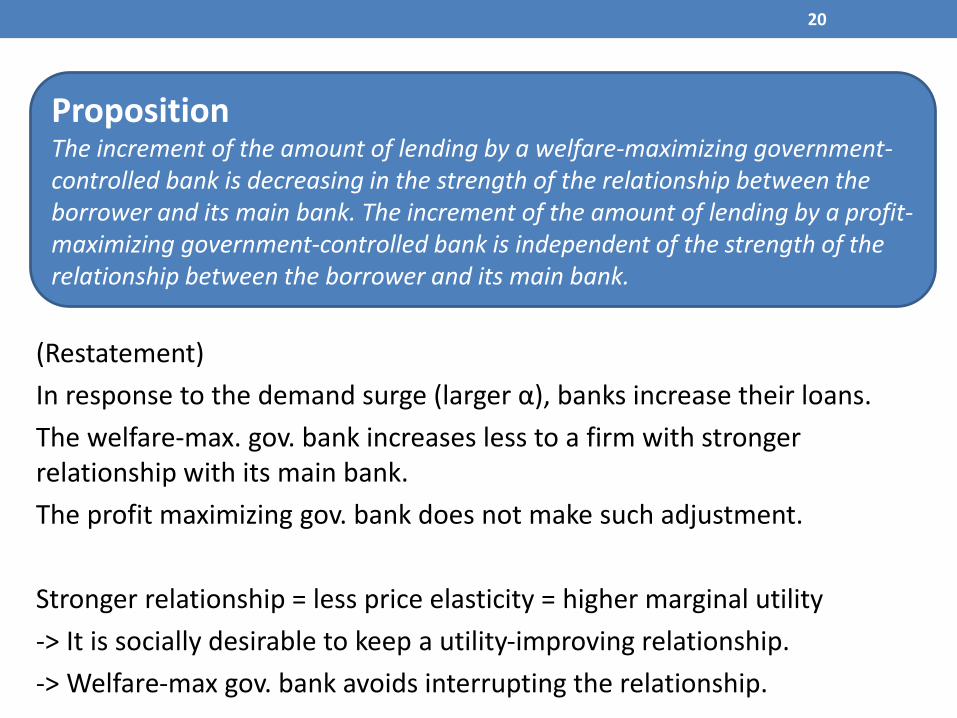
(Restatement)
In response to the demand surge (larger α), banks increase their loans.
The welfare-max. gov. bank increases less to a firm with stronger relationship with its main bank.
The profit maximizing gov. bank does not make such adjustment.
Stronger relationship = less price elasticity = higher marginal utility
-> It is socially desirable to keep a utility-improving relationship.
-> Welfare-max gov. bank avoids interrupting the relationship.
20
PropositionThe increment of the amount of lending by a welfare-maximizing government-controlled bank is decreasing in the strength of the relationship between the borrower and its main bank. The increment of the amount of lending by a profit-maximizing government-controlled bank is independent of the strength of the relationship between the borrower and its main bank.

HYPOTHESIS TEST
21
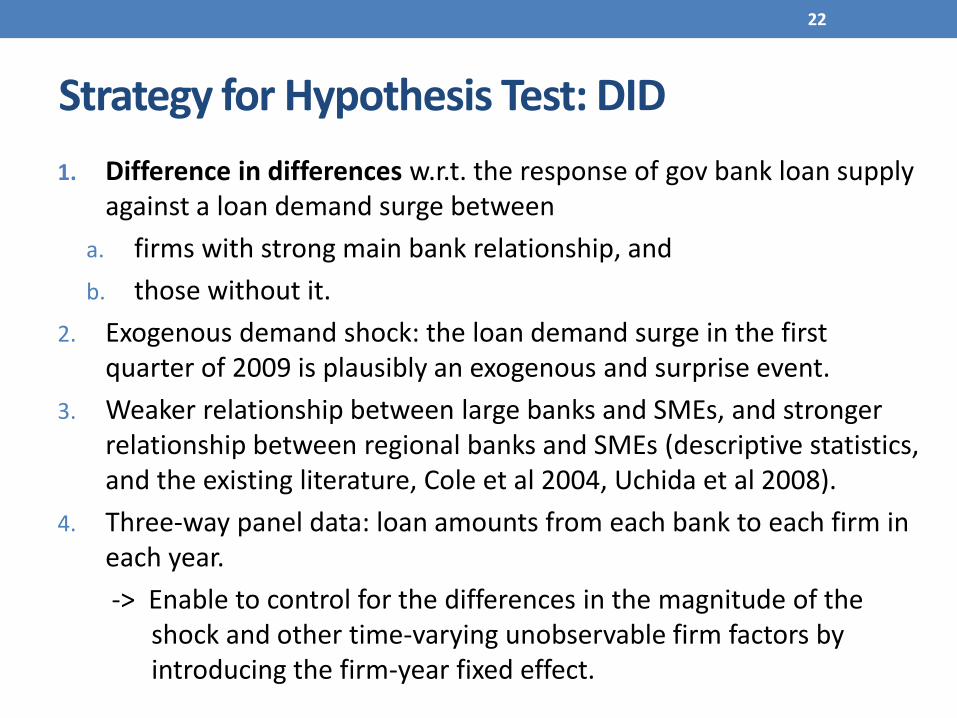
Strategy for Hypothesis Test: DID
1. Difference in differences w.r.t. the response of gov bank loan supply against a loan demand surge between
a. firms with strong main bank relationship, and
b. those without it.
2. Exogenous demand shock: the loan demand surge in the first quarter of 2009 is plausibly an exogenous and surprise event.
3. Weaker relationship between large banks and SMEs, and stronger relationship between regional banks and SMEs (descriptive statistics, and the existing literature, Cole et al 2004, Uchida et al 2008).
4. Three-way panel data: loan amounts from each bank to each firm in each year.
-> Enable to control for the differences in the magnitude of the shock and other time-varying unobservable firm factors by introducing the firm-year fixed effect.
22
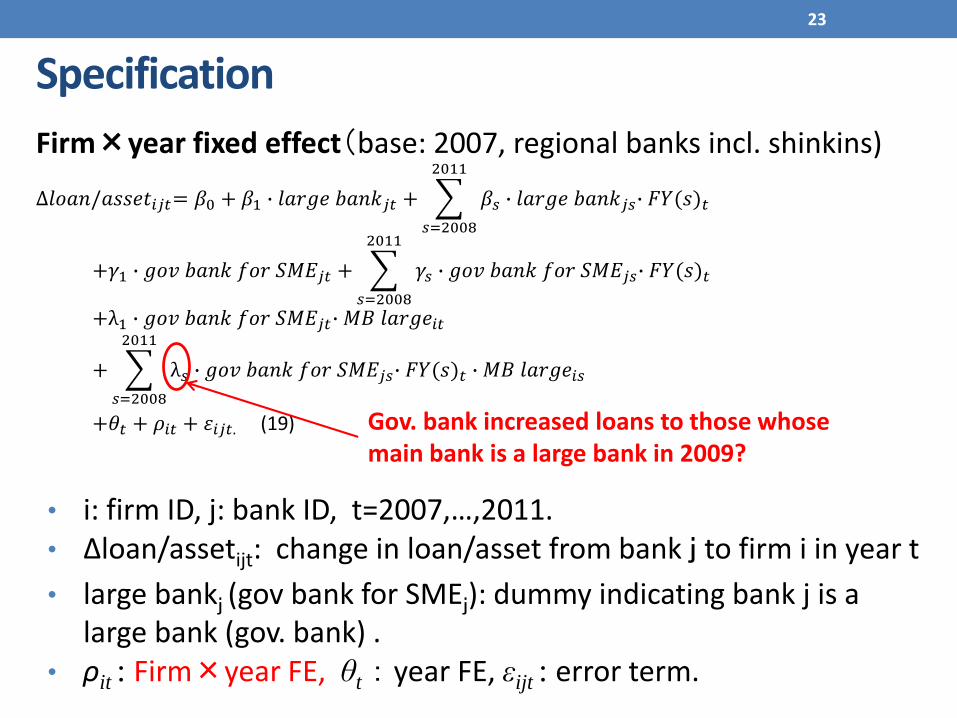
Specification
Firm×year fixed effect(base: 2007, regional banks incl. shinkins)
∆𝑙𝑜𝑎𝑛/𝑎𝑠𝑠𝑒𝑡𝑖𝑗𝑡= 𝛽0 + 𝛽1 ∙ 𝑙𝑎𝑟𝑔𝑒 𝑏𝑎𝑛𝑘𝑗𝑡 +
𝑠=2008
2011
𝛽𝑠 ∙ 𝑙𝑎𝑟𝑔𝑒 𝑏𝑎𝑛𝑘𝑗𝑠∙ 𝐹𝑌(𝑠)𝑡
+𝛾1 ∙ 𝑔𝑜𝑣 𝑏𝑎𝑛𝑘 𝑓𝑜𝑟 𝑆𝑀𝐸𝑗𝑡 +
𝑠=2008
2011
𝛾𝑠 ∙ 𝑔𝑜𝑣 𝑏𝑎𝑛𝑘 𝑓𝑜𝑟 𝑆𝑀𝐸𝑗𝑠∙ 𝐹𝑌(𝑠)𝑡
+λ1 ∙ 𝑔𝑜𝑣 𝑏𝑎𝑛𝑘 𝑓𝑜𝑟 𝑆𝑀𝐸𝑗𝑡∙ 𝑀𝐵 𝑙𝑎𝑟𝑔𝑒𝑖𝑡
+
𝑠=2008
2011
λ𝑠 ∙ 𝑔𝑜𝑣 𝑏𝑎𝑛𝑘 𝑓𝑜𝑟 𝑆𝑀𝐸𝑗𝑠∙ 𝐹𝑌(𝑠)𝑡 ∙ 𝑀𝐵 𝑙𝑎𝑟𝑔𝑒𝑖𝑠
+𝜃𝑡 + 𝜌𝑖𝑡 + 휀𝑖𝑗𝑡. (19)
• i: firm ID, j: bank ID, t=2007,…,2011. • Δloan/assetijt: change in loan/asset from bank j to firm i in year t
• large bankj (gov bank for SMEj): dummy indicating bank j is a large bank (gov. bank) .
• ρit : Firm×year FE, θt : year FE, εijt : error term.
23
Gov. bank increased loans to those whose main bank is a large bank in 2009?

Sample
24
About 40,000 firms×5 types×5years≒ 1,000,000 obs.
2007 2008 2009 2010 2011 Total
Large banks 31,296 33,362 33,088 31,927 30,274 159,947
Regional banks 73,459 75,185 74,040 71,001 65,550 359,235
Government banks for SMEs 60,677 61,633 60,247 57,519 54,663 294,739
Other government banks 479 490 486 461 440 2,356
Other institutions 74,610 74,469 74,211 70,305 65,891 359,486
Total 240,521 245,139 242,072 231,213 216,818 1,175,763

Gov. banks increase loans to SMEs. Especially, to those whose main bank is a large bank.
25
-0.8%
-0.6%
-0.4%
-0.2%
0.0%
0.2%
0.4%
0.6%
0.8%
2007 2008 2009 2010 2011
Average Annual Change of Loan/Asset from a Lender to a Firm (%)
Large banks Regional banks
Government bank for SMEs Government bank for SMEs (main bank is a large bank)
(source) Author’s calculation with the loan book data of the Small and Medium Enterprise Unit, Japan Finance Corporation. Aggregated the value in the accounting period ending each calendar year.

Result: gov. banks increased a lot in 2009-11. Especially, for those whose main is a large bank and in need of liquidity.
26
(cont.)
(Dependent variable: Δloan/assetijt , s.e. is firm*year clustered s.e.)(1) Baseline (2) Size of shock (3) Complete panel
Coef. (S.E.) Coef. S.E. Coef. S.E.
gov. bank for SMEs -0.0056 (0.0004)*** -0.0054 (0.0004)*** -0.0040 (0.0005)***
gov. bank for SMEs * FY(2008) 0.0007 (0.0005) 0.0005 (0.0005) -0.0019 (0.0006)***
gov. bank for SMEs * FY(2009) 0.0048 (0.0005)*** 0.0051 (0.0005)*** 0.0033 (0.0006)***
gov. bank for SMEs * FY(2010) 0.0131 (0.0005)*** 0.0134 (0.0005)*** 0.0089 (0.0006)***
gov. bank for SMEs * FY(2011) 0.0144 (0.0005)*** 0.0142 (0.0006)*** 0.0073 (0.0006)***
gov. bank for SMEs * MB large -0.0005 (0.0005) -0.0010 (0.0005)* -0.0005 (0.0006)
gov. bank for SMEs * FY(2008) * MB large -0.0004 (0.0007) -0.0010 (0.0007) -0.0004 (0.0008)
gov. bank for SMEs * FY(2009) * MB large 0.0019 (0.0007)*** 0.0003 (0.0008) 0.0027 (0.0009)***
gov. bank for SMEs * FY(2010) * MB large 0.0025 (0.0007)*** 0.0014 (0.0008)* 0.0019 (0.0008)**
gov. bank for SMEs * FY(2011) * MB large 0.0002 (0.0008) 0.0000 (0.0008) -0.0002 (0.0008)
gov. bank for SMEs * MB large * ln(liquid.short) 0.0015 (0.0004)***
gov. bank for SMEs * FY(2008) * MB large * ln(liquid.short) 0.0010 (0.0005)**
gov. bank for SMEs * FY(2009) * MB large * ln(liquid.short) 0.0012 (0.0004)***
gov. bank for SMEs * FY(2010) * MB large * ln(liquid.short) 0.0016 (0.0005)***
gov. bank for SMEs * FY(2011) * MB large * ln(liquid.short) 0.0000 (0.0005)
FY(2008) 0.0011 (0.0004)*** 0.0014 (0.0004)*** 0.0022 (0.0004)***
FY(2009) 0.0049 (0.0004)*** 0.0051 (0.0004)*** 0.0061 (0.0004)***
FY(2010) -0.0052 (0.0004)*** -0.0049 (0.0004)*** -0.0025 (0.0004)***
FY(2011) -0.0064 (0.0004)*** -0.0056 (0.0004)*** -0.0006 (0.0004)*
large bank -0.0066 (0.0004)*** -0.0066 (0.0004)*** -0.0067 (0.0005)***
large bank * FY(2008) 0.0018 (0.0006)*** 0.0020 (0.0006)*** 0.0030 (0.0007)***
large bank * FY(2009) -0.0005 (0.0006) -0.0003 (0.0006) 0.0012 (0.0007)*
large bank * FY(2010) 0.0024 (0.0006)*** 0.0027 (0.0006)*** 0.0035 (0.0006)***
large bank * FY(2011) 0.0043 (0.0006)*** 0.0044 (0.0006)*** 0.0041 (0.0006)***
27
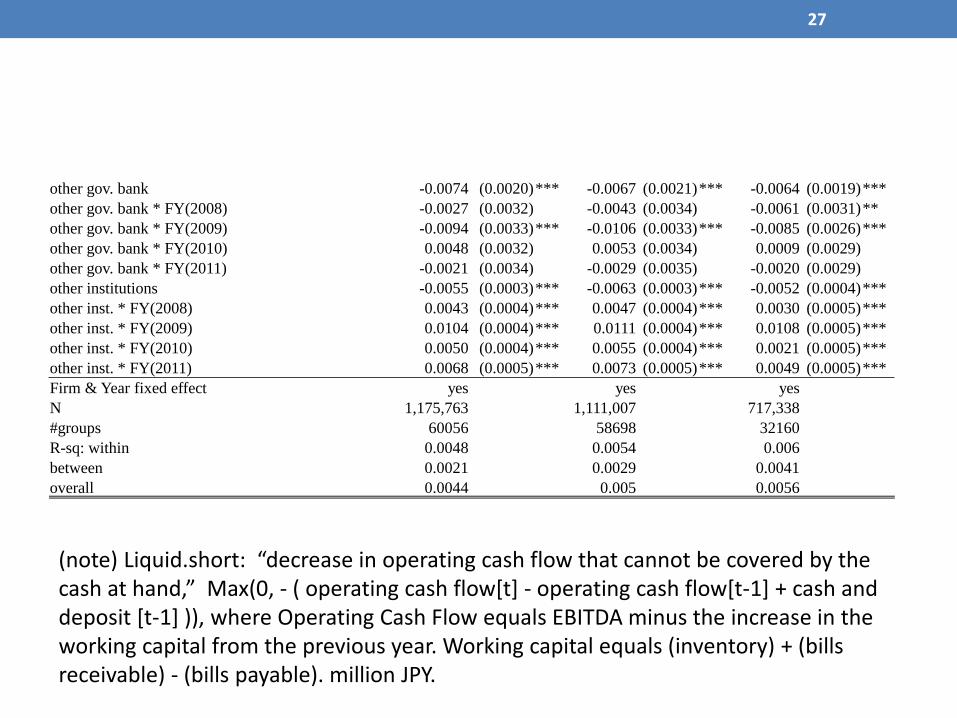
other gov. bank -0.0074 (0.0020)*** -0.0067 (0.0021)*** -0.0064 (0.0019)***
other gov. bank * FY(2008) -0.0027 (0.0032) -0.0043 (0.0034) -0.0061 (0.0031)**
other gov. bank * FY(2009) -0.0094 (0.0033)*** -0.0106 (0.0033)*** -0.0085 (0.0026)***
other gov. bank * FY(2010) 0.0048 (0.0032) 0.0053 (0.0034) 0.0009 (0.0029)
other gov. bank * FY(2011) -0.0021 (0.0034) -0.0029 (0.0035) -0.0020 (0.0029)
other institutions -0.0055 (0.0003)*** -0.0063 (0.0003)*** -0.0052 (0.0004)***
other inst. * FY(2008) 0.0043 (0.0004)*** 0.0047 (0.0004)*** 0.0030 (0.0005)***
other inst. * FY(2009) 0.0104 (0.0004)*** 0.0111 (0.0004)*** 0.0108 (0.0005)***
other inst. * FY(2010) 0.0050 (0.0004)*** 0.0055 (0.0004)*** 0.0021 (0.0005)***
other inst. * FY(2011) 0.0068 (0.0005)*** 0.0073 (0.0005)*** 0.0049 (0.0005)***
Firm & Year fixed effect yes yes yes
N 1,175,763 1,111,007 717,338
#groups 60056 58698 32160
R-sq: within 0.0048 0.0054 0.006
between 0.0021 0.0029 0.0041
overall 0.0044 0.005 0.0056
(note) Liquid.short: “decrease in operating cash flow that cannot be covered by the cash at hand,” Max(0, - ( operating cash flow[t] - operating cash flow[t-1] + cash and deposit [t-1] )), where Operating Cash Flow equals EBITDA minus the increase in the working capital from the previous year. Working capital equals (inventory) + (bills receivable) - (bills payable). million JPY.
-0.8%
-0.6%
-0.4%
-0.2%
0.0%
0.2%
0.4%
0.6%
0.8%
1.0%
1.2%
1.4%
2007 2008 2009 2010 2011
Estimated change in average loan/asset (%)
large banks
regional banks
government banks for SMEs (main bank is not a large bank)
government bank for SMEs (main bank is large bank)
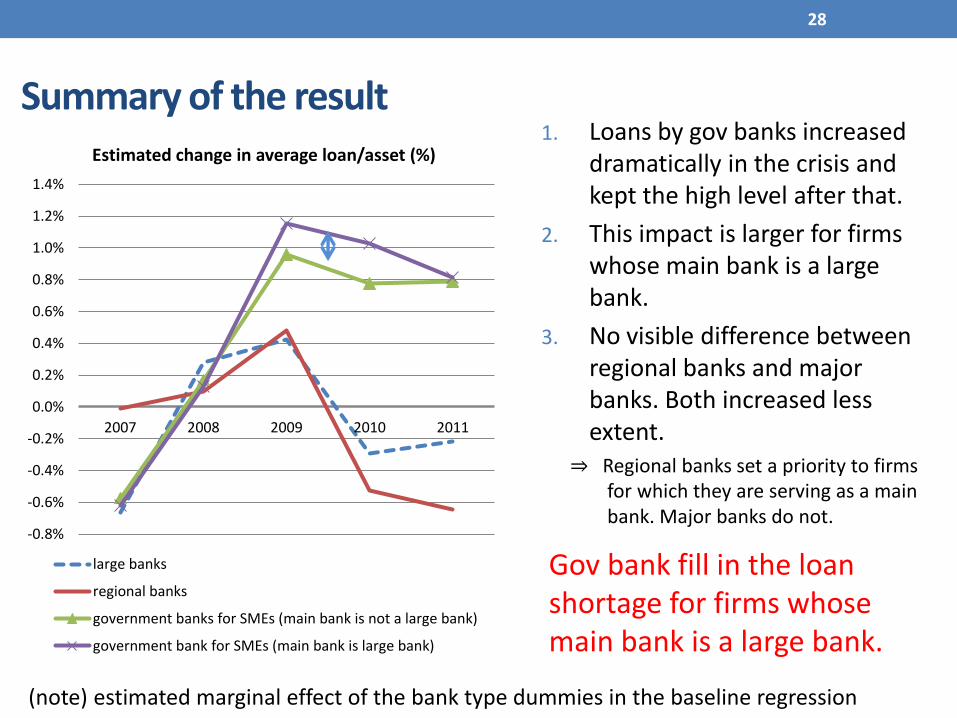
Summary of the result
28
(note) estimated marginal effect of the bank type dummies in the baseline regression
1. Loans by gov banks increased dramatically in the crisis and kept the high level after that.
2. This impact is larger for firms whose main bank is a large bank.
3. No visible difference between regional banks and major banks. Both increased less extent. ⇒ Regional banks set a priority to firms
for which they are serving as a main bank. Major banks do not.
Gov bank fill in the loan shortage for firms whose main bank is a large bank.
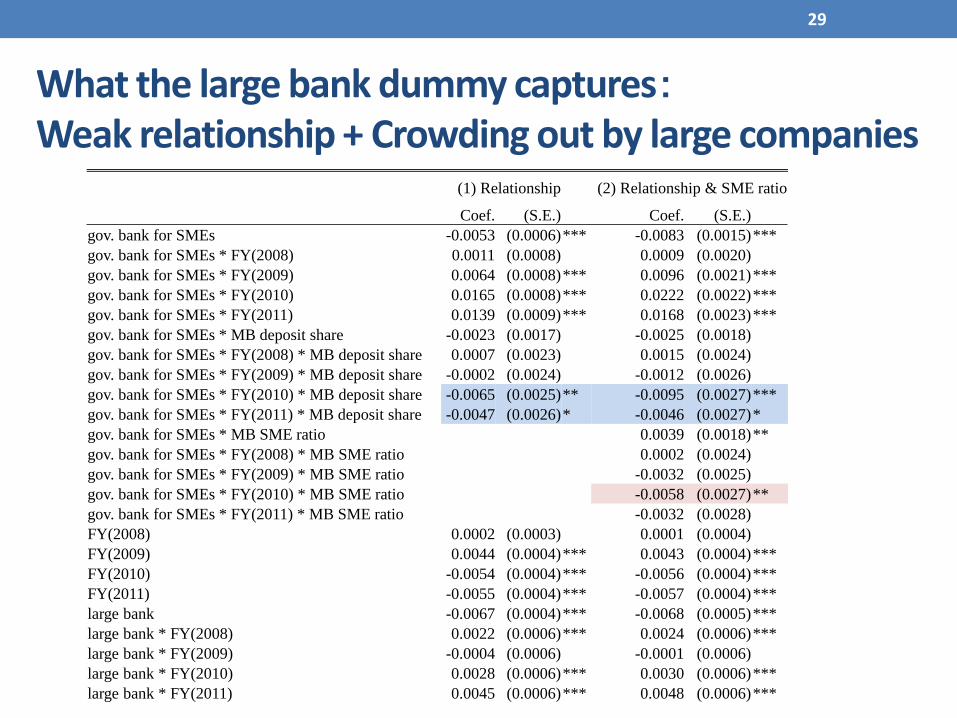
What the large bank dummy captures:Weak relationship + Crowding out by large companies
(1) Relationship (2) Relationship & SME ratio
Coef. (S.E.) Coef. (S.E.)
gov. bank for SMEs -0.0053 (0.0006)*** -0.0083 (0.0015)***
gov. bank for SMEs * FY(2008) 0.0011 (0.0008) 0.0009 (0.0020)
gov. bank for SMEs * FY(2009) 0.0064 (0.0008)*** 0.0096 (0.0021)***
gov. bank for SMEs * FY(2010) 0.0165 (0.0008)*** 0.0222 (0.0022)***
gov. bank for SMEs * FY(2011) 0.0139 (0.0009)*** 0.0168 (0.0023)***
gov. bank for SMEs * MB deposit share -0.0023 (0.0017) -0.0025 (0.0018)
gov. bank for SMEs * FY(2008) * MB deposit share 0.0007 (0.0023) 0.0015 (0.0024)
gov. bank for SMEs * FY(2009) * MB deposit share -0.0002 (0.0024) -0.0012 (0.0026)
gov. bank for SMEs * FY(2010) * MB deposit share -0.0065 (0.0025)** -0.0095 (0.0027)***
gov. bank for SMEs * FY(2011) * MB deposit share -0.0047 (0.0026)* -0.0046 (0.0027)*
gov. bank for SMEs * MB SME ratio 0.0039 (0.0018)**
gov. bank for SMEs * FY(2008) * MB SME ratio 0.0002 (0.0024)
gov. bank for SMEs * FY(2009) * MB SME ratio -0.0032 (0.0025)
gov. bank for SMEs * FY(2010) * MB SME ratio -0.0058 (0.0027)**
gov. bank for SMEs * FY(2011) * MB SME ratio -0.0032 (0.0028)
FY(2008) 0.0002 (0.0003) 0.0001 (0.0004)
FY(2009) 0.0044 (0.0004)*** 0.0043 (0.0004)***
FY(2010) -0.0054 (0.0004)*** -0.0056 (0.0004)***
FY(2011) -0.0055 (0.0004)*** -0.0057 (0.0004)***
large bank -0.0067 (0.0004)*** -0.0068 (0.0005)***
large bank * FY(2008) 0.0022 (0.0006)*** 0.0024 (0.0006)***
large bank * FY(2009) -0.0004 (0.0006) -0.0001 (0.0006)
large bank * FY(2010) 0.0028 (0.0006)*** 0.0030 (0.0006)***
large bank * FY(2011) 0.0045 (0.0006)*** 0.0048 (0.0006)***
29
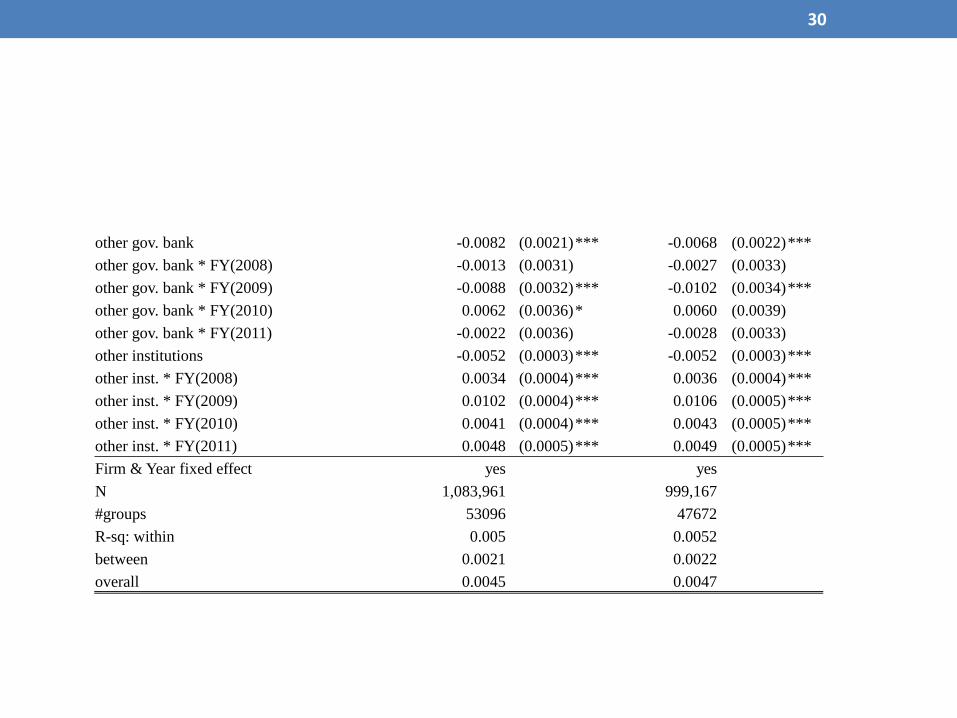
other gov. bank -0.0082 (0.0021)*** -0.0068 (0.0022)***
other gov. bank * FY(2008) -0.0013 (0.0031) -0.0027 (0.0033)
other gov. bank * FY(2009) -0.0088 (0.0032)*** -0.0102 (0.0034)***
other gov. bank * FY(2010) 0.0062 (0.0036)* 0.0060 (0.0039)
other gov. bank * FY(2011) -0.0022 (0.0036) -0.0028 (0.0033)
other institutions -0.0052 (0.0003)*** -0.0052 (0.0003)***
other inst. * FY(2008) 0.0034 (0.0004)*** 0.0036 (0.0004)***
other inst. * FY(2009) 0.0102 (0.0004)*** 0.0106 (0.0005)***
other inst. * FY(2010) 0.0041 (0.0004)*** 0.0043 (0.0005)***
other inst. * FY(2011) 0.0048 (0.0005)*** 0.0049 (0.0005)***
Firm & Year fixed effect yes yes
N 1,083,961 999,167
#groups 53096 47672
R-sq: within 0.005 0.0052
between 0.0021 0.0022
overall 0.0045 0.0047
30

Conclusion and limitationThose whose main bank is a large bank increased the dependence on gov banks. Especially, for those in need of liquidity.
1. Relations between large banks and SMEs are weak.
2. Large corporations crowded out SMEs at large banks.
-> Proposition indicates that the former is consistent with the welfare maximizing gov banks.
-> Perhaps, the loan demand surge from large corporations beyond ability caused the crowding-out against SMEs at a large bank(Holmström and Tirole 1997)。
Limitation: We don’t know the welfare improvement by gov banks is large enough to justify the cost for it.
31