The Burden Of Obesity Alison Patrick, MPH, RD, LD Cuyahoga County Board of Health.

The Obesity Burden in Nevada
This publication was supported by the Nevada State Division of Public and Behavioral Health through Grant Number 3U58DP004820-02W1 from the Centers for Disease Control and Prevention. Its contents are solely the responsibility of the authors and do not necessarily represent the official views of neither Division nor the Centers for Disease Control and Prevention.

2

3
4Letter from the Nevada Chief Medical Officer
Executive Summary 7
Introduction 8
The Obesity Burden in Nevada 10
Obesity Across the Lifespan 14
Framework for Addressing Obesity in Nevada 20
Focus Area 1: Childhood Obesity 28
Focus Area 2: School Health 31
Focus Area 3: Worksite Wellness 34
Focus Area 4: Physical Education/Physical Activity 36
Conclusion and Call to Action 39
Resources 41
Table of Contents

Public Health: Working for a Safer and Healthier Nevada
BRIAN SANDOVAL Governor
RICHARD WHITLEY, MS Director
STATE OF NEVADA
CODY L. PHINNEY, MPH Administrator
TRACEY D. GREEN, MD Chief Medical Officer
DEPARTMENT OF HEALTH AND HUMAN SERVICES DIVISION OF PUBLIC AND BEHAVIORAL HEALTH
4150 Technology Way, Suite 210 Carson City, Nevada 89706
Telephone: (775) 684-4285 · Fax: (775) 684-4245
Dear Nevada Citizens:
The Nevada Division of Public and Behavioral Health is very pleased to present the first Nevada Statewide Obesity Burden Report. This report was developed to highlight and define the burden of obesity in Nevada. The Nevada Division of Public and Behavioral Health would like to express gratitude for the dedication and support extended by the many individuals and organizations that participated in on-going efforts focused on addressing the burden of obesity in Nevada.
According to the Centers for Disease Control and Prevention (CDC), “more than one-third of U.S. adults (over 72 million people) and 17 percent of U.S. children are obese. During 1980–2008, obesity rates doubled for adults and tripled for children. During the past several decades, obesity rates for all population groups—regardless of age, sex, race, ethnicity, socioeconomic status, education level, or geographic region—have increased markedly.”
Obesity in Nevada, especially among children, is a rapidly growing chronic health problem. Data reported in 2013 from a statewide study of children entering kindergarten in Nevada reveals 29.6 percent of children were overweight or obese. According to the 2013 Youth Risk Behavioral Survey, 27 percent of students in grades 9-12 reported being overweight or obese. Over one-third of 4th, 7th, 10th grade students participating in the 2011-2012 Body Mass Index (BMI) collection in Nevada schools were reported either overweight or obese. Without further action, this trend will continue to increase over time.
The work of the Nevada Obesity Prevention Program and Chronic Disease Prevention and Health Promotion Section (CDPHP) has brought critically needed attention to this public health problem through the publication and dissemination of the Nevada Statewide Obesity Burden Report. I am pleased this report outlines current data and evidence-based best practices that can help to reduce the health and financial burden of obesity among Nevada’s adults and children. We look forward to collectively continuing efforts combating and preventing obesity in Nevada.
Sincerely,
_________________________________ Tracey Green, M.D. Chief Medical Officer Division of Public and Behavioral Health
4

5

6

7
Executive Summary The state of Nevada has made obesity and overweight prevention a critical component of public health promotion. Updated reporting on state goals as part of Healthy People 2020 for obesity, which can be found on the Nevada Wellness website, indicates that Nevada is making progress in the fight against obesity. The proportion of adults in Nevada with obesity has been reduced well below the 2020 goal as shown in Graph 1.
Nevada has made a commitment to policies and programs that reach Nevada’s youth, beginning with programs to support nutrition for newborns and young children, and continuing through elementary and secondary education with school health programs. Additionally, Nevada developed the Nevada Wellness website, http://nevadawellness.org, to assist all Nevadans in their personal pursuit of a healthy lifestyle. Nevada Wellness focuses on many obesity related health concerns and healthy lifestyle recommendations, including a commitment to worksite wellness and increased physical activity.
This report highlights the efforts in Nevada related to obesity reduction and prevention, including a presentation of four critical areas to address obestiy in terms of Childhood Obesity, School Health, Worksite Wellness and Physical Education/Physical Activity. Additionally, national-level obesity programs and data are discussed for comparison.
Our Mission
Nevada Wellness motivates Nevadans to lead a healthy lifestyle at work, at school and at home by connecting them to valuable existing health and wellness resources within the state that help them eat better, be more active, and make smart health choices.
Graph 1: Obesity Related Goal, Adult Obesity Rate
Reduce the proportion of adults who are obese
24
22
20
18
16
14
30
28
26
24
22
20
18
16
14
24.5
30.6
Current Rate
Target
Nevada State Rate 24.5%
Healthy People 2020 Target 30.6%
Data Source: Nevada Wellness website (http://nevadawellness.org/)
America’s health rankings 2014.
TARGET ACHIEVED

8
Introduction For the past three decades, the American population, and Nevada, has increased in the rates of obesity and being overweight. As the waistline of the average American continues to grow, so do the numerous health-related issues. Moreover, in recent years, obesity has become one of the largest causes of preventable death in America. The Centers for Disease Control and Prevention (CDC) publishes Obesity Prevalence Maps that show the prevalence of obesity among adults by state using self-reported information from the Behavioral Risk Factor Surveillance System (BRFSS).
As is visible from the CDC comparison of 1990 to 2010, in only two decades, every single state experienced substantial increases in obesity rates. The obesity epidemic has expanded at both ends of the age spectrum, with increases in overweight and obesity rates for adolescents and children over the past two decades.
Nevada is not unlike the other 49 states in terms of obesity increases and continued efforts to prevent obesity, treat comorbid diseases, and promote healthy lifestyles across the state. Policy initiatives have been introduced to increase obesity-related prevention programs for Nevada’s children and youth. More emphasis has been made on school-based nutrition and healthy lifestyle programs, promoting breastfeeding-friendly hospitals and workplaces, and integration of wellness programs at workplaces.
From: http://www.cdc.gov/obesity/data/adult.html
No Data <10% 10%–14% 15%–19% 20%–24% 25%-24% >30%
Figure 1: 1990 Map of Obesity Rates Across the United States

9
Figure 2: CDC 2010 Map of Obesity Rates Across the United States
From: http://www.cdc.gov/obesity/data/adult.html
No Data <10% 10%–14% 15%–19% 20%–24% 25%-24% >30%

10
The Obesity Burden in Nevada Nevada has been one of the nation’s fastest growing states for the past five decades, primarily due to population growth in Clark and Washoe Counties.i
Although there are various methods to define urban, rural and frontier regions, it is widely agreed upon that the majority of counties in Nevada are rural or frontier.ii According to the 2010 Census Bureau designations, approximately 91.8% of the population resides in urban counties in Nevada, while the remaining 8.2% reside in rural or frontier counties. These rural counties encompass a vast majority of the state with large distances between communities.
With much of Nevada populated by less than 10% of the state’s population, there are unique challenges in rural communities. These communities tend to have an older population and often deal with significant lack of access to health resources. Older populations use a disproportionately higher amount of health resources and experience higher rates of disability and mortality.iii
TAblE 1: STATE DEMOGRApHICS 2006-20152006 population 2015 population Net Change percent Change
Statewide 2,498,828 2,822,675 323,847 12.96%
Clark County
395,484 439,283 43,799 11.07%Washoe County
1,783,781 2,049,593 265,812 14.90%
Region 1 101,554 101,378 (176) -0.17%
Carson City 54,655 53,973 -682 -1.2%
Douglas County 46,899 47,405 506 1.1%
Region 2 51,086 55,309 4,223 8.27%
Churchhill County 24,610 25,522 912 3.7%
Humboldt County 15,654 18,071 2,417 15.4%
Pershing County 5,309 5,303 -6 -0.1%
Lander County 5,513 6,431 900 16.3%
Region 3 56,515 65,445 8,930 15.80%
Elko County 46,471 54,298 7,827 16.8%
Eureka County 1,711 2,020 309 18.1%
White Pine County 8,333 9,127 794 9.5%
Region 4 47,862 50,435 11,503 5.38%
Esmerelda 922 979 57 6.2%
Lincoln 4,381 4,898 608 13.9%
Nye 42,559 44,467 1,908 4.5%
Region 5 62,547 61,232 10,188 -2.10%
Lyon County 53,994 52,992 -1,002 -1.9%
Mineral County 4,570 4,101 -469 -10.3%
Storey County 3,983 4,139 156 3.9%
Data source: Nevada State Demographer (May 2015)

11
Nevada population by Rural-Urban Commuting Areas
Healthcare Resources in Nevada
The Economic burden of Obesity
As obesity rates continue to rise across the country, the economic consequences of obesity and obesity-related diseases rise as well. The prevalence of obesity is associated with both direct costs (e.g. preventative, diagnostic, and treatment services) and indirect costs (e.g. wages lost due to illness or disability, and future earnings due to premature death).iv
“The total economic cost of overweight and obesity in the United States and Canada caused by medical costs, excess mortality and disability is approximately $300 billion per year. The portion of this total due to overweight is approximately $80 billion, and approximately $220 billion is due to obesity. The portion of the total in the United States is approximately 90 percent of the total for the United States and Canada.”v
The economic burden of obesity is calculated not only by factoring in increased health care costs but also by factoring lost productivity costs and the burden on society of negatively impacted health-related quality of life.vi, vii
Recent U.S. studies find that obese patients incur:viii
• 46% increased inpatient costs
• 27% more physician visits and outpatient visits
• 80% increased spending on prescription drugs

12
A 2010 study by Finkelstein and colleagues shows just how much of the burden is carried through to taxpayers who support Medicare where obese individuals have higher costs than healthy weight individuals. Medicare has a greater financial incentive to prevent obesity than the private sector due to the fact that when an obese 65 year old enters the program, his/her costs are immediate and substantially higher than those of a healthy weight person. In addition, the study estimated costs for employers ranging from $175 per year to $2,485 per year depending on the degree of overweight for an employee and their gender. Roughly 30% of these costs were due to absenteeism.ix
In 2008, taxpayers in the United States paid a bill as high as $147 billion, or almost 10% of all medical spending, up substantially from their 1998 study where they reported $78.5 billion a year in taxpayer spending on obesity.x
According to the Robert Wood Johnson Foundation, reducing the average body mass index in Nevada by 5% could lead to health care savings of more than $2 million in 10 years and $5 million in 20 years.xi
Graph 2: Annual Obesity Spending projections (2010-2030)
Data Source: Robert Wood Johnson Foundation, Bending the Obesity Curve in Nevada Issue Brief (2012)
TAblE 2: ObESITy-RElATED HEAlTH CARE COSTS IN NEVADAPotential Savings by 2020 if BMI is Reduced by 5%
(cumulative)Potential Savings by 2030 if BMI is Reduced by 5%
(cumulative)
$2,095,000,000 $5,921,000,000
Data Source: Robert Wood Johnson Foundation, Bending the Obesity Curve in Nevada Issue Brief (2012)
$5800
$5600
$5400
$5200
$5000
$4800
$4600
$44002010 2012 2014 2016 2018 2020 2022 2024 2026 2028 2030
Total Predicted Costs
Total Predicted Costs with 5% BMI Reduction

13
TAblE 3: pOTENTIAl HEAlTH AND COST SAVINGS by TOp ObESITy-RElATED HEAlTH pROblEMS
2010 Number of Cases
potential Cases Avoided by 2020
if bMI is Reduced by 5%
(cumulative)*
potential Cost Savings by 2020,
if bMI is Reduced by 5%
(cumulative)
potential Cases Avoided by 2030
if bMI is Reduced by 5%
(cumulative)
potential Cost Savings by
2030, if bMI is Reduced by 5%
(cumulative)
Type 2 Diabetes 214,217 34,232 $690,000,000 65,087 $2,172,000,000
Obesity-related Cancers*
37,310 2,369 $82,000,000 4,521 $164,000,000
Coronary Heart Disease & Stroke
144,554 26,144 $989,000,000 55,556 $2,653,000,000
Hypertension 511,848 31,999 $149,000,000 53,677 $401,000,000
Arthritis 512,502 16,667 $191,000,000 30,746 $540,000,000
2010 baseline for potential cases, costs and savings
*National Heart Forum provided the total cases and cases avoided per 100,000 people, and TFAH used the state’s 2011 census datato translate to the full population-based estimates.
^Top obesity-related cancers include endometrial (uterine), esophageal, kidney, colon and post-menopausal breast caner.
Data Source: Robert Wood Johnson Foundation, Bending the Obesity Curve in Nevada Issues Brief (2012)
Return on Investment in Obesity prevention
In 2011, The American Heart Association published a review of over 200 studies that found most cardiovascular disease could be prevented or delayed through prevention strategies, programs and policies and direct medical care provision.xii Key findings include:xiii
• Every $1 spent on building biking trails and walking paths could save approximately $3 in medical expenses.
• For every $1 spent in wellness programs, companies could save $3.27 in medical costs and $2.73in absenteeism costs.
• Some interventions have been shown to help improve nutrition and activity habits in just one year and had a returnof $1.17 for every $1 spent.
• Participants in community-based programs focused on improving nutrition and increasing physical activity had a58% reduction in incidence of type 2 diabetes compared with drug therapy, which had a 31% reduction.
Total Predicted Costs
Total Predicted Costs with 5% BMI Rediccion

14
Obesity Across the LifespanChildhood Obesity
According to the American Heart Association, an estimated 1 in 3 American children and teens is overweight or obese, placing them at a greater risk of developing a variety of health problems that previously were not seen until adulthood, including high blood pressure, type 2 diabetes, elevated blood cholesterol levels, and excess weight at a young age that have been linked to higher and earlier death rates in adulthood. There are also psychological effects such as low self-esteem, negative body image and depression.xiv
In addition, a child who grows up overweight has a 70% chance of being overweight as an adult, and an 80% chance if at least one of their parents was also obese (U.S. Department of Health and Human Services 2011).xv
Obesity in children and adolescents is defined as a Body Mass Index (BMI) at or above the 95th percentile for children and teens of the same age and sex.xvi BMI is measured using a child’s height and weight and calculated using formulas and is expressed as a percentile, (http://www.whathealth.com/bmi/formula.html) which can be obtained from either a graph or a percentile calculator. Because weight, height, and their relation to body fatness change as children grow and develop, a child’s BMI must be interpreted relative to other children of the same sex and age. However, to determine if excess fat is a problem, further assessments such as skinfold thickness measurements, evaluations of physical activity, diet, family history, and other appropriate health screenings may be performed by the health care provider.
The fundamental causes of childhood overweight and obesity are attributable to environments that influence:
• A shift in diet towards increased intake foods that are high in fat and sugars but low in vitamins,minerals and other healthy nutrients; and
• A trend towards decreased physical activity levels due to the increasingly sedentary nature of manyforms of recreation time.
Furthermore, it is increasingly clear that the media, particularly TV, play an important role in the etiology of obesity. There are a number of ways that watching TV could be contributing to obesity: (1) increased sedentary activity and displacement of more physical pursuits; (2) unhealthy eating practices learned from both the programming and the advertisements for unhealthy foods; (3) increased snacking behavior while viewing; and (4) interference with normalsleep patterns.xvii
Unlike most adults, children and adolescents cannot choose the environment in which they live or the food they eat. They also have a limited ability to understand the long-term consequences of their behavior. Therefore, they require special attention when fighting the obesity epidemic, and prevention is a priority.
Childhood obesity is a growing problem in Nevada. According to the Nevada Division of Public and Behavioral Health:xviii
• 36.8% of children are overweight or obese
• 16.8% of children are overweight
• 20% of children are obese

15
Adult Obesity
The CDC states that more than one-third (34.9%) of all adults are considered obese.xix
Nevada’s adult obesity rate is 26.2%, up from 21.3% in 2004 and from 13.1% in 1995.xx
Graph 3: Adult Obesity prevalence in Nevada by year (2005-2013 bRFSS)
Note: BRFSS methodology changed in 2011, therefore, it may be misleading to compare statistics before and after methodology changes.
Source: Centers for Disease Control and Prevention (CDC). Behavioral Risk Factor Surveillance System Survey Data. Atlanta, Georgia: U.S.
Department of Health and Human Services, Centers for Disease Control and Prevention, 2005-2013.
Graph 4: Adult Obesity prevalence in Nevada by Race/Ethnicity (2013 bRFSS)
Source: Centers for Disease Control and Prevention (CDC). Behavioral Risk Factor Surveillance System Survey Data. Atlanta, Georgia: U.S. Department of Health and Human Services, Centers for Disease Control and Prevention, 2013.
35%
30%
25%
20%
15%
10%
5%
0%2005 2006 2007 2008 2009 2010 2011 2012 2013 HP 2020
21
.2%
24
.4%
25
.0%
25
.1%
24
.6%
26
.3%
25
.6%
26
.7%
26
.4%
26
.9%
23
.1%
27
.5%
24
.5%
27
.8%
26
.2%
27
.6%
26
.2%
29
.4%
30
.5%
Nevada
U.S. Median
60%
50%
40%
30%
20%
10%
0%White African
AmericanHispanic Other Race
26.4%
38.7%
26.1%
18.7%

16
For adults, overweight and obesity ranges are determined by using weight and height to calculate Body Mass Index (BMI). BMI is used because, for most people, it correlates with their amount of body fat. Overweight is defined as a BMI of 25 or higher; obesity is defined as a BMI of 30 or higher.xxi
Graph 5: Adults Who Are Overweight or Obese in Nevada BRFSS 2013

17
Overweight and obesity in adults can be caused by a variety of factors including behavioral, environmental, and genetic factors, and are a complex health issue to address.
• Overweight and obesity result from an energy imbalance, which involves eating too many calories and notgetting enough physical activity.
• Body weight is the result of genes, metabolism, behavior, environment, culture, and socioeconomic status.
• Behavior and environment play a large role and are the greatest areas for prevention and treatment actions.xxii
The health consequences for overweight and obesity in adults include the following:xxiii
• Coronary heart disease
• Type 2 diabetes
• Cancers (endometrial, breast, and colon)
• Hypertension (high blood pressure)
• Dyslipidemia (for example, high total cholesterol or high levels of triglycerides)
• Stroke
• Liver and Gallbladder disease
• Sleep apnea and respiratory problems
• Osteoarthritis (a degeneration of cartilage and its underlying bone within a joint)
• Gynecological problems (abnormal menses, infertility)
Graph 6: Adults Who Are Overweight or Obese in Nevada BRFSS 2013

18
lifespan Obesity
Overweight and obesity in youth are important public health concerns because childhood obesity increases the likelihood of adult obesity and associated health concerns. In fact, about 70% of obese adolescents grow up to become obese adults.xxiv
As mentioned earlier, children who are obese may experience health conditions that were once considered primarily adult problems, such as elevated blood cholesterol levels, increased blood pressure, and type 2 diabetes. When these conditions start in childhood, they can persist into adulthood and negatively affect lifelong health outcomes. For example, the younger a child falls into the obese category the earlier they fall into the diabetes category.xxv
Graph 7: Obesity-related Goal, Diabetes Diagnosis (New Cases)
Reduce the annual number of new cases of diagnosed diabetes in the population
9
8
7
6
5
4
3
2
1
7
6
5
4
3
2
1
9.0
7.2Current Rate
Target
Nevada State Rate 9.0 per 1,000
Healthy People 2020 Target 7.2 per 1,000
Data Source: Nevada Wellness website (http://nevadawellness.org/)
TARGET NOT ACHIEVED

19
In a 2010 article published in the Journal of Adolescent Health, researchers focused on the long-term impact of obesity prevention in adolescents. They postulated, “if current trends continue, one can anticipate in adults an even greater increase in obesity-related health problems and in obesity-related economic costs such as lost productivity, disability, morbidity, and premature death.”xxvi
Research was conducted using Bayesian and Monte Carlo simulations to predict the impact of a 1% reduction in both overweight and obese adolescents ages 16-17, which they predicted would amount to a reduction of 52,821 adults with obesity in the future. Additionally, findings indicated medical costs after age 40 would decrease by $586 million with an increase of 47,138 quality of life years after age 40.xxvii Overweight and obesity prevention and reduction efforts focused on adolescents promote healthy lifestyles in adulthood and therefore have impacts across the lifespan.
Figure 3: Overweight and Obesity Rates in Adolescents
29% or greater
25-28.9%
21-24.9%
Less than 21%
Incidence Rates displayed are reported from the Youth Risk
Behavioral Surveillance System for State of Nevada in 2013
http://www.cdc.gov/healthyouth/data/yrbs/index.html

20
Framework for Addressing Obesity in NevadaThe CDC’s Division of Nutrition, Physical Activity and Obesity (DNPAO) works to improve public health outcomes and prevent and control chronic disease through a public health framework that promotes nutrition and physical activity. It is within this framework that the state of Nevada is focusing its efforts in four critical areas:
Critical Area 1: Nutrition
Eating a healthy diet is a potent weapon against obesity and overweight. The Healthy Eating Plate was created by nutrition experts at Harvard School of Public Health and editors at Harvard Health Publications. It provides a simple format to help people make the best eating choices and was designed to address deficiencies in the U.S. Department of Agriculture’s (USDA) MyPlate. The main message of the Healthy Eating Plate is to focus on quality of the dietxxviii.
Eat a variety of whole grains (like whole-wheat bread, whole-grain pasta, and brown rice). Limit refined grains (like white rice and white bread).
The more veggies – and the greater the variety – the better. Potatoes and french fries don’t count. Eat plenty of fruits of all colors.
Choose fish, poultry, beans, and nuts;limit red meat and cheese; avoid bacon, cold cuts and other processed meats.
Use healthy oils (like olive and canola oil) for cooking, on salad, and at the table. Limit butter.Avoid trans fat.
Drink water, tea, or coffee (with little or nosugar). Limit milk/dairy (1-2 servings/day)and juice (1 small glass/day). Avoid sugary drinks.
OILS

21
The Healthy Eating Pyramid was also created by nutrition experts at Harvard School of Public Health. The Healthy Eating Plate and Healthy Eating Pyramid are meant to complement each other and summarize the best dietary information available today. Because nutrition researchers will undoubtedly turn up new information in the years ahead, the Healthy Eating Pyramid and the Healthy Eating Plate will change to reflect important new evidence.
The Healthy Eating pyramid
Unhealthy eating habits and poor diets for adults and children are similar. Poor eating habits include under- or over-eating, not having enough or eating enough of the healthy foods needed each day, or consuming too many unhealthy types of food and drink, which are low in fiber or high in fat, salt and/or sugar. These unhealthy eating habits can affect the proper nutrient intake.
Healthy nutrition is especially critical for children as healthy eating habits are developed early in life. The CDC has found that American children are eating more fruit today but are still not getting enough.
• 6 in 10 children didn’t eat enough fruit in 2007-2010.
• As children get older, they eat less fruit.
Use Sparingly:Red meat and butterRefined grains: white bread, rice and pastaSurary drinks and sweetsSalt
Dairy (1-2 servings a day) or vitamin D/calcium supplemtns
Whole grainsVegetables and fruitsHealthy fats
and oils
Fish, poultry and eggs
Drink 8 cups of water a dayWeight controlDaily exercise
Nuts, beans, seeds and tofu
Healthy Fats/Oils:Olive, canola, soy, corn, sunflower, peanut, and other vegetable oils; trans-free margarine

22
• Most children need to eat more vegetables.
• 9 in 10 children didn’t eat enough vegetables in 2007-2010.
• Children should eat a variety of colorful vegetables prepared in healthy ways.
• About 1/3 of vegetables children ate in 2009-2010 were white potatoes, most (63%) of which were eaten asfried potatoes, such as French fries, or as chips.xxx
Nevada spends the most per capita on fast food -- nearly $940 per person per year. This is roughly 25% more than Texas, the second-worst state, and well more than twice what Vermont residents spend. As might be expected, the state ranks in the bottom 10 for both households with no cars and low-income populations, defined as people with income less than 200 percent of the federal poverty thresholds, and proximity to grocery stores. Nevada’s obesity and diabetes rates, are above average.
• Grocery Stores Per 1,000 Residents: 0.23 (29th)
• Amount Spent on Fast Food Per Capita: $939 (most)
• Gallons of Soft Drinks Purchased Per Capita: 58 (10th least)
• Pounds of Sweet Snacks Purchased Per Capita: 114 (19th least)xxxi
Graph 8: Adults in Nevada Who Do Not Consume 5 or More Fruits and Vegetables Per Day, BRFSS, 2011
Data Source: The Burden of Chronic Disease Nevada
Department of Health and Human Services, Division of Public and Behavioral Health, Chronic Disease Section, April 2013

23
Critical Area 2: physical Activity
Daily physical activity is an important part of controlling weight and preventing obesity and overweight. Data showing the benefits of physical activity include:xxxii
• Weight control
• Reduction in risk of cardiovascular disease
• Reduction in risk for type 2 diabetes and metabolic syndrome
• Reduction in risk of some cancers
• Strengthening of bones and muscles
• Improvement of mental health and mood
• Improvement of ability to do daily activities and prevent falls, if you’re an older adult
• Increased chances of living longer
Graph 9: The Risk of Dying prematurely Declines as people become physically Active
1.2
1.0
0.8
0.6
0.4
0.2
0.00 60 120 180 240 300 360 420
Rel
ativ
e R
isk
Minutes per week of moderate- or vigorous-intensity physical activity

24
TAblE 4: HEAlTH bENEFITS ASSOCIATED WITH REGUlAR pHySICAl ACTIVITyChildren and Adolescents Strong Evidence:
• Improved Cardiorespiratory and muscular fitness
• Improved bone health
• Improved cardiovascular and metabolichealth biomarkers
• Favorable body composition
Moderate Evidence:
• Reduced symptoms of depression
Adults and Older Adults Strong Evidence:
• Lower risk of early death
• Lower risk of coronary heart disease
• Lower risk of stroke
• Lower risk of high blood pressure
• Lower risk of adverse blood lipid profile
• Lower risk of type 2 diabetes
• Lower risk of metabolic syndrome
• Lower risk of colon cancer
• Lower risk of breast cancer
• Prevention of weight gain
• Weight loss, particularly when combined withreduced calorie intake
• Improved cardiorespiratory and muscular fitness
• Prevention of falls
• Reduced depression
• Better cognitive function (for older adults)
Moderate to Strong Evidence:
• Better functional health (for older adults)
• Reduced abdominal obesity
Moderate Evidence:
• Lower risk of hip fracture
• Lower risk of lung cancer
• Lower risk of endometrial cancer
• Weight maintenance after weight loss
• Increased bone density
• Improved sleep quality
Note: The Advisory Committee rated the evidence of health benefits of physical activity as strong, moderate, or weak. To do so, the Committee considered the type, number, and quality of studies avialble, as well as consistency of findings across studies that addressed each outcome. The Committee also considered evidence for causality and dose response in assigning the strength-of-evidence rating.

25
For substantial health benefits, the Centers for Disease Control and prevention recommends that adults need to do at least:xxxiv
• 2 hours and 30 minutes (150 minutes) each week of moderate intensity*aerobic activity OR
• 1 hour and 15 minutes (75 minutes) each week of vigorous-intensityaerobic activity OR
• An equivalent mix of moderate and vigorous-intensity* aerobic activity.
• Aerobic activity should be performed for at least 10 minutes at a time, preferably,spread throughout the week.
*Intensity is the level of effort required to do an activity.
The CDC recommends children and adolescents do one hour (60 minutes) or more of physical activity daily, with most of the activity consisting of aerobic exercise at moderate or vigorous intensity. Children and adolescents should include vigorous intensity exercise at least 3 days a week.xxxiv
In addition, the Physician’s Activity Guideline for Americans provides guidance on activity for children, adolescents and adults, as well as older adults and persons with disabilities. For more information, please visit http://www.health.gov/paguidelines/pdf/paguide.pdf.
In Nevada, the data shows that many residents are not engaging in enough physical activity every week. According to the 2013 Burden of Chronic Disease in Nevada Report:xxxv
• 24% of all Nevadans did not engage in extracurricular physical activity adjunct to their job which is underthe national average (26%).
• There was a higher prevalence of Blacks (29%) and Hispanics (30%) who did not engage in extracurricularphysical activity compared to Whites (21%).
• Non-job related physical activity declined as people aged with the highest prevalence of people 55+ (59%)not engaged in extracurricular physical activity.
• A lack of engagement in non-job related physical activity was correlated with education and income attainment.The prevalence was highest with those with less than a high school degree (32%) and for those who made lessthan $15,000 per year (36%).
• There was a higher prevalence of those in Clark County (25%) who did not engage in extracurricular physicalactivity for their job compared to Washoe County (19%).

26
Graph 10: Adult physical Inactivity prevalence
Adults who did not participate in any physical activity during the past month by Year, 2005-2013 BRFSS Data.
Note: BRFSS methodology changed in 2011, therefore, it may be misleading to compare statistics before and after methodology changes.
Source: Centers for Disease Control and Prevention (CDC). Behavioral Risk Factor Surveillance System Survey Data. Atlanta, Georgia: U.S.
Department of Health and Human Services, Centers for Disease Control and Prevention, 2005-2013.
Graph 11: Adult physical Inactivity prevalence by Race/Ethnicity (2013 bRFSS)
Adults who did not participate in any physical activity during the past month by Race/Ethn, 2005-2013 BRFSS Data.
Source: Centers for Disease Control and Prevention (CDC). Behavioral Risk Factor Surveillance System Survey Data. Atlanta, Georgia: U.S. Department of Health and Human Services, Centers for Disease Control and Prevention, 2013.
35%
30%
25%
20%
15%
10%
5%
0%2005 2006 2007 2008 2009 2010 2011 2012 2013 HP 2020
26
.8%
23
.8%
27
.1%
22
.6%
24
.4%
22
.6%
27
.6%
24
.6%
24
.4%
23
.8%
23
.0%
23
.9%
24
.3%
26
.2%
21
.3%
22
.9%
23
.7%
25
.3%
32
.6% Nevada
U.S. Median
50%
45%
40%
35%
30%
25%
20%
15%
10%
5%
0%White African
AmericanHispanic Other Race
23.4%
36.0%
20.4%24.2%

27
Critical Area 3: breastfeeding Support
Studies have not proven an obesity prevention benefit of breastfeeding, but other overall health benefits for the infant and the mother are clear, and therefore, breastfeeding should be encouraged.xxxvi However, including breastfeeding as a critical focus area is important to promoting optimal public health outcomes for children and adults in the United States. The Surgeon General states breastfeeding is one of the most highly effective preventative measures a mother can take to protect the health of herself and her infant.xxxvii In addition, breastfeeding may help a mother to regain her healthy weight after giving birth.xxxix
Research suggests breastfed babies have the cells, hormones, and antibodies in breastmilk that protect babies from illness, and therefore, babies may have lower risks of:xl
• The cells, hormones, and antibodies in breast milk protect babies from illness
• Asthma
• Childhood leukemia
• Childhood obesity
• Ear infections
• Eczema (atopic dermatitis)
• Diarrhea and vomiting
• Lower respiratory infections
• Necrotizing enterocolitis, a disease that affects the gastrointestinaltract in pre-term infants
• Sudden infant death syndrome (SIDS)
• Type 2 diabetes
Breastfeeding helps a mother’s health following childbirth and may lead to a lower risk of health problems in mothers such as:xli
• Type 2 diabetes
• Certain types of breast cancer
• Ovarian cancer
Critical Area 4: Screen and Media Time
Studies have confirmed the link between TV viewing and “screen time” and obesity in children and adults, and the evidence is clear that early TV viewing habits have lasting effects.xlii, xliii In fact, two studies tracked children from birth and demonstrated that TV viewing in childhood predicted obesity long into adulthood and midlife.xliv, xlv
There are multiple ways screen time and TV watching are considered to contribute to to obesity:xlvi
• By increasing sedentary time and displacing time spent on other physical activities
• Through unhealthy eating practices learned from both programming and advertisements for unhealthy foods
• Increased snacking while viewing
• Interference with normal sleep patterns
The power of Marketing: Compare the Commitment of the Robert Wood Johnson Foundation to spend $100 million per year working to decrease childhood obesity with the fact that the food industry spends more than that every month marketing primarily junk food and fast food to young people.xlvii, xlviii,
U.S. Median

28
The U.S. Community Preventative Services Task Force recommends behavioral interventions to reduce recreational screen time for children under the age of 13.xlix In addition, the American Academy of Pediatrics (AAP) recommends no more than two hours per day of screen time for children two years and older and none for children younger than two years.l
Adults who watch more television are at higher risk of developing weight-related chronic diseases such as diabetes, according to the large scale Nurses Health Study. This study found for every two hours the women spent watching TV each day, their risk of becoming obese rose 23% and their risk of developing diabetes rose 14%.li
As smart phones, tablets and computers take up more and more of the average adult’s time, the effects of sitting begin to take a toll. Evidence is showing that too much time sitting, at home or at work, increases the risk of becoming obese and even the risk of chronic disease and early death.lii The bottom line is for children and adults, moving more and sitting less is critical.
Focus Area 1: Childhood ObesityThe state of Nevada has made a commitment to reduce the rate of obesity among Nevada children. Many of the initiatives included as critical components to preventing and reducing obesity within this population were discussed in the previous section. Table 5 below provides updated data from the Health Status of Children Entering Kindergarten in Nevada on some of these critical components from the 2011-2012 and 2012-2013 school years.
TAblE 5: HEAlTH STATUS COMpARISIONS (2011/2012 TO 2012/2013)2011-2012 2012-2013 % Change *
Weight Status
Underweight 14.9% 15.4% +3.4% s
Healthy 54.3% 54.9% +1.1% s
Overweight/Obese 30.8% 29.6% -3.9% t
physical Activity<3 days per week of 30-minutes of physical activity
17.7% 19.0% +7.3% s
Television Viewing on School Days
2 hours or less of television watched per school day
78.4% 80.0% +2.0% s
3 hours or more of television watched per school day
21.6% 20.0% -7.4% t
Computer/Video Game play on School Days
<1 hour of computer/video games played per school day 90.3% 89.4% -1.0% t
Consumption of Non-Diet Soda
Never drink non-diet soda 55.0% 55.8% +1.5% s
Drink non-diet soda once a day or more 10.8% 10.3% -4.6% t
Consumption of Diet Soda
Never drink diet soda 82.0% 83.0% +1.2% s
Drink diet soda once a day or more 3.3% 2.8% -15.2% t
Infant Feeding behaviors
Breastfed Only - One Month – 47.3% – –
Breastfed Only - Three Months – 33.6% – –
Breastfed Only - Six Months – 23.2% – –
Note: *Green arrows = positive change, red arrows = negative change, and yellow arrows = no change (< + .5%). – indicates data was not available in previous years.
Data Source: Health Status of Children Entering Kindergarten in Nevada, UNLV (April 2013)

29
One of the more recent additions to this list is Infant Feeding Behaviors. The importance of breastfeeding was discussed previously as Critical Area 3: Breastfeeding Support. Many of the data points presented in Table 7 indicate a positive trend in the reduction and prevention of obesity among Nevada children; however, there are a growing number of Nevada children who are considered underweight as compared to the previous school year.
Nevada’s commitment to the reduction and prevention of obesity focuses on reducing or eliminating television hours for children under five and specifically under age two. The University of Nevada Las Vegas conducted a survey of Nevada children entering kindergarten, which is published in a report entitled Health Status of Children Entering Kindergarten in Nevada. The report found that Nevada children watch more television than the nationwide comparison as shown in Table 6. Screen and media time have been determined as critical areas to address for children by the American Academy of Pediatrics as discussed previously in Critical Area 4: Screen and Media Time.
Another focus area for obesity reduction and prevention among Nevada children is physical activity. The 2013 data from the Health Status of Children Entering Kindergarten in Nevada report indicates healthy weight children are participating in physical activity at a higher rate than children considered to be underweight, overweight, and obese (Graph 12).
Graph 12: Child’s Weight Status Category by Amount of physical Activity per Week(2012/2013 n=3,450)
0-1 TimesPer Week
2-3 TimesPer Week
4-5 TimesPer Week
6-7 TimesPer Week
Underweight 16.7% 14.8% 13.3% 16.5%Healthy Weight 37.9% 49.3% 55.9% 56.3%Overweight 15.2% 11.0% 12.2% 11.3%Obese 30.3% 24.9% 18.8% 16.0%Total 100% 100% 100% 100%*Total % Valid BMI 1.7% 12.9% 24.6% 60.5%
0.0%
10.0%
20.0%
30.0%
40.0%
50.0%
60.0%
Note: These findings are significant at p< .001.* indicates percentages are calculated out of the total number of Valid BMI responses in each category for the amount of physical activity.
Data Source: Health Status of Children Entering Kindergarten in Nevada, UNLV (April 2013)
TABLE 6: AVERAGE TELEVISION WATCHED DURING A WEEK None 1 hour or less Between 1 & 4 hours 4 hours or more
Nationwide 7.9% 37.7% 41.6% 12.8%
Nevada 6.1% 28.8% 49.1% 16.0%
Kindergarten Health Survey 1.9% 42.0% 50.9% 5.3%
Data Source: Health Status of Children Entering Kindergarten in Nevada, UNLV (April 2013) Note: Nationwide/Nevada data source: http://childhealthdata.org/browse/survey/results?g=869&r=1&r2=30

30
While children considered to be of a healthy weight are significantly more active in each of the categories displayed in Graph 12 on the previous page, the data also indicates children with obesity are the second most active group of children in terms of BMI groupings.
The 2013 UNLV report findings indicate that obesity rates have decreased over the past few school years (Graph 13). Obesity rates among kindergarten-aged Nevadans peaked in the 2010-2011 school year at 21.7%. While the reduced percentage of overweight or obese children indicates progress has been made, there has been a growing number of underweight children. In 2012-2013 school year, 15.4% of Nevada kindergartners were found to be underweight as compared to 14.9% in the previous school yearliii.
Graph 13: Child’s Weight Status Category (2008/2009-2012/2013) (2008/2009 n=3,262; 2009/2010 n=3,659; 2010/2011 n=4,198; 2011/2012 n=3,5096; 2012/2013 n=3,450)
The efforts to decrease obesity and overweight rates appear to be succeeding among Nevada children, but there are some data points that will need to be monitored in the future.
10.8
%
57. 0
%
15.4
% 16. 7
%
15.5
%
53. 4
%
11. 9
% 19. 2
%
15. 0
%
51. 5
%
11. 9
% 21.7
%
14. 9
%
54.3
%
11.3
% 19.5
%
15. 4
%
54.9
%
11.5
% 18. 1
%
0.0%
10.0%
20.0%
30.0%
40.0%
50.0%
60.0%
Underweight Healthy Weight Overweight Obese
2008-2009 School Year Survey 2009-2010 School Year Survey
2010-2011 School Year Survey 2011-2012 School Year Survey
2012-2013 School Year Survey
Data Source: Health Status of Children Entering Kindergarten in Nevada, UNLV (April 2013)

31
Focus Area 2: School HealthIn an effort to reduce and prevent obesity in Nevada, the state has made a commitment to improve school health across the Silver State. Nevada Wellness reports that over 400,000 liv students enroll in the Nevada public school systems annually, which increases the importance of having school health programs available to school districts and schools across the state. Included in school health efforts are initiatives to provide healthy meal options for students, physical education classes, and sports and extracurricular activities. Additionally, these programs promote healthy choices outside of school to help students decrease screen and media time, engage in physical activity and choose healthy options for snacks, meals and beverages. Many of these programs and resources can be found on the Nevada Wellness website at http://nevadawellness.org.
“Children attend school for more than six hours per day and approximately 180 days per year. During that time children learn many things and Physical Education is important to make sure that children learn healthy life habits.”lv
Nevada Wellness presents a coordinated school health effort for Nevada, which includes eight main components:
• Health Education
• Physical Education
• Health Services
• Nutrition Services
• Counseling, Psychological and Social Services
• Healthy and Safe School Environment
• Health Promotion for Staff
• Family/Community Involvementlvi

32
The Youth Behavior and Risk Surveillance Survey (YRBSS) is utilized nationally to conduct surveys of adolescents and youth, which includes questions about health-related choices. The 2013 data for Nevada youth in terms of self-reported overweight and obesity is displayed in Table 7 below.
TAblE 7: NEVADA ObESITy AND OVERWEIGHT DEMOGRApHICS (yRbSS 2013)
Count Obese
percent Obese
Confidence Intervals Obese
Count Overweight
percent Overweight
Confidence Intervals
Overweight
Overall Total Total 428 11.5% (10.1-13.0) 549 14.9% (13.3-16.5)
SexFemale 181 8.0% (6.4-9.6) 274 15.1% (12.9-17.4)
Male 247 15.2% (12.8-17.5) 275 14.7% (12.4-16.9)
Age
14 years old or younger
38 10.8% (6.8-14.7) 58 16.4% (11.6-21.2)
15 years old 103 11.8% (8.9-14.7) 133 13.9% (11.0-16.8)
16 years old 136 12.8% (10.0-15.6) 172 16.2% (13.2-19.2)
17 years old 99 10.2% (7.4-13.1) 120 13.0% (9.9-16.1)
18 years old or older
52 11.5% (7.2-15.9) 66 16.1% (11.1-21.1)
Race/Ethnicity
American Indian/Alaskan Native
17 14.6% (5.3-24.0) 19 25.0% (12.0-38.0)
Asian 7 8.8% (2.6-15.0) 14 11.4% (4.7-18.2)
Black or African American
23 16.9% (10.2-23.6) 29 17.1% (10.6-23.6)
White 147 8.1% (6.2-10.0) 170 9.1% (7.1-11.0)
Hispanic/Latino 190 13.9% (11.5-16.4) 259 19.4% (16.6-22.2)
Other/Multiple 32 10.0% (5.3-14.6) 41 14.9% (9.3-20)
Data Source: Youth Risk and Behavior Surveillance Survey 2013 Report
The percentage of youth who self-reported as overweight or obese is approximately 26.4% from this 2013 survey, which is slightly higher than adult obesity and overweight rates of 26.2% (BRFSS 2013) and just over 3% lower than children five and under as presented in the previous section. The YRBSS data indicates that almost 38% of Nevada youth play video or computer games more than three hours a day. Additionally, the data shows that over 30% of Nevada youth watch more than three hours of television a day. Detailed data about differences in video and computer games as well as television watching is presented in Table 8.

33
TAblE 8: NEVADA SCREEN AND MEDIA TIME DEMOGRApHICS, MORE THAN 3 HOURS DAIly (yRbSS 2013)
Video or Computer
Gamespercent
Confidence Intervals
Television percentConfidence
Intervals
Overall Total Total 1,358 37.9% (35.8-40.1) 1,117 30.2% (28.2-32.2)
SexFemale 657 34.7% (31.8-37.6) 568 29.8% (27.0-32.5)
Male 701 41.4% (38.2-44.6) 549 30.7% (27.7-33.6)
Age
14 years old or younger
114 31.8% (25.7-37.9) 118 30.6% (11.6-21.2)
15 years old 354 36.4% (32.2-40.6) 250 27.1% (23.2-30.9)
16 years old 385 36.9% (32.9-40.9) 340 30.7% (26.9-34.5)
17 years old 326 41.8% (37.2-46.5) 269 32.2% (27.8-36.6)
18 years old or older
181 42.0% (35.5-48.5) 143 31.0% (24.9-37.0)
Race/Ethnicity
American Indian/Alaskan Native
26 47.8% (31.9-63.7) 25 18.4% (9.9-26.8)
Asian 53 46.1% (36.0-56.3) 32 29.4% (20.0-38.8)
Black or African American
57 38.9% (30.2-47.6) 65 44.3% (35.5-53.1)
White 562 35.1% (31.8-38.5) 408 23.9% (20.9-26.9)
Hispanic/Latino 513 38.0% (34.5-41.4) 479 32.3% (29.0-35.5)
Other/Multiple 119 41.9% (34.3-49.6) 82 32.7% (25.4-40.1)
Data Source: Youth Risk and Behavior Surveillance Survey 2013 Report
The YRBSS 2013 data also provides findings related to diet and eating habits. As presented in Table 8 above, there are approximately 11.5% of Nevada high school students who are obese, however, 50.0% of high school students reported they are currently trying to lose weightlvii. A healthy diet and regular physical activity are both critical to preventing and reducing obesity as well as promoting healthy lifestyles for Nevadans. Results from the YRBSS 2013 data for both diet and physical activity are displayed below.
Diet and Eating Habits of Nevada youth (yRbSS 2013)• 58.0% of high school students ate fruit or drank 100% fruit juices one or more times per day during the 7 days
before the survey.
• 81.5% of high school students ate vegetables one or more times per day during the 7 days before the survey.
• 33.8% of high school students drank one or more glasses of milk per day during the 7 days before the survey.
• 16.2% of high school students drank soda or pop one or more times per day during the 7 days before the survey.
• 34.5% of high school students ate breakfast all 7 days before the survey.
physical Activity Habits of Nevada youth (yRbSS 2013)• 43.8% of high school students were physically active at least 60 minutes per day on five or more days during
the seven days before the survey.
• 37.9% of high school students played video or computer games or used a computer for three or more hours perday on an average school day.
• 30.2% of high school students watched television three or more hours per day on an average school day.
• 52.5% of high school students attend physical education (PE) classes on one or more days in an average weekwhen they were in school.

34
The efforts to decrease obesity and overweight rates appear to be succeeding among Nevada youth, but similar to the data presented in Focus Area 1: Childhood Obesity, there is still more work to be done and data points that will need to be monitored in the future.
Focus Area 3: Worksite WellnessThe state of Nevada is committed to helping make Nevada a healthier state by promoting healthy lifestyles and provid-ing health-related programs across the state.
According to the Centers for Disease Control and Prevention, employees benefit from worksite wellness programs through reducing their risk of developing disabling or life-threatening conditions and reducing the economic burden associated with them, as well as increasing their quality of life. Additionally, strong worksite wellness programs help to reduce risk and promote safety at work.lviii
Employers benefit through the provision of worksite wellness programs through enhanced productivity, decreased employee absenteeism and reduced health insurance and workers compensation costs. Employers can help to create a culture of wellness, and increasingly, worksite wellness programs are being seen as an employee benefit or compensation and retention strategy.lix
Overview of potential benefits of workplace health programs to employers and employees
For Employers:• Lower health care and disability costs
• Enhanced employee productivity
• Reduced employee absenteeism
• Decreased rates of illness and injuries
• Enhanced corporate image
• Improved employee morale
• Improved employee recruitment and retention
• Increased organizational commitment and creation of a culture of health
For Employees:• Increased well-being, self-image, and self-esteem
• Improved coping skills with stress or other factors affecting health
• Improved health status
• Lower costs for acute health issues
• Lower out-of-pocket costs for health care services (e.g., reduced premiums; deductibles; co-payments)
• Increased access to health promotion resources and social support
• Improved job satisfaction
• Safer and more supportive work environment

35
The state of Nevada is committed to promoting wellness in the workplace, and as part of that commitment, Nevada Wellness (http://nevadawellness.org), a state website to promote health and wellness, was created to provide resources for Nevadans.
Figure 4: Nevada Worksite Wellness Homepage
Figure 5: Nevada Worksite Wellness Website Nagvigation
Figure 6: Nevada Worksite Wellness, Wellness and the Bottom Line
Here are some key benefits of wellness program:• Decreased health care needs
• Provide a return on investment
• Increased productivity
• Reduced absenteeism
• Improve morale and retain key staff
Data Source: http://nevadawellness.org
Data Source: http://nevadawellness.org
Data Source: http://nevadawellness.org
36
The Nevada Worksite Wellness homepage, as shown in Figure 4 on the pervious page, has specific pages that focus on encouraging Nevada employers to provide programs and services to employees. The Worksite Wellness homepage has a variety of resources for worksite wellness, including a toolkit and physical activity information, as well as other health screening and program information (Figure 6).
Employers across the state are encouraged to access Nevada Wellness and utilize the toolkit and other resources available to help improve health in the state. There are numerous reasons for employers to get involved in the promotion of healthy lifestyles for employees. Nevada Wellness reports that worksite wellness programs have been shown to provide a number of benefits to employers, some of which are displayed in Graph 14. Employers are encouraged to access http://nevadawellness.org to learn more about worksite wellness and available resources from the state of Nevada.
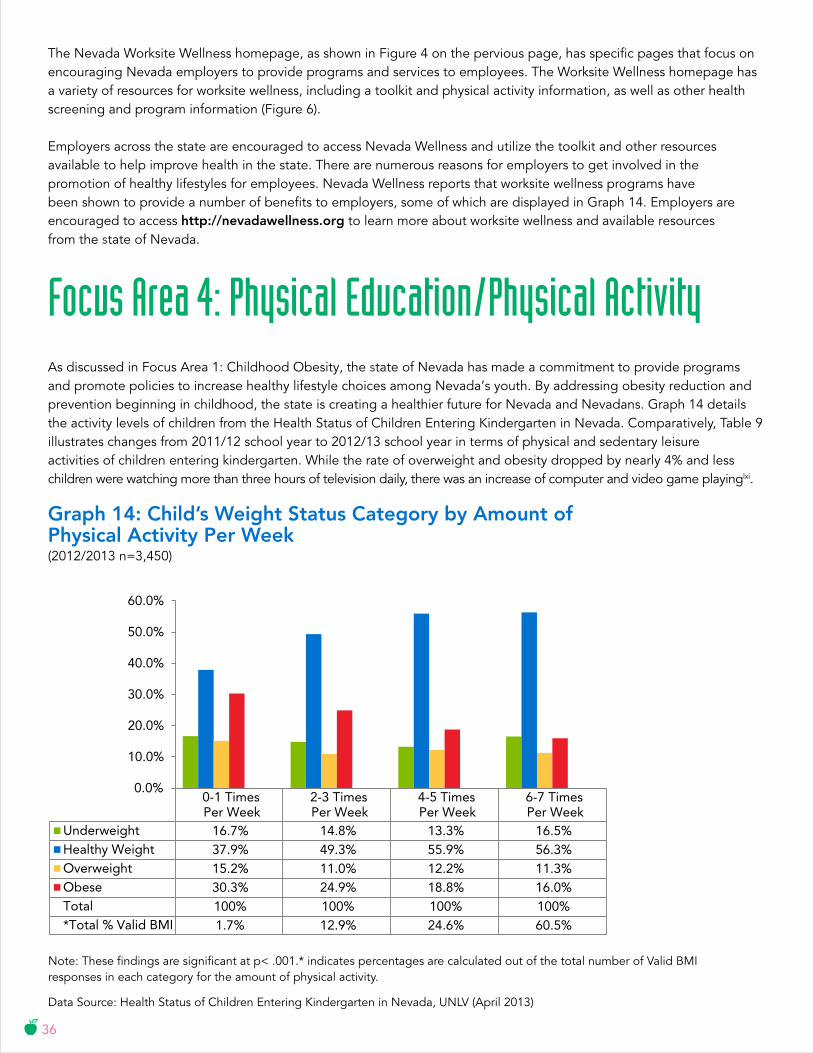
Focus Area 4: Physical Education/Physical ActivityAs discussed in Focus Area 1: Childhood Obesity, the state of Nevada has made a commitment to provide programs and promote policies to increase healthy lifestyle choices among Nevada’s youth. By addressing obesity reduction and prevention beginning in childhood, the state is creating a healthier future for Nevada and Nevadans. Graph 14 details the activity levels of children from the Health Status of Children Entering Kindergarten in Nevada. Comparatively, Table 9 illustrates changes from 2011/12 school year to 2012/13 school year in terms of physical and sedentary leisure activities of children entering kindergarten. While the rate of overweight and obesity dropped by nearly 4% and less children were watching more than three hours of television daily, there was an increase of computer and video game playinglxi.
Graph 14: Child’s Weight Status Category by Amount of physical Activity per Week(2012/2013 n=3,450)
0-1 TimesPer Week
2-3 TimesPer Week
4-5 TimesPer Week
6-7 TimesPer Week
Underweight 16.7% 14.8% 13.3% 16.5%Healthy Weight 37.9% 49.3% 55.9% 56.3%Overweight 15.2% 11.0% 12.2% 11.3%Obese 30.3% 24.9% 18.8% 16.0%Total 100% 100% 100% 100%*Total % Valid BMI 1.7% 12.9% 24.6% 60.5%
0.0%
10.0%
20.0%
30.0%
40.0%
50.0%
60.0%
Note: These findings are significant at p< .001.* indicates percentages are calculated out of the total number of Valid BMI responses in each category for the amount of physical activity.
Data Source: Health Status of Children Entering Kindergarten in Nevada, UNLV (April 2013)

37
TAblE 9: HEAlTH STATUS COMpARISIONS, pHySICAl AND SEDENTARy ACTIVITy (2011/2012 TO 2012/2013)
2011-2012 2012-2013 % Change *
Weight Status
Underweight 14.9% 15.4% +3.4% s
Healthy 54.3% 54.9% +1.1% s
Overweight/Obese 30.8% 29.6% -3.9% t
physical Activity<3 days per week of 30-minutes of physical activity
17.7% 19.0% +7.3% s
Television Viewing on School Days
2 hours or less of television watched per school day
78.4% 80.0% +2.0% s
3 hours or more of television watched per school day
21.6% 20.0% -7.4% t
Computer/Video Game play on School Days
<1 hour of computer/video games played per school day 90.3% 89.4% -1.0% t
Note: *Green arrows = positive change, red arrows = negative change, and yellow arrows = no change (< + .5%). – indicates data was not available in previous years.
Data Source: Health Status of Children Entering Kindergarten in Nevada, UNLV (April 2013)
As presented in Focus Area 2: School Health, there are a number of resources available to Nevadans. Nevada Wellness has resources about physical activity including recommendations available online, and schools across the state are coordinating to offer physical education and other health-related programs and services to encourage Nevada’s youth to engage in physical activity and other healthy lifestyles. Data from YRBSS in 2013 indicates that 56% of Nevada high school students participate in Physical Education as least once a week as shown in Graph 15. While students are participating at just above 50% in school offered physical education, only 23% of respondents from Nevada reported no participation in physical activity on a weekly basis (Graph 16).
Graph 15: physical Education levels Among Nevada Adolescents (yRbSS 2013)
23%
44%
33%
No Physical Education
Physical Education Attendance
Physical Education Daily

38
Participation rates were different between males and females with approximately 54.3% of females not participating in physical education as compared to 40.3% of male students. In YRBSS, Race/Ethnicity data about physical activity and education participation rates were also reported to decrease as students aged, with participation rates of 14 year olds and younger at 84.9%, as compared to 26.2% for 18 year olds and older. Rates of physical activity followed a similar trajectory for students across ages with 14 year olds and younger having the highest participation in five days or more of 60 minutes of physical activity at 53.1% as compared to 32.0% of 18 year olds and older with decreased participation rates occurring at each age group in between. Similarly, rates of physical inactivity were reported in the older populations with 22.4% of students 18 years or older reporting no physical activity as compared to 11.3% of 14 year olds and youngerlxii. While Nevada is providing programs and opportunities to students throughout their public education, there is a distinct decrease in participation in physical education and physical activity as students age and get closer to adulthood. With participation rates decreasing as reported in the YRBSS 2013 data, there is an even greater need to continue to offer opportunities to engage in physical activity to adults in the workforce.
The state goal from Healthy People 2020 to reduce the rate of adults with no leisure time activity is currently being met, however, there are specific populations of Nevadans as depicted in Graph 17 whose inactivity rates still fall well above the target of 24%. Inactivity rates amongst Nevada adults have been reported at levels below the national average, however, inactivity rates increased in Nevada from 21.3% in 2012 to 23.7% in 2013lxiii. Data presented indicate there is more to be done, especially within the African American communities in Nevada, to provide more opportunities to engage in leisure activities and promote physical activity and healthy lifestyle options.
Graph 16: physical Activity levels Among Nevada Adolescents (yRbSS 2013)
41%23%
36%
No Physical Activity
60 Minutes for 5 Days a Week
60 Minutes for 7 Days a Week

39
Conclusion and Call to ActionNevada has made progress in the effort to reduce and prevent obesity across the Silver State. The commitments to childhood obesity, school health, worksite wellness and physical education/physical activity are progressing, but there is still more to be done and everyone has a role to play in preventing obesity and promoting healthy lifestyles in Nevada. Find out more about what you can do to combat obesity in Nevada:
If you are a Nevadan, you can:
• Know your Body Mass Index (BMI)
• Eat a healthy diet filled with fruits and vegetables
• Be physically active
• Breastfeed your baby, and support breastfeeding mothers
• Limit screen time for you and your children
If you are a Community or Faith based Organization, you can:
• Provide healthy lifestyle education and reach out to underserved communities
• Promote annual physical screenings and partner with primary care providers to increase access
If you are a School District or University, you can:
• Educate students about healthy lifestyle choices, including healthy diet and exercise
• Provide healthy foods in vending machines and on-site cafeterias
• Encourage children to drink water in place of soda or sugar-sweetened beverages before, during and after school
• Encourage involvement in after-school activities and/or health and wellness programs
• Increase the amount of time students are moderately to vigorously physically active during physical education classes
• Create a Local School Wellness Policy to promote student health and reduce obesity
22
20
18
16
14
24Current Rate
24Target
22
20
18
16
14
Nevada State Rate 24%
Healthy People 2020 Target 24%
Data Source: Nevada Wellness website (http://nevadawellness.org/)
TARGET ACHIEVED
Graph 17: Obesity Related Goal, leisure Activity
Reduce the proportion of adults who engage in no leisure-time activity

40
If you are an Employer, you can:
• Offer healthy meals, snacks and foods on site
• Incentivize physical activity and healthy living through workforce programs
• Provide health insurance to all employees
• Support breastfeeding in the workplace
• Find information, resources and step-by-step toolkits to help improve the health of your employees through the CDC’s Healthier Worksite Initiative
If you are a Hospital, you can:
• Incorporate breastfeeding-friendly practices and education programs into the prenatal and postpartum continuum of care.
• Collaborate with community providers to increase availability of resources and healthy options, especially for underserved populations
• Improve work environments to support the health of your employees and embody the mission of your organization
If you are physician or Health Insurance Agency, you can:
• Encourage patients to have yearly physical exams including lab-work according to the most current best practice guidelines
• Implement a patient-centered, healthy lifestyle reminder system
• Refer patients to smoking cessation supports
• Educate about opportunities to participate in clinical trials to interested patients
If you are an Elected Official or policy Maker, you can:
• Make obesity prevention a policy priority through legislation and administrative change
• Support adequate funding of school-based programs in the form of healthy food and drink choices available to students and physical activity or after school programs
• Participate in state workplace wellness efforts and help to align systems and services and reduce service duplication and improve outcomes for all Nevadans
• Support policies that reduce disparities in health care provision and improve access to care

41
ResourcesThis publication was supported by the Nevada State Division of Public and Behavioral Health through Grant Number 3U58DP004820-02W1 from the Centers for Disease Control and Prevention. Its contents are solely the responsibility of the authors and do not necessarily represent the official views of neither Division nor the Centers for Disease Control and Prevention.
Acknowledgements
Authored by Strategic Progress, LLC. Designed by Canyon Creative.
iMackun, P., & Wilson, S. (2011). Population Distribution and Change: 2000 to 2010. 2010 Census Briefs. Retrieved from http://www.census.gov/prod/cen2010/briefs/c2010br-01.pdf
iiGriswold, T., Packham, J., Etchegoyhen, L., & Marchand, C. (2015). Nevada Rural and Frontier Data Book – Seventh Edition. University of Nevada School of Medicine Rural Health Report. Retrieved from http://medicine.nevada.edu/Documents/unsom/statewide/rural/ data-book-2015/Nevada_Rural_and_Frontier_Health_Data_Book_2015DraftEmbedOpt.pdf
iiiGriswold, T., Packham, J., Etchegoyhen, L., & Marchand, C. (2015). Nevada Rural and Frontier Data Book – Seventh Edition. University of Nevada School of Medicine Rural Health Report. Retrieved from http://medicine.nevada.edu/Documents/unsom/statewide/rural/ data-book-2015/Nevada_Rural_and_Frontier_Health_Data_Book_2015DraftEmbedOpt.pdf
ivOffice of the Surgeon General (US); Office of Disease Prevention and Health Promotion (US); Centers for Disease Control and Prevention (US); National Institutes of Health (US). The Surgeon General’s Call To Action To Prevent and Decrease Overweight and Obesity. Rockville (MD): Office of the Surgeon General (US); 2001. Section 1: Overweight and Obesity as Public Health Problems in America. Available from: http://www.ncbi.nlm.nih.gov/books/NBK44210/
vBehan, D. and Cox, S. “Obesity and its Relation to Mortality and Morbidity Costs.” © 2010 Society of Actuaries page 59.
viMuennig, P, Lubetkin, E, Jia, H, and Franks, P. Gender and the burden of disease attributable to obesity. Am J Public Health. 2006; 96: 1662–1668
viiAnandacoomarasamy, A, Caterson, ID, Leibman, S et al. Influence of BMI on health-related quality of life: comparison between an obese adult cohort and age-matched population norms. Obesity (Silver Spring). 2009; 17: 2114–2118
viiiYang, Y., MD, McPherson, K., PhD, Marsh, T., PG Dip, Gortmaker, S. L., PhD, & Brown, M., PhD. (n.d.). Health and economic burden of the projected obesity trends in the USA and the UK. Retrieved from DOI: http://dx.doi.org/10.1016/S0140-6736(11)60814-3.
ixFinkelstein, E. A., Trogdon, J. G., Brown, D. S., Allaire, B. T., Dellea, P. S., & Kamal-Bahl, S. J. (2008). The Lifetime Medical Cost Burden of Overweight and Obesity: Implications for Obesity Prevention. Obesity, 16(8), 1843-1848. Retrieved from http://www.americanobesity.org/downloads/Lefetime_Medical_costs.pdf
xFinkelstein EA, Trogdon JG, Cohen JW, Dietz W. Annual medical spending attributable to obesity: payer- and service-specific estimates. Health Aff (Millwood) 2009;28(5):w822–w831
xiObesity Briefs. (n.d.). Retrieved from http://www.healthyamericans.org/assets/files/TFAHSept2012_ALL_ObesityBriefs.pdf, page 85 xiiWeintrub WS et al. AHA Policy Statement: Value of Primordial and Primary Prevention for Cardiovascular Disease. Circulation, 124: 967-990, 2011.
xiiiBusko M. “As treatment costs soar, AHA preaches prevention as savvy investment.” Heartwire July 26, 2011. http://www.theheart.org/article/1256761.do (accessed January 11, 2012).
xivWhat is childhood obesity? (2014, August). Retrieved from http://www.heart.org/HEARTORG/GettingHealthy/HealthierKids/ ChildhoodObesity/What-is-childhood-obesity_UCM_304347_Article.jsp
xvU.S. Department of Health and Human Services. Childhood Obesity. (2011, March). Retrieved from http://aspe.hhs.gov/health/reports/child_obesity/#_ftn11.
xviAbout BMI for Children and Teens. (2015, April 17). Retrieved from http://www.cdc.gov/healthyweight/assessing/bmi/childrens_bmi/ about_childrens_bmi.html#What%20is%20BMI
xviiChildren, Adolescents, Obesity, and the Media. (2011). Pediatrics, 128(1), 201-208. doi:10.1542/peds.2011-1066

42
xviiiObesity (2013, December). Retrieved from http://health.nv.gov/CD_Obesity.htm
xixAdult Obesity Facts. (2014, September 09). Retrieved from http://www.cdc.gov/obesity/data/adult.html
xxObesity In Nevada. (n.d.). Retrieved from http://www.nevadapublichealthfoundation.org/public-health-in-nevada/obesity-in-nevada/
xxiDefining Overweight and Obesity. (2012, April 27). Retrieved from http://www.cdc.gov/obesity/adult/defining.html
xxiiCauses and Consequences - What causes overweight and obesity? (2012, April 27). Retrieved from http://www.cdc.gov/obesity/adult/causes/index.html
xxiiiCauses and Consequences - What causes overweight and obesity? (2012, April 27). Retrieved from http://www.cdc.gov/obesity/adult/causes/index.html
xxivDehghan, M., Akhtar-Danesh, N., & Merchant, A. T. (2005). Childhood obesity, prevalence and prevention. Nutr J Nutrition Journal, 4(1), 24. doi:10.1186/1475-2891-4-24
xxvBiro, F. M., & Wien, M. (2010). Childhood obesity and adult morbidities. Am J Clin Nutr 2010 91: 5 1499S-1505S; First published online March 24, 2010. doi:10.3945/ajcn.2010.28701B.
xxviWang, L.Y., Denniston, M., Lee, S., Galuska, D., and Lowry, R. (2010). Long-term Health and Economic Impact of Preventing and Reducing Overweight and Obesity in Adolescence. Journal of Adolescent Health, 46, 467-473
xxviiWang, L.Y., Denniston, M., Lee, S., Galuska, D., and Lowry, R. (2010). Long-term Health and Economic Impact of Preventing and Reducing Overweight and Obesity in Adolescence. Journal of Adolescent Health, 46, 467-473
xxviiHealthy Eating Plate & Healthy Eating Pyramid. (n.d.). Retrieved from http://www.hsph.harvard.edu/nutritionsource/healthy-eating-plate/
xxixHealthy Eating Plate & Healthy Eating Pyramid. (n.d.). Retrieved from http://www.hsph.harvard.edu/nutritionsource/healthy-eating-plate/
xxxProgress on children eating more fruit, not vegetables. (2014, August). CDC Vital Signs. Retrieved from http://www.cdc.gov/vitalsigns/pdf/2014-08-vitalsigns.pdf
xxxiStockdale, C. B., McIntyre, D. A., & Sauter, M. B. (2011, February 9). 10 States With the Deadliest Eating Habits. Retrieved from http://finance.yahoo.com/news/pf_article_112083.html
xxxiiPhysical Activity. (2015, April 30) Retrieved from http://www.cdc.gov/physicalactivity/index.html
xxivCenters for Disease Control and Prevention. 2008 Physical Activity Guidelines for Americans. Fact Sheet for Health Professional on Physical Activity Guidelines for Adults. Retrieved from http://www.cdc.gov/physicalactivity/downloads/pa_fact_sheet_adults.pdf
xxxvU.S. Department of Health and Human Services. 2008 Physical Activity Guidelines for Americans. Retrieved from http://www.health.gov/paguidelines/pdf/paguide.pdf
xxxviDepartment of Health and Human Services, Nevada State Health Division, Chronic Disease Section. The Burden of Chronic Disease Nevada. (2013) p. 29.
xxxviiCasazza et al. (2013). Myths, Presumptions, and Facts about Obesity. New England Journal of Medicine, 368, 2234-2237. doi:DOI: 10.1056/NEJMc1303009
xxxviiiExecutive Summary: The Surgeon General’s Call to Action to Support Breastfeeding. (2011). Retrieved from http://www.surgeongeneral.gov/library/calls/breastfeeding/executivesummary.pdf
xxxixWilbert, C. (n.d.). Breastfeeding Helps Moms Lose Weight. Retrieved from http://www.webmd.com/parenting/baby/news/20081208/breastfeeding-helps-moms-lose-weight
xlOffice on Women’s Health Why breastfeeding is important. (2014, July 21). Retrieved from http://www.womenshealth.gov/breastfeeding/breastfeeding-benefits.html
xliOffice on Women’s Health Why breastfeeding is important. (2014, July 21). Retrieved from http://www.womenshealth.gov/breastfeeding/breastfeeding-benefits.html
xliiRey-Lopez JP, Vicente-Rodriguez G, Biosca M, Moreno LA. Sedentary behaviour and obesity development in children and adolescents. Nutr Metab Cardiovasc Dis. 2008;18:242-51
xliiiO’Brien M, Nader PR, Houts RM, et al. The ecology of childhood overweight: a 12-year longitudinal analysis. Int J Obes (Lond). 2007;31:1469-78

43
xlivErik Landhuis C, Poulton R, Welch D, Hancox RJ. Programming obesity and poor fitness: the long-term impact of childhood television. Obesity (Silver Spring). 2008;16:1457-9
xlvParsons TJ, Manor O, Power C. Television viewing and obesity: a prospective study in the 1958 British birth cohort. Eur J Clin Nutr. 2008;62:1355-63
xlviPolicy Statement- Children, Adolescents, Obesity and Media. Journal of Pediatrics; originally published online June 27, 2011; DOI: 10.1542/peds.2011-1066, page 201
xlviiF as in Fat 2009: How Obesity Policies are Failing in America. (2009, July). Retrieved from http://healthyamericans.org/reports/obesity2009/
xlviiiHarris JL, Pomeranz JL, Lobstein T, Brownell KD. A crisis in the marketplace: how food marketing contributes to childhood obesity and what can be done. Annu Rev Public Health. 2009;30:211–225
xlixObesity Prevention and Control: Behavioral Interventions that Aim to Reduce Recreational Sedentary Screen Time Among Children. (2014, August). Retrieved from http://www.thecommunityguide.org/obesity/behavioral.html
lChildren, Adolescents, and Television. (2001). Pediatrics, 107(2), 423-426. Retrieved from http://pediatrics.aappublications.org/content/107/2/423.full
liTelevision Watching and “Sit Time” (2012, October 20). Retrieved from http://www.hsph.harvard.edu/obesity-prevention-source/ obesity-causes/television-and-sedentary-behavior-and-obesity/
liiTelevision Watching and “Sit Time” (2012, October 20). Retrieved from http://www.hsph.harvard.edu/obesity-prevention-source/ obesity-causes/television-and-sedentary-behavior-and-obesity/
liiiHealth Status of Children Entering Kindergarten in Nevada, Results of the 2012-2013 Nevada Kindergarten Health Survey. (2013, April). Retrieved from http://nic.unlv.edu/files/KHS%20Year%205%20Report_514.13_FinalRevised.pdf
livWhy Nevada Wellness? (n.d.). Retrieved from http://nevadawellness.org
lvWhy Nevada Wellness? (n.d.). Retrieved from http://nevadawellness.org
lviWhy Nevada Wellness? (n.d.). Retrieved from http://nevadawellness.org
lviiOffice of Public Health Informatics and Epidemiology. Division of Public and Behavioral Health. 2013 Nevada Youth Risk Behavior Survey. Carson City, Nevada. February 2014.
lviiiCenters for Disease Control and Prevention. Benefits of Health Promotion Program. Accessed at http://www.cdc.gov/workplacehealthpromotion/businesscase/benefits/index.html
lixCenters for Disease Control and Prevention. Benefits of Health Promotion Program. Accessed at http://www.cdc.gov/workplacehealthpromotion/businesscase/benefits/index.html
lxCenters for Disease Control and Prevention. Benefits of Health Promotion Program. Accessed at http://www.cdc.gov/workplacehealthpromotion/businesscase/benefits/index.html
lxiHealth Status of Children Entering Kindergarten in Nevada, Results of the 2012-2013 Nevada Kindergarten Health Survey. (2013, April). Retrieved from http://nic.unlv.edu/files/KHS%20Year%205%20Report_514.13_FinalRevised.pdf
lxiiOffice of Public Health Informatics and Epidemiology. Division of Public and Behavioral Health. 2013 Nevada Youth Risk Behavior Survey. Carson City, Nevada. February 2014.
lxiiiBehavioral Risk Factor Surveillance System, BRFSS 2013 Survey Data and Documentation. (2014, June 23). Retrieved from http://www.cdc.gov/brfss/annual_data/annual_2013.html

44


![Research Article Prevalence of Obesity in Hail Region, KSA ...downloads.hindawi.com/journals/jobe/2014/961861.pdf · cope with the growing burden of obesity [ ]. However, increased](https://static.fdocuments.us/doc/165x107/5f0d55747e708231d439d506/research-article-prevalence-of-obesity-in-hail-region-ksa-cope-with-the-growing.jpg)