The NSL Complex Regulates Housekeeping Genes in Drosophila · The NSL Complex Regulates...
18
The NSL Complex Regulates Housekeeping Genes in Drosophila Kin Chung Lam 1,2. , Friederike Mu ¨ hlpfordt 1,2. , Juan M. Vaquerizas 3. , Sunil Jayaramaiah Raja 1 , Herbert Holz 1 , Nicholas M. Luscombe 3,4 , Thomas Manke 1 , Asifa Akhtar 1 * 1 Max-Planck Institute of Immunobiology and Epigenetics, Freiburg im Breisgau, Germany, 2 Faculty of Biology, University of Freiburg, Freiburg, Germany, 3 EMBL European Bioinformatics Institute, Wellcome Trust Genome Campus, Cambridge, United Kingdom, 4 Okinawa Institute of Science and Technology, Kunigami-gun, Okinawa, Japan Abstract MOF is the major histone H4 lysine 16-specific (H4K16) acetyltransferase in mammals and Drosophila. In flies, it is involved in the regulation of X-chromosomal and autosomal genes as part of the MSL and the NSL complexes, respectively. While the function of the MSL complex as a dosage compensation regulator is fairly well understood, the role of the NSL complex in gene regulation is still poorly characterized. Here we report a comprehensive ChIP–seq analysis of four NSL complex members (NSL1, NSL3, MBD-R2, and MCRS2) throughout the Drosophila melanogaster genome. Strikingly, the majority (85.5%) of NSL-bound genes are constitutively expressed across different cell types. We find that an increased abundance of the histone modifications H4K16ac, H3K4me2, H3K4me3, and H3K9ac in gene promoter regions is characteristic of NSL- targeted genes. Furthermore, we show that these genes have a well-defined nucleosome free region and broad transcription initiation patterns. Finally, by performing ChIP–seq analyses of RNA polymerase II (Pol II) in NSL1- and NSL3- depleted cells, we demonstrate that both NSL proteins are required for efficient recruitment of Pol II to NSL target gene promoters. The observed Pol II reduction coincides with compromised binding of TBP and TFIIB to target promoters, indicating that the NSL complex is required for optimal recruitment of the pre-initiation complex on target genes. Moreover, genes that undergo the most dramatic loss of Pol II upon NSL knockdowns tend to be enriched in DNA Replication–related Element (DRE). Taken together, our findings show that the MOF-containing NSL complex acts as a major regulator of housekeeping genes in flies by modulating initiation of Pol II transcription. Citation: Lam KC, Mu ¨ hlpfordt F, Vaquerizas JM, Raja SJ, Holz H, et al. (2012) The NSL Complex Regulates Housekeeping Genes in Drosophila. PLoS Genet 8(6): e1002736. doi:10.1371/journal.pgen.1002736 Editor: Jason Carroll, Cancer Research UK Cambridge Research Institute, United Kingdom Received October 18, 2011; Accepted April 13, 2012; Published June 14, 2012 Copyright: ß 2012 Lam et al. This is an open-access article distributed under the terms of the Creative Commons Attribution License, which permits unrestricted use, distribution, and reproduction in any medium, provided the original author and source are credited. Funding: This work was supported by EU funded ITN ‘‘Nucleosome 4D’’ and DFG funded ‘‘SFB746’’ awarded to AA. JMV acknowledges funding from the ESF Exchange Grant program. The funders had no role in study design, data collection and analysis, decision to publish, or preparation of the manuscript. Competing Interests: The authors have declared that no competing interests exist. * E-mail: [email protected] . These authors contributed equally to this work. Introduction In the past decade, our understanding of eukaryotic transcrip- tional regulation has changed from the notion of a ‘‘generic entity that functions by a single universal mechanism’’ [1] to the acknowledgement of diversity in promoter types and functions. Indeed, eukaryotic transcription relies on a complex interplay between DNA binding motifs, covalent histone modifications, higher order chromatin structures and protein-protein interac- tions. For example, post-translational modifications of histones such as acetylation, methylation, phosphorylation, ubiquitinyla- tion, and sumoylation are prominent mechanisms employed to help modify chromatin structure and are considered to be a prerequisite for the recruitment of general transcription factors (GTFs) (for review see [2,3]). Histone acetylation can impact chromatin structure in several ways: it has been shown that acetylation at different lysine residues can be specifically recog- nized by distinct protein domains (e.g. bromodomains) [4,5], which in turn recruit chromatin-remodeling factors. Alternatively, acetylation itself may also disrupt interactions between nucleo- somes and thus cause chromatin decompaction [6,7]. Both mechanisms can contribute to reduced nucleosome occupancies at transcriptional start sites (TSSs), thereby providing an open chromatin environment for GTF binding [8]. Histone acetyltransferases (HATs) and histone deacetylases (HDACs) work in concert to orchestrate a fine balance of acetylation. HATs can be classified into two predominant families: the GCN5-related N-acetyltransferase (GNAT) family (e.g. Gcn5 and p300) [9] and the Moz-Ybf2/Sas3-Sas2-Tip60 (MYST) family (e.g. Tip60 and MOF) [10]. These enzymes often function as part of multi-protein complexes, presumably to increase substrate- specificity and to impose tight regulation of their enzymatic activity. Moreover, mounting evidence suggests that a single HAT can often associate with more than one complex [11]. Gcn5, for example, is a member of both the SAGA and ATAC complexes [12,13] that regulate different sets of inducible genes despite sharing the same HAT [14–18]. Similarly MOF, a MYST-HAT specific for H4K16 acetylation, is also a member of two distinct protein complexes in Drosophila and mammals: the Male-Specific Lethal (MSL) and the Non- Specific Lethal (NSL) complexes [19–21]. In Drosophila, the MSL complex is targeted to the transcribed regions of X-chromosomal PLoS Genetics | www.plosgenetics.org 1 June 2012 | Volume 8 | Issue 6 | e1002736
Transcript of The NSL Complex Regulates Housekeeping Genes in Drosophila · The NSL Complex Regulates...

The NSL Complex Regulates Housekeeping Genes inDrosophilaKin Chung Lam1,2., Friederike Muhlpfordt1,2., Juan M. Vaquerizas3., Sunil Jayaramaiah Raja1,
Herbert Holz1, Nicholas M. Luscombe3,4, Thomas Manke1, Asifa Akhtar1*
1 Max-Planck Institute of Immunobiology and Epigenetics, Freiburg im Breisgau, Germany, 2 Faculty of Biology, University of Freiburg, Freiburg, Germany, 3 EMBL
European Bioinformatics Institute, Wellcome Trust Genome Campus, Cambridge, United Kingdom, 4 Okinawa Institute of Science and Technology, Kunigami-gun,
Okinawa, Japan
Abstract
MOF is the major histone H4 lysine 16-specific (H4K16) acetyltransferase in mammals and Drosophila. In flies, it is involved inthe regulation of X-chromosomal and autosomal genes as part of the MSL and the NSL complexes, respectively. While thefunction of the MSL complex as a dosage compensation regulator is fairly well understood, the role of the NSL complex ingene regulation is still poorly characterized. Here we report a comprehensive ChIP–seq analysis of four NSL complexmembers (NSL1, NSL3, MBD-R2, and MCRS2) throughout the Drosophila melanogaster genome. Strikingly, the majority(85.5%) of NSL-bound genes are constitutively expressed across different cell types. We find that an increased abundance ofthe histone modifications H4K16ac, H3K4me2, H3K4me3, and H3K9ac in gene promoter regions is characteristic of NSL-targeted genes. Furthermore, we show that these genes have a well-defined nucleosome free region and broadtranscription initiation patterns. Finally, by performing ChIP–seq analyses of RNA polymerase II (Pol II) in NSL1- and NSL3-depleted cells, we demonstrate that both NSL proteins are required for efficient recruitment of Pol II to NSL target genepromoters. The observed Pol II reduction coincides with compromised binding of TBP and TFIIB to target promoters,indicating that the NSL complex is required for optimal recruitment of the pre-initiation complex on target genes. Moreover,genes that undergo the most dramatic loss of Pol II upon NSL knockdowns tend to be enriched in DNA Replication–relatedElement (DRE). Taken together, our findings show that the MOF-containing NSL complex acts as a major regulator ofhousekeeping genes in flies by modulating initiation of Pol II transcription.
Citation: Lam KC, Muhlpfordt F, Vaquerizas JM, Raja SJ, Holz H, et al. (2012) The NSL Complex Regulates Housekeeping Genes in Drosophila. PLoS Genet 8(6):e1002736. doi:10.1371/journal.pgen.1002736
Editor: Jason Carroll, Cancer Research UK Cambridge Research Institute, United Kingdom
Received October 18, 2011; Accepted April 13, 2012; Published June 14, 2012
Copyright: � 2012 Lam et al. This is an open-access article distributed under the terms of the Creative Commons Attribution License, which permits unrestricteduse, distribution, and reproduction in any medium, provided the original author and source are credited.
Funding: This work was supported by EU funded ITN ‘‘Nucleosome 4D’’ and DFG funded ‘‘SFB746’’ awarded to AA. JMV acknowledges funding from the ESFExchange Grant program. The funders had no role in study design, data collection and analysis, decision to publish, or preparation of the manuscript.
Competing Interests: The authors have declared that no competing interests exist.
* E-mail: [email protected]
. These authors contributed equally to this work.
Introduction
In the past decade, our understanding of eukaryotic transcrip-
tional regulation has changed from the notion of a ‘‘generic entity
that functions by a single universal mechanism’’ [1] to the
acknowledgement of diversity in promoter types and functions.
Indeed, eukaryotic transcription relies on a complex interplay
between DNA binding motifs, covalent histone modifications,
higher order chromatin structures and protein-protein interac-
tions. For example, post-translational modifications of histones
such as acetylation, methylation, phosphorylation, ubiquitinyla-
tion, and sumoylation are prominent mechanisms employed to
help modify chromatin structure and are considered to be a
prerequisite for the recruitment of general transcription factors
(GTFs) (for review see [2,3]). Histone acetylation can impact
chromatin structure in several ways: it has been shown that
acetylation at different lysine residues can be specifically recog-
nized by distinct protein domains (e.g. bromodomains) [4,5],
which in turn recruit chromatin-remodeling factors. Alternatively,
acetylation itself may also disrupt interactions between nucleo-
somes and thus cause chromatin decompaction [6,7]. Both
mechanisms can contribute to reduced nucleosome occupancies
at transcriptional start sites (TSSs), thereby providing an open
chromatin environment for GTF binding [8].
Histone acetyltransferases (HATs) and histone deacetylases
(HDACs) work in concert to orchestrate a fine balance of
acetylation. HATs can be classified into two predominant families:
the GCN5-related N-acetyltransferase (GNAT) family (e.g. Gcn5
and p300) [9] and the Moz-Ybf2/Sas3-Sas2-Tip60 (MYST) family
(e.g. Tip60 and MOF) [10]. These enzymes often function as part
of multi-protein complexes, presumably to increase substrate-
specificity and to impose tight regulation of their enzymatic
activity. Moreover, mounting evidence suggests that a single HAT
can often associate with more than one complex [11]. Gcn5, for
example, is a member of both the SAGA and ATAC complexes
[12,13] that regulate different sets of inducible genes despite
sharing the same HAT [14–18].
Similarly MOF, a MYST-HAT specific for H4K16 acetylation,
is also a member of two distinct protein complexes in Drosophila
and mammals: the Male-Specific Lethal (MSL) and the Non-
Specific Lethal (NSL) complexes [19–21]. In Drosophila, the MSL
complex is targeted to the transcribed regions of X-chromosomal
PLoS Genetics | www.plosgenetics.org 1 June 2012 | Volume 8 | Issue 6 | e1002736

genes where it mediates dosage compensation. The targeting
mechanism and modes of action of the MSL complex have been
studied extensively (for review see [22–24]). In contrast, details of
the NSL complex have only recently started to emerge. Our
previous work revealed that the NSL complex is composed of at
least seven proteins: NSL1, NSL2, NSL3, MCRS2, MBD-R2,
WDS and MOF [20,21]. We have also shown that these proteins
are essential for the viability and development of Drosophila and
that they are required for the recruitment of MOF to the
promoters of active genes [21,25]. Using a reporter assay system,
Becker and colleagues demonstrated that MOF displays greater
potential for transcriptional activation as part of the NSL complex,
than in the MSL complex [26]. Additionally, recent reports
indicate that in mammals MOF fulfills different functions in the
NSL and MSL complex, respectively. It has been shown, for
example, that the mammalian NSL1/MOF sub-complex appears
to have broader substrate specificity than the MSL1/MOF sub-
complex, as it is also able to acetylate non-histone targets [27].
Despite these observations, our understanding of NSL complex
targeting and its regulatory function is still limited. Since the
complex is conserved from Drosophila to mammals [20], unraveling
its mechanism of action will be crucial for a better understanding
of transcriptional regulation in higher eukaryotes and its evolu-
tionary plasticity.
In order to elucidate the principles that direct NSL targeting,
here we have performed a detailed analysis of the NSL binding
sites in the genome of Drosophila melanogaster. We tested whether the
NSL complex binds differently in distinct cell types by comparing
ChIP-seq profiles obtained from the salivary glands of third instar
larvae and from the Schneider (S2) cell line; our analyses reveal
that the repertoire of NSL-bound genes is highly similar between
different cell types. Remarkably, by comparing NSL target genes
with transcriptome data from 30 distinct developmental stages of
Drosophila, we find that the NSL complex preferentially targets
genes that are constitutively expressed, also referred to as
housekeeping genes. Moreover, NSL-bound genes exhibit elevated
levels of H3K4me2/3, H3K9ac and H4K16ac and display a
distinctive arrangement of the nucleosome free region (NFR) as
well as dispersed transcription initiation patterns. Going beyond
the study of NSL complex localization, we could furthermore show
that the NSL complex is required for optimal recruitment of Pol II
and the pre-initiation complex to its target promoters. Finally,
using a quantitative model of DNA-protein interaction affinities,
we find that the presence of strong DRE motifs in NSL target
promoters conveys an increased sensitivity for Pol II loss in cells
lacking NSL1 or NSL3. Taken together, our observations reveal a
unique promoter configuration that is indicative of NSL binding
and establishes the NSL complex as an important transcriptional
regulator of constitutively expressed genes in Drosophila.
Results/Discussion
NSL complex targets a core set of genes independentlyof cell type
Genome-wide mappings of two NSL components (NSL1 and
MCRS2) were previously performed in the salivary glands of third
instar larvae [21]. Here, in addition, we performed chromatin
immunoprecipitation followed by high-throughput sequencing
(ChIP-seq) analyses of two additional proteins, NSL3 and MBD-
R2, using the Drosophila embryonic Schneider (S2) cell line. This
strategy allowed us to study similarities and differences in DNA
binding patterns of the NSL-complex members in tissues of
different origins. Moreover, the use of S2 cells offered the
possibility to directly compare our results with the publicly
available data generated by the modENCODE project that uses
the same cell type.
The four proteins displayed significant binding, ranging from
9,409 (NSL3) to 12,234 (MCRS2) genomic regions where peaks
were detected (false-discovery rate ,5%; statistics for individual
proteins are provided in Table S1, for details on data processing
see Materials and Methods). As shown in Figure S1A (dark and
light blue columns), the majority of ChIP-seq peak summits
localize within 800 bp of an annotated Transcription Start Site
(TSS). The strongest binding signals (signified by high ChIP-seq
tag counts) are observed within 200 bp of TSSs (Figure S1B,
Figure 1A). We therefore focused our further analysis on NSL
binding in TSS regions.
We defined a gene as NSL target when a ChIP-seq peak summit
region (40 bp) was located within +/2200 bp of its TSS (see
schematic representation, in Figure 1B). Using this criterion, we
identified 4,233, 4,265, 5,435, and 5,321 promoters bound by
NSL1, MCRS2, NSL3 and MBD-R2, respectively. Particularly in
promoter-proximal regions, the binding profiles of NSL1, NSL3,
MCRS2 and MBD-R2 are remarkably similar and also signifi-
cantly overlap with previously published ChIP-chip profiles of
WDS and MOF (Figure 1A). Despite the different developmental
origins of the tissues used for the analysis of NSL1/MCRS2 and
NSL3/MBD-R2, we observe that 78.7% (p-value,2.2 e-16;
Fisher’s exact test) of promoters with significant NSL signals are
in common between the samples from S2 cells and larval salivary
glands (Figure 1B). We identified a core set of 2,841 genes that are
bound by all four NSL complex subunits, suggesting that the NSL
proteins mostly operate as a single complex to regulate large
numbers of genes in the Drosophila genome (Figure 1B, Figure
S1C). Furthermore, ChIP followed by quantitative real time PCR
(ChIP-qPCR) analysis of eight targets confirmed preferential
binding of NSL proteins to the 59-ends of genes (Figure 1C).
Given the similarity in binding between the subunits, subse-
quent analyses were based on the stringent core set of 2,841 genes
that are bound by all four NSL proteins (thereafter called NSL-
bound genes) unless otherwise indicated.
Author Summary
Housekeeping genes are required to support basic cellularfunctions and are therefore expressed constitutively in alltissues. Although the homeostasis of housekeeping geneexpression is vital for cell survival, most research on thetranscription initiation has been focused on TATA-box-containing promoters of inducible and developmentalgenes, while regulatory mechanisms at the TATA-lesspromoters of housekeeping genes have remained poorlyunderstood. Using genome-wide chromatin binding pro-files, we find that the NSL complex, a histone acetyltrans-ferase-containing complex, is bound to the majority ofconstitutively active gene promoters. We show that NSL-bound genes display specific sets of DNA motifs, well-defined nucleosome free regions, and broad transcriptioninitiation patterns. In addition, we show that the NSLcomplex regulates the recruitment of the basal transcrip-tion machinery to target promoters; more specifically, wecan pinpoint its role to the early steps of Pol II recruitment.Interestingly, we also see that NSL-bound genes are mostsusceptible to Pol II loss after depletion of NSLs when theycontain the DNA Replication–related Element (DRE). Takentogether, we provide a genome-wide analysis of achromatin-modifying complex that is globally involved inthe regulation of housekeeping gene expression.
NSL Complex and Gene Regulation
PLoS Genetics | www.plosgenetics.org 2 June 2012 | Volume 8 | Issue 6 | e1002736

Figure 1. NSL proteins concomitantly bind to 59 end of genes. (A) Genome Browser snapshot of a gene-rich region on chromosome 3 L. Thelog2FCs (ChIP/input) of the newly generated ChIP-seq data of MBD-R2 and NSL3 are compared to those of NSL1, MCRS2 [21], WDS (GEO: GSE20835)and MOF (GEO: GSE27806). (B) The Venn diagram of NSL-bound TSS regions reveals an extensive set of promoters that are concomitantly bound by
NSL Complex and Gene Regulation
PLoS Genetics | www.plosgenetics.org 3 June 2012 | Volume 8 | Issue 6 | e1002736
NSL complex targets are defined by an active chromatinstate
We find that 68% and 66% of actively transcribed genes in S2
cells (based on expression analysis in [28]) are bound by NSL3 and
MBD-R2, respectively (p-value,2.2e-16, Fisher’s exact test);
similar results were obtained for NSL1 and MCRS2 from salivary
glands (Table S1, [21]). To assess the relationship between gene
expression, chromatin state and NSL binding, we utilized the large
set of histone modification data available from the modENCODE
project (see Materials and Methods for accession numbers).
Surprisingly, the patterns of histone acetylation and methylation
markedly differed among expressed genes depending on the
presence or absence of the NSL complex. While hallmarks of
transcriptionally active promoters, H3K4me2, H3K4me3,
H4K16ac and H3K9ac are present regardless of NSL binding,
promoters that are bound by the NSL complex show an even
greater enrichment of these marks compared with active
promoters that lack NSL binding (Figure 2A). These enrichments
of active histone marks cannot be explained by expression level
differences between the two groups (Figure S2A).
The increased acetylation of H4K16 among NSL-bound genes
is in agreement with the HAT activity of MOF. However, despite
a recent report by Conaway and colleagues that showed that the
human NSL/MOF complex can also catalyze H4K5 and H4K8
acetylation [19], we did not observe a similar enrichment of these
histone marks on NSL-bound genes. One possible explanation is
that the NSL/MOF complex in Drosophila may have different
substrate-specificity for histone residues other than H4K16
compared with humans. Alternatively, since the H4K5 and
H4K8 acetylation described above was detected using an in vitro
system, these modifications may not arise from the primary activity
of MOF in vivo. In summary, our results indicate that the NSL-
complex-bound active genes are enriched for distinct sets of
histone modifications when compared with active NSL-non-bound
promoters.
To gain a more comprehensive understanding of the combina-
tions of histone modifications found at NSL-bound promoters, we
studied the distribution of NSL-bound and -non-bound promoters
within the five principal chromatin types (chromatin colors)
defined by the location maps of 53 chromatin proteins [29].
Within this model, the chromatin states ‘‘yellow’’ and ‘‘red’’
correspond to active genes, but differ in the combination of histone
marks and chromatin binding proteins. Unexpectedly, we found a
very significant enrichment of NSL-bound TSSs for the ‘‘yellow’’
chromatin state that is associated specifically with MRG15 and
H3K36me3 (87.3% versus 18.2% for NSL-non-bound; p-
value,2.2e-16; Fisher’s exact test; see Figure 2B), but no
comparable enrichment for the ‘‘red’’ chromatin state that is
marked by chromatin proteins, such as Brahma, SU(VAR)2–10
and MED31 (9.7% of NSL-bound TSSs versus 8% of NSL-non-
bound TSSs for ‘‘red’’; Figure 2B). Our findings suggest the NSL
complex as an additional, previously unknown marker of ‘‘yellow’’
chromatin while genes within ‘‘red’’ chromatin regions are
expected to undergo NSL-independent transcriptional regulation.
A similar dominance for one specific state of active chromatin
was observed when we repeated the analysis for the 9-chromatin-
state model developed by Kharchenko and co-workers [30]
(Figure 2C, Figure S2B), supporting the notion of the NSL
complex as a regulator of a particular set of actively transcribed
genes.
The NSL complex predominantly targets housekeepinggenes
The results of the chromatin state analyses and the fact that
most NSL binding appears to occur independently of the cell-type,
prompted us to examine whether the complex displayed any
association with housekeeping genes. To address this question, we
defined a set of genes that are constitutively expressed throughout
30 distinct developmental stages of Drosophila [31] as our list of
housekeeping genes (see Materials and Methods). We then
generated heatmaps for Pol II and NSL binding centered on the
TSSs of annotated genes [32] that were classified into three classes:
constitutively expressed genes (see above), active genes but not
expressed throughout all developmental stages of the fly [28,31]
and inactive genes. As shown in Figure 2D, the Pol II signal shows
the anticipated enrichment downstream of the TSSs of active
genes regardless of constitutive or tissue-specific expression. In
striking contrast, the NSL binding profiles show a very prominent,
almost exclusive enrichment around the TSSs of constitutively
expressed genes but not among those active genes that show tissue-
specific regulation. Accordingly, 91.6% of NSL3-bound genes,
89.6% of MBD-R2-bound genes and 85.5% of TSSs bound by all
four NSLs concomitantly belong to the group of housekeeping
genes (Table S1, inlay in Figure 2D). Conversely, out of 5,534
constitutively expressed genes, 4,950 (89.4%; p-value,2.2e-16,
Fisher’s exact test) were bound by at least one NSL protein (Figure
S2C, S2D). This number is likely to be an underestimation as
some of the constitutively expressed genes, which are classified as
NSL-non-bound according to our strict criteria, also show
detectable NSL protein signals (Figure S2E). Taken together, we
concluded that the NSL complex preferentially binds to constitu-
tively expressed genes.
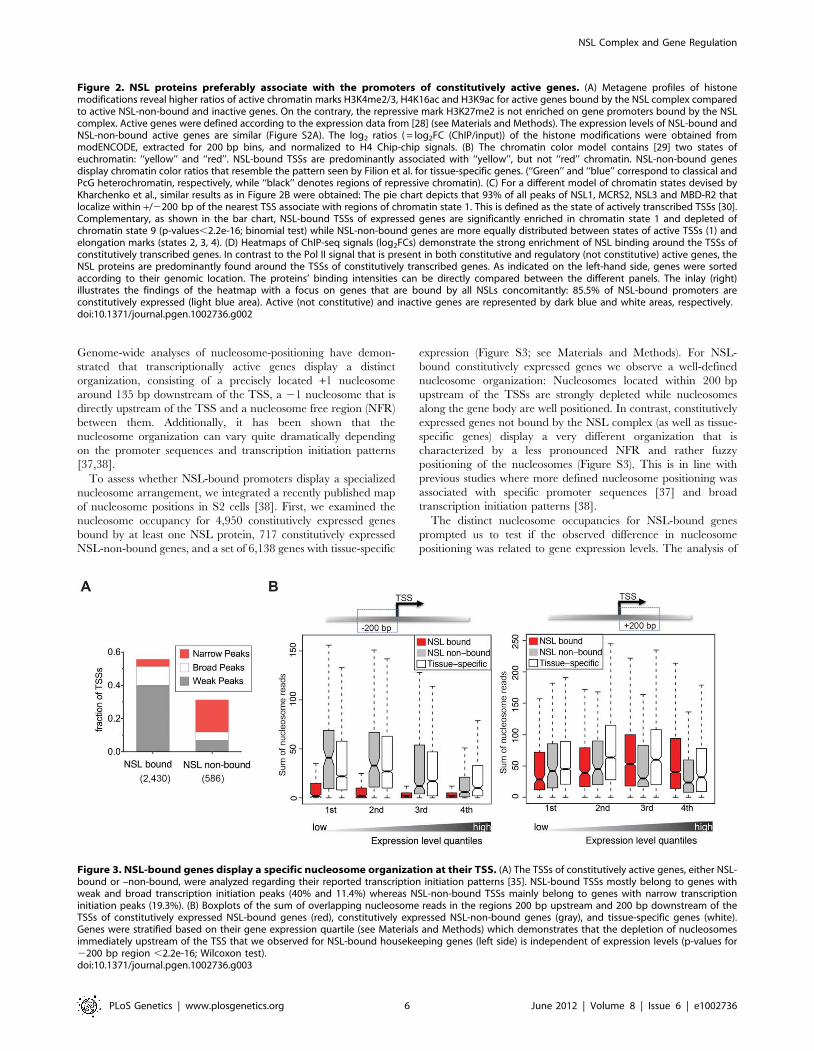
NSL-bound promoters have dispersed transcriptioninitiation patterns and distinct nucleosome organization
In addition to expression-based definitions of housekeeping
genes, we wanted to test further correlations of NSL binding with
characteristics of constitutively expressed genes. Earlier studies
have revealed two basic types of Drosophila promoters based on the
pattern of the transcriptional initiation: broad and peaked [33–
36]. While broad promoters preferably belong to housekeeping
genes, peaked promoters are associated with tissue-specific
expression. Based on data from [35], we found that NSL-bound
TSSs are predominantly associated with dispersed transcription
initiation patterns (Figure 3A).
We next wanted to investigate whether the NSL-characteristic
initiation patterns and histone modifications enrichments also
connected to specific structural features of the chromatin.
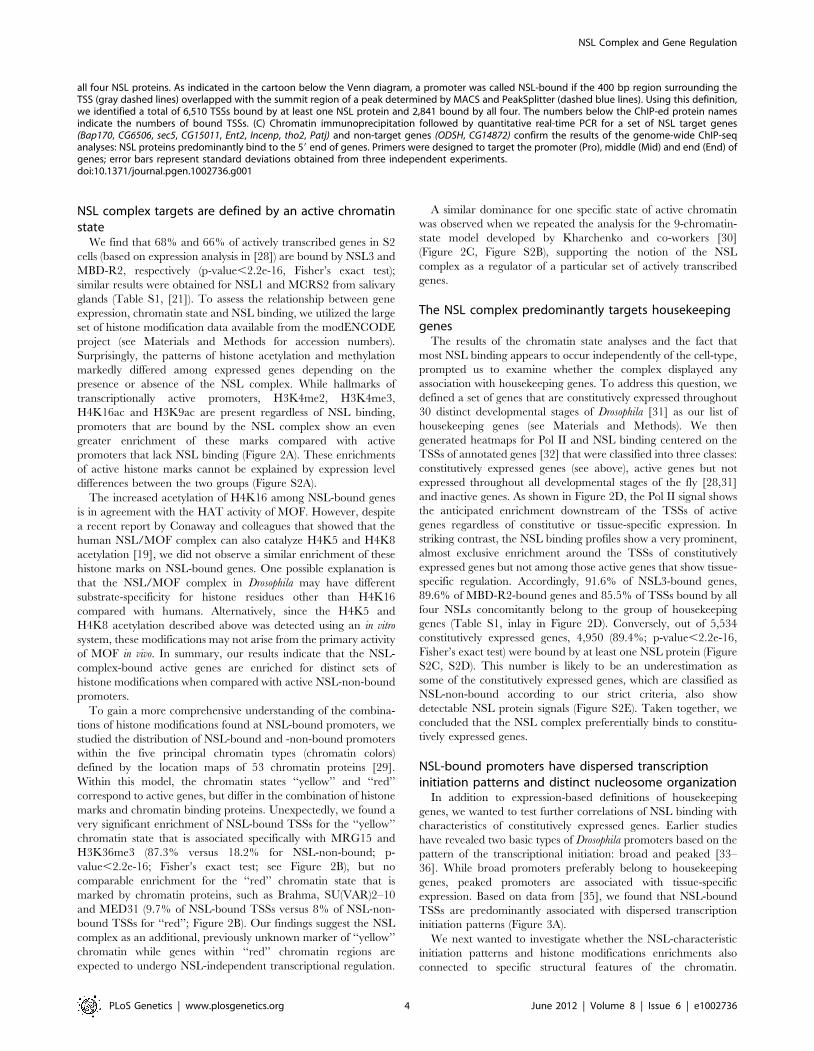
all four NSL proteins. As indicated in the cartoon below the Venn diagram, a promoter was called NSL-bound if the 400 bp region surrounding theTSS (gray dashed lines) overlapped with the summit region of a peak determined by MACS and PeakSplitter (dashed blue lines). Using this definition,we identified a total of 6,510 TSSs bound by at least one NSL protein and 2,841 bound by all four. The numbers below the ChIP-ed protein namesindicate the numbers of bound TSSs. (C) Chromatin immunoprecipitation followed by quantitative real-time PCR for a set of NSL target genes(Bap170, CG6506, sec5, CG15011, Ent2, Incenp, tho2, Patj) and non-target genes (ODSH, CG14872) confirm the results of the genome-wide ChIP-seqanalyses: NSL proteins predominantly bind to the 59 end of genes. Primers were designed to target the promoter (Pro), middle (Mid) and end (End) ofgenes; error bars represent standard deviations obtained from three independent experiments.doi:10.1371/journal.pgen.1002736.g001
NSL Complex and Gene Regulation
PLoS Genetics | www.plosgenetics.org 4 June 2012 | Volume 8 | Issue 6 | e1002736

NSL Complex and Gene Regulation
PLoS Genetics | www.plosgenetics.org 5 June 2012 | Volume 8 | Issue 6 | e1002736
Genome-wide analyses of nucleosome-positioning have demon-
strated that transcriptionally active genes display a distinct
organization, consisting of a precisely located +1 nucleosome
around 135 bp downstream of the TSS, a 21 nucleosome that is
directly upstream of the TSS and a nucleosome free region (NFR)
between them. Additionally, it has been shown that the
nucleosome organization can vary quite dramatically depending
on the promoter sequences and transcription initiation patterns
[37,38].
To assess whether NSL-bound promoters display a specialized
nucleosome arrangement, we integrated a recently published map
of nucleosome positions in S2 cells [38]. First, we examined the
nucleosome occupancy for 4,950 constitutively expressed genes
bound by at least one NSL protein, 717 constitutively expressed
NSL-non-bound genes, and a set of 6,138 genes with tissue-specific
expression (Figure S3; see Materials and Methods). For NSL-
bound constitutively expressed genes we observe a well-defined
nucleosome organization: Nucleosomes located within 200 bp
upstream of the TSSs are strongly depleted while nucleosomes
along the gene body are well positioned. In contrast, constitutively
expressed genes not bound by the NSL complex (as well as tissue-
specific genes) display a very different organization that is
characterized by a less pronounced NFR and rather fuzzy
positioning of the nucleosomes (Figure S3). This is in line with
previous studies where more defined nucleosome positioning was
associated with specific promoter sequences [37] and broad
transcription initiation patterns [38].
The distinct nucleosome occupancies for NSL-bound genes
prompted us to test if the observed difference in nucleosome
positioning was related to gene expression levels. The analysis of
Figure 2. NSL proteins preferably associate with the promoters of constitutively active genes. (A) Metagene profiles of histonemodifications reveal higher ratios of active chromatin marks H3K4me2/3, H4K16ac and H3K9ac for active genes bound by the NSL complex comparedto active NSL-non-bound and inactive genes. On the contrary, the repressive mark H3K27me2 is not enriched on gene promoters bound by the NSLcomplex. Active genes were defined according to the expression data from [28] (see Materials and Methods). The expression levels of NSL-bound andNSL-non-bound active genes are similar (Figure S2A). The log2 ratios ( = log2FC (ChIP/input)) of the histone modifications were obtained frommodENCODE, extracted for 200 bp bins, and normalized to H4 Chip-chip signals. (B) The chromatin color model contains [29] two states ofeuchromatin: ‘‘yellow’’ and ‘‘red’’. NSL-bound TSSs are predominantly associated with ‘‘yellow’’, but not ‘‘red’’ chromatin. NSL-non-bound genesdisplay chromatin color ratios that resemble the pattern seen by Filion et al. for tissue-specific genes. (‘‘Green’’ and ‘‘blue’’ correspond to classical andPcG heterochromatin, respectively, while ‘‘black’’ denotes regions of repressive chromatin). (C) For a different model of chromatin states devised byKharchenko et al., similar results as in Figure 2B were obtained: The pie chart depicts that 93% of all peaks of NSL1, MCRS2, NSL3 and MBD-R2 thatlocalize within +/2200 bp of the nearest TSS associate with regions of chromatin state 1. This is defined as the state of actively transcribed TSSs [30].Complementary, as shown in the bar chart, NSL-bound TSSs of expressed genes are significantly enriched in chromatin state 1 and depleted ofchromatin state 9 (p-values,2.2e-16; binomial test) while NSL-non-bound genes are more equally distributed between states of active TSSs (1) andelongation marks (states 2, 3, 4). (D) Heatmaps of ChIP-seq signals (log2FCs) demonstrate the strong enrichment of NSL binding around the TSSs ofconstitutively transcribed genes. In contrast to the Pol II signal that is present in both constitutive and regulatory (not constitutive) active genes, theNSL proteins are predominantly found around the TSSs of constitutively transcribed genes. As indicated on the left-hand side, genes were sortedaccording to their genomic location. The proteins’ binding intensities can be directly compared between the different panels. The inlay (right)illustrates the findings of the heatmap with a focus on genes that are bound by all NSLs concomitantly: 85.5% of NSL-bound promoters areconstitutively expressed (light blue area). Active (not constitutive) and inactive genes are represented by dark blue and white areas, respectively.doi:10.1371/journal.pgen.1002736.g002
Figure 3. NSL-bound genes display a specific nucleosome organization at their TSS. (A) The TSSs of constitutively active genes, either NSL-bound or –non-bound, were analyzed regarding their reported transcription initiation patterns [35]. NSL-bound TSSs mostly belong to genes withweak and broad transcription initiation peaks (40% and 11.4%) whereas NSL-non-bound TSSs mainly belong to genes with narrow transcriptioninitiation peaks (19.3%). (B) Boxplots of the sum of overlapping nucleosome reads in the regions 200 bp upstream and 200 bp downstream of theTSSs of constitutively expressed NSL-bound genes (red), constitutively expressed NSL-non-bound genes (gray), and tissue-specific genes (white).Genes were stratified based on their gene expression quartile (see Materials and Methods) which demonstrates that the depletion of nucleosomesimmediately upstream of the TSS that we observed for NSL-bound housekeeping genes (left side) is independent of expression levels (p-values for2200 bp region ,2.2e-16; Wilcoxon test).doi:10.1371/journal.pgen.1002736.g003
NSL Complex and Gene Regulation
PLoS Genetics | www.plosgenetics.org 6 June 2012 | Volume 8 | Issue 6 | e1002736
the promoter proximal regions of NSL-bound, NSL-non-bound
and tissue-specific genes revealed that the diminished nucleosome
occupancy upstream of the TSS is, in fact, independent of the
expression levels (Figure 3B).
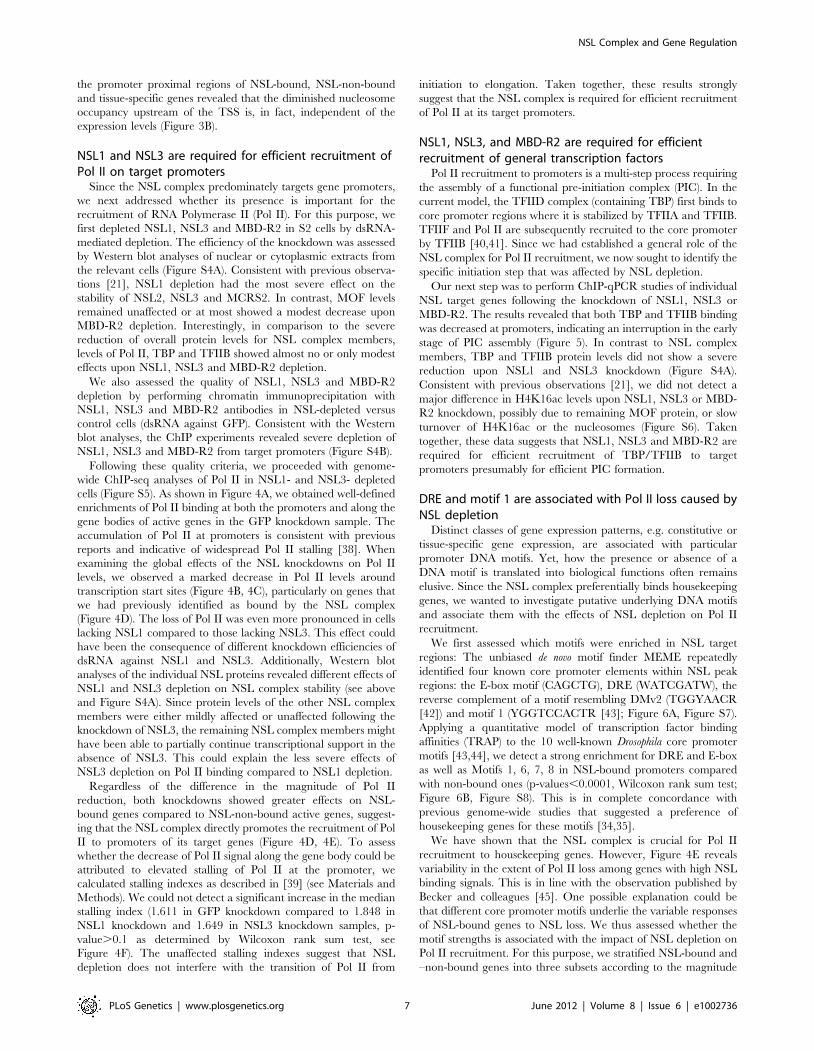
NSL1 and NSL3 are required for efficient recruitment ofPol II on target promoters
Since the NSL complex predominately targets gene promoters,
we next addressed whether its presence is important for the
recruitment of RNA Polymerase II (Pol II). For this purpose, we
first depleted NSL1, NSL3 and MBD-R2 in S2 cells by dsRNA-
mediated depletion. The efficiency of the knockdown was assessed
by Western blot analyses of nuclear or cytoplasmic extracts from
the relevant cells (Figure S4A). Consistent with previous observa-
tions [21], NSL1 depletion had the most severe effect on the
stability of NSL2, NSL3 and MCRS2. In contrast, MOF levels
remained unaffected or at most showed a modest decrease upon
MBD-R2 depletion. Interestingly, in comparison to the severe
reduction of overall protein levels for NSL complex members,
levels of Pol II, TBP and TFIIB showed almost no or only modest
effects upon NSL1, NSL3 and MBD-R2 depletion.
We also assessed the quality of NSL1, NSL3 and MBD-R2
depletion by performing chromatin immunoprecipitation with
NSL1, NSL3 and MBD-R2 antibodies in NSL-depleted versus
control cells (dsRNA against GFP). Consistent with the Western
blot analyses, the ChIP experiments revealed severe depletion of
NSL1, NSL3 and MBD-R2 from target promoters (Figure S4B).
Following these quality criteria, we proceeded with genome-
wide ChIP-seq analyses of Pol II in NSL1- and NSL3- depleted
cells (Figure S5). As shown in Figure 4A, we obtained well-defined
enrichments of Pol II binding at both the promoters and along the
gene bodies of active genes in the GFP knockdown sample. The
accumulation of Pol II at promoters is consistent with previous
reports and indicative of widespread Pol II stalling [38]. When
examining the global effects of the NSL knockdowns on Pol II
levels, we observed a marked decrease in Pol II levels around
transcription start sites (Figure 4B, 4C), particularly on genes that
we had previously identified as bound by the NSL complex
(Figure 4D). The loss of Pol II was even more pronounced in cells
lacking NSL1 compared to those lacking NSL3. This effect could
have been the consequence of different knockdown efficiencies of
dsRNA against NSL1 and NSL3. Additionally, Western blot
analyses of the individual NSL proteins revealed different effects of
NSL1 and NSL3 depletion on NSL complex stability (see above
and Figure S4A). Since protein levels of the other NSL complex
members were either mildly affected or unaffected following the
knockdown of NSL3, the remaining NSL complex members might
have been able to partially continue transcriptional support in the
absence of NSL3. This could explain the less severe effects of
NSL3 depletion on Pol II binding compared to NSL1 depletion.
Regardless of the difference in the magnitude of Pol II
reduction, both knockdowns showed greater effects on NSL-
bound genes compared to NSL-non-bound active genes, suggest-
ing that the NSL complex directly promotes the recruitment of Pol
II to promoters of its target genes (Figure 4D, 4E). To assess
whether the decrease of Pol II signal along the gene body could be
attributed to elevated stalling of Pol II at the promoter, we
calculated stalling indexes as described in [39] (see Materials and
Methods). We could not detect a significant increase in the median
stalling index (1.611 in GFP knockdown compared to 1.848 in
NSL1 knockdown and 1.649 in NSL3 knockdown samples, p-
value.0.1 as determined by Wilcoxon rank sum test, see
Figure 4F). The unaffected stalling indexes suggest that NSL
depletion does not interfere with the transition of Pol II from
initiation to elongation. Taken together, these results strongly
suggest that the NSL complex is required for efficient recruitment
of Pol II at its target promoters.
NSL1, NSL3, and MBD-R2 are required for efficientrecruitment of general transcription factors
Pol II recruitment to promoters is a multi-step process requiring
the assembly of a functional pre-initiation complex (PIC). In the
current model, the TFIID complex (containing TBP) first binds to
core promoter regions where it is stabilized by TFIIA and TFIIB.
TFIIF and Pol II are subsequently recruited to the core promoter
by TFIIB [40,41]. Since we had established a general role of the
NSL complex for Pol II recruitment, we now sought to identify the
specific initiation step that was affected by NSL depletion.
Our next step was to perform ChIP-qPCR studies of individual
NSL target genes following the knockdown of NSL1, NSL3 or
MBD-R2. The results revealed that both TBP and TFIIB binding
was decreased at promoters, indicating an interruption in the early
stage of PIC assembly (Figure 5). In contrast to NSL complex
members, TBP and TFIIB protein levels did not show a severe
reduction upon NSL1 and NSL3 knockdown (Figure S4A).
Consistent with previous observations [21], we did not detect a
major difference in H4K16ac levels upon NSL1, NSL3 or MBD-
R2 knockdown, possibly due to remaining MOF protein, or slow
turnover of H4K16ac or the nucleosomes (Figure S6). Taken
together, these data suggests that NSL1, NSL3 and MBD-R2 are
required for efficient recruitment of TBP/TFIIB to target
promoters presumably for efficient PIC formation.
DRE and motif 1 are associated with Pol II loss caused byNSL depletion
Distinct classes of gene expression patterns, e.g. constitutive or
tissue-specific gene expression, are associated with particular
promoter DNA motifs. Yet, how the presence or absence of a
DNA motif is translated into biological functions often remains
elusive. Since the NSL complex preferentially binds housekeeping
genes, we wanted to investigate putative underlying DNA motifs
and associate them with the effects of NSL depletion on Pol II
recruitment.
We first assessed which motifs were enriched in NSL target
regions: The unbiased de novo motif finder MEME repeatedly
identified four known core promoter elements within NSL peak
regions: the E-box motif (CAGCTG), DRE (WATCGATW), the
reverse complement of a motif resembling DMv2 (TGGYAACR
[42]) and motif 1 (YGGTCCACTR [43]; Figure 6A, Figure S7).
Applying a quantitative model of transcription factor binding
affinities (TRAP) to the 10 well-known Drosophila core promoter
motifs [43,44], we detect a strong enrichment for DRE and E-box
as well as Motifs 1, 6, 7, 8 in NSL-bound promoters compared
with non-bound ones (p-values,0.0001, Wilcoxon rank sum test;
Figure 6B, Figure S8). This is in complete concordance with
previous genome-wide studies that suggested a preference of
housekeeping genes for these motifs [34,35].
We have shown that the NSL complex is crucial for Pol II
recruitment to housekeeping genes. However, Figure 4E reveals
variability in the extent of Pol II loss among genes with high NSL
binding signals. This is in line with the observation published by
Becker and colleagues [45]. One possible explanation could be
that different core promoter motifs underlie the variable responses
of NSL-bound genes to NSL loss. We thus assessed whether the
motif strengths is associated with the impact of NSL depletion on
Pol II recruitment. For this purpose, we stratified NSL-bound and
–non-bound genes into three subsets according to the magnitude
NSL Complex and Gene Regulation
PLoS Genetics | www.plosgenetics.org 7 June 2012 | Volume 8 | Issue 6 | e1002736
NSL Complex and Gene Regulation
PLoS Genetics | www.plosgenetics.org 8 June 2012 | Volume 8 | Issue 6 | e1002736
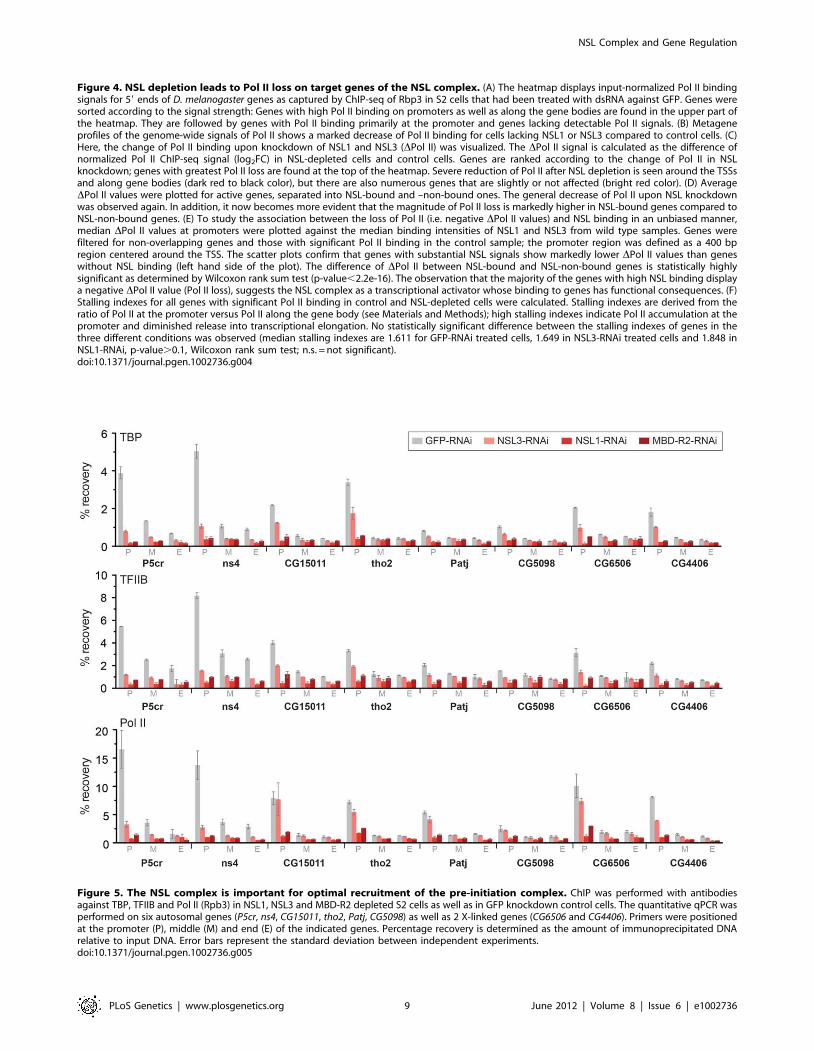
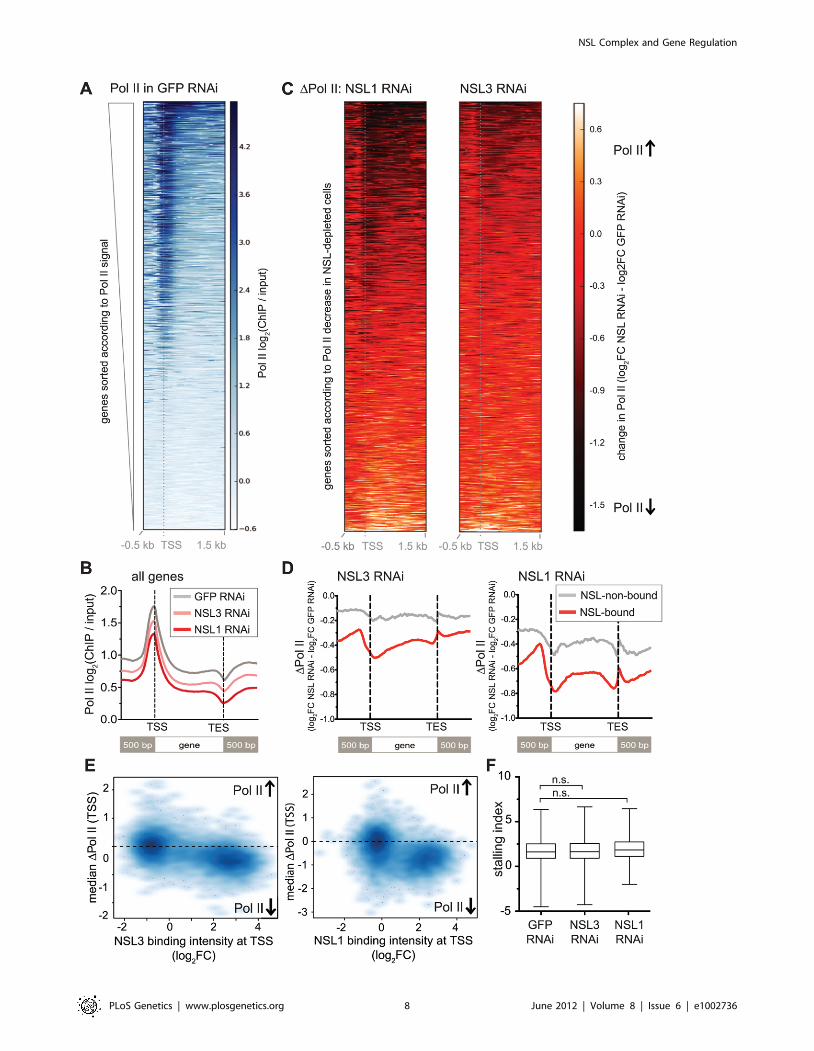
Figure 4. NSL depletion leads to Pol II loss on target genes of the NSL complex. (A) The heatmap displays input-normalized Pol II bindingsignals for 59 ends of D. melanogaster genes as captured by ChIP-seq of Rbp3 in S2 cells that had been treated with dsRNA against GFP. Genes weresorted according to the signal strength: Genes with high Pol II binding on promoters as well as along the gene bodies are found in the upper part ofthe heatmap. They are followed by genes with Pol II binding primarily at the promoter and genes lacking detectable Pol II signals. (B) Metageneprofiles of the genome-wide signals of Pol II shows a marked decrease of Pol II binding for cells lacking NSL1 or NSL3 compared to control cells. (C)Here, the change of Pol II binding upon knockdown of NSL1 and NSL3 (DPol II) was visualized. The DPol II signal is calculated as the difference ofnormalized Pol II ChIP-seq signal (log2FC) in NSL-depleted cells and control cells. Genes are ranked according to the change of Pol II in NSLknockdown; genes with greatest Pol II loss are found at the top of the heatmap. Severe reduction of Pol II after NSL depletion is seen around the TSSsand along gene bodies (dark red to black color), but there are also numerous genes that are slightly or not affected (bright red color). (D) AverageDPol II values were plotted for active genes, separated into NSL-bound and –non-bound ones. The general decrease of Pol II upon NSL knockdownwas observed again. In addition, it now becomes more evident that the magnitude of Pol II loss is markedly higher in NSL-bound genes compared toNSL-non-bound genes. (E) To study the association between the loss of Pol II (i.e. negative DPol II values) and NSL binding in an unbiased manner,median DPol II values at promoters were plotted against the median binding intensities of NSL1 and NSL3 from wild type samples. Genes werefiltered for non-overlapping genes and those with significant Pol II binding in the control sample; the promoter region was defined as a 400 bpregion centered around the TSS. The scatter plots confirm that genes with substantial NSL signals show markedly lower DPol II values than geneswithout NSL binding (left hand side of the plot). The difference of DPol II between NSL-bound and NSL-non-bound genes is statistically highlysignificant as determined by Wilcoxon rank sum test (p-value,2.2e-16). The observation that the majority of the genes with high NSL binding displaya negative DPol II value (Pol II loss), suggests the NSL complex as a transcriptional activator whose binding to genes has functional consequences. (F)Stalling indexes for all genes with significant Pol II binding in control and NSL-depleted cells were calculated. Stalling indexes are derived from theratio of Pol II at the promoter versus Pol II along the gene body (see Materials and Methods); high stalling indexes indicate Pol II accumulation at thepromoter and diminished release into transcriptional elongation. No statistically significant difference between the stalling indexes of genes in thethree different conditions was observed (median stalling indexes are 1.611 for GFP-RNAi treated cells, 1.649 in NSL3-RNAi treated cells and 1.848 inNSL1-RNAi, p-value.0.1, Wilcoxon rank sum test; n.s. = not significant).doi:10.1371/journal.pgen.1002736.g004
Figure 5. The NSL complex is important for optimal recruitment of the pre-initiation complex. ChIP was performed with antibodiesagainst TBP, TFIIB and Pol II (Rpb3) in NSL1, NSL3 and MBD-R2 depleted S2 cells as well as in GFP knockdown control cells. The quantitative qPCR wasperformed on six autosomal genes (P5cr, ns4, CG15011, tho2, Patj, CG5098) as well as 2 X-linked genes (CG6506 and CG4406). Primers were positionedat the promoter (P), middle (M) and end (E) of the indicated genes. Percentage recovery is determined as the amount of immunoprecipitated DNArelative to input DNA. Error bars represent the standard deviation between independent experiments.doi:10.1371/journal.pgen.1002736.g005
NSL Complex and Gene Regulation
PLoS Genetics | www.plosgenetics.org 9 June 2012 | Volume 8 | Issue 6 | e1002736

Figure 6. NSL target regions are enriched for housekeeping gene motifs, but only DRE and motif 1 are directly related to Pol II lossupon NSL depletion. (A) Individual de novo motif analysis led to the discovery of four non-repetitive DNA motifs that are located within NSL-complex binding sites (r.c. = reverse complement). The analysis was carried out by MEME [62,64] for 100 bp regions around the peak summits. Ascomputational restrictions of MEME allowed only a limited number of base pairs to be analyzed at a time, the results of the 500 highest peak regions
NSL Complex and Gene Regulation
PLoS Genetics | www.plosgenetics.org 10 June 2012 | Volume 8 | Issue 6 | e1002736

of Pol II loss on promoters and plotted the corresponding
distribution densities for each motif’s strength (Figure 6C, Figure
S9).
Based on the equally strong enrichment of motif 1 and DRE
(see Figure 6B) one might have expected a similar importance of
these motifs for the function of the NSL complex. Interestingly,
when we integrated the genome-wide Pol II binding data, we
observed that DRE and motif 1 are associated with Pol II loss
upon knockdown of NSL complex members in opposing manners:
For the DRE motif we see a positive correlation between the levels
of Pol II loss and the abundance of genes with high DRE TRAP
scores. Motif 1, on the other hand, is mostly associated with genes
that are least sensitive to Pol II loss after NSL depletion (light gray
line in Figure 6C). For NSL-non-bound genes, neither DRE nor
motif 1 show any enrichment in relation to Pol II loss. Enrichment
of E-box and other core promoter motifs (except motif 7, Figure
S9) do not exhibit a correlation with the sensitivity to NSL
complex depletions.
In conclusion, our analysis demonstrates that NSL-bound
promoters are enriched for core promoter motifs DRE, E-box
and motif 1, 6, 7, 8 and depleted for TATA, Inr, DPE and MTE
sequences. Even more importantly, the presence of DRE motifs is
positively associated with the degree of responsiveness of NSL
target genes to NSL complex depletion.
SummaryIn this study, we have revealed that the majority of the NSL-
complex-bound targets are housekeeping genes in Drosophila.
While chromatin-modifying complexes that regulate tissue-specific
genes, such as SAGA, polycomb and trithorax complexes, have
been studied extensively, global regulators of housekeeping genes
are poorly understood. To our knowledge, the NSL complex is the
first identified major regulator of housekeeping genes which is
consistent with a recently published study from Becker and
colleagues [45].
The promoters of NSL target genes exhibit prominent
enrichment of certain histone modifications (H4K16ac, H3K9ac,
H3K4me2, H3K4me3) as well as specific core promoter elements
(such as DRE, E-box and motif 1). Furthermore, these genes
display distinct nucleosome occupancy and dispersed promoter
configuration characterized by multiple transcription start sites.
The correlation between these promoter characteristics (well-
defined chromatin marks, TATA-less DNA sequences and broad
initiation patterns) was previously identified for housekeeping
genes in mammals and flies [36], but how these promoter features
are translated into gene transcription had remained elusive. We
now conclusively demonstrate that the NSL complex modulates
transcription at the level of transcription initiation by facilitating
pre-initiation complex loading onto promoters. Therefore, we
propose that the NSL complex is a key trans-acting factor that
bridges the promoter architecture, defined by the DNA sequence,
histone marks and higher chromatin structures with transcription
regulation of constitutive genes in Drosophila (Figure 7).
Excitingly, the enrichment of DNA motifs on NSL target gene
promoters in combination with the genome-wide Pol II binding
data has established functional links between the motifs enriched
on housekeeping genes and the NSL-dependent Pol II binding to
promoters. The abundance of DRE motifs, for example, was
found to be positively associated with the magnitude of Pol II loss
upon NSL knockdowns. The DRE binding factor (DREF)
interacts tightly with TRF2 to modulate the transcription of
DRE-containing promoters in a TATA-box-independent fashion
[46]. It is tempting to speculate that the NSL complex might also
cooperate with the TRF2 complex to facilitate transcription in a
specific manner, rendering DRE-containing promoters more
sensitive to NSL depletions. As the NSL-bound promoters are
associated with a large variety of transcription factors, it will be of
great interest to study whether the NSL complex communicates
with different transcription regulators, perhaps making use of
distinct mechanisms.
In contrast to DRE, motif 1 showed an opposing effect on Pol II
recruitment to NSL-complex-bound genes as the presence of
strong motif 1 sequences was associated with decreased Pol II loss
upon NSL depletion. The mechanistic reasons for this remain
unclear. However, one can envisage several possible scenarios. It is
possible that motif 1 may recruit another transcription factor,
which can also function to recruit the transcription machinery.
Alternatively, the turnover of the transcription machinery might
be slower on promoters containing strong motif 1 sequences.
There is precedent for the transcription machinery having various
turnover rates on different promoters. For example, in yeast, it has
been shown that TBP turnover is faster on TATA-containing than
on TATA-less promoters [47]. It is therefore possible that certain
levels of the initiation complexes may still be maintained on motif-
1-containing promoters, even though the recruitment of the
transcription machinery will be compromised in the absence of
NSL complex. Further work is required to understand the
importance of sequence determinants for NSL complex recruit-
ment and our analysis sets the grounds for targeted experiments in
the future.
Taking MOF-mediated H4K16 acetylation into consideration,
a putative role of the NSL complex might be to coordinate the
opening of promoter architecture by histone acetylation and the
assembly of PIC. Coupling of histone acetylation and PIC
formation has been described before. For example, TAF1, a
component of TFIID, is a histone aceyltransferase [48]. The
SAGA complex, which contains Gcn5 and can acetylate H3K9, is
reported to interact with TBP and other PIC components to
regulate tissue-specific genes [49,50] and the recruitment of P300
are shown here (for additional peak regions see Figure S7). (B) Motif enrichments were calculated with TRAP [44,63] using the motif matrices for the10 known core promoter motifs identified by [43]. In our study, the TRAP score can be seen as a measure for the affinity of transcription factors tobind to the DNA regions of interest. We compared the TRAP scores for NSL-bound and –non-bound promoter regions (TSS +/2200 bp) and foundOhler motifs 1, 6, 7, 8 as well as DRE and E-box significantly and selectively enriched in NSL-target regions while TATA box, Inr, DPE and MTE aredepleted. The bar plot depicts the fold change between the median TRAP scores of NSL-bound versus –non-bound regions; individual frequencydistributions of the motifs’ TRAP scores can be seen in Figure S8 (for constitutitve gene promoters). P-values for the comparison of NSL-bound versus–non-bound promoters were calculated with two-sided Wilcoxon rank sum test, **** = P,0.0001, *** = P,0.001, ** = P,0.01, * = P,0.5. (C) Todetermine the significance of the Ohler motifs for the function of the NSL complex, genes were divided into three classes according to the magnitudeof Pol II loss. The 1st subset (red line) corresponds to genes with the most severe Pol II reduction upon NSL knockdown while the 3rd subset (light grayline) contains least affected genes. Density distributions of TRAP scores were then plotted for NSL-bound and –non-bound genes for each Ohler motifindividually. For DRE and motif 1 there is a clear distinction between the differently affected NSL-bound genes: NSL targets that lose Pol II bindingmost dramatically after NSL knockdown (red line) are clearly enriched for high DRE TRAP scores. In contrast, motif 1 shows an inverse patterncompared to DRE: NSL-bound genes with mild Pol II loss (light gray line) tend to contain strong motif 1 sites. This trend is not observed in NSL-non-bound genes. Other motifs such as E-box and TATA box also did not show significant association (also see Figure S9).doi:10.1371/journal.pgen.1002736.g006
NSL Complex and Gene Regulation
PLoS Genetics | www.plosgenetics.org 11 June 2012 | Volume 8 | Issue 6 | e1002736

to the promoter and H3 acetylation have been shown to proceed
binding of TFIID in a coordinated manner [51]. H4K16ac is also
well-known for its role in transcription regulation of the male X
chromosome, yet how H4K16 acetylation and PIC assembly are
coordinated remains elusive. Interestingly, absence of the NSL
complex does not severely abolish H4K16ac from target genes.
Since the turnover of H4K16ac on target promoter is unknown, it
remains possible that H4K16ac could remain for some time at the
promoter after the NSL complex is depleted. Further studies will
be crucial in unraveling the functional relevance of H4K16
acetylation and NSL complex function on housekeeping genes.
Materials and Methods
Chromatin immunoprecipitation (ChIP) and real-timePCR
Chromatin immunoprecipitation was carried out on S2 cells as
previously described [21]. Fixed chromatin was sheared into
200 bp fragments and probed with antibodies against Drosophila
TBP, TFIIB, Pol II, H4K16ac (sc8662, Santa Cruz), H4 (ab7311,
Abcam), NSL1, MCRS2, NSL3 and MBD-R2 [21].
Real-time PCR validation was performed with SYBR-Green
PCR master mix (Applied Biosystems) and an ABI7500 real-time
PCR thermocycler (Applied Biosystems, Inc.). Recovery was
determined as the amount of immunoprecipitated DNA relative
to input DNA.
Deep sequencing of ChIP samplesDeep sequencing of NSL3 and MBD-R2 ChIP and input
samples was carried out with the Illumina Genome Analyzer II,
Pol II ChIP (from GFP-RNAi, NSL1-RNAi, NSL3-RNAi) and
respective input samples were deep-sequenced with an Illumina
HiSeq2000 machine according to manufacturer’s instructions.
MappingThe sequence reads from our earlier study of NSL binding in
salivary glands [21] and the newly generated data from S2 cells
were aligned to the D. melanogaster genome (dm3) using bowtie [52]
with identical parameters. We allowed up to two mismatches and
reported only the best alignments which could be aligned
uniquely. We obtained 28,335,659 and 27,328,733 uniquely
mapped reads for NSL3 and MBD-R2 respectively (input:
24,271,994 reads). The re-mapping of the NSL1 and MCRS2
data resulted in 7,622,096 and 9,405,874 unique reads (input:
6,168,473 reads).
From the samples sequenced with HiSeq 2000, we obtained
between 120 to 135 million reads for Pol II ChIPs from S2 cells
with knockdowns of NSL1, NSL3, and GFP and 50 to 60 million
reads for the corresponding input samples. The correlations
between the biological replicates of Pol II ChIP-seq reads from
NSL1 and NSL3 knockdowns were excellent (Figure S5).
Peak callingWe used MACS Version 1.4.0rc2 on bed-files of mapped reads
from the ChIP-seq experiments of NSL1, MCRS2, NSL3, MBD-
R2, and an input control. We employed standard parameters for
D. melanogaster (including model-building) and a p-value cut off of
1025 [53]. We invoked PeakSplitter [54] as part of the MACS
routine to obtain subpeak coordinates. For downstream analyses
we used the subpeaks of peaks with a false discovery rate #5%.
Figure 7. Summary model: NSL-dependent Pol II recruitment to promoters of housekeeping genes. The majority of the NSL-boundtargets are constitutively expressed or ‘‘housekeeping’’ genes. These genes are characterized by prominent enrichment of particular histonemodifications (H4K16ac, H3K9ac, H3K4me2, H3K4me3) as well as specific core promoter elements (such as DRE, E-box and motif 1; indicated bycolored squares). In contrast, tissue-specific or developmentally regulated genes (small inlay) usually contain the TATA-box as the most prominentcore promoter element. We propose that the NSL complex acts as a regulator of constitutively expressed genes by facilitating stable recruitment ofthe pre-initiation complex (PIC) members such as Pol II, TBP and TFIIB on target genes. NSL complex may therefore serve as an important linkbetween specific promoter architecture and PIC assembly.doi:10.1371/journal.pgen.1002736.g007
NSL Complex and Gene Regulation
PLoS Genetics | www.plosgenetics.org 12 June 2012 | Volume 8 | Issue 6 | e1002736

Unless noted otherwise, peak summit regions were henceforth
defined as the 40 bp region surrounding a summit identified by
PeakSplitter.
Previous ChIP-seq analyses of Pol II have revealed that there
are at least two types of Pol II signals: a sharp peak around the
TSS of genes that can be either expressed or stalled, and an
additional wide-spread region of moderate enrichment over the
body of genes which is associated with transcription elongation,
pausing and termination. The composite nature of the Pol II signal
is not captured optimally by MACS, therefore we normalized the
read counts (per 25 bp bins) of the Pol II ChIP-seqs with the
BioConductor package DESeq [55], calculated the log2 fold
changes (log2FC) between library-size-normalized input and ChIP
samples and applied a 400 bp sliding window to account for the
fragment size obtained after sonication. To determine regions of
significant Pol II enrichment we modeled the distribution of
log2FC values based on negative log2FCs that are assumed to
correspond to experimental noise. We calculated the threshold
log2FC values for significant Pol II binding within the three
different conditions at an FDR-value cut-off of 0.05 (method
described in more detail in [56]). The threshold log2FCs were
0.64, 0.84 and 1.39 for Pol II signals from GFP-RNAi, NSL3-
RNAi, and NSL1-RNAi, respectively.
Lists of genes and associated NSL peaksThe basis of our gene-focused analyses was the list of annotated
genes from FlyBase (version 5.30). Genes that are active in S2 cells
were obtained from [28]. Data from [31] was used for a list of
constitutively active genes: 5,534 genes expressed above a
significance threshold (set by [31]) in all 30 developmental stages
of D. melanogaster were considered constitutively expressed (house-
keeping genes). To identify genes that were active in S2 cells, but
not constitutively expressed, the gene identifiers of the different
lists were adapted with the help of the FlyBase ID converter tool
and subsequently subtracted from each other.
Unless indicated otherwise, a TSS was defined NSL-bound
when the 400 bp region surrounding the TSS overlapped with an
NSL peak summit region. The scripts, BEDTool commands and
Galaxy workflows used for these overlaps and analyses are
available upon request [57,58].
Calculation of Pol II stalling indexesFor the calculation of the stalling indexes we first applied
stringent filters to the genes that were taken into account: we
included only non-overlapping genes greater than 1,300 bp and
with median Pol II signals above the threshold (see above) at the
promoter region. Promoter regions were defined as TSS +/
2200 bp, for the gene body regions we excluded 500 bp after the
TSS and 500 bp before the transcription end site (TES) to avoid
confounding effects of transcription initiation and termination.
Based on previous reports by Muse et al. [39], the stalling index
(SI) itself was calculated as follows: SI = log2(r (TSS)/r (gene body))
where r is the sum of Pol II ChIP-seq read counts that were
adjusted by the input sample and normalized to the region’s
length.
Calculation of DPol IITo assess the change of Pol II upon NSL depletion in
comparison to the GFP-RNAi control sample, DPol II was
calculated as follows: DPol II = log2FC (NSL-RNAi)2log2FC
(GFP-RNAi).
Graphical representationsWe visualized the binding profiles of the NSL complex proteins
with our locally installed GBrowser (Version 2.15), uploading
normalized log2FCs and wiggle files from modEncode.
For the summary plots of the histone marks (Figure 2A), we
extracted the log2FCs from publicly available ChIP-chip data: The
2,000 bp TSS regions were split into 100 bins and the average
log2FCs were calculated for each bin and normalized to the
corresponding H4 signals.
For the heatmaps shown in Figure 2D we divided the annotated
genes (FlyBase version 5.30) into active and inactive in S2 cells
[28]. Active genes were further classified as constitutively and not-
constitutively transcribed according to [31] (see above). For each
gene, we extracted the normalized log2FCs (ChIP/input) from our
ChIP-seq data (NSL1, MCRS2, NSL3, MBD-R2) and published
ChIP-chip data of Pol II [32] in 50 bp bins for 1,000 bp up- and
downstream of the TSSs. The heatmaps were generated with R
using the same scale for every individual image and maintaining
the order of the underlying TSS lists to enable direct comparisons
between the different binding profiles on the same genes.
Mitochondrial genes were excluded.
For the heatmaps of Pol II and DPol II (Figure 4A, 4C) we used
all D. melanogater genes except mitochondrial genes. The log2FC of
Pol II from the GFP-RNAi sample and DPol II (see above) for
NSL3-RNAi and NSL1-RNAi were extracted in 50 bp bins for
the regions 500 bp up- and 1,500 bp downstream of each gene’s
TSS. Genes were sorted according to the cumulative signal within
the displayed region as indicated in the respective figures and
legends.
For the metagene profiles of Pol II and DPol II signals as shown
in Figure 4B and 4D, gene bodies of non-overlapping, size-filtered
genes were scaled to the same length; log2FCs (ChIP/input) were
extracted accordingly. Venn diagrams were generated with Venny
[59].
Nucleosome occupancy analysisWe measured nucleosome occupancy for constitutively ex-
pressed NSL-bound genes, constitutively expressed NSL-non-
bound genes and tissue-specific genes in a 200 bp area surround-
ing their annotated TSSs (4,971, 717 and 6,138 genes respective-
ly). Nucleosome maps for S2 cells were obtained from GEO
(accession number: GSE22119 [38]). NSL-bound genes for this
analysis were defined as those bound by any of the NSL1, NSL3,
MCRS2 or MBD-R2 subunits. Constitutive genes were defined as
in [31] (see above). Tissue-specific genes were selected as in [60]
on the basis of the ‘gene scores’ derived from Affymetrix tiling
arrays for 25 different cell lines and 30 developmental stages
(modENCODE accession number: modENCODE_3305). In
order to avoid any bias in nucleosome organization due to
differences in gene expression levels, genes were stratified in
quartiles according to their expression value (ArrayExpress: E-
MEXP-150 [61]). Finally, for each gene, nucleosome occupancy
was calculated as the sum of overlapping reads with a 200 bp area
up- and downstream its TSS.
Nucleosome metaprofiles were calculated using the average sum
of overlapping reads with 25 bp bins spanning the area 500 bp up-
and 1000 bp downstream of the TSS of each gene.
MEMEWe sorted the peaks identified by MACS and PeakSplitter
according to their summits’ tag counts and extracted the DNA
sequences for a 100 bp region centered around them. The peak
NSL Complex and Gene Regulation
PLoS Genetics | www.plosgenetics.org 13 June 2012 | Volume 8 | Issue 6 | e1002736

summits were analyzed by MEME [62] in subsequent analyses of
500 sequences each with the following parameters: revcomp,
nmotifs = 3, minw = 6, maxw = 12, minsites = 10.
Motif enrichment: TRAP analysisIn addition to the de novo motif analysis by MEME, we studied
sequence properties of NSL-targets using 10 motif matrices from
the supplementary material of [43]. As transcription factors can
bind to DNA with a range of affinities, we employed a biophysical
model (TRAP [44,63]) that predicts the binding affinity for a motif
in a given sequence fragment. We refer to the logarithm of this
number as the TRAP score that indicates the strength of the
putative protein-DNA interaction for each Ohler motif within a
region of interest. The TRAP score enables us to quantitatively
assess the corresponding binding affinities, i.e. we do not rely on
the binary classification of motif presence or absence. Instead we
are able to compare the ‘‘protein binding capacity’’ of different
regions of interest.
We applied the TRAP model to NSL binding sites and
promoter regions, which we defined as +/2200 bp around the
TSS. To assess the localization of the binding signals, more
precisely, the TRAP score was calculated for sliding windows of
40 bp over this region. The average TRAP scores for each window
were then compared between specific sets of promoters regions
(NSL-targets and -non-targets).
To assess the relation between DPol II and the TRAP score
(Figure 6C, Figure S9), we focused on the promoter regions of
non-overlapping genes with median Pol II signal (log2FC) above
the threshold value in GFP-RNAi and DPol II below 0 (i.e., loss of
Pol II upon NSL knockdown). Tertiles based on DPol II were
determined with the quantile function of R. We used a 100 bp
window around the TSS for TRAP score calculation for all motifs
except TATA (40 to 20 bp upstream of the TSS), Inr (TSS +/
220 bp), and DPE (20 to 40 bp downstream of the TSS). Density
plots were generated with the R package ggplot2.
Chromatin state associationsWe downloaded the bed-files with the genomic coordinates of
the 9-state-chromatin model of [30] for S2 cells and the chromatin
color model of [29] from modENCODE and identified the
number of peak summits (2 bp) or TSSs intersecting with the
different states. We also divided the peak summits into three
groups according to their overlap with annotated TSSs: proximal
(within +/2200 bp), peripheral (between +/2201–800 bp) and
distal subpeaks (farther away than 800 bp).
Data from public repositoriesFor the analysis of histone marks and non-histone chromosome
proteins, we downloaded the wiggle-files of ChIP-chip experiments
on S2 cells from modEncode/Gene Expression Omnibus.
H3K4me3-S2: GSE20787
H3K4me2-S2: GSE23470
H4K16ac-S2: GSE20799
H3K27me2-TJ.S2: GSE27790
H3K9ac-S2: GSE20790
H4K5ac-S2: GSE20800
H3K18ac-S2. GSE20775
MOF_Q4145.S2: GSE27806
WDS_Q2691.S2: GSE 20835
H4: repset.4620571
Pol II: GSM463297
Nucleosome maps: GSE22119
S2 gene expression data for nucleosome occupancy: E-MEXP-
1505 [61]
Primers used for qPCRL = forward primer, R = reverse primer.
CG6506-pro-L: GCCGATGTTTACCGACAATC
CG6506-pro-R: CATGGTTGGTTATCGGGACT
CG6506-Mid-L: ATCCGTGCCTAATGATACCG
CG6506-Mid-R: ACGGTTGGTGTGAACCAAAT
CG6506-end-L: ACAGTCAGCTCCCAGCAGAT
CG6506-end-R: AAAGTGGCGTGAAAGTTGCT
Sec5-pro-L: GCTGCTCAGCAAGGAGACTT
Sec5-Pro-R: CGGACGAGCATAAAAAGAGC
Sec5-mid-L: GAACTCCCATTGGCGATAAA
Sec5-mid-R: AAATGTCTGGCGAAATGTCC
Sec5-end-L: ATCAACGGCTTCATCTTTCG
Sec5-end-R: GCGTTTTCTTCCATTTTCCA
ODSH-Pro-L: CCCATTTTTCCCACTGACTG
ODSH-Pro-R: GGCGCGTACAAATGAAAAAT
ODSH-Mid-L: AAGATCCGCTAAGCGATGAA
ODSH-Mid-R: GCCAGGAGTTGAAGTTGGTC
ODSH-End-L: AGGCTCTCGTGGGGTAAAAT
ODSH-End-R: GAGCTCACCGATTTGTTTCC
CG15011-pro-L: CAGCCCTGGTATTCGATGTT
CG15011-pro-R: CTCATCTTGGATCGGATCGT
CG15011-Mid-L: CCTGCCACAAGGAACACTTT
CG15011-Mid-R: AGCTGCAACAAGCACAAATG
CG15011-end-L: ACACGGTGTTCTTCCAGTCC
CG15011-end-R: CGCTAAGGAACGTCGAAATC
CG14872_Pro_L: AATCGAGACATTCAGGCACTC
CG14872_Pro_R: TTCCCACACTGAAAAATCCA
CG14872_Mid_L: AAGAGCTTGAACAGCGGAAC
CG14872_Mid_R: GATACGCAAACCGGCATC
CG14872_End_L: TCACGCTCTAAAACCCCAGA
CG14872_End_R: CAGTACGGCATGGGCAAC
Patj_Pro_L: GAGTGCATAGGAGAGGGTAAACA
Patj_Pro_R: GTGGCGTTGGCACACTTT
Patj_Mid_L:CGTCGGTCACCACAATGA
Patj_Mid_R: TTATCCGCCAAGGGTACAAC
Patj_End_L: ACGCGGTTGCTAACTAATGG
Patj_End_R: ACTTCTGGCATCGTTTCTGAC
tho2_Pro_L: CCTCGGATCAGGTGGTACA
tho2_Pro_R: GTCACACTGGCGGAACTAACT
tho2_Mid_L: GGCCACATCCGTGTTTATGT
tho2_Mid_R: GCCAAGACACACTCGTCCA
tho2_End_L: GCTTCACAATGCACGGAAC
tho2_End_R: GAGGAGCGGCAGTACATCA
Ent2_Pro_L: CGTAACGGCACCCCTCAA
Ent2_Pro_R: ACCGCACCGCACTACAAG
Ent2_Mid_L: CCGCCATCCTAGTGCTGCT
Ent2_Mid_R: GCTGCTCCGGCTAATGGT
Ent2_End_L: TCTCGTATCTGGGACCATTTT
Ent2_End_R: TCCCGGAACTGGTATTGAG
Bap170_Pro_L: CCTGCTCGTGAATGCAACT
Bap170_Pro_R: GTGGCGTGAATGGGAAAC
Bap170_Mid_L: ACCCCCAGCATTGTTCCT
Bap170_Mid_R: CTTTCCTCAGACGCCACTTC
Bap170_End_L: ATGAACCGACACACGACTGA
Bap170_End_R: GCCGTAGCCGAGTAGGTGA
Incenp_Pro_L: GTTCTTTCCCTTACCATTTTCC
Incenp_Pro_R: GTTCCCGCCACTACCATCT
Incenp_Mid_L: GAGGACGAGTCGGTGGAG
Incenp_Mid_R: TTGAAAAGCTCATGTGTACGG
Incenp_End_L: GCCACGTAAGGGGAGAGG
Incenp_End_R: GTTCGGGAATATCTGCTTTAGG
ns4_Pro_L: GAGATGCCAACTTGTAGGTGATT
ns4_Pro_R: AAATACATGCAGAGACAGGAGGT
NSL Complex and Gene Regulation
PLoS Genetics | www.plosgenetics.org 14 June 2012 | Volume 8 | Issue 6 | e1002736

ns4_Mid_L: GCAAGGTGGTCAGCGTTAGT
ns4_Mid_R: GACTAGACCGGGACAATCACA
ns4_End_L: GACAGCGAGGATGAAGACGA
ns4_End_R: CAGCAGAGCAAACACGTTCC
CG5098-Pro-L: GGTCTTGTTTATGGGCGAAA
CG5098-Pro-R: GAGGGAAAGGCGACCTAATC
CG5098-Mid-L: GATGAGCCTCCCAAAAATCA
CG5098-Mid-R: GGCTACTTTGGCTGCTATGC
CG5098-End-L: GGGCATTTCGTAATCCAAGA
CG5098-End-R: TTTGGGGAAGGGAACCTAAC
p5cr_Pro_L: CACACCAAAGCTCAGAGGAGT
p5cr_Pro_R: CCGATTGCATGGGCGTAG
p5cr_Mid_L: GCGAGGGCTGCACTGTTT
p5cr_Mid_R: TGGACTCGGGCACCTGTT
p5cr_End_L: ATGTAATCCCCCGGAACA
p5cr_End_R: GCAAGAAGGATCGGGAATAA
CG4406-pro-R: TATCGACGGTCACACTGCTC
CG4406-mid-L: CCTGGAACTTGAGGAATCCA
CG4406-mid-R: GGCAGCAATGTGCTCATCTA
CG4406-end-L: AGCTCGGAAGGAAACTGTGA
CG4406-end-R: GTGACCAAAAAGCCCTTCAA
RNAi in S2 cellsRNAi of S2 cells was performed as described previously [21].
All knockdown cells were transfected with 10 mg dsRNA against
NSL1, NSL3, MBD-R2 or GFP using Lipofectamine RNAiMAX
(Invitrogen) and were harvested after 6 days. EGFP control RNAi
experiments were performed in parallel.
RNAi sequences used to generate dsRNA for thefollowing genes
NSL1:
T7-NSL1 sense: 59- TTA ATA CGA CTC ACT ATA GGG
AGA ATG GCC CCA GCG CTC ACA-39
T7-NSL1 antisense: 59- TTA ATA CGA CTC ACT ATA GGG
AGA TGA ACT TGT GGC CAC TGC C-39
NSL3:
T7-NSL3 sense: 59- TTA ATA CGA CTC ACT ATA GGG
AGA TCC TTG GCG ACT ACC TCA TC-39
T7-NSL3 antisense: 59- TTA ATA CGA CTC ACT ATA GGG
AGA GTA CCA TTT CGG CCC CTA GTG-39
MBD-R2:
T7-MBD-R2 sense: 59- TTA ATA CGA CTC ACT ATA GGG
AGA CGC TGG CCA CGT TTA TTA AG-39
T7-MBD-R2 antisense: 59- TTA ATA CGA CTC ACT ATA
GGG AGA TTG AAG AGA AAA AGC TTG TAC GG-39
EGFP:
T7-EGFP sense: 59-TA ATA CGA CTC ACT ATA GGG AGG
ATG GTG AGC AAG G
T7-EGFP antisense: 59-TA ATA CGA CTC ACT ATA GGG
AGG ATC GCG CTT CTC G
Accession numbersAll ChIP seq data is available in the ArrayExpress database
(http://www.ebi.ac.uk/arrayexpress/) with the accession numbers
listed below.
NSL1 and MCRS2 ChIP-Seq from salivary glands: E-MTAB-
214
NSL3 and MBD-R2 ChIP-Seq from S2 cells: E-MTAB-1085
Pol II ChIP-Seq from S2 cells (GFP-RNAi, NSL1-RNAi,
NSL3-RNAi): E-MTAB-1084
Supporting Information
Figure S1 General characteristics of NSL binding profiles. (A)
ChIP-Seq peaks obtained from NSL profiles were classified
according to their distance from the nearest annotated TSS.
The bar chart shows that the majority of NSL binding events is
closely associated with annotated TSSs: 68.7% of NSL3 peaks,
67% of MBD-R2 peaks, 81.5% of NSL1 peaks, and 76.1% of
MCRS2 peaks localize within 800 bp up- or downstream of the
nearest TSS. The schematic diagram below the bar chart
visualizes our definitions: proximal peaks localize within +/
2200 bp (dark blue), peripheral peaks between 201–800 bp (light
blue) and distal peaks are farther away than 800 bp from a TSS
(white). (B) The strongest signals of NSL binding are observed
within 200 bp of annotated TSSs. This is shown by the box plot of
tag counts of peak summits classified as TSS-proximal, -
peripheral, or –distal (whiskers = 2.5–97.5 percentiles). (C) The
lack of complete overlap of NSL target genes is mainly due to
stringent criteria for defining target genes. In Figure 1B, 1,036
genes were shown as ‘‘bound by NSL3 and MBD-R2 only’’ and
357 genes as ‘‘bound by NSL1 and MCRS2 only’’. We therefore
addressed whether these two groups could constitute gene sets that
are specific for S2 cells or salivary glands. For this purpose, input-
normalized ChIP-seq signals for the promoters for each group of
genes were extracted, including those that are bound by all or
neither NSL proteins. The box plot shows that the signal of NSL1
and MCRS2 is still significantly higher in those genes that were
labeled as ‘‘bound by NSL3 and MBD-R2 only’’ than for those
that were defined as NSL-non-bound (p-value,2.2e-16, Wilcoxon
test). The same holds true for NSL3 and MBD-R2. Therefore,
differences in gene sets are very likely not due to tissue-specific
binding, rather to the choice of a very stringent cut-off for the
binary decision ‘‘bound’’ or ‘‘not-bound’’. For details about our
definition of NSL target genes, see Materials and Methods and
Figure 1B.
(PDF)
Figure S2 Assessing the overlaps of NSL signals on gene
promoters. (A) Median expression levels between expressed genes
that are bound by all four NSLs concomitantly do not differ
significantly from expressed genes devoid of NSL binding as
shown by the box plot (whisker = 2.5–97.5 percentiles). The
expression scores were taken from [28]. (B) The NSL complex
preferentially binds to regions of open and actively transcribed
chromatin (state 1, [30]) as peak summits intersected with the
regions reported by [30] are dramatically enriched for state 1
(regardless of their localization). (C) Overview of TSS-associated
NSL binding: 19.25% of annotated TSSs are bound by NSL1,
MCRS2, NSL3, and MBD-R2 concomitantly. When looking at
the subsets of active and housekeeping genes, the numbers increase
to 37.1% (active) and 43.9% (constitutive) that are bound by all
four NSLs across different cell types and experiments. To confirm
the findings that were based on our own definition of
housekeeping genes (see Materials and Methods), we also tested
a previously published set of broadly and restrictedly expressed
genes [65]. (D) The Venn diagram shows the individual overlaps
of the gene promoters bound by the single NSL proteins. The core
intersect (2,430) corresponds to the gray bar of ‘‘constitutive
genes’’ in Figure S2C, while the total number of 4,950 represents
the number of constitutive TSSs bound by at least one NSL. (E)
Constitutive genes classified as NSL-non-bound according to our
criteria described in Materials and Methods (see Figure 1 for
visualization) show slightly, but significantly elevated levels of NSL
binding compared to non-constitutively expressed genes. This
verifies the preference of the NSL complex for housekeeping genes
NSL Complex and Gene Regulation
PLoS Genetics | www.plosgenetics.org 15 June 2012 | Volume 8 | Issue 6 | e1002736

and suggests that some constitutive genes classified as NSL-non-
bound were missed due to the cut-off we used for all four samples.
The boxplot shows the median log2FCs (ChIP/input) for the
400 bp regions centered around TSSs. The medians were
calculated for each gene based on the ChIP-seq tags of all four
analyzed NSL proteins.
(PDF)
Figure S3 NSL-bound and NSL-non-bound housekeeping genes
display different nucleosome organizations. Nucleosome occupan-
cy metaprofiles for NSL-bound (red), constitutively expressed
NSL-non-bound (gray) and tissue-specific (black) genes. Metapro-
files were calculated for each group as the sum of nucleosome
reads overlapping 25 bp bins spanning the 2500/+1000 bp
region centered at the TSS of each gene. The non-shaded white
area corresponds to the 2200/+200 bp region used for the
analysis in Figure 3B.
(PDF)
Figure S4 Depletion of different NSL proteins have distinct
effects on the stability of the remaining NSL complex members but
not for Pol II machinery components. (A) Western blot analyses of
cytoplasmic (C) and nuclear (N) extracts from S2 cells that had
been treated with dsRNA against GFP, MBD-R2, NSL1, and
NSL3. Depletion of NSL1 greatly affects the stability of other NSL
complex proteins namely: NSL2, NSL3, MCRS2, MBD-R2 and
WDS. Depletion of NSL3 or MBD-R2 has milder effects on the
levels of other NSL proteins. MOF protein levels appear affected
upon MBD-R2 depletion but not in NSL1 or NSL3 knockdowns.
In contrast, TBP, TFIIB and Pol II are only modestly affected in
either knockdown especially when taking into consideration the
loading control Nuclear RNA export factor 1 (NXF1). (B) To
check whether the dsRNA treatment against NSL3, NSL1, and
MBD-R2 efficiently reduced NSL binding to its target regions,
ChIP was performed with antibodies against NSL1, NSL3 and
MBD-R2 in the respective knockdowns in S2 cells. GFP-RNAi
was used as a control. ‘‘P’’, ‘‘M’’, ‘‘E’’ represent promoter, middle
and end of gene, respectively. Error bars represent the standard
deviation of three independent experiments.
(PDF)
Figure S5 Correlation of biological duplicates for the ChIP-seq
of Pol II in knockdowns of NSL1 and NSL3. Correlation plots
between the two Pol II ChIP-seq libraries generated from
duplicate knockdown experiments for (a) NSL3 and (b) NSL1.
Reads were mapped to the genome with bowtie. The read counts
plotted here were extracted for 25 bp bins along the entire D.
melanogaster genome. The Spearman correlations for the biological
replicates are excellent (0.96 for NSL3-RNAi samples, 0.97 for
NSL1-RNAi samples).
(PDF)
Figure S6 Chromatin immunoprecipitation of H4K16ac in
NSL1, NSL3 and MBDR2 depleted cells. ChIP-qPCR was
performed using antibodies against H4K16ac and H4 in NSL1,
NSL3 or MBD-R2 depleted cells. The H4K16ac signal is
normalized against H4 signal from the same region. Consistent
with our previous results, H4K16ac is very modestly reduced upon
depletion of NSL complex members. The quantitative qPCR was
performed on 5 autosomal genes (P5cr, ns4, CG15011, tho2, Patj,
CG5098) as well as 2 X-linked genes (CG6506 and CG4406). Primers
were positioned at the promoter of the indicated genes. Error bars
represent the standard deviation of three independent experiments.
(PDF)
Figure S7 De novo motif identification in NSL binding regions.
(A) Motifs identified by MEME in peak summit regions of NSL3,
MBD-R2, NSL1, and MCRS2. Results of MEME analyses of
peaks ranked 501–1,000 (r.c. = reverse complement) confirm the
motifs identified in the 500 highest peaks as shown in Figure 6A.
(B) Results of MEME analyses of 500 peak summits that were not
selected solely according to their height, but also on the basis of
their association with constitutively expressed genes. The motifs
and their occurrences recapitulate the results from the analysis of
the highest intensity peaks (Figure 6A), reinforcing the preference
of NSL targeting to genomic regions containing the motifs shown
above.
(PDF)
Figure S8 Comparison of motif enrichments for NSL-bound
and –non-bound constitutively active TSSs. (A) The bar chart
displays the fold change of the core promoter affinities for the
sequences of NSL-bound promoters (concomitant binding of
NSL1, MCRS2, MBD-R2, NSL3) compared to NSL-non-bound
promoters (not bound by any of the NSL proteins). The bar chart
shows that even when motif enrichments are calculated within the
subset of constitutively active genes, NSL-bound promoters are
enriched for motif 1, DRE, E-box, motif 6, 7 and 8 whereas the
depletion of TATA box, Inr motif, DPE and MTE becomes less
evident. P-values were calculated with two-sided Wilcoxon rank
sum test, **** = P,0.0001, *** = P,0.001, ** = P,0.01,
* = P,0.5, not significant (n.s.) = P.0.5. The fold change was
calculated as log(median(TRAP score of NSL-bound promoters)/
median(TRAP score of NSL-non-bound promoters)). (B) Individ-
ual TRAP score [44,63] histograms for the 10 core promoter
motifs [43] that underlie the bar chart of S6A. The histograms
show the distributions of the motif affinities for NSL-bound and –
non-bound promoters of housekeeping genes. The visible shifts
towards higher or lower TRAP scores in NSL-bound or –non-
bound genes, respectively, represent the fold changes seen in the
bar chart.
(PDF)
Figure S9 TRAP score densities of NSL-bound and –non-
bound genes. We selected non-overlapping genes that showed
significant Pol II binding in control samples and reduced Pol II
levels in NSL knockdown conditions and sorted them into three
groups according to the magnitude of Pol II loss. The 1st subset
(red line) contains genes with the strongest reduction of Pol II in
promoter regions; the 3rd subset (gray line) correspondingly
contains genes with smallest Pol II loss. TRAP score was
calculated as a measure of protein binding affinity towards the
known promoter motifs identified by Ohler et al. [43]. Of the
motifs shown here, only motif 7 displays a moderate association
between the motif’s strength and Pol II loss upon NSL depletion
(for remaining motifs see Figure 6C).
(PDF)
Table S1 Overview of the numbers of NSL peaks overlapping
with annotated TSSs. The numbers of peaks (regions of significant
NSL binding signals) determined by MACS [53] are comparable
between the different proteins. However, the increased sequencing
depth of the NSL3 and MBD-R2 ChIP-seq experiments led the
detection of expanded regions of NSL binding signals that is
reflected by more widespread peak. The PeakSplitter algorithm
[54] divides peaks identified by MACS at sites of local maxima.
(PDF)
Acknowledgments
We thank J. T. Kadonaga for providing the Drosophila TBP and TFIIB
antibodies. We thank A. G. Ladurner for providing the anti-RBP3
antibody. We thank the members of the lab for helpful discussions and
NSL Complex and Gene Regulation
PLoS Genetics | www.plosgenetics.org 16 June 2012 | Volume 8 | Issue 6 | e1002736

critical reading of the manuscript; F. M. is particularly indebted to F.
Cavalli and F. Ramirez. We are grateful to the EMBL gene core facility
and the Next Generation Sequencing Group in the department of Martin
Vingron at the Max-Planck-Institute for Molecular Genetics, Berlin, for
deep sequencing.
Author Contributions
Conceived and designed the experiments: AA. Performed the experiments:
KCL SJR HH. Analyzed the data: KCL FM JMV TM NML AA.
Contributed reagents/materials/analysis tools: AA NML TM. Wrote the
paper: KCL FM JMV NML TM AA.
References
1. Juven-Gershon T, Kadonaga JT (2010) Regulation of gene expression via the
core promoter and the basal transcriptional machinery. Dev Biol 339: 225–229.
2. Kouzarides T (2007) Chromatin modifications and their function. Cell 128:
693–705.
3. Yang XJ, Seto E (2007) HATs and HDACs: from structure, function andregulation to novel strategies for therapy and prevention. Oncogene 26: 5310–
5318.
4. Jacobson RH, Ladurner AG, King DS, Tjian R (2000) Structure and function of
a human TAFII250 double bromodomain module. Science 288: 1422–1425.
5. Ruthenburg AJ, Li H, Milne TA, Dewell S, McGinty RK, et al. (2011)
Recognition of a mononucleosomal histone modification pattern by BPTF via
multivalent interactions. Cell 145: 692–706.
6. Luger K, Mader AW, Richmond RK, Sargent DF, Richmond TJ (1997) Crystal
structure of the nucleosome core particle at 2.8 A resolution. Nature 389: 251–260.
7. Shogren-Knaak M, Ishii H, Sun JM, Pazin MJ, Davie JR, et al. (2006) HistoneH4-K16 acetylation controls chromatin structure and protein interactions.
Science 311: 844–847.
8. Shahbazian MD, Grunstein M (2007) Functions of site-specific histoneacetylation and deacetylation. Annu Rev Biochem 76: 75–100.
9. Vetting MW, LP SdC, Yu M, Hegde SS, Magnet S, et al. (2005) Structure andfunctions of the GNAT superfamily of acetyltransferases. Arch Biochem Biophys
433: 212–226.
10. Utley RT, Cote J (2003) The MYST family of histone acetyltransferases. Curr
Top Microbiol Immunol 274: 203–236.
11. Lee KK, Workman JL (2007) Histone acetyltransferase complexes: one sizedoesn’t fit all. Nat Rev Mol Cell Biol 8: 284–295.
12. Grant PA, Schieltz D, Pray-Grant MG, Steger DJ, Reese JC, et al. (1998) Asubset of TAF(II)s are integral components of the SAGA complex required for
nucleosome acetylation and transcriptional stimulation. Cell 94: 45–53.
13. Suganuma T, Gutierrez JL, Li B, Florens L, Swanson SK, et al. (2008) ATAC isa double histone acetyltransferase complex that stimulates nucleosome sliding.
Nat Struct Mol Biol 15: 364–372.
14. Huisinga KL, Pugh BF (2004) A genome-wide housekeeping role for TFIID and
a highly regulated stress-related role for SAGA in Saccharomyces cerevisiae.Mol Cell 13: 573–585.
15. Lebedeva LA, Nabirochkina EN, Kurshakova MM, Robert F, Krasnov AN,
et al. (2005) Occupancy of the Drosophila hsp70 promoter by a subset of basaltranscription factors diminishes upon transcriptional activation. Proc Natl Acad
Sci U S A 102: 18087–18092.
16. Krebs AR, Demmers J, Karmodiya K, Chang NC, Chang AC, et al. (2010)
ATAC and Mediator coactivators form a stable complex and regulate a set ofnon-coding RNA genes. EMBO Rep 11: 541–547.
17. Nagy Z, Riss A, Fujiyama S, Krebs A, Orpinell M, et al. (2010) The metazoan
ATAC and SAGA coactivator HAT complexes regulate different sets ofinducible target genes. Cell Mol Life Sci 67: 611–628.
18. Suganuma T, Mushegian A, Swanson SK, Abmayr SM, Florens L, et al. (2010)The ATAC acetyltransferase complex coordinates MAP kinases to regulate JNK
target genes. Cell 142: 726–736.
19. Cai Y, Jin J, Swanson SK, Cole MD, Choi SH, et al. (2010) Subunit compositionand substrate specificity of a MOF-containing histone acetyltransferase distinct
from the male-specific lethal (MSL) complex. J Biol Chem 285: 4268–4272.
20. Mendjan S, Taipale M, Kind J, Holz H, Gebhardt P, et al. (2006) Nuclear pore
components are involved in the transcriptional regulation of dosage compen-sation in Drosophila. Mol Cell 21: 811–823.
21. Raja SJ, Charapitsa I, Conrad T, Vaquerizas JM, Gebhardt P, et al. (2010) The
nonspecific lethal complex is a transcriptional regulator in Drosophila. Mol Cell38: 827–841.
22. Straub T, Becker PB (2007) Dosage compensation: the beginning and end ofgeneralization. Nat Rev Genet 8: 47–57.
23. Hallacli E, Akhtar A (2009) X chromosomal regulation in flies: when less ismore. Chromosome Res 17: 603–619.
24. Conrad T, Akhtar A (2011) Dosage compensation in Drosophila melanogaster:
epigenetic fine-tuning of chromosome-wide transcription. Nat Rev Genet 13:123–134.
25. Andersen DS, Raja SJ, Colombani J, Shaw RL, Langton PF, et al. (2010)Drosophila MCRS2 associates with RNA polymerase II complexes to regulate
transcription. Mol Cell Biol 30: 4744–4755.
26. Prestel M, Feller C, Straub T, Mitlohner H, Becker PB (2010) The activationpotential of MOF is constrained for dosage compensation. Mol Cell 38: 815–
826.
27. Li X, Wu L, Corsa CA, Kunkel S, Dou Y (2009) Two mammalian MOF
complexes regulate transcription activation by distinct mechanisms. Mol Cell 36:290–301.
28. Cherbas L, Willingham A, Zhang D, Yang L, Zou Y, et al. (2011) The
transcriptional diversity of 25 Drosophila cell lines. Genome Res 21: 301–314.
29. Filion GJ, van Bemmel JG, Braunschweig U, Talhout W, Kind J, et al. (2010)
Systematic protein location mapping reveals five principal chromatin types in
Drosophila cells. Cell 143: 212–224.
30. Kharchenko PV, Alekseyenko AA, Schwartz YB, Minoda A, Riddle NC, et al.(2011) Comprehensive analysis of the chromatin landscape in Drosophila
melanogaster. Nature 471: 480–485.
31. Graveley BR, Brooks AN, Carlson JW, Duff MO, Landolin JM, et al. (2011) The
developmental transcriptome of Drosophila melanogaster. Nature 471: 473–479.
32. Nechaev S, Fargo DC, dos Santos G, Liu L, Gao Y, et al. (2010) Global analysis
of short RNAs reveals widespread promoter-proximal stalling and arrest of Pol II
in Drosophila. Science 327: 335–338.
33. Rach EA, Yuan HY, Majoros WH, Tomancak P, Ohler U (2009) Motif
composition, conservation and condition-specificity of single and alternative
transcription start sites in the Drosophila genome. Genome Biol 10: R73.
34. Hoskins RA, Landolin JM, Brown JB, Sandler JE, Takahashi H, et al. (2011)
Genome-wide analysis of promoter architecture in Drosophila melanogaster.
Genome Res 21: 182–192.
35. Ni T, Corcoran DL, Rach EA, Song S, Spana EP, et al. (2010) A paired-endsequencing strategy to map the complex landscape of transcription initiation.
Nat Methods 7: 521–527.
36. Rach EA, Winter DR, Benjamin AM, Corcoran DL, Ni T, et al. (2011)
Transcription initiation patterns indicate divergent strategies for gene regulation
at the chromatin level. PLoS Genet 7: e1001274. doi:10.1371/journal.pgen.
1001274.
37. Mavrich TN, Jiang C, Ioshikhes IP, Li X, Venters BJ, et al. (2008) Nucleosome
organization in the Drosophila genome. Nature 453: 358–362.
38. Gilchrist DA, Dos Santos G, Fargo DC, Xie B, Gao Y, et al. (2010) Pausing of
RNA polymerase II disrupts DNA-specified nucleosome organization to enableprecise gene regulation. Cell 143: 540–551.
39. Muse GW, Gilchrist DA, Nechaev S, Shah R, Parker JS, et al. (2007) RNA
polymerase is poised for activation across the genome. Nat Genet 39: 1507–
1511.
40. Juven-Gershon T, Hsu JY, Theisen JW, Kadonaga JT (2008) The RNA
polymerase II core promoter - the gateway to transcription. Curr Opin Cell Biol
20: 253–259.
41. Pugh BF (1996) Mechanisms of transcription complex assembly. Curr Opin Cell
Biol 8: 303–311.
42. FitzGerald PC, Sturgill D, Shyakhtenko A, Oliver B, Vinson C (2006)
Comparative genomics of Drosophila and human core promoters. Genome
Biol 7: R53.
43. Ohler U, Liao GC, Niemann H, Rubin GM (2002) Computational analysis of
core promoters in the Drosophila genome. Genome Biol 3: RESEARCH0087.
44. Thomas-Chollier M, Hufton A, Heinig M, O’Keeffe S, Masri NE, et al. (2011)
Transcription factor binding predictions using TRAP for the analysis of ChIP-
seq data and regulatory SNPs. Nat Protoc 6: 1860–1869.
45. Feller C, Prestel M, Hartmann H, Straub T, Soding J, et al. (2012) The MOF-containing NSL complex associates globally with housekeeping genes, but
activates only a defined subset. Nucleic Acids Res 40: 1509–1522.
46. Hochheimer A, Zhou S, Zheng S, Holmes MC, Tjian R (2002) TRF2 associates
with DREF and directs promoter-selective gene expression in Drosophila.
Nature 420: 439–445.
47. van Werven FJ, van Teeffelen HA, Holstege FC, Timmers HT (2009) Distinct
promoter dynamics of the basal transcription factor TBP across the yeast
genome. Nat Struct Mol Biol 16: 1043–1048.
48. Mizzen CA, Yang XJ, Kokubo T, Brownell JE, Bannister AJ, et al. (1996) The
TAF(II)250 subunit of TFIID has histone acetyltransferase activity. Cell 87:1261–1270.
49. Sermwittayawong D, Tan S (2006) SAGA binds TBP via its Spt8 subunit in
competition with DNA: implications for TBP recruitment. EMBO J 25: 3791–
3800.
50. Warfield L, Ranish JA, Hahn S (2004) Positive and negative functions of the
SAGA complex mediated through interaction of Spt8 with TBP and the N-
terminal domain of TFIIA. Genes Dev 18: 1022–1034.
51. Black JC, Choi JE, Lombardo SR, Carey M (2006) A mechanism for
coordinating chromatin modification and preinitiation complex assembly. Mol
Cell 23: 809–818.
52. Langmead B, Trapnell C, Pop M, Salzberg SL (2009) Ultrafast and memory-
efficient alignment of short DNA sequences to the human genome. Genome Biol
10: R25.
53. Zhang Y, Liu T, Meyer CA, Eeckhoute J, Johnson DS, et al. (2008) Model-basedanalysis of ChIP-Seq (MACS). Genome Biol 9: R137.
NSL Complex and Gene Regulation
PLoS Genetics | www.plosgenetics.org 17 June 2012 | Volume 8 | Issue 6 | e1002736
54. Salmon-Divon M, Dvinge H, Tammoja K, Bertone P (2010) PeakAnalyzer:
genome-wide annotation of chromatin binding and modification loci. BMC
Bioinformatics 11: 415.
55. Anders S, Huber W (2010) Differential expression analysis for sequence count
data. Genome Biol 11: R106.
56. Conrad T, Cavalli FM, Holz H, Hallacli E, Kind J, et al. (2012) The MOF
chromobarrel domain controls genome-wide H4K16 acetylation and spreading
of the MSL complex. Dev Cell 22: 610–624.
57. Goecks J, Nekrutenko A, Taylor J (2010) Galaxy: a comprehensive approach for
supporting accessible, reproducible, and transparent computational research in
the life sciences. Genome Biol 11: R86.
58. Quinlan AR, Hall IM (2010) BEDTools: a flexible suite of utilities for comparing
genomic features. Bioinformatics 26: 841–842.
59. Oliveros JC (2007) VENNY. An interactive tool for comparing lists with Venn
Diagrams.
60. Vaquerizas JM, Kummerfeld SK, Teichmann SA, Luscombe NM (2009) A
census of human transcription factors: function, expression and evolution. NatRev Genet 10: 252–263.
61. Kind J, Vaquerizas JM, Gebhardt P, Gentzel M, Luscombe NM, et al. (2008)
Genome-wide analysis reveals MOF as a key regulator of dosage compensationand gene expression in Drosophila. Cell 133: 813–828.
62. Bailey TL, Williams N, Misleh C, Li WW (2006) MEME: discovering andanalyzing DNA and protein sequence motifs. Nucleic Acids Res 34: W369–373.
63. Roider HG, Manke T, O’Keeffe S, Vingron M, Haas SA (2009) PASTAA:
identifying transcription factors associated with sets of co-regulated genes.Bioinformatics 25: 435–442.
64. Bailey TL, Elkan C (1994) Fitting a mixture model by expectation maximizationto discover motifs in biopolymers. Proc Int Conf Intell Syst Mol Biol 2: 28–36.
65. Tomancak P, Berman BP, Beaton A, Weiszmann R, Kwan E, et al. (2007)Global analysis of patterns of gene expression during Drosophila embryogenesis.
Genome Biol 8: R145.
NSL Complex and Gene Regulation
PLoS Genetics | www.plosgenetics.org 18 June 2012 | Volume 8 | Issue 6 | e1002736
![Rigging & Lifting Handbook [NSL]](https://static.fdocuments.us/doc/165x107/55cf9d1d550346d033ac4bbc/rigging-lifting-handbook-nsl.jpg)