
The Norwegian oilfield services analysis 2015 - EY · PDF fileThe Norwegian oilfield services...
36
The Norwegian oilfield services analysis 2015
Transcript of The Norwegian oilfield services analysis 2015 - EY · PDF fileThe Norwegian oilfield services...

The Norwegian oilfield services analysis 2015

Contents
Summary 4
Introduction 6
Key findings 2013-14 8
Company performance relative to size 9
EBITDA analysis 10
The reservoir/seismic segment 12
The exploration and production drilling segment 14
The engineering, fabrication and installation segment 18
The operations segment 23
The decommissioning segment 26
Geographical distribution 27
Activity going forward 28
Comparison of NCS and UKCS 32
Methodology 34

3

4 | The Norwegian oilfield services analysis 2015
Summary
The Norwegian oilfield service sector has become one of the primary industries in NorwayThe oilfield service (OFS) industry is one of Norway’s largest industries, with more than 1,100 companies generating total revenues of NOK506b by around 131,000 employees. The industry has grown significantly in recent years: total Norwegian OFS revenues increased by 42.8% from 2010 to 2014, and the number of employees increased by 22.4%.
Growth has been stimulated by three themesFirstly, part of the growth can be attributed to exports. There has been an increase in global spending on offshore exploration and production (E&P) equipment, where Norwegian OFS companies are key suppliers. Global spending was fueled by both increasing global demand for petroleum products and the oil price reaching over US$110 per barrel. E&P companies set their investment agenda to focus on and commit to offshore exploration, due to both the high oil price and the significant exploration successes in the last 20 years in the Gulf of Mexico, West Africa and Brazil, as well as in the North Sea, offshore Canada, Australia and Southeast Asia.
Secondly, in recent years there has been high activity in both exploration and field development on the Norwegian continental shelf (NCS). These developments include Aasta Hansteen, Edvard Grieg and Goliat. In 2014, estimated investments in field development and license related exploration in 56 exploration wells reached NOK76b and NOK31b, respectively. High exploration activity has driven growth in the reservoir/seismic and E&P drilling segments, with subsequent field development success driving growth in the engineering, fabrication and installation (EFI) segment.
Lastly, the growing number of offshore installations on on-stream fields, and the focus on increased recovery and lifetime extension for mature fields, has led to high demand for modifications and upgrades to producing fields. In 2014, an estimated NOK95b capex was invested in producing fields, driving revenues in the E&P drilling, EFI and operation segments.
All of the OFS segments have recorded growthIn 2014 the OFS industry overall recorded a 4.3% growth, with growth in all segments except decommissioning. The single largest segment comprised engineering, fabrication and installation, valued at NOK244b in revenues. However, the highest growing segments have been reservoir/seismic and exploration and production drilling.
0
50
100
150
0
100
200
300
400
500
2010 2011 2012 2013 2014
No.
of e
mpl
oyee
s (t
hous
ands
)
Rev
enue
(NO
K b
)
Norway OFS revenues and employees
Revenue No. of employees
0
20
40
60
80
100
120
140
2005 2006 2007 2008 2009 2010 2011 2012 2013 20140
50
100
150
200
Oil
pric
e (U
SD p
er b
arre
l)
Inve
stm
ents
(NO
K b
)
NCS investments and oil price development
Investments, excluding exploration Oil price (Brent) USD/barrel
Source: Norwegian Petroleum Directorate
10.3% 10.9%
9.1%
6.6%
3.7%
0%
2%
4%
6%
8%
10%
12%
Res
ervo
ir/s
eism
ic
Expl
orat
ion
&pr
oduc
tion
drill
ing
Engi
neer
ing,
fabr
icat
ion
&in
stal
latio
n
Ope
ratio
n
Dec
omm
issi
onin
g
0
50
100
150
200
250
300
Rev
enue
gro
wth
Rev
enue
(NO
K b
)
Norway OFS segments size and growth
Revenue 5-year CAGR

5The Norwegian oilfield services analysis 2015 |
OFS growth was challenged in 2013, augmented by the oil price collapse in 2014Toward the end of 2013, a shift was observed in the E&P companies’ emphasis from volume growth to profitability. According to some E&P majors, cost inflation caused increasing pressure on the profitability of new field developments. Simultaneously, several oil companies struggled to maintain positive free cash flow, resulting in announcements of major cost reduction programs by E&P operators during the first half of 2014.
When the oil price abruptly dropped to around US$50 per barrel toward the end of 2014, pressure to cut costs further increased. As the oil price continued to hover between US$40-50 per barrel during 2015, E&P companies have had to take a second look at their asset portfolios. This has resulted in stricter project prioritization and comprehensive improvement programs to realize capex and operating cost savings. However, due to contract lag and active project portfolios, 2014 still turned out to be a year of positive revenue growth for Norwegian OFS companies.
The OFS industry now has overcapacity issuesHigh activity and stable growth led the OFS industry to invest in building up resources in terms of employees and assets. In 2014, as E&P industry indicators and sentiment turned negative, many asset light segments, such as EFI and maintenance and modifications (M&M), began to reduce staff to match capacity against declining demand. Within the asset heavy segments, such as seismic equipment, rig companies and offshore logistics, capacity is less flexible resulting in companies facing challenges in rightsizing their asset bases. This is demonstrated by the stacking of offshore vessels, the cancellation of new rig constructions and the drop in day rates for both drilling rigs and offshore vessels. From November 2014 to October 2015, the rig order book for floaters was reduced by 27%. During the same period, spot day rates for offshore supply vessels were reduced by more than 75% and utilization is now at very low levels.
A rebound in demand is unlikely in the short termAccording to Wood Mackenzie, global E&P capex is estimated to decrease by 40% from 2014 to 2016, impacting both the domestic market and the export market for the Norwegian based OFS industry. Even if the oil price were to drastically increase and E&P sentiment were to shift back to growth and investment, there would be a significant lag in commissioning of new projects. In our forecast for the Norwegian OFS industry, we expect total OFS revenues to remain considerable but with a reduction from the 2014 peak to the activity levels experienced by the Norwegian- based OFS industry during 2011.
020406080
100120140160180200
2013 2014 2015 2016 2017 2018 2019
Inve
stm
ents
(NO
K b
)
NCS investment forecast in 2014 vs. 2013
Forecast as per 2014-Q1 Forecast as per 2015-Q1
Source: Norwegian Petroleum Directorate
0
20
40
60
80
100
120
140
0
50
100
150
200
250
300
350
2010 2011 2012 2013 2014 2015 2016 2017 2018 2019
No.
of e
mpl
oyee
s (t
hous
ands
)
Cos
ts (N
OK
b)
OFS employees and NCS investments, operating costs and exploration costs
NCS investments and costs No. of employees
Source: Norwegian Petroleum Directorate, EY analysis
0%
2%
4%
6%
8%
10%
12%
14%
16%
18%
0
100
200
300
400
500
600
2006 2008 2010 2012 2014 2016
Pro
fitab
ility
Rev
enue
s (N
OK
b)
OFS revenue and profitability development
Revenues EBITI-margin ROCE
Source: EY analysis
0%
2%
4%
6%
8%
10%
12%
14%
16%
18%
0
100
200
300
400
500
600
2009 2010 2011 2012 2013 2014 2015 2016
Pro
fitab
ility
Rev
enue
s (N
OK
b)
OFS forecast
Revenues EBITI-margin ROCE

6 | The Norwegian oilfield services analysis 2015
Introduction
EY has conducted the oilfield service (OFS) analysis every year since 2006, and the report has been developed and expanded each year in line with the growth of the industry it seeks to cover. In addition, EY also issues annual reports covering the UK and the Dutch based OFS industries.
In this 2015 report, the database has been updated to reflect the addition of new legal entities to the empirical data set, bringing the total number of Norwegian registered OFS companies to over 1,100. A new section comparing the highlights from the UK and the Norwegian OFS sectors has also been added.
We hope that you find the report useful and we welcome any feedback that you may have.
Inclusion criteria• A company is defined as a Norwegian OFS company if:• At least 50% of its turnover is generated in the oil and gas sector
and• It is a Norwegian-registered legal entity
Value chain segments• Reservoir/seismic• Exploration and production (E&P) drilling• Engineering, fabrication and installation• Operations • Decommissioning
Company size definition• Large companies: revenues above NOK1b• Medium-size companies: revenues between NOK100m and
NOK1b• Small companies: revenues below NOK100m
MethodologyIn order to analyze economic activity by geographic location and across the OFS value chain, information from stand-alone financial statements of individual legal entities has been used. Where annual reports were not available by the time this report was prepared, 2014 figures have been modeled based on companies’ previous year financial statements.
Many of the companies will have activities in several geographic regions and offer products and services in more than one segment of the OFS value chain. However, each company has been linked to only one geographic region, based on its main business address, and to only a single segment of the OFS value chain, based on its main activity within the sector. For larger industrial conglomerates with multiple daughter companies, each of the group companies has been allocated to its respective best fit OFS segment.
Please also note that our chosen methodology does not capture or eliminate intercompany transactions or revenues in holding companies registered abroad.
Welcome to the 2015 version of EY’s annual review of the Norwegian oilfield service industry. In this report, we quantify the size and development of this diverse industry and analyze the dynamics across the oilfield service’s value chain.
0
100
200
300
400
500
600
2005 2006 2007 2008 2009 2010 2011 2012 2013 2014
Rev
enue
, NO
K b
NCS oilfield service revenue

7The Norwegian oilfield services analysis 2015 |
2014 was a record year in terms of Norwegian OFS revenue. The primary drivers of growth in 2014 were the reservoir/seismic and exploration and production drilling segments.

8 | The Norwegian oilfield services analysis 2015
OFS industry revenue remained strong in 2014, but profitability under pressure
Revenues up from 2013In 2014, the combined turnover of the OFS industry was NOK506b, an increase of 4.3% compared with 2013. However, this marks a decline in growth rate, as highlighted by a 5-year CAGR of 8.3%.The drivers of growth in 2014 were the reservoir/seismic and exploration and production drilling segments. The engineering, fabrication and installation segment and the operation segment remained relatively flat. The decommissioning segment experienced a sharp decline in revenues in 2014.
Number of employees virtually unchangedThe industry experienced moderate growth of 0.3% in the number of directly employed professionals in 2014. This is a strong contrast to previous years where workforce growth was consistently in the 5%-10% range. The announced job cuts and layoffs during 2014 were estimated to be 5,000. The slight increase in 2014 was entirely driven by the exploration and production drilling segment, which increased by approximately 1,800, offsetting workforce reductions in all the other segments.
Small increase in operating cost itemsThe industry’s three main operating expenses increased in 2014, leading to a 0.5% decrease in the EBITDA margin:• Cost of goods (COGS) increased by 5.1% from 2013 to 2014,
driven primarily by the reservoir/seismic segment.• Labor cost increased by 3.9%, driven by the higher number of
employees in the exploration and production drilling segment.• Other operating cost increased by 5.9%.
Large increase in impairment costsWhile the EBITDA margin declined by 0.5% to 11.3%, the EBIT margin declined by 2.3% to 5.4% in 2014. The disproportionate reduction in EBIT margin is due to impairments in 2014, which increased from NOK0.5b in 2013 to NOK8.6b in 2014, primarily driven by the exploration and production drilling and the engineering, fabrication and installation segments.
This increase in impairments may signal a lowered expectation of future profitability by the industry, for example write-downs on goodwill and recent acquisitions that may not yield future profits to the same extent as originally expected.
485 506
0
100
200
300
400
500
600
2013 2014
Rev
enue
(NO
K b
)
OFS total revenues
130,448 131,164
2013 2014
Num
ber
of e
mpl
oyee
s
OFS total workforce
199 209
123 127 106 112
0
50
100
150
200
250
2013 2014
Expe
nses
(NO
K b
)
Operating expenses
Cost of goods Labor cost Other op. cost (ex. D&A and Impairment)
11.8% 11.3%
7.7%
5.4%
0%
2%
4%
6%
8%
10%
12%
14%
2013 2014
Profit margins
EBITDA (%) EBIT (%)

9The Norwegian oilfield services analysis 2015 |
Small and medium-sized companies challenged on profit
The Norwegian OFS industry includes 1,113 companies, of which 50.1% are characterized as small (annual revenues less than NOK100m), 41.2% as medium (annual revenues between NOK100m and NOK1b), and 8.7% as large (annual revenues more than NOK1b).
There is considerable diversity in companies with respect to revenues and the number of employees. Large companies in the industry generally provide a wide range of services across the value chain, and many of these are global players. Small companies tend to be more specialized and focus on a narrower part of the value chain and/or specific technologies.
In 2014, the OFS industry directly employed 131,000 people and had a combined turnover of NOK506b. The OFS industry is therefore of great significance to the Norwegian economy, directly employing 4.9% of the Norwegian workforce, with an aggregated value creation (EBITDA + labor cost) of NOK184b, representing 6.4% of the Norwegian mainland GDP for 2014.
Profit margins for the industry have remained relatively stable over the period 2010-14. However, the slight decrease in EBITDA in 2014 has primarily impacted the small and medium sized companies, which have seen EBITDA rates decline by 1.6%-units and 2.2%-units respectively. Historically medium sized companies tended to be more profitable than its smaller and larger counterparts, but the EBITDA gap of medium companies as compared to large companies narrowed in 2014.
0
20,000
40,000
60,000
80,000
0
100
200
300
400
500
<100 NOK m 100-1,000 NOK m >1,000 NOK m
No.
of e
mpl
oyee
s
Rev
enue
(NO
K m
)
Revenues and number of employees by company size in 2014
Revenue No. of employee
Key financials per year and size segment
(NOK b) 2010 2011 2012 2013 2014
Employees (thousands) 107 115 123 130 131
P&L
Revenues 354.3 388.3 436.8 485.1 505.8
Cost of goods 132.8 140.3 167.2 198.8 208.9
Labor cost 90.1 101.7 113.7 122.7 127.5
Other operating cost 98.5 115.7 119.3 126.2 141.9
EBITDA 48.8 49.0 55.0 57.4 56.9
EBIT 32.8 30.6 36.6 37.4 27.5
Ratios
Avg. EBITDA% - Small 6.5% 6.3% 9.2% 7.7% 6.1%
Avg. EBITDA% - Medium 16.3% 14.8% 14.3% 14.9% 12.7%
Avg. EBITDA% - Large 13.2% 12.1% 11.9% 10.7% 11.0%
Avg. EBITDA% - All 13.8% 12.6% 12.6% 11.8% 11.3%

10 | The Norwegian oilfield services analysis 2015
Cost inflation on goods sold has negatively impacted EBITDA margins in the OFS industry
EBITDAAggregated EBITDA increased by 16.6% from 2010 to 2013 before declining by 0.8% in 2014.
Aggregated EBITDA totaled NOK56.9b in 2014, compared with NOK57.4b in 2013.
EBITDA margins have declined steadily from 13.8% in 2010 to 11.3% in 2014.
EBITDA driversRevenue and labor costs are positively correlated during the time period, with growths of 42.8% and 41.4% respectively.
COGS, which declined in the aftermath of the financial crisis in 2009, has since outpaced revenue growth. COGS has increased by 57.3% since 2010 and has negatively impacted the industry EBITDA for 2013 and 2014. COGS inflation was mainly driven by larger companies across the segments, and was a consequence of group structures and associated intercompany pricing arrangements.
Value creationValue creation (EBITDA + labor costs) grew from 2010-14, increasing by 32.7% over the period. The growth in value creation slowed in 2014 (2.4% increase).
The growth in value creation per employee over the period was 8.4%, of which 1.8% occurred in 2014. This growth was driven primarily by companies in the reservoir/seismic segment, which has seen a 102.1% increase in value creation per employee in the period. By comparison, the value creation per employee in the E&P drilling segment declined by 1.1% during the same period.
Labor costsTotal labor cost increased by 41.4% from 2010 to 2014, explained by an increase in both the labor force and in the cost of labor. During the same period, the labor force grew by 22.4%, reaching 131,000 in 2014. Labor cost per employee grew at a slower pace of 15.5% over the period, an average of 3.1% per year, which corresponds with the overall wage inflation in Norway over the period.
The increase in total labor cost should therefore be interpreted primarily as a result of increased activity in the sector and not as an increase in the relative cost of labor.
0%
2%
4%
6%
8%
10%
12%
14%
16%
-
20
40
60
2010 2011 2012 2013 2014
EBIT
DA
(NO
K b
)
OFS total EBITDA
EBITDA EBITDA-margin
0%
20%
40%
60%
2010 2011 2012 2013 2014
Inde
x (2
010
= 0%
)
EBITDA drivers
Revenue index Cost of goods indexLabor cost index Other cost (excl D&A) index
1.1
1.2
1.3
1.4
1.5
1.6
0
50
100
150
200
2010 2011 2012 2013 2014 Val
ue c
reat
ion
per
empl
. (N
OK
m)
Val
ue c
reat
ion
(NO
K b
)
Value creation in total and per employee
Value creation Value creation / employee
0.5
0.6
0.7
0.8
0.9
1.0
1.1
1.2
0
50
100
150
2010 2011 2012 2013 2014
Labo
ur c
ost
per
empl
. (N
OK
m)
# em
ploy
ees
(tho
usan
ds)
Number of employees and labor costs
# employees Labor cost / employee

11The Norwegian oilfield services analysis 2015 |
The reduction in E&P spending will impact the Norwegian OFS industry and we project OFS revenues to decline by 25% from 2014 to 2016.

12 | The Norwegian oilfield services analysis 2015
About the segmentThe reservoir/seismic segment includes companies that operate seismic vessels for data gathering purposes, companies that analyze, interpret and display seismic data, and companies that supply equipment for gathering and analyzing seismic data.
We have divided the segment into two sub-segments:1. Seismic interpretation and consultants2. Seismic equipment
Segment highlights• Companies in the reservoir/seismic segment are experiencing
challenging market conditions relating to a significant mismatch between supply and demand. Oil companies are cutting E&P spending in preparation for a slow oil price recovery, while seismic vessel capacity has been increasing.
• The reservoir/seismic segment is at the front of the E&P value chain and is closely correlated with changes in oil price. It has therefore been considerably impacted by the capex and cost cuts being made by oil companies.
• There has been strong capacity growth in the segment, with investments in modern vessels and technology upgrades facilitating both significant increases in operational efficiency and higher quality data output for its customers.
• The effect of the market downturn on the companies operating in the segment includes decreasing utilization and increasing price pressure. Companies with limited vessel exposure are better positioned to quickly adjust to the new market conditions.
• The market conditions impacted revenue growth in 2014, which was 4.5% compared to a CAGR of 10.3% from 2010 to 2014. The impact on existing contracts is likely to have been limited in 2014, but as new contracts fail to appear in 2015, the market conditions will be reflected more in the financial statements going forward.
• Companies are focusing on reducing costs and capacity. The segment reduced its employees by a record 12.3% in 2014 and several seismic companies announced fleet reductions and postponement and/or cancelations of new build contracts.
• The sharp decline in ROCE from 2012 to 2014 can primarily be attributed to an increase in capital employed, indicating excess vessel capacity being used to invest in multi-client data libraries, which comprise the majority of the balance sheet growth.
Reservoir/seismic
Exploration and production drilling
Engineering, fabrication and
installationOperations Decommissioning
Reservoir/seismic activity growth plateaued in 2014
0%
5%
10%
15%
20%
25%
30%
35%
40%
0
5
10
15
20
25
30
35
2010 2011 2012 2013 2014
Rev
enue
(NO
K b
)
Key financials
Revenue EBITDA ROCE
Segment composition (2014)
Number of companies Revenue
79%
19%
2%
10
21
20
Small < NOK 100m Large > NOK 1,000m
Medium NOK 100 – 1,000m
13The Norwegian oilfield services analysis 2015 |
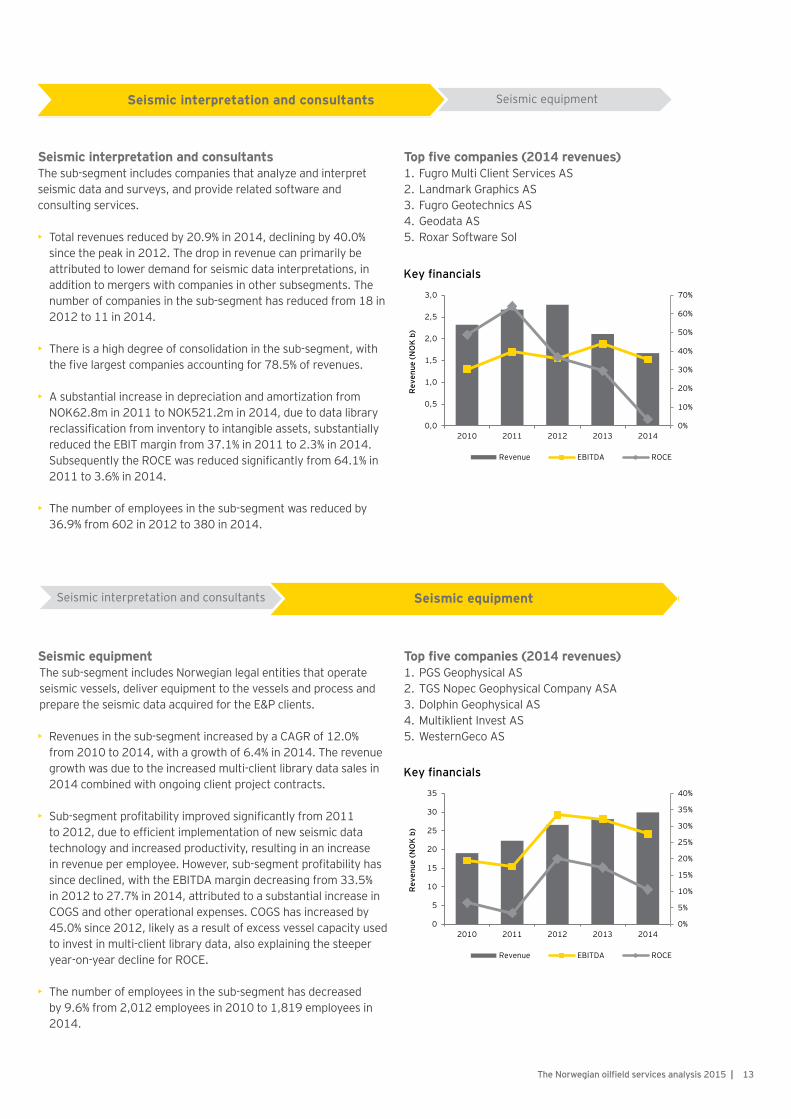
Seismic interpretation and consultantsThe sub-segment includes companies that analyze and interpret seismic data and surveys, and provide related software and consulting services.
• Total revenues reduced by 20.9% in 2014, declining by 40.0% since the peak in 2012. The drop in revenue can primarily be attributed to lower demand for seismic data interpretations, in addition to mergers with companies in other subsegments. The number of companies in the sub-segment has reduced from 18 in 2012 to 11 in 2014.
• There is a high degree of consolidation in the sub-segment, with the five largest companies accounting for 78.5% of revenues.
• A substantial increase in depreciation and amortization from NOK62.8m in 2011 to NOK521.2m in 2014, due to data library reclassification from inventory to intangible assets, substantially reduced the EBIT margin from 37.1% in 2011 to 2.3% in 2014. Subsequently the ROCE was reduced significantly from 64.1% in 2011 to 3.6% in 2014.
• The number of employees in the sub-segment was reduced by 36.9% from 602 in 2012 to 380 in 2014.
Top five companies (2014 revenues)1. Fugro Multi Client Services AS2. Landmark Graphics AS3. Fugro Geotechnics AS4. Geodata AS5. Roxar Software Sol
Seismic equipmentSeismic interpretation and consultants
Seismic interpretation and consultants Seismic equipment
0%
10%
20%
30%
40%
50%
60%
70%
0,0
0,5
1,0
1,5
2,0
2,5
3,0
2010 2011 2012 2013 2014
Rev
enue
(NO
K b
)
Key financials
Revenue EBITDA ROCE
Seismic equipmentThe sub-segment includes Norwegian legal entities that operate seismic vessels, deliver equipment to the vessels and process and prepare the seismic data acquired for the E&P clients.
• Revenues in the sub-segment increased by a CAGR of 12.0% from 2010 to 2014, with a growth of 6.4% in 2014. The revenue growth was due to the increased multi-client library data sales in 2014 combined with ongoing client project contracts.
• Sub-segment profitability improved significantly from 2011 to 2012, due to efficient implementation of new seismic data technology and increased productivity, resulting in an increase in revenue per employee. However, sub-segment profitability has since declined, with the EBITDA margin decreasing from 33.5% in 2012 to 27.7% in 2014, attributed to a substantial increase in COGS and other operational expenses. COGS has increased by 45.0% since 2012, likely as a result of excess vessel capacity used to invest in multi-client library data, also explaining the steeper year-on-year decline for ROCE.
• The number of employees in the sub-segment has decreased by 9.6% from 2,012 employees in 2010 to 1,819 employees in 2014.
Top five companies (2014 revenues)1. PGS Geophysical AS2. TGS Nopec Geophysical Company ASA3. Dolphin Geophysical AS4. Multiklient Invest AS5. WesternGeco AS
0%
5%
10%
15%
20%
25%
30%
35%
40%
0
5
10
15
20
25
30
35
2010 2011 2012 2013 2014
Rev
enue
(NO
K b
)
Key financials
Revenue EBITDA ROCE

14 | The Norwegian oilfield services analysis 2015
Exploration activity was high in 2014, resulting in a good year for E&P drilling
Reservoir/seismic
Exploration and production drilling
Engineering, fabrication and
installationOperations
About the segmentThe exploration and production drilling segment includes companies that own and/or operate drilling rigs, as well as companies that deliver systems, products and services to these rigs and the wells being drilled.
We have divided the segment into three sub-segments:1. Rig companies2. Rig equipment3. Well services
Segment highlights• Companies in the exploration and production drilling segment
have experienced sustained growth in the period 2010 to 2014. However, with the market shifting to significantly weaker demand (both globally and for the NCS), and with several rigs coming off longer-term contracts, and with an inflow of new builds, the segment is currently under considerable pressure.
• Compared to the reservoir/seismic segment, E&P drilling activity is cushioned against market cycles by longer term contracts. However, although segment revenues grew by 9.1% in 2014, this is a considerable reduction from the 21.1% growth seen in 2013.
• The EBITDA margin was stable year-on-year (13.7% in 2013 to
13.9% in 2014). This is attributed to a lower growth in personnel expenses (6.5%) and COGS (0.9%) as compared to revenues (9.1%).
• The rig equipment sub-segment contributed the most to segment growth, with a growth of 18.0%. Due to the long construction time (order-to-delivery) for new build rig equipment, changes in demand are expected to impact the financials after an 18-24 months delay.
The segment includes a total of 198 companies, of which the 28 large companies generate 79.2% of the segment revenues.
0%
5%
10%
15%
20%
25%
0
20
40
60
80
100
120
140
160
180
2010 2011 2012 2013 2014
Rev
enue
(NO
K b
)
Key financials
Revenue EBITDA ROCE
Segment composition (2014)
Number of companies Revenue
79%
19%
2%
28
83
87
Small < NOK 100m Large > NOK 1,000m
Medium NOK 100 – 1,000m0
50
100
150
200
250
20052006200720082009201020112012201320142015
Num
ber
ofw
ells
NCS drilling activity
Development wells drilled from permanently placed drilling facilities
Exploration wells
Development wells drilled from mobile drilling facilities
Decommissioning

15The Norwegian oilfield services analysis 2015 |
Rig equipment Well servicesRig companies
Rig companiesThe sub-segment includes companies that own and/or operate offshore drilling rigs. Few of the rig companies have their rig assets on Norwegian registered entities’ balance sheets, which somewhat limits the relevance of ROCE analysis.
• The sub-segment experienced a revenue growth of 6.7%, due to maintained high rig utilization of 93% at the end of 2014. This is, however, a significant reduction from the revenue growth of 21.6% in 2013.
• The sub-segment EBITDA margin remained stable at 16.2% in 2014 compared to 15.8% in 2013.
• The number of employees increased by 2.0% in 2014. Revenue per employees increased by 4.5% year-on-year, while cost per employee increased by 3.3%. Due to existing contracts and high rig utilization, the announced initiatives to reduce the number of employees is expected to be observed in the 2015 financial statements rather than those for 2014.
• With rig companies being prepared for growth, the oil price reduction has significantly impacted the sub-segment. The current overcapacity, lower utilization and day rates is leading to rig stacking and extensive focus on operational cost reduction both on the NCS and globally.
• While rig utilization for the North Sea was at 93% in December 2014, one year later it was at 66%. With several rigs on the NCS coming off-contract in the coming years, there is a risk of a further downward trend in utilization resulting in day rates at or below cash flow break-even levels in both the floater and the jack-up markets.
• A reduction in the number of active rigs on the NCS is occurring as a result of the low demand seen in 2015 and expected in 2016. The 37 active rigs on the NCS in 2014 (average year) were reduced to 34 in 2015. A significant number of rigs coming off-contract in 2015 and 2016 are older than 25 years and will need extensive upgrades to re-enter operations on the NCS.
• Despite the lackluster order flow toward the yards for rig new builds over the last 18 months, the current global order book still exceeds 200 units (25% of current available fleet) with planned deliveries in the period 2016-19. Moreover, the current oversupply trend in the operational fleet, as indicated by the utilization rates of 50%-60%, suggests a requirement to take a significant amount of aged tonnage out of the market permanently.
• Meanwhile, warm and cold stacking and market consolidation initiatives may be an opportunity to limit the oversupply effects in the short to medium term.
• The sub-segment includes 56 companies, of which 17 are large companies generating 76.0% of the revenues.
Top five companies (2014 revenues)1. North Atlantic Norway Ltd2. Seadrill Offshore AS3. Cosl Offshore Management AS4. Transocean Offshore5. Dolphin Drilling AS
0%
2%
4%
6%
8%
10%
12%
14%
16%
18%
20%
0
10
20
30
40
50
60
70
2010 2011 2012 2013 2014
Rev
enue
(NO
K b
)
Key financials
Revenue EBITDA ROCE
-12 -12-7
4
4
2
29 3033
38 3734
27
18
-20
-10
0
10
20
30
40
50
2010 2011 2012 2013 2014 2015 2016 2017
Ave
rage
num
ber
of r
igs
NCS committed rigs
Firm contracts Contracts ending Contracts starting
Despite the lackluster order flow toward the yards for rig new builds over the last 18 months, the current global order book still exceeds 200 units with planned deliveries in the period 2016-19.

16 | The Norwegian oilfield services analysis 2015
Rig equipmentThe sub-segment includes companies that offer systems and equipment for drilling on rigs and topsides.
• Revenues in the sub-segment increased by 18.0% in 2014, with activity strongly dominated by export markets. The five largest companies accounted for 94.0% of revenues in 2014. The rig equipment sub-segment saw a 14.8% year-on-year increase in employees and contributed to a significant share of the employee inflow to oilfield services in 2014.
• The sub-segment EBITDA margin increased from 11.9% in 2013 to 12.4% in 2014. However, profitability was reduced from the 16%-20% margin level in the 2008-12 period, mainly due to a significant COGS inflation. A substantial increase in capital employed through acquisitions and build-up of receivables and unbilled revenue caused the ROCE to decrease considerably from the peak in 2011.
• The rig equipment companies have maintained their growth rate and profitability due to a relatively stable rig order book throughout 2014. Going into 2015, the global rig order book gradually reduced as units were delivered and new orders failed to appear. Currently companies see practically no new orders and are adapting with cost cuts and employee reductions to align capacity with expected future demand.
• The global rig order book in 2014 started with 236 units and ended with 239 units, remaining relatively stable. However, due to a limited number of new orders since the second half of 2014, the total global rig order book has declining continuously from 239 units in November 2014 to 203 units in October 2015. The highest impact is on floaters, where the number of units in the order book has decreased by 27%. Furthermore, only 69% of the floaters in the order book are firm orders. The jack-up order book has decreased by 4% compared to year-end 2014.
• With limited new order volumes and a declining global order book, companies are initiating cost reductions and layoffs. Although minor initiatives were seen in 2014, they have accelerated throughout 2015 with significant employee reductions and internal production infrastructure consolidation, by means of shutting down satellite offices and factories.
• Further capacity optimization is likely as the order book continues to decline. There are limited signs of improvement in general offshore oil and gas activity in the short term, and if demand increases, the idle and available rigs are likely to be re-deployed prior to building new tonnage. This will result in an extended improvement lag for the sub-segment post a potential market recovery.
Top five companies (2014 revenues)1. National Oilwell Varco Norway AS2. Mhwirth AS3. Cameron Sense AS4. Odfjell Drilling Technology AS5. Step Offshore AS
Rig companies Well servicesRig equipment
0%
10%
20%
30%
40%
50%
60%
70%
0
10
20
30
40
50
60
2010 2011 2012 2013 2014
Rev
enue
(NO
K b
)
Key financials
Revenue EBITDA ROCE
0
20
40
60
80
100
120
2015 2016 2017 2018 2019 2020 Not firm
Num
ber
of u
nits
October 2015: 203 units
Jack-ups Floaters
Global rig order book development
0
20
40
60
80
100
120
2014 2015 2016 2017 2018 2019
Num
ber
of u
nits
November 2014: 239 units
Jack-ups Floaters
Source: Morgan Stanley
17The Norwegian oilfield services analysis 2015 |
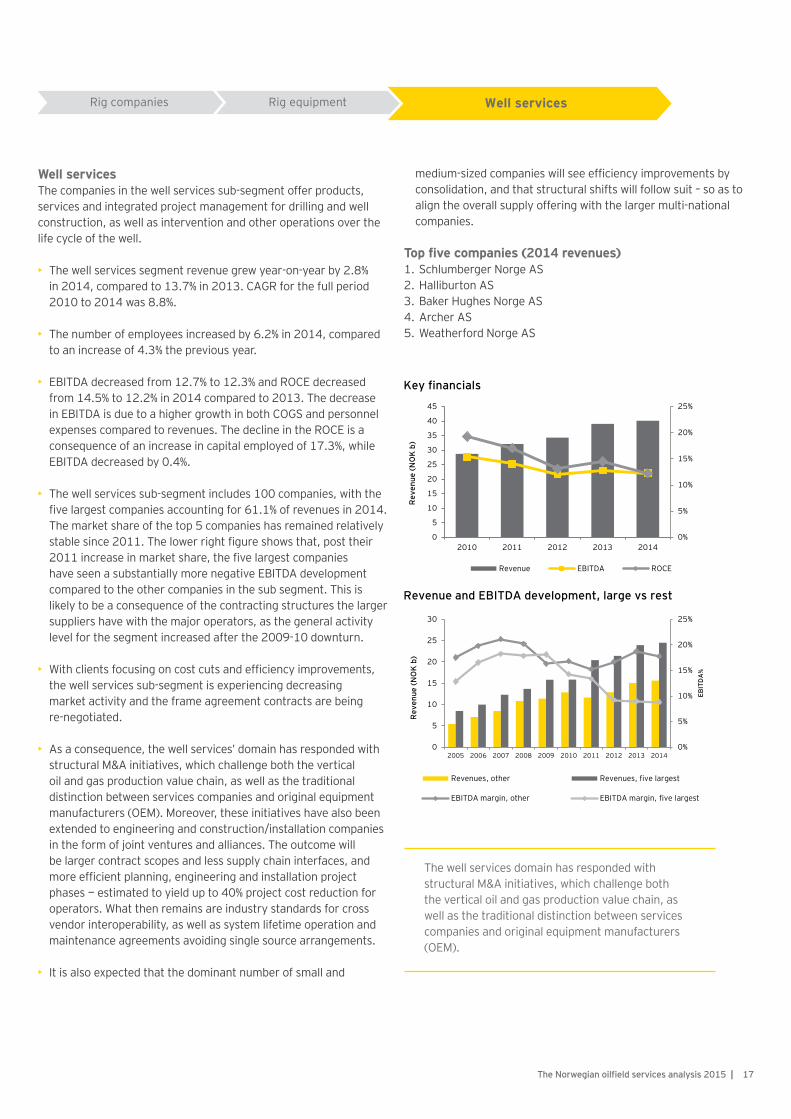
Well servicesThe companies in the well services sub-segment offer products, services and integrated project management for drilling and well construction, as well as intervention and other operations over the life cycle of the well.
• The well services segment revenue grew year-on-year by 2.8% in 2014, compared to 13.7% in 2013. CAGR for the full period 2010 to 2014 was 8.8%.
• The number of employees increased by 6.2% in 2014, compared to an increase of 4.3% the previous year.
• EBITDA decreased from 12.7% to 12.3% and ROCE decreased from 14.5% to 12.2% in 2014 compared to 2013. The decrease in EBITDA is due to a higher growth in both COGS and personnel expenses compared to revenues. The decline in the ROCE is a consequence of an increase in capital employed of 17.3%, while EBITDA decreased by 0.4%.
• The well services sub-segment includes 100 companies, with the five largest companies accounting for 61.1% of revenues in 2014. The market share of the top 5 companies has remained relatively stable since 2011. The lower right figure shows that, post their 2011 increase in market share, the five largest companies have seen a substantially more negative EBITDA development compared to the other companies in the sub segment. This is likely to be a consequence of the contracting structures the larger suppliers have with the major operators, as the general activity level for the segment increased after the 2009-10 downturn.
• With clients focusing on cost cuts and efficiency improvements, the well services sub-segment is experiencing decreasing market activity and the frame agreement contracts are being re-negotiated.
• As a consequence, the well services’ domain has responded with structural M&A initiatives, which challenge both the vertical oil and gas production value chain, as well as the traditional distinction between services companies and original equipment manufacturers (OEM). Moreover, these initiatives have also been extended to engineering and construction/installation companies in the form of joint ventures and alliances. The outcome will be larger contract scopes and less supply chain interfaces, and more efficient planning, engineering and installation project phases — estimated to yield up to 40% project cost reduction for operators. What then remains are industry standards for cross vendor interoperability, as well as system lifetime operation and maintenance agreements avoiding single source arrangements.
• It is also expected that the dominant number of small and
medium-sized companies will see efficiency improvements by consolidation, and that structural shifts will follow suit – so as to align the overall supply offering with the larger multi-national companies.
Top five companies (2014 revenues)1. Schlumberger Norge AS2. Halliburton AS3. Baker Hughes Norge AS4. Archer AS5. Weatherford Norge AS
Rig companies Rig equipment Well services
0%
5%
10%
15%
20%
25%
0
5
10
15
20
25
30
35
40
45
2010 2011 2012 2013 2014
Rev
enue
(NO
K b
)
Key financials
Revenue EBITDA ROCE
0%
5%
10%
15%
20%
25%
0
5
10
15
20
25
30
2005 2006 2007 2008 2009 2010 2011 2012 2013 2014
EBIT
DA
%
Rev
enue
(NO
K b
)
Revenues, other Revenues, five largest
EBITDA margin, other EBITDA margin, five largest
Revenue and EBITDA development, large vs rest
The well services domain has responded with structural M&A initiatives, which challenge both the vertical oil and gas production value chain, as well as the traditional distinction between services companies and original equipment manufacturers (OEM).

18 | The Norwegian oilfield services analysis 2015
About the segmentThe engineering, fabrication and installation segment includes Norwegian legal entities involved in equipment supply, manufacturing, construction and installation of offshore oil and gas production units, both surface (topside) and subsea.
We have divided the segment into five sub-segments:1. Subsea2. Larger EPCI/yards3. Shipyards4. Consultants and engineering houses5. Workshops and product suppliers
Segment highlights• The engineering, fabrication and installation segment is the
single largest OFS segment, comprising 50% of the Norwegian registered OFS companies, and generating 48% of the overall 2014 OFS revenues. Market drivers include capex spending on the NCS, modification projects on existing producing infrastructure and the products, equipment and systems export to rigs (marine and utilities), offshore vessels and international topside projects.
• Despite the challenging backdrop in 2014, the segment posted a modest uptick of 3% in aggregated revenues. During the period 2010-14, revenues grew by 55.4% and the number of employees grew by 22.0%.
• Profitability has been under pressure throughout the period, with the EBITDA margin decreasing from 8.9% in 2010 to 5.9% in 2014. Meanwhile the ROCE decreased from 18.0% in 2010 to 9.9% in 2014. The negative profitability trend suggests that the overall segment did not capture any bottom line effects of the strong market period 2011-13.
• The reduction in oil price has significantly altered the E&P spending outlook. A low oil price combined with relatively high cost levels on the Norwegian continental shelf poses a challenge for the oil companies and the supply industry going forward. To regain competitiveness Norwegian EPCI companies are currently cutting costs through streamlining, downsizing and increasing collaboration.
Reservoir/seismic
Exploration and production drilling
Engineering, fabrication and
installationOperations
Demand for engineering, fabrication and installation remained strong in 2014
0%
2%
4%
6%
8%
10%
12%
14%
16%
18%
20%
0
50
100
150
200
250
300
2010 2011 2012 2013 2014
Rev
enue
(NO
K b
)
Key financials
Revenue EBITDA ROCE
43
23529067%
28%
5%
Segment composition (2014)Number of companies Revenue
Small < NOK 100m Large > NOK 1,000m
Medium NOK 100 – 1,000m0
50
100
150
200
2010 2011 2012 2013 2014 2015 2016 2017 2018 2019
Cap
ex (N
OK
b)
NCS capex
Fieds in production Under development Discoveries
Source: Norwegian Petroleum Directorate
Decommissioning

19The Norwegian oilfield services analysis 2015 |
SubseaThe subsea sub-segment includes companies that engineer and fabricate subsea equipment and companies within subsea umbilicals, risers and flowlines (SURF) and inspection, maintenance and repair (IMR).
• Subsea has developed into an important sector on the NCS. The majority of the fields developed on the NCS over the last ten years have been developed partly or fully with subsea technologies. The substantial growth in subsea developments is mainly driven by a number of smaller discoveries, discovered by means of the awards in predefined areas scheme (APA), where the regulator re-issues licenses in mature areas.
• This development is evident by the strong growth in subsea revenues of 66.6% since 2010 (CAGR of 13.6%). High subsea capex growth, both on the NCS and for deepwater export markets such as Brazil, West Africa and the Gulf of Mexico (GOM), has been the main growth driver. Substantial exposure to the deepwater developments cycle is a major challenge for the international subsea market going forward. With the oil price remaining below US$50 per barrel, it will be a challenge to maintain capital allocations in deepwater as oil companies are set to favor less capital intensive alternatives, that have lower complexity and project risk.
• EBITDA has been relatively stable since 2010, indicating that the oil price drop is yet to impact profitability within the subsea segment. Volatility in the ROCE is predominantly related to build up of receivables and unbilled revenue in the asset-heavy SURF niche.
• Subsea developments have increased in capital intensity over this period. Subsea costs have increased significantly, partly as a consequence of more challenging operating conditions and increasing field remoteness, complexity and bespoke engineering, and partly due to increased traceability requirements of components and testing, documentation and quality assessment of equipment. The cost inflation challenges the competitiveness of subsea solutions. In response to the subsea cost inflation, and the cost of intervention campaigns for subsea wells, operators are assessing alternatives such as unmanned wellhead platforms for field developments with applicable water depths.
• To regain competiveness, subsea contractors are reducing planning, engineering and installation costs by increasing collaboration and by forming alliances. Subsea installation companies and equipment providers are aiming to simplify system interfaces and reduce overall complexity. In addition several of the major subsea companies have downsized in 2015. These and other efficiency measures have contributed to lowering subsea costs by 20%-30% on several new developments.
Top five companies (2014 revenues)1. FMC Kongsberg Subsea AS2. Aker Subsea AS3. Subsea 7 Norway AS4. Technip Norge AS5. Vetco Gray Scandinavia AS
Larger EPCI/yards Shipyards
Engineering consultants Workshops and product suppliers
Subsea
0%
2%
4%
6%
8%
10%
12%
14%
16%
18%
0
10
20
30
40
50
60
70
80
2010 2011 2012 2013 2014
Rev
enue
(NO
K b
)
Key financials
Revenue EBITDA ROCE
0
10
20
30
40
50
Cap
ex (N
OK
b)
Onstream Probable DevelopmentUnder Development Ceased ProductionTechnical reserves
NCS subsea capex
To regain competiveness, the subsea contractors are reducing planning, engineering and installation costs by increasing collaboration and forming alliances.

20 | The Norwegian oilfield services analysis 2015
Larger EPCI/yardsThe sub-segment includes companies that offer engineering, procurement, construction and installation (EPCI) of production and processing modules and facilities. Companies in the sub-segment are also major maintenance and modification contractors for offshore topside facilities and onshore processing and receiving terminals.
• The larger EPCI/yard sub-segment experienced strong revenue growth of 97.7% from 2010 to 2013, before declining by 13.5% in 2014. The negative market trend in 2014 was initially driven by E&P’s cost cutting regimes and saving programs.
• Intensified price competition resulted in lower EBITDA margins (2.7% in 2014 compared to 4.7% in 2013) and lower ROCE. COGS, as a percentage of revenues, increased from 46% in 2012 to 55% in 2014.
• The increased price competition was due to elevated presence from Asian yards. During the 2011-12 period, Asian yards and the increased in COGS was due to increased use of contracted personnel in the boom period 2011-13. Asian yards won the majority of significant construction and installation projects in the period, including Gina Krog, Valemon, Ivar Aasen, Dagny, Martin Linge and Aasta Hansteen. However, Norwegian based OFS companies still delivered equipment, modules, jackets and hook-ups services to these projects, in some cases estimated to be 50%-60% of the total project value.
• Labor costs per employee and revenues per employee both showed volatility in the period. In 2013 the labor cost per employee decreased by 22.4%, while the revenue per employee increased by 15.4%. The trend reversed in 2014, when the labor cost per employee increased by 2.2%, while the revenue per employee declined by 9.3%. Overall the increase in the unit labor cost in Norway outpaced the corresponding increase in peer countries, as shown in the right graph, and poses a challenge for labor intensive sub-segments going forward.
• In 2014 the number of employees in the sub-segment decreased year-on-year by 4.7% to 9,854 employees. The labor reduction programs intensified in 2015.
• The oil price reduction, starting in 2014, further affected the EPCI/yard segment as the focus on cost translated into lower margins. Project cancellations, postponements and significant reductions in maintenance scope further added to the short and medium term market challenges for the sub-segment.
• The extensive use of Asian yards reduced in 2015 as the majority of construction projects were awarded to Norwegian EPCI
companies, partly due to cost overruns and delays affecting several of the Asian construction projects. Among the projects being awarded to Norwegian players is the 4 platforms Johan Sverdrup phase 1 development project, where 2 out of 4 topsides and 3 out of 4 jackets went to Norwegian based EPCI companies.
Top five companies (2014 revenues)1. Kværner Stord AS2. Aibel AS3. Westcon Yards AS4. Rosenberg Worleyparsons AS5. Coast Center Base AS
Subsea Shipyards
Engineering consultants Workshops and product suppliers
Larger EPCI/yards
0%
5%
10%
15%
20%
25%
0
5
10
15
20
25
30
35
40
2010 2011 2012 2013 2014
Rev
enue
(NO
K b
)
Key financials
Revenue EBITDA ROCE
0
20
40
60
80
100
120
140
Inde
x (y
ear
2010
=100
)
Norway GermanyKorea United Kingdom
Unit labor cost (indexed)
Project cancellations, postponements and significantly reduced maintenance scope further add to the short and medium term market challenges for the EPCI/yards sub-segment

21The Norwegian oilfield services analysis 2015 |
ShipyardsThe sub-segment includes shipyards that construct offshore vessels such as platform supply vessels (PSV), anchor handling tug supply vessels (AHTS) and offshore subsea construction vessels (OSCV).
• The newbuild offshore vessel market is of significant importance for Norwegian-based shipyards. Since 2012, offshore vessels have accounted for more than 80% of the entire order backlog for Norwegian shipyards. As the demand for offshore vessels declined in 2014, as shown in the lower right graph, the total order backlog fell from NOK36.6b in 2013 to NOK24.1b in 2014.
• Ship yard revenues decreased in the period 2009-11 as demand for new vessels declined after the financial crisis. Revenues have since rebounded with increased demand for more efficient vessels and fit for purpose design, resulting in a 24.3% revenue growth in the period 2011-14. Year-on-year revenue growth in 2014 amounted to 3.3% while the number of employees decreased by 3.0%.
• In contradiction to revenues, EBITDA margins and the ROCE both peaked in 2011. Actual EBITDA also peaked in 2011, which indicates that profitability is sensitive to activity levels and order intake rates. Lower activity levels allowed the shipyards to focus on project management and efficient execution. COGS, as a percentage of revenues, increased from 74% in 2011 to 85% in 2014. The reduction in the ROCE since 2011 can be explained by both reduced profitability and by a 117.0% increase in capital employed in the 2011-14 period, primarily due to balance sheet build-up of receivables and unbilled production.
• The short- to mid term outlook for Norwegian shipyards looks challenging with ship orders in 2015 projected at the lowest level since 2005. The oil price decline has led to a reduction in demand for offshore supply vessels, followed by an oversupply of vessels and reduced charter rates. As a result, the total number of stacked operational vessels on the NCS grew close to 100 during 2015 — the majority being PSV and AHTS vessels — resulting in a poor climate for investing in new vessels.
• The combination of a reduction in global demand in offshore support vessels, with the current level of vessels under construction, has created an oversupply situation that will take time to bring back into balance. Similar to the offshore drilling rig situation, there will be a considerable time lag between a potential oil price recovery and the time when market balance is restored. Thereafter yards will start to receive orders again for offshore support vessels.
• Meanwhile, and in the wake of the challenging market situation,
shipyards are increasing their focus on efficiency improvements, cost reduction and monitoring counterparty risk and cash conservation in order to handle the current and short term market outlook.
Top five companies (2014 revenues)1. Vard Group AS2. Kleven Verft AS3. Myklebust Verft AS4. Ulstein Verft AS5. Simek AS
Subsea Larger EPCI/yards
Engineering consultants Workshops and product suppliers
Shipyards
0%
5%
10%
15%
20%
25%
30%
0
2
4
6
8
10
12
14
16
18
20
2010 2011 2012 2013 2014
Rev
enue
(NO
K b
)
Key financials
Revenue EBITDA ROCE
0%
10%
20%
30%
40%
50%
60%
70%
80%
90%
100%
0
10
20
30
40
50
60
2008 2009 2010 2011 2012 2013 2014
Ord
er v
alue
(NO
K b
)
Order backlog Norwegian shipyards
Order backlog year-end Share of offshore vessels
Source: Norwegian Shipbuilders Sales and Marketing organization
Similar to the offshore drilling rig situation, there will be a considerable time lag between a potential oil price recovery and the time when market balance is restored. Thereafter yards will start to receive orders again for offshore support vessels.

22 | The Norwegian oilfield services analysis 2015
Subsea Larger EPCI/yards Shipyards
Workshops and product suppliersEngineering consultants
Consultants and engineering housesThe engineering consultants sub-segment includes companies that supply skilled personnel and consultants to the E&P operators and OFS companies.
• Revenues grew by 47.9% from 2010 to 2014 (CAGR 10.3%), compared to a corresponding growth in the number of employees of 21.9%. This indicates that engineering consultancy companies increased their capacity by offering third-party stand-alone consultants to their clients. In 2014 revenues grew year-on-year by 3.9% while the number of employees decreased by 1.9%.
• The sub-segment experienced increases in labor costs at a CAGR of 3.0% for labor cost per employee in the period 2010–14, as compared to revenues per employee, which had a CAGR of 5.0%. This resulted in a stable profitability over the period and, with improved capital discipline, a corresponding positive ROCE trend.
• The focus on cost since the beginning of 2014 impacted the consultant houses negatively in terms of activity level. Consequently, staff reduction intensified in 2015, which may indicate a reduction in revenues for this segment going forward.
Top five companies (2014 revenues)1. DNV GL AS2. Aker Engineering & Technology AS3. Frontica Business Solutions AS4. Wood Group5. Omega AS
0%
5%
10%
15%
20%
25%
30%
0
5
10
15
20
25
30
35
2010 2011 2012 2013 2014
Rev
enue
(NO
K b
)
Key financials
Revenue EBITDA ROCE
Subsea Larger EPCI/yards Shipyards
Engineering consultants Workshops and product suppliers
Workshops and product suppliersCompanies in the workshops and product suppliers sub-segment design, develop, fabricate and sell products and systems to offshore installations, rigs and vessels.
• The revenues increased by 25.0% in the period 2010-14 (CAGR 5.7%), while the year-on-year revenue in 2014 increased by 5.1% up to NOK89.2b.
• Profitability has declined steadily since 2010, with EBITDA reduced from 10.9% in 2010 to 6.0% in 2014. The reduction in profitability is primarily due to increasing price pressures and cost inflation (primarily in COGS). COGS, as a percentage of revenues, increased from 53.4% in 2010 to 56.9% in 2014.
• The ROCE has declined steadily from 23.8% 2010 to 11.6% in 2014, heavily impacted by the decline in profitability in addition to a 28% increase in capital employed. The increase in capital employed mainly related to build-up of inventory and work in progress balance items.
• Meanwhile labor costs have increased by 26.4% in the period 2010 to 2014, driven by both an increased number of employees and increased labor cost per employee. The number of employees increased by 11.5% in the period, while labor cost per employee increased by 13.3%.
Top five companies (2014 revenues)1. Rolls-Royce Marine AS2. Kongsberg Maritime AS3. Wartsila Norway AS4. Wärtsilä Oil & Gas Systems AS5. Bergen Engines AS
0%
5%
10%
15%
20%
25%
0
10
20
30
40
50
60
70
80
90
100
2010 2011 2012 2013 2014
Rev
enue
(NO
K b
)
Key financials
Revenue EBITDA ROCE

23The Norwegian oilfield services analysis 2015 |
Offshore logistics and M&M started seeing the effects of the reduced oil price in 2014
Reservoir/seismic
Exploration and production drilling
Engineering, fabrication and
installationOperations Decommissioning
About the segmentThe operations segment includes entities that support oil companies in the production phase, providing services such as offshore logistics, modification and maintenance services and production equipment and services.
We have divided the segment into 3 sub-segments:1. Offshore logistics2. Maintenance and modification3. Production
Segment highlightsRevenues in the operations segment was stable with a modest growth of 0.3% from 2013 to NOK75.0b in 2014. Profitability remained stable with an EBITDA margin of 16.2% and a ROCE of 6.8% in 2014.
The offshore logistics sub-segment experienced only a minor decrease in revenues. It was only toward the end of 2014 that the supply vessel sector started to experience the effects of declining demand, manifested by declining utilization and a sharp drop in spot market rates.
In 2014, the maintenance and modification (M&M) segment experienced reductions in revenues as a result of the cost reduction programs of E&P companies. Despite work force reduction initiatives, the M&M segment was not able to keep up with the decline in demand, and its year-on-year EBITDA margin declined from 5.9% to 3.3% in 2014.
The declines in offshore logistics and M&M were offset by an increase in the production segment, which continued to grow with stable EBITDA margins into 2014 and appeared to be relatively unaffected by cost reductions. With the NCS greenfield project portfolio now starting to come on-stream, market demand remains robust, however it is expected that the focus on cost will add pressure on margins going forward.
0%
5%
10%
15%
20%
25%
0
10
20
30
40
50
60
70
80
2010 2011 2012 2013 2014
Rev
enue
(NO
K b
)
Key financials
Revenue EBITDA ROCE
Segment composition (2014)
Number of companies Revenue
42%
49%
9%16
116157
Small < NOK100m Large > NOK1,000m
Medium NOK100 – 1,000m
0
200
400
600
800
1000
1200
1400
1600
1800
1970 1975 1980 1985 1990 1995 2000 2005 2010 2015 2020
Ann
ualp
rodu
ctio
n(m
mbo
e)
Production on the NCS
Oil Gas NGL Condensate
Source: Norwegian Petroleum Directorate

24 | The Norwegian oilfield services analysis 2015
Maintenance and modification ProductionOffshore logistics
Offshore logisticsThe sub-segment includes companies that own offshore vessels, such as PSVs, AHTSs and OCSV, as well as helicopter logistics and supply bases.
• Revenues in the offshore logistics segment reached NOK37.8b in 2014, a decrease of 1.1% from 2013. Activity levels were maintained for offshore supply vessels while activity increased in helicopter transportation.
• The stable performance of the segment in 2014 is of little surprise, as OSV activity in the North Sea remained strong through the majority of 2014, with utilization and rates at similar levels to that of 2013.
• The global OSV fleet increased by circa 200 vessels in 2014. However, toward the end of 2014 and accelerating in 2015, the OSV market experienced a slump in demand as E&P companies reduced activity primarily related to exploration and development, leading to an oversupply of vessels and a drop in day dates in the spot market. This was especially evident for smaller vessels.
• From a capital perspective, vessel acquisitions have been financed with an increasing amount of equity in recent years. Consequently, the overall sub-segment equity ratio has increased from 26.5% in 2012 to 31.9% in 2014. However, debt levels are historically high and equity ratios are expected to be negatively impacted as ship owners re-value vessels and other assets going forward.
• Currently, the OSV segment is facing three major challenges. Firstly, oversupply leads to low prices and poor utilization, forcing ship owners to cancel new ships, scrap or cold stack current fleet to better match supply with demand and to repurpose vessels to serve other sectors. Secondly, the price pressure from buyers may lead to consolidation efforts to improve supplier power. Thirdly, with high leverage and increasingly inaccessible bank and bond financing, ship owners will struggle to finance operations. Restructuring efforts are therefore likely to take place with alternative means of financing, such as institutional investors, private equity and buy/lease-back structures. An additional response from the industry will be to focus on working capital reduction, as average DSO rates are 4-5 months.
• The relatively smaller helicopter segment is less dependent on exploration and development activity than its marine counterpart, and could therefore be expected to manage the downturn better. However, the helicopter segment has seen low profitability during the last five years and 2014 marked the sixth consecutive year of negative operating profit.
Top five companies (2014 revenues)1. Farstad Supply AS2. Chc Helikopter Service AS3. Heli-One (Norway) AS4. Solstad Rederi AS5. Siem Offshore Rederi AS
0%
5%
10%
15%
20%
25%
30%
0
5
10
15
20
25
30
35
40
45
2010 2011 2012 2013 2014
Rev
enue
(NO
K b
)
Key financials
Revenue EBITDA ROCE
0%
20%
40%
60%
80%
100%
0
100
200
300
400
500
600
Q1 Q2 Q3 Q4 Q1 Q2 Q3 Q4 Q1 Q2 Q3 Q4
2013 2014 2015
Uti
lizat
ion
%
Day
rat
e, N
OK
thou
sand
s
Average spot day rates and utilization
Average day rates - PSV Average day rates - AHTS
Average utilization - PSV Average utilization - AHTS
Source: Seabrokers, DNB Markets, EY analysis
0
500
1000
1500
2000
2500
3000
3500
2010 2011 2012 2013 2014 2015
Num
ber
of v
esse
ls
Global PSV and AHTS fleet development
AHTS fleet (#) PSV fleet (#)
25The Norwegian oilfield services analysis 2015 |
Offshore logistics ProductionMaintenance and modification
Offshore logistics Maintenance & Modification Production
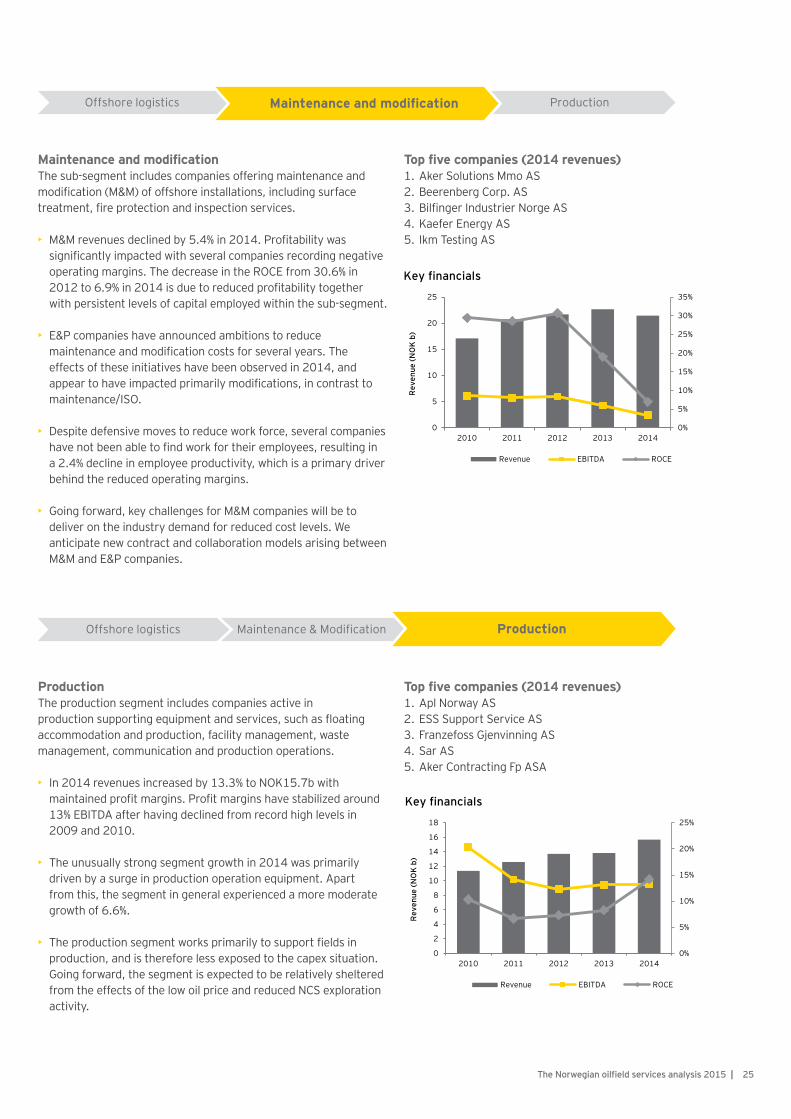
Maintenance and modificationThe sub-segment includes companies offering maintenance and modification (M&M) of offshore installations, including surface treatment, fire protection and inspection services.
• M&M revenues declined by 5.4% in 2014. Profitability was significantly impacted with several companies recording negative operating margins. The decrease in the ROCE from 30.6% in 2012 to 6.9% in 2014 is due to reduced profitability together with persistent levels of capital employed within the sub-segment.
• E&P companies have announced ambitions to reduce
maintenance and modification costs for several years. The effects of these initiatives have been observed in 2014, and appear to have impacted primarily modifications, in contrast to maintenance/ISO.
• Despite defensive moves to reduce work force, several companies have not been able to find work for their employees, resulting in a 2.4% decline in employee productivity, which is a primary driver behind the reduced operating margins.
• Going forward, key challenges for M&M companies will be to deliver on the industry demand for reduced cost levels. We anticipate new contract and collaboration models arising between M&M and E&P companies.
Top five companies (2014 revenues)1. Aker Solutions Mmo AS2. Beerenberg Corp. AS3. Bilfinger Industrier Norge AS4. Kaefer Energy AS5. Ikm Testing AS
0%
5%
10%
15%
20%
25%
30%
35%
0
5
10
15
20
25
2010 2011 2012 2013 2014
Rev
enue
(NO
K b
)
Key financials
Revenue EBITDA ROCE
ProductionThe production segment includes companies active in production supporting equipment and services, such as floating accommodation and production, facility management, waste management, communication and production operations.
• In 2014 revenues increased by 13.3% to NOK15.7b with maintained profit margins. Profit margins have stabilized around 13% EBITDA after having declined from record high levels in 2009 and 2010.
• The unusually strong segment growth in 2014 was primarily driven by a surge in production operation equipment. Apart from this, the segment in general experienced a more moderate growth of 6.6%.
• The production segment works primarily to support fields in production, and is therefore less exposed to the capex situation. Going forward, the segment is expected to be relatively sheltered from the effects of the low oil price and reduced NCS exploration activity.
Top five companies (2014 revenues)1. Apl Norway AS2. ESS Support Service AS3. Franzefoss Gjenvinning AS4. Sar AS5. Aker Contracting Fp ASA
0%
5%
10%
15%
20%
25%
0
2
4
6
8
10
12
14
16
18
2010 2011 2012 2013 2014
Rev
enue
(NO
K b
)
Key financials
Revenue EBITDA ROCE
26 | The Norwegian oilfield services analysis 2015
Decommissioning segment activity expected to rebound after slump in 2014
Reservoir/seismic
Exploration and production drilling
Engineering, fabrication and
installationOperations
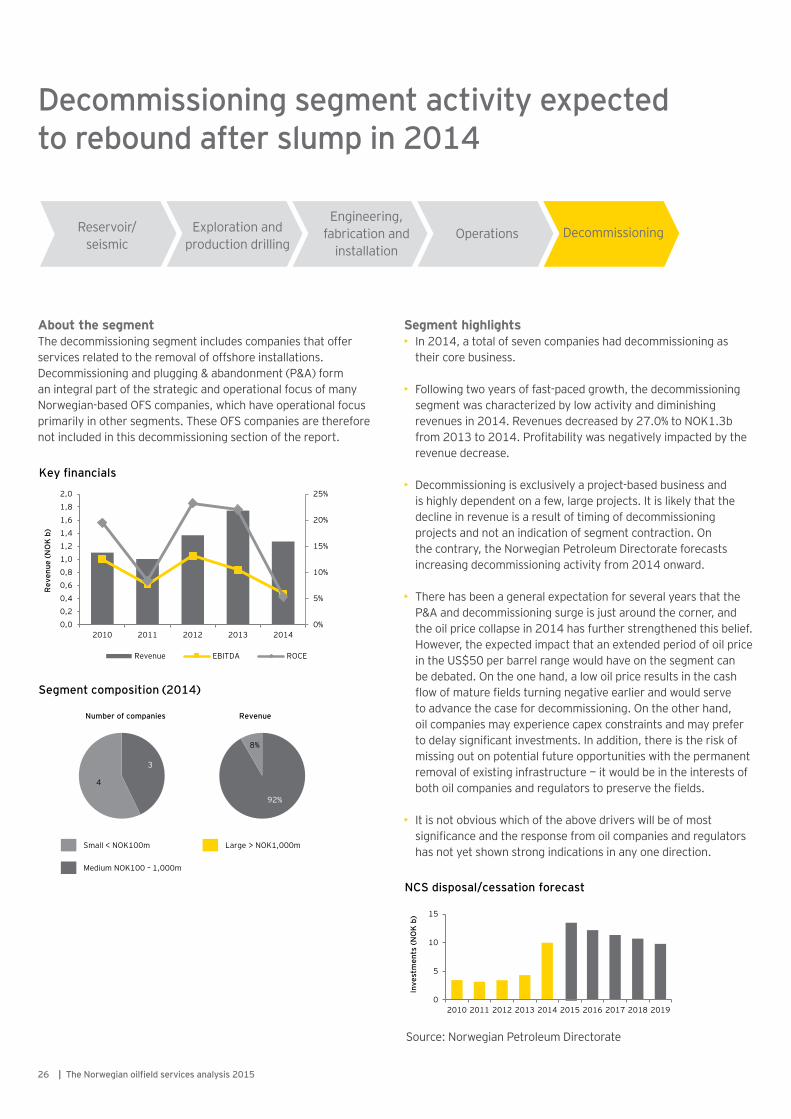
About the segmentThe decommissioning segment includes companies that offer services related to the removal of offshore installations. Decommissioning and plugging & abandonment (P&A) form an integral part of the strategic and operational focus of many Norwegian-based OFS companies, which have operational focus primarily in other segments. These OFS companies are therefore not included in this decommissioning section of the report.
Segment highlights• In 2014, a total of seven companies had decommissioning as
their core business.
• Following two years of fast-paced growth, the decommissioning segment was characterized by low activity and diminishing revenues in 2014. Revenues decreased by 27.0% to NOK1.3b from 2013 to 2014. Profitability was negatively impacted by the revenue decrease.
• Decommissioning is exclusively a project-based business and is highly dependent on a few, large projects. It is likely that the decline in revenue is a result of timing of decommissioning projects and not an indication of segment contraction. On the contrary, the Norwegian Petroleum Directorate forecasts increasing decommissioning activity from 2014 onward.
• There has been a general expectation for several years that the P&A and decommissioning surge is just around the corner, and the oil price collapse in 2014 has further strengthened this belief. However, the expected impact that an extended period of oil price in the US$50 per barrel range would have on the segment can be debated. On the one hand, a low oil price results in the cash flow of mature fields turning negative earlier and would serve to advance the case for decommissioning. On the other hand, oil companies may experience capex constraints and may prefer to delay significant investments. In addition, there is the risk of missing out on potential future opportunities with the permanent removal of existing infrastructure — it would be in the interests of both oil companies and regulators to preserve the fields.
• It is not obvious which of the above drivers will be of most significance and the response from oil companies and regulators has not yet shown strong indications in any one direction.
0%
5%
10%
15%
20%
25%
0,0
0,2
0,4
0,6
0,8
1,0
1,2
1,4
1,6
1,8
2,0
2010 2011 2012 2013 2014
Rev
enue
(NO
K b
)
Key financials
Revenue EBITDA ROCE
Segment composition (2014)
Number of companies Revenue
92%
8%
3
4
Small < NOK100m Large > NOK1,000m
Medium NOK100 – 1,000m
0
5
10
15
2010 2011 2012 2013 2014 2015 2016 2017 2018 2019
Inve
stm
ents
(NO
K b
)
NCS disposal/cessation forecast
Source: Norwegian Petroleum Directorate
Decommissioning

27The Norwegian oilfield services analysis 2015 |
Rogaland remains the primary OFS cluster, but growth is stagnating
Regions/clustersThe Norwegian OFS industry is present in every region in Norway, with the southern part of Norway accounting for the most activity and the largest share of companies and employees. However, as the geographic analysis is based on HQ location only, the activity in northern Norway, via subsidiaries and branches, is likely to be underestimated.
OFS revenues in Northern Norway have increased at a higher pace than the overall OFS industry, with an annual growth rate of 14.4% CAGR since 2010. Growth in the OFS activity level in Trøndelag and Møre has slowed down in recent years. Rogaland remains the primary hub of OFS activity in Norway, but growth in the region has started to stagnate amounting to only 1.1% in 2014, primarily due to lower activity within M&M and yards.
The North Sea and the Norwegian Sea remain the major oil and gas producing sectors, contributing 72.8% and 26.1% respectively of total liquid production in 2014. The Barents Sea, located around the Arctic circle, contains the LNG producing Snøhvit development and soon the on-stream Goliat oil field. However, limited exploration success has resulted in declining drilling activity in the Barents Sea in 2015.
All regions are facing challenges with reduction in market activity and uncertain short- to medium term outlooks. Regions with high concentrations of export-oriented OEMs, like Agder and Møre, are particularly exposed to the current heavy asset over-supply, and are at risk relative to the timing of a market recovery. Regions with a more diversified profile of OFS segment activity and a higher share of activity related to operational support, such as Rogaland and Hordaland, are positioned for an earlier recovery, but the significant size of the OFS sector relative to the overall economy in these regions means that they will nevertheless continue to be impacted by the downturn.
Methodology and description• Size of circle indicates share of total revenues• Distribution by official registered company head quarter location
Regions Number of legal entities
Employees (No. 1,000)
Revenue (NOK b)
CAGR 2010-14
Agder 67 10 63.3 15%
BTV* 79 11 30.9 9%
EasternNorway 158 21 105.3 12%
Hordaland 178 17 59.3 15%
Møre 134 13 55.8 3%
Northern Norway 23 1 1.9 14%
Rogaland 415 52 174.5 7%
Trøndelag 59 6 14.8 6%
Total 1 113 131 505.8 9%
Reservoir/seismic
Exploration & productiondrilling
Engineering, fabrication &installation
Operation
Decommissioning
The Barents Sea
# Potential future dev. 2
# Fields under dev. 1
# Fields in production 1
The Norwegian Sea
# Potential future dev. 14
# Fields under dev. 2
# Fields in production 17
The North Sea – South
# Potential future dev. 2
# Fields under dev. 1
# Fields in production 14
The North Sea – North
# Potential future dev. 7
# Fields under dev. 1
# Fields in production 30
Northern Norway
Trøndelag
Møre
Hordaland
Rogaland
Eastern Norway
BTV
Agder
The North Sea – Central
# Potential future dev. 9
# Fields under dev. 4
# Fields in production 22
* Buskerud, Telemark and Vestfold

28 | The Norwegian oilfield services analysis 2015
Activity going forward
2014 marked the end of a strong growth period in the Norwegian oilfield service industry. Already at the start of the year, major oil companies announced cuts to their opex and capex forecasts for the coming years, and the effect was reinforced by the significant oil price decline from US$115 per barrel in June 2014 to below US$40 per barrel in December 2015. Recent estimates from Wood Mackenzie forecast global E&P capex to decrease by 40% from 2014 to 2016. We anticipate the reduction in E&P spending to impact both the domestic market and the export markets for the Norwegian based OFS industry, by means of a projected revenues decline by 25% from 2014 to 2016.
Exports, which accounts for approximately 35% of revenues in the analysis, are expected to be severely impacted, reducing by 31% from 2014 to 2016. The most important export segments are rig equipment, subsea, product suppliers and reservoir/seismic. Overcapacity within the reservoir/seismic, rig and OSV segments means a sharp reduction in new builds, and lower activity and challenging margins from existing fleet operations. The expected activity among product suppliers and subsea is more uncertain. Facilitated by a favorable currency exchange rate, Norwegian suppliers have obtained a competitive advantage internationally — however, there is still a considerable downside to the activity levels, due to uncertainties around the oil price.
The domestic market, which remains the largest source of activity, will also decline. NCS investments and costs are expected to decline by 22% from 2014 to 2016. This is mainly due to lower investments and exploration spending, the latter which is projected to drop by 27%, from 2014 to 2016, whilst operating costs are expected to remain stable.
Several of the ongoing field developments that have fueled the investment growth in recent years, such as Edvard Grieg, Ivar Aasen and Goliat, are approaching the end of construction and are coming onstream. The field development investments going forward are mainly related to Johan Sverdrup and smaller projects.
The lower oil price has forced oil companies to evaluate their portfolios and several potential projects, most notably Johan Castberg, have been postponed.
Effects on the industrySeveral OFS companies announced job cuts and cost saving initiatives toward the end of 2014 and throughout 2015, especially within EFI, rig equipment and rig companies. It remains to be seen if further cuts will follow, or if the majority of reductions already made are sufficient to establish sustainable operational cost levels. With further declining oil price trend into 2016, it is likely that additional Norwegian based OFS capacity evaluations will occur.
Frame agreements and medium- to long term service contracts are being re-negotiated, in many cases with extended durations and longer option periods. Due to the capacity oversupply, it is expected that companies participating in these negotiations will offer terms and conditions that are as cost effective as possible for their customers. These new terms and conditions will put pressure on future margins, which is what was observed following the financial crisis and the oil price collapse in 2008.
The equity ratio in the industry was higher in 2014 than in 2008. Even with notably large differences at the company level, higher equity ratios suggest that the industry as a whole is better prepared for this current downturn compared to the previous one. This also indicates that it could take time before the full effects of the downturn become visible. We expect several companies to recognize impairment of fixed assets and goodwill in relation to the closing of their 2015 annual accounts, which will reduce the equity ratio. For some companies, asset write-downs could even result in breach of their loan covenants. Restructuring and industry consolidation initiatives are likely to follow, leading to an increase in OFS transaction activity in 2016, compared to the low base transaction level experienced in 2015.
0
50
100
150
200
250
300
350
2009 2010 2011 2012 2013 2014 2015 2016 2017 2018 2019
Inve
stm
ents
and
cos
ts(N
OK
b)
NCS Investments and costs
Investments Operating costs Exploration costs
Disposal and cessation Other costs
29%
30%
31%
32%
33%
34%
35%
36%
0
100
200
300
400
500
600
2006 2007 2008 2009 2010 2011 2012 2013 2014 2015 2016
Shar
eex
port
Rev
enue
(NO
K b
)
Revenues – export vs domestic
Export Domestic Share export
Source: Norwegian Petroleum Directorate

29The Norwegian oilfield services analysis 2015 |
Deteriorating outlook into 2016Based on available sources, such as quarterly reporting from listed OFS firms, and expected relationships between macro variables and individual segments, we have made projections for the activity levels in the OFS industry in 2015 and 2016. These forecasts are uncertain.
Overall, we project a decline in total revenues of 9% in 2015 and a further decline of 17% in 2016. This constitutes a decline in revenues from NOK 506b in 2014 to NOK 460b in 2015 and NOK 382b in 2016.
Operating profit before interest, tax and impairment (“EBITI”) is projected to decline as well, both in absolute terms and as a share of revenues. However, the decline in the EBITI-margin will be limited by the industry’s continued efforts to adjust the cost base to a lower activity level. Overall, our projections show a reduction of the EBITI-margin from 7% in 2014 to 6% in 2015 and 5% in 2016.
Reservoir/seismicRevenues in this segment have historically been correlated with the following year’s exploration expenses. Exploration spending on the NCS is forecast to decline by 32% in 2016, which indicates substantial weakening of revenues in 2015. This is also in line with quarterly reporting by listed seismic companies. The current oil price environment does not point toward an imminent upswing in oil and gas exploration which, in combination with oversupply of seismic vessels, suggest some challenging years ahead for this segment. We estimate a YoY revenues reduction of 28% to 2015 and a further 25% reduction in 2016 for the Reservoir/seismic OFS segment.
E&P drillingThe rig market is currently oversupplied, with the number of rigs exceeding the demand. This has led to lower utilization and rig day rates, and a number of rigs being stacked or scrapped. We expect rig companies’ revenues to decline in 2015 and 2016, despite the support from the depreciation of the Norwegian krone.The overcapacity in the rig market has more or less cut new orders for rigs to zero. This will severely affect the rig equipment segment, which is expected to be one of the sub-segments with the most substantial revenue reduction in 2016. Many companies within this sub-segment are cutting costs through layoffs, a trend that unfortunately is likely to continue into 2016. The sub-segment’s revenues in 2016 are anticipated to fall back toward the levels obtained in 2010-11.
The number of E&P wells drilled on the NCS increased from 219 in 2014 to 245 in 2015, which was surprising. For 2016, Statistics Norway projects a sharp reduction in exploration spending on the NCS, whereas production drilling is currently forecast to decrease by 7% from 2015 to 2016. Overall, revenues in the well services sub-segment in 2015 and 2016 are expected to show a reduction in line with the general decline in drilling costs on the NCS.
Overall, we expect revenues in the Exploration & Production Drilling segment to fall by 8% in 2015 and 26% in 2016, while EBITI-margins will fall below the 10%-level achieved in 2014.
Engineering, fabrication and installationThe revenue and profitability drivers of this segment vary between its different sub-segments. Consultants and yards are primarily suppliers to E&P operations and developments on the NCS, and are thus naturally affected by the general decline in NCS activity. The contracts awarded for the Johan Sverdrup field will to some degree support activity going forward, and we estimate that revenues for these two sub-segments will drop in line with the general fall in capex spending on the NCS for 2015 and 2016.
In addition to the development on the NCS, the subsea sub-segment is also driven by exports. These are expected to fall due to lower global E&P spending, although the depreciation of the Norwegian krone will limit the decline in these firms’ revenues as measured in NOK. Medium term, upcoming subsea tie-backs on the NCS could set the stage for a partial recovery.
In recent years, Norwegian shipyards have relied on the construction of new offshore vessels for the majority of their revenues. Due to the current overcapacity in the offshore vessel market, this revenue source will fall significantly in the coming years. We estimate year-on-year revenue reductions in the range of 10%-15% in both 2015 and 2016.
0%
2%
4%
6%
8%
10%
12%
14%
16%
18%
0
100
200
300
400
500
600
2009 2010 2011 2012 2013 2014 2015 2016
Pro
fitab
ility
Rev
enue
s (N
OK
b)
OFS forecast
Revenues EBITI-margin ROCE

30 | The Norwegian oilfield services analysis 2015
Workshops and product suppliers also have a large exposure to the offshore vessel new build market, and is therefore expected to experience sharp revenue reductions in both 2015 and 2016. As with subsea firms, the drop is somewhat alleviated by a weakened Norwegian krone.
For the EFI segment as a whole, we forecast a decline in revenues of 9% in 2015 and a further drop of 13% in 2016. Historically, the segment’s profit margins have not been strongly correlated with the activity levels, and we anticipate EBITI-margins to remain around the subdued 4%-level realized in 2014.
OperationsThe E&P operators on the NCS started announcing cuts in maintenance and modifications-spending in early 2014, and this will continue to have an impact on revenues and margins in this sub-segment in 2015 and 2016. Renegotiated M&M contracts were recently awarded, and operators will continue to re-negotiate their contract portfolios in 2016. We expect the pressure to lower prices in the new contracts will lead to continued revenue declines, while profit margins will stabilize at a low level as M&M firms reduce capacity in line with lower activity levels.
The offshore logistics segment is experiencing severe overcapacity within the PSV and AHTS vessel markets after many years of adding new builds into the market. This has led to declining spot day rates and vessels being sent to stacking. Demand for AHTS is related to rig moves, which is expected to decrease with lower rig activity both globally and on the NCS.
On this backdrop, the Production sub-segment stands out as relatively robust. Still, total revenues for all Operations sub-segments are expected to fall by 4% in 2015 and 9% in 2016.

31The Norwegian oilfield services analysis 2015 |
In the New Policies Scenario (central scenario), oil production grows by 12% from 2014, to over 100 million barrels per day in 2040.
Source: IEA WEO, Oct 2015

32 | The Norwegian oilfield services analysis 2015
Comparison of NCS and UKCS
To allow a comparison across the UKCS and the NCS, the companies from the UK oilfield service report have been re-classified to match the segmentation used in this report, and only companies with revenues greater than GBP10m in any year from 2008 to 2014 are included. The UK report does not include a decommissioning segment and this has therefore been excluded in the comparison. The exchange rate used to convert GBP to NOK is 10.3 fixed rate.
Activity in oilfield services in the UK and Norway is increasing across all segments of the value chain. The UK has experienced revenue growth of 9.0% CAGR between 2008 and 2014, while Norway has grown by 6.1% CAGR during the same period. The different levels of maturity in the UKCS and the NCS are reflected in the revenue generated by the different value chain segments.
UK revenue growth has mainly been in the engineering, fabrication and installation and operations segments, reflecting the more mature status of the UKCS. There has been increased investment (2014 capital spend was the highest for more than three decades) and the combination of ageing infrastructure and the need to extend the productive life of fields has resulted in substantial modifications and upgrades of installations.
Norway revenue has experienced stable growth in all segments, driven primarily by increased capital expenditure in relation to exploration and development activities. In 2014, revenue growth was primarily driven by the exploration and production drilling and engineering, fabrication and installation segments, due to the continued high exploration activity on the NCS.
Margins in the UKCS declined from 2009 to 2011 as a result of pricing pressures and salary increases due to a shortage of skilled personnel. There was an EBITDA margin improvement in 2012, which was maintained in 2013 and 2014, but given the current low oil price, the focus on cost reduction and pressures on rates in the UKCS, maintaining margins in 2015 and 2016 will be challenging. On the NCS, margins have been relatively stable, albeit with a slow decline from the peak of 14.1% in 2010. There was a further decline to 11.4% in 2014 due to cost pressures reducing the underlying profitability of operations.
Export turnover from the UKCS increased between 2008 and 2014 from NOK107.1b to NOK157.6b (38% of total turnover), reflecting the internationalization of the UK oilfield services sector. Exports from the NCS have steadily increased from 2011 to 2014, and are currently estimated to NOK175b (35% of total turnover). Norwegian exports are related to rig equipment, product suppliers, offshore and seismic vessels and subsea equipment and services, which are segments where the industry has gained a global competitive edge.
5,6 %
10,4 %
3,9 %
6,0 %
0%
2%
4%
6%
8%
10%
12%
Reservoir/seismic Exploration &production drilling
Engineering,fabrication &installation
Operation0
50
100
150
200
250
Rev
enue
CA
GR
200
8-14
Rev
enue
(NO
K b
)
Norway OFS segments size and growth
Revenue 2014 Revenue CAGR 2008-14
9,9 %
5,9 %
9,3 %10,1 %
0%
2%
4%
6%
8%
10%
12%
Reservoir/seismic Exploration &production drilling
Engineering,fabrication &installation
Operation0
50
100
150
200
250
Rev
enue
CA
GR
200
8-14
Rev
enue
(NO
K b
)
UK OFS segments size and growth
Revenue 2014 Revenue CAGR 2008-14
0%
5%
10%
15%
0
100
200
300
400
500
600
2008 2009 2010 2011 2012 2013 2014
EBIT
DA
Rev
enue
(NO
K b
)
Norway OFS revenues and EBITDA
Revenue EBITDA
0%
5%
10%
15%
0
100
200
300
400
500
600
2008 2009 2010 2011 2012 2013 2014
EBIT
DA
Rev
enue
(NO
K b
)
UK OFS revenues and EBITDA
Revenue EBITDA

33The Norwegian oilfield services analysis 2015 |
0
500
1 000
1 500
2 000
2003 2005 2007 2009 2011 2013 2015 2017 2019 2021 2023 2025 2027 2029
Pro
duct
ion
(mm
boe)
Historical and forecast production
NCS UKCSAs the UKCS is a mature basin, production had been declining annually between 2003 to 2013, with an average annual decline of 10%. This trend was reversed in 2014 and growth is forecast in each of the years 2015 to 2017, before plateauing in 2018 and declining from 2019 onward. The growth in 2014, and forecast from 2015 onward, is a result of new fields coming onstream (e.g., Golden Eagle, Kinnoull, Laggan, Cygnus and Mariner), a forecast ramp-up in activity in Elgin Franklin following the shut-down in 2012 and Schiehallion production being expected to recommence in 2017 after the new FPSO is commissioned.
While oil production on the NCS has almost halved since its peak in 2001, the decrease in oil volumes has gradually been replaced with gas production, offsetting some of the decline in overall production. Although the large mature fields such as Troll, Ekofisk and Åsgard have passed their peak production, they still have many years of production left. In addition, several small- and medium sized discoveries have come onstream during the recent years, such as Skarv, Gjoa and Vega, to compensate for reduction in production from some of the more mature fields. From 2015 onward, there are several new developments coming onstream, including Aasta Hansteen, Edward Grieg and Goliat. In addition, the Johan Sverdrup field is forecast to commence production in 2019 and this is expected to contribute an additional 600 boe/day during peak production. As a result, the combined impact of all these developments is expected to ensure stable production levels in the NCS for the next 10 years.
Investment in the UKCS has more than doubled since 2010 due to a number of large projects being sanctioned and new field allowances encouraging investment in projects that would otherwise have been unattractive. 2014 was the highest year of investment in over 30 years at US$21b (comprising fields under development, e.g., Kraken, Greater Laggan Area, Mariner and Golden Eagle and upgrades to existing fields). However, capital expenditure is forecast to decline from 2015 onward due to the current low oil price, which has resulted in operators significantly reducing their capital expenditure budgets. Although the large development projects which are underway will continue, the reduction in capital expenditure budgets has resulted in a number of projects which were due to commence in 2015 onward being delayed or cancelled.
Investment in the NCS reached a record high in 2013 at US$29.8b and remained high in 2014. This was driven by major development projects and upgrades in current fields, primarily Troll and Åsgard. During the next few years, the most significant project on the NCS will be the development of Johan Sverdrup, with the total value of the first stage of construction estimated to be around NOK117b.
0
5
10
15
20
25
30
35
2003 2004 2005 2006 2007 2008 2009 2010 2011 2012 2013 2014 2015 2016 2017 2018 2019 2020
Inve
stm
ent
(USD
b)
Historical and forecast capital expenditure
NCS UKCS

34 | The Norwegian oilfield services analysis 2015
Methodology
Data collectionAccounting information is publicly available from the Brønnøysund Register Centre. The companies’ business addresses as registered by the same register have been used to reflect the entities’ geographic location. The number of companies included in the analysis will vary somewhat depending on the availability of financial information.
In order to analyze economic activity by geographic location and across the OFS value chain, we have used the stand-alone financial statements of individual legal entities. As a result, large corporations have been analyzed through their constituent individual companies and not as a consolidated group. Intercompany transactions are not eliminated when financial figures are aggregated. In addition, the revenues of subsidiaries owned by a Norwegian holding company, but registered abroad, are not captured. 2015 figures have been modeled based on previous years where annual reports were not available by the time this report was prepared.
Inclusion criteriaA company is defined as a Norwegian OFS company if:• At least 50% of its turnover is generated in the oil and gas sector
and• It is a Norwegian-registered company
Value chain segmentsEach company in the OFS portfolio has been reviewed individually, and an assessment has been made with regard to the company position in the value and supply chain.
The value chain has the following categories:• Reservoir/seismic• E&P drilling• Engineering, fabrication and installation • Operations • Decommissioning
Each of these categories are further broken down into sub-segments to capture the huge diversity within the industry.
Companies have been categorized according to the value chain segment in which they generate the majority of their revenues.
Company size definition• Large companies: revenues above NOK1b• Medium-size companies: revenues between NOK100m
and NOK1b• Small companies: revenues below NOK100m
LocationThe regions used in the analysis have been chosen to reflect and illustrate the main clusters of OFS companies in Norway. The regions are:• Rogaland• Hordaland• Agder• Møre (Møre & Romsdal and Sogn & Fjordane)• BTV (Buskerud, Telemark and Vestfold)• Trøndelag (Sør- and Nord Trøndelag)• Northern Norway (Nordland, Troms and Finnmark)• Eastern Norway (Oslo, Akershus, Oppland, Østfold and Hedmark)
Calculations• EBIT = Earnings Before Interest and Tax (driftsresultat)• EBITI = ...EBIT + Impairment• EBITDA = EBITI + Depreciation and amortization• Capital employed = Total assets – (Financial long-term and short-
term investments + Cash) – (Trade creditors + Tax payable + Public duties payable)
• ROCE (Return on Capital Employed) = EBITI / Capital employed• Days Sales Outstanding (DSO) = Trade receivables / (Revenue x
[1+25%])• Days Payable Outstanding (DPO) = Trade payables / (COGS x
[1+25%])• Days Inventory Outstanding (DIO) = Inventory / COGS• Cash-conversion-cycle (CCC) = DIO + DSO – DPO

35The Norwegian oilfield services analysis 2015 |
Transaction Advisory ServicesEspen NorheimPartnerMobile: +47 928 02 095Email: [email protected]
Transaction Advisory ServicesKjell StenersenPartnerMobile: +47 982 06 678 Email: [email protected]
AdvisoryJohn AvaldsnesPartnerMobile: +47 992 16 744 Email: [email protected]
AssuranceTor Inge SkjellevikPartnerMobile: +47 982 06 676Email: [email protected]
TaxHans Georg WillePartnerMobile: +47 908 45 931Email: [email protected]
Contacts

EY | Assurance | Tax | Transactions | Advisory
About EYEY is a global leader in assurance, tax, transaction and advisory services. The insights and quality services we deliver help build trust and confidence in the capital markets and in economies the world over. We develop outstanding leaders who team to deliver on our promises to all of our stakeholders. In so doing, we play a critical role in building a better working world for our people, for our clients and for our communities.
EY refers to the global organization, and may refer to one or more, of the member firms of Ernst & Young Global Limited, each of which is a separate legal entity. Ernst & Young Global Limited, a UK company limited by guarantee, does not provide services to clients. For more information about our organization, please visit ey.com.
© 2016 EYGM Limited. All Rights Reserved.
EYG no. DW0586ED None
This material has been prepared for general informational purposes only and is not intended to be relied upon as accounting, tax, or other professional advice. Please refer to your advisors for specific advice.
ey.com
Photos: ThinkstockPage 1: Photographer: curraheeshutter, Collection: iStockPage 2: Photographer: curraheeshutter, Collection: iStockPage 7: Photographer: noomcpk2528, Collection: iStockPage 11: Photographer: curraheeshutter, Collection: iStockPage 31: Photographer: nielubieklonu, Collection: iStock


![k]jna[]k YfYdqkak*()1 - assets.ey.com · The Norwegian oilfield services analysis 2019 | 5 Executive summary The development in revenues finally turned in 2018 After several years](https://static.fdocuments.us/doc/165x107/5e73a94bd9452639bb01d63f/kjnak-yfydqkak1-the-norwegian-oilfield-services-analysis-2019-5-executive.jpg)


