NWRFC Water Supply Directions for 2012+ Steve King Northwest River Forecast Center.
Upload
brynne-vangCategory
view
22download
0description

Northwest Power and ConservationCouncil
The Northwest Forecast – The Northwest Forecast – Energy Efficiency Energy Efficiency Dominates Resource Dominates Resource DevelopmentDevelopment
Tom EckmanTom Eckman
Manager, Conservation ResourcesManager, Conservation Resources
Northwest Power and Conservation CouncilNorthwest Power and Conservation Council
Presented September 26, 2005Presented September 26, 2005
2005 ACEEE Energy Efficiency as a Resource Conference2005 ACEEE Energy Efficiency as a Resource Conference

slide 2
Northwest Power and ConservationCouncil
What You’re About To HearWhat You’re About To Hear
Efficiency and the Current Resource MixEfficiency and the Current Resource Mix
Regional Efficiency GoalsRegional Efficiency Goals
– 55thth Northwest Power and Conservation Plan Northwest Power and Conservation Plan
– Utility and SBC Administrator PlansUtility and SBC Administrator Plans
What’s Behind the GoalsWhat’s Behind the Goals
The Challenge AheadThe Challenge Ahead

slide 3
Northwest Power and ConservationCouncil
PNW Energy Efficiency PNW Energy Efficiency AchievementsAchievements1978 - 20041978 - 2004
0
500
1,000
1,500
2,000
2,500
3,000
Avera
ge M
egaw
att
s
1978 1982 1986 1990 1994 1998 2002
BPA and Utility Programs Alliance Programs State Codes Federal Standards
Since 1978 Utility & BPA Since 1978 Utility & BPA Programs, Energy Codes & Programs, Energy Codes & Federal Efficiency Standards Have Federal Efficiency Standards Have Produced Nearly 3000 aMW of Produced Nearly 3000 aMW of Savings.Savings.

slide 4
Northwest Power and ConservationCouncil
Cumulative 1978 - 2004 Efficiency Cumulative 1978 - 2004 Efficiency Achievements by SourceAchievements by Source
Alliance Programs185 aMW
6%
State Codes560 aMW
19%
Federal Standards545 aMW
19%
BPA and Utility Programs1635 aMW
56%

slide 5
Northwest Power and ConservationCouncil
Energy Efficiency Resources Energy Efficiency Resources Significantly Reduced Projected PNW Significantly Reduced Projected PNW
Electricity SalesElectricity Sales
14,000
16,000
18,000
20,000
22,000
24,000
1980 1985 1990 1995 2000
Avera
ge M
egaw
att
s
Medium High ForecastMedium LowMedium High Minus ConservationActual

slide 6
Northwest Power and ConservationCouncil
Energy Efficiency Met Nearly 40% of Energy Efficiency Met Nearly 40% of PNW Regional Firm Sales Growth PNW Regional Firm Sales Growth
Between 1980 - 2003Between 1980 - 2003
61%
39%
Generation Conservation
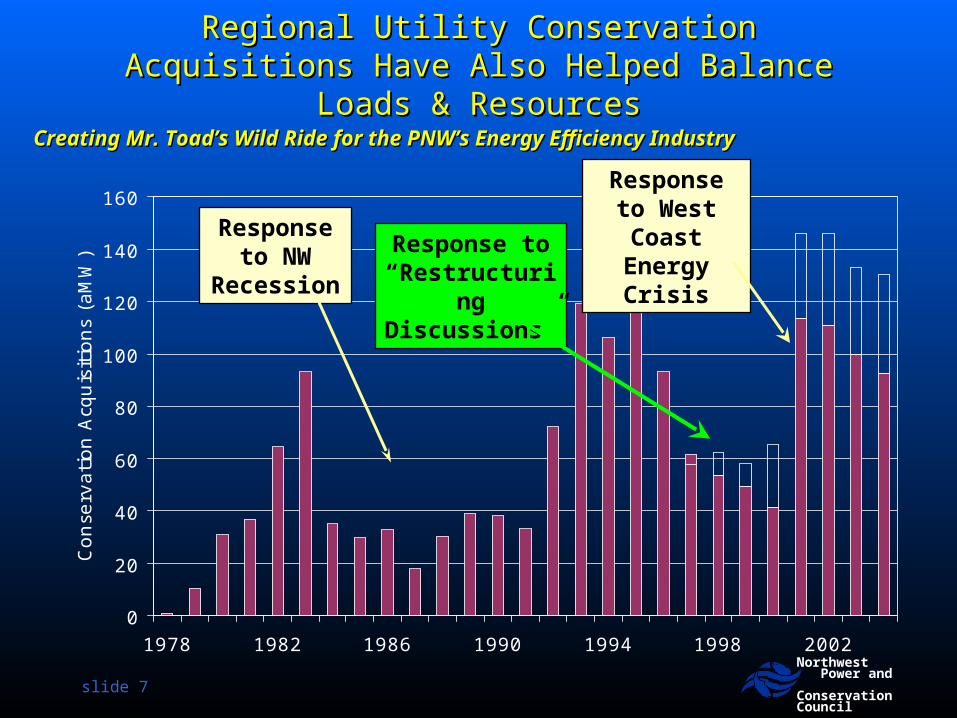
slide 7
Northwest Power and ConservationCouncil
Regional Utility Conservation Acquisitions Have Regional Utility Conservation Acquisitions Have Also Helped Balance Loads & ResourcesAlso Helped Balance Loads & Resources
0
20
40
60
80
100
120
140
160
1978 1982 1986 1990 1994 1998 2002
Con
serv
ati
on
Acq
uis
itio
ns
(aM
W)
Response to West Coast
Energy CrisisResponse to NW
Recession
Response to “Restructuring
Discussions”
Creating Mr. Toad’s Wild Ride for the PNW’s Energy Efficiency IndustryCreating Mr. Toad’s Wild Ride for the PNW’s Energy Efficiency Industry

slide 8
Northwest Power and ConservationCouncil
So What’s 3000 aMW?So What’s 3000 aMW?
It’s enough electricity to serve the It’s enough electricity to serve the entireentire state of Idaho and all of Western state of Idaho and all of Western MontanaMontana
It’s enough electricity to meet nearly It’s enough electricity to meet nearly 60% of Oregon total electricity use60% of Oregon total electricity use

slide 9
Northwest Power and ConservationCouncil
So Much for the Past, So Much for the Past, What’s AheadWhat’s Ahead

PNW Portfolio Planning – Scenario Analysis on SteroidsPNW Portfolio Planning – Scenario Analysis on Steroids
0%
2%
4%
6%
8%
10%
12%
14%
16%
0.0% 1.0% 2.0% 3.0% 4.0% 5.0%
Annual Load Growth
Pro
bab
ilit
y (
%)
0%
2%
4%
6%
8%
10%
12%
14%
16%
18%
0% 1% 2% 3% 4% 5%
Real Natural Gas Escalation Rate% )
Pro
bab
ilit
y (
%)
0%
5%
10%
15%
20%
25%
30%
3.27% 3.80% 3.85% 3.93% 2.50%
Nominal Annual Electricity Price Escalation Rate
Pro
bab
ilit
y (
%)
0
20
40
60
80
100
120
98
467
705
842
1,06
9
1,19
1
1,28
3
1,33
5
1,35
3
1,37
3
1,65
0
Resource Potential
Levelized C
ost
0%2%4%6%8%
10%12%14%16%18%20%
Carbon Tax Implementation Date
Pro
bab
ilty
(%
)
0
5000
10000
15000
20000
25000
1925 1930 1935 1940 1945 1950 1955 1960 1965 1970 1975
Hydrosytem Year
Cap
acit
y (
MW
)
0%2%4%6%8%
10%12%14%16%18%20%
Pro
bab
ilit
y
$0 $6 $12 $18 $24 $30 $36
Carbon Tax
Frequency Chart
Dollars
Mean = $689.000
.011
.022
.032
.043
0
10.75
21.5
32.25
43
($3,509) ($1,131) $1,247 $3,625 $6,003
1,000 Trials 1,000 Displayed
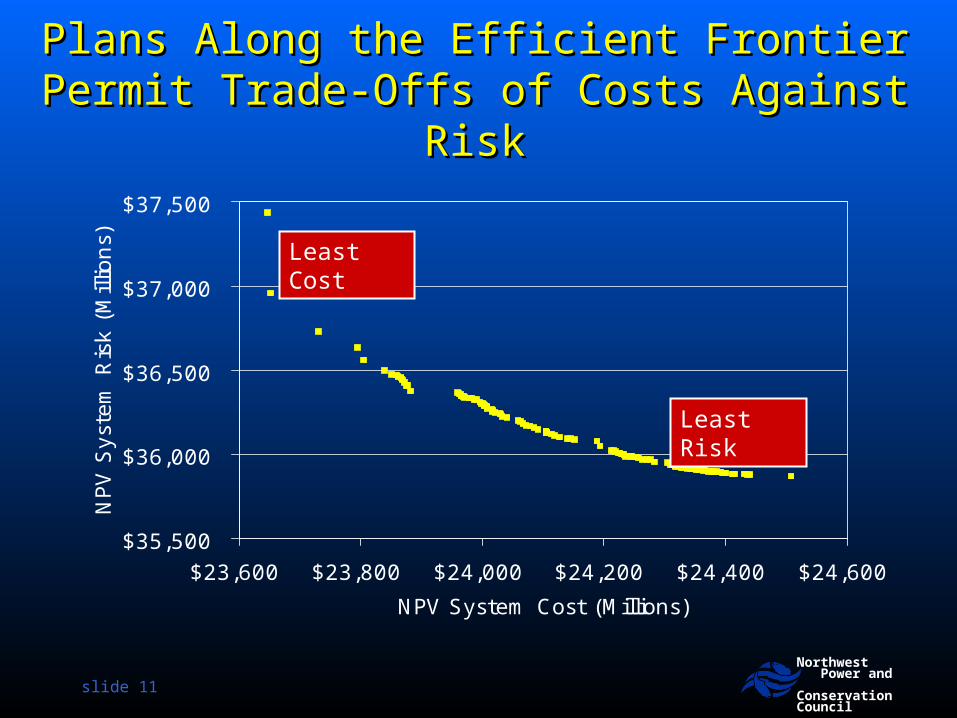
Portfolio Portfolio Analysis Analysis ModelModel
$35,500
$36,000
$36,500
$37,000
$37,500
$23,500 $24,000 $24,500 $25,000
NPV System Risk (2004$Millions)
NP
V S
yste
m C
ost
(20
04
$M
illio
ns)
Efficient FrontierEfficient Frontier
NPV System Cost
slide 11
Northwest Power and ConservationCouncil
Plans Along the Efficient Frontier Permit Plans Along the Efficient Frontier Permit Trade-Offs of Costs Against RiskTrade-Offs of Costs Against Risk
$35,500
$36,000
$36,500
$37,000
$37,500
$23,600 $23,800 $24,000 $24,200 $24,400 $24,600
NPV System Cost (Millions)
NPV
Syst
em
Ris
k (
Mill
ions)
Least Risk
Least Cost

slide 12
Northwest Power and ConservationCouncil
Three Conservation Options TestedThree Conservation Options Tested
Option 1Option 1: : AcceleratedAccelerated – Similar to the “best – Similar to the “best performance” over the last 20 yearsperformance” over the last 20 years– Non-lost opportunity limited to 120 aMW/yearNon-lost opportunity limited to 120 aMW/year– Ramp-up lost-opportunity to 85% by 2017Ramp-up lost-opportunity to 85% by 2017
Option 2Option 2: : SustainedSustained - Similar to typical rates over - Similar to typical rates over last 20 yearslast 20 years– Non-lost opportunity limited to 80 aMW/yearNon-lost opportunity limited to 80 aMW/year– Ramp-up lost-opportunity to 85% by 2017Ramp-up lost-opportunity to 85% by 2017
Option 3Option 3: : Status QuoStatus Quo - Similar to lowest rates over - Similar to lowest rates over last 20 yearslast 20 years– Non-lost opportunity limited to 40 aMW/yearNon-lost opportunity limited to 40 aMW/year– Ramp-up lost-opportunity to 85% penetration by 2025Ramp-up lost-opportunity to 85% penetration by 2025
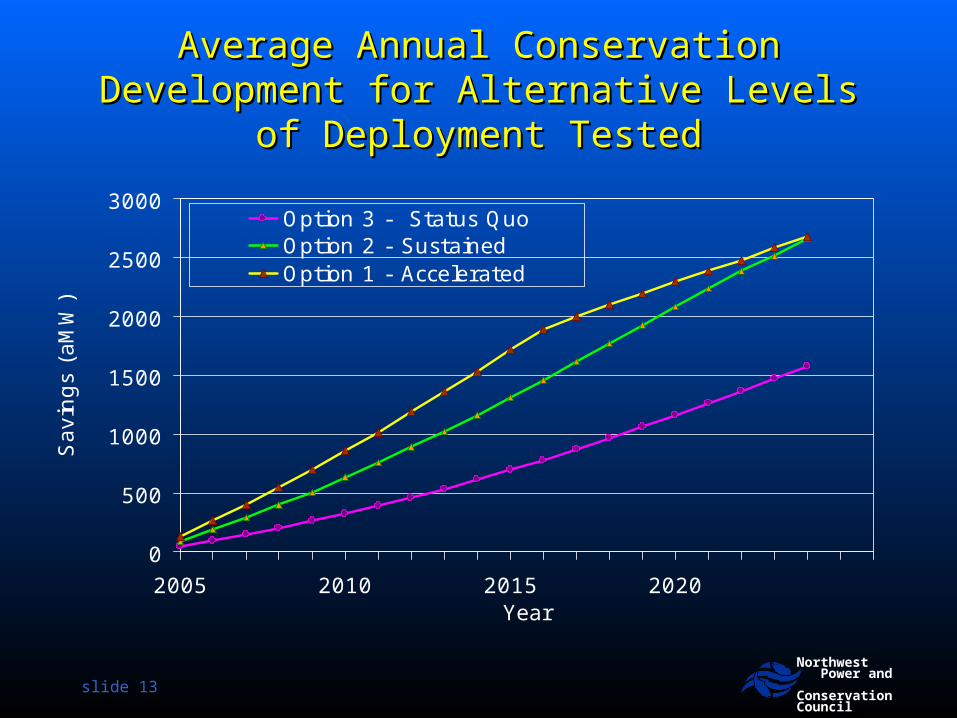
slide 13
Northwest Power and ConservationCouncil
Average Annual Conservation Average Annual Conservation Development for Alternative Levels of Development for Alternative Levels of
Deployment TestedDeployment Tested
0
500
1000
1500
2000
2500
3000
2005 2010 2015 2020Year
Savin
gs
(aM
W)
Option 3 - Status QuoOption 2 - SustainedOption 1 - Accelerated
slide 14
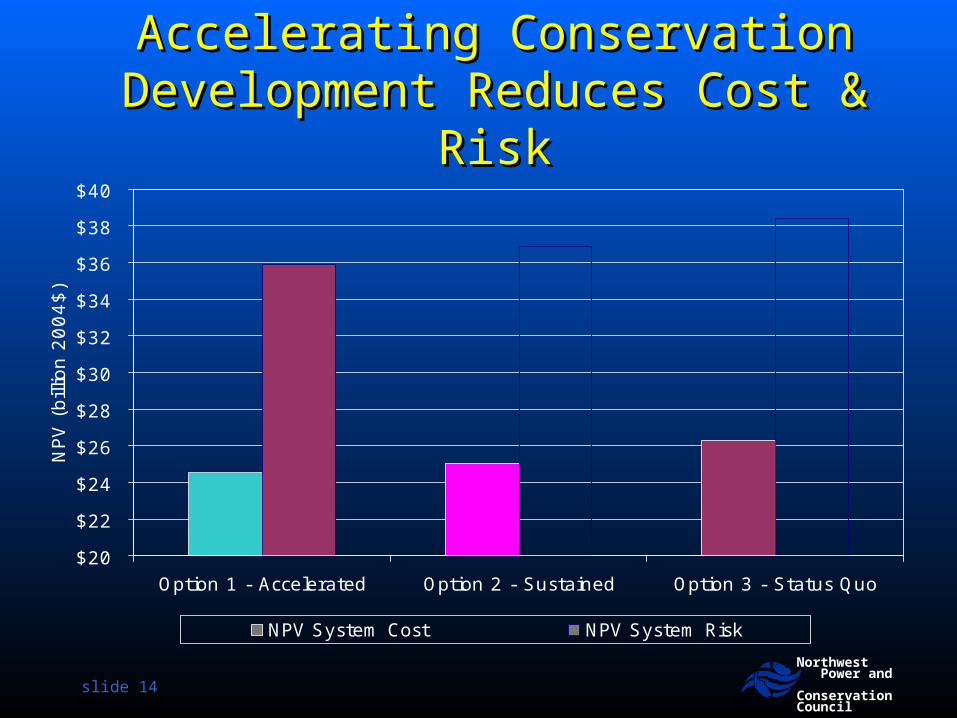
Northwest Power and ConservationCouncil
Accelerating Conservation Accelerating Conservation Development Reduces Cost & Development Reduces Cost &
RiskRisk
$20
$22
$24
$26
$28
$30
$32
$34
$36
$38
$40
Option 1 - Accelerated Option 2 - Sustained Option 3 - Status Quo
NPV
(bill
ion
20
04
$)
NPV System Cost NPV System Risk

slide 15
Northwest Power and ConservationCouncil
WECC Carbon Dioxide Emissions WECC Carbon Dioxide Emissions Reductions for Alternative Reductions for Alternative
Conservation TargetsConservation Targets
0
10
20
30
40
50
60
70
80
Mill
ion T
ons
over
20 y
ears
Option 1 -Accelerated
Option 2 -Sustained
Option 3 - StatusQuo

slide 16
Northwest Power and ConservationCouncil
Why Energy Efficiency Reduces NPV Why Energy Efficiency Reduces NPV System Cost and RiskSystem Cost and Risk
It’s A Cheap (avg. 2.4 cents/kWh TOTAL It’s A Cheap (avg. 2.4 cents/kWh TOTAL RESOURCE COST) Hedge Against Market RESOURCE COST) Hedge Against Market Price SpikesPrice Spikes
It has value even when market prices are It has value even when market prices are low low
It’s Not Subject to Fuel Price RiskIt’s Not Subject to Fuel Price Risk It’s Not Subject to Carbon Control RiskIt’s Not Subject to Carbon Control Risk It’s Significant Enough In Size to Delay It’s Significant Enough In Size to Delay
“build decisions” on generation“build decisions” on generation
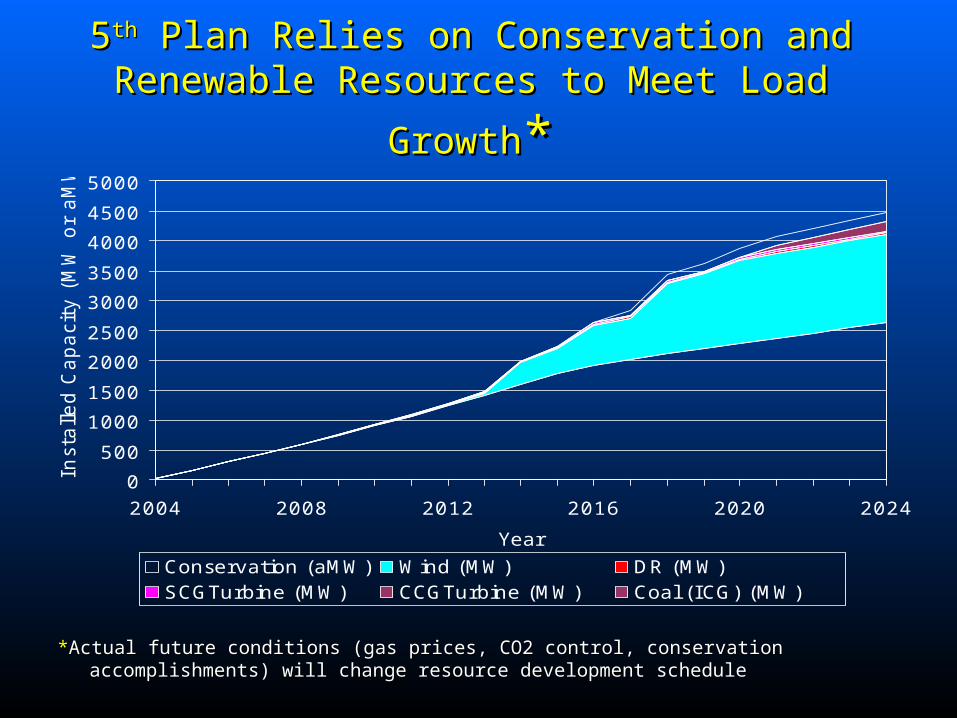
55thth Plan Relies on Conservation and Plan Relies on Conservation and
Renewable Resources to Meet Load GrowthRenewable Resources to Meet Load Growth**
0
500
1000
1500
2000
2500
3000
3500
4000
4500
5000
2004 2008 2012 2016 2020 2024
Year
Inst
alle
d C
apaci
ty (
MW
or
aM
W)
Conservation (aMW) Wind (MW) DR (MW)SCGTurbine (MW) CCGTurbine (MW) Coal (ICG) (MW)
**Actual future conditions (gas prices, CO2 control, conservation accomplishments) will Actual future conditions (gas prices, CO2 control, conservation accomplishments) will change resource development schedulechange resource development schedule
slide 18
Northwest Power and ConservationCouncil
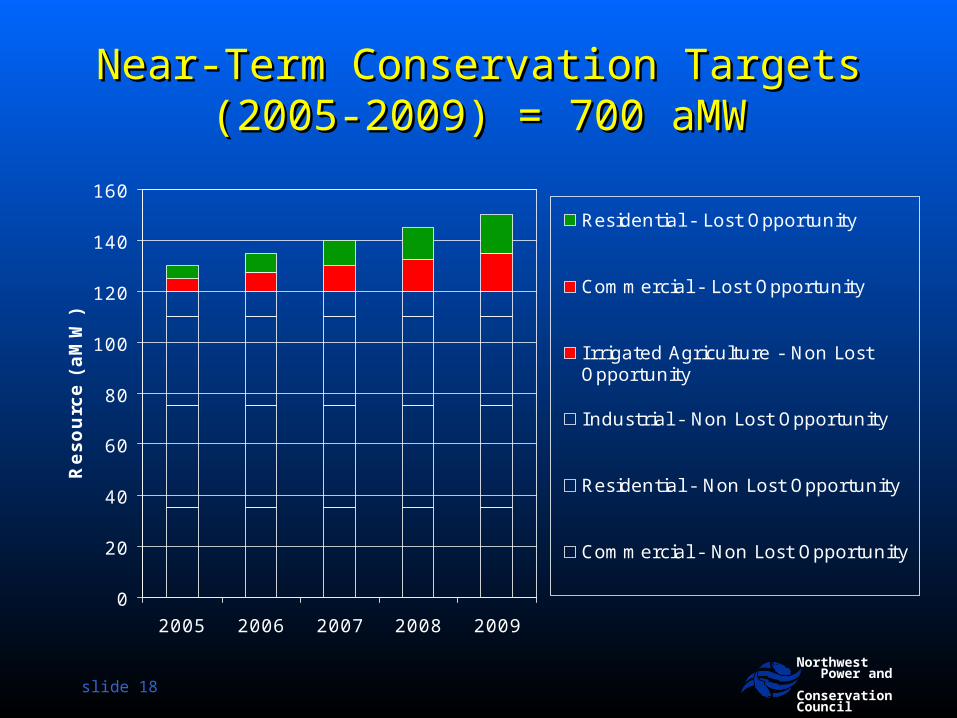
Near-Term Conservation Targets Near-Term Conservation Targets (2005-2009) = 700 aMW(2005-2009) = 700 aMW
0
20
40
60
80
100
120
140
160
2005 2006 2007 2008 2009
Resourc
e (
aM
W)
Residential - Lost Opportunity
Commercial - Lost Opportunity
I rrigated Agriculture - Non LostOpportunity
Industrial - Non Lost Opportunity
Residential - Non Lost Opportunity
Commercial - Non Lost Opportunity

slide 19
Northwest Power and ConservationCouncil
Plan Plan Conservation Action ItemsConservation Action Items
Ramp up “Lost Opportunity” conservationRamp up “Lost Opportunity” conservation» Goal => 85% penetration in 12 years Goal => 85% penetration in 12 years » 10 to 30 MWa/year 2005 through 200910 to 30 MWa/year 2005 through 2009
Accelerate the acquisition of “Non-Lost Accelerate the acquisition of “Non-Lost Opportunity” resourcesOpportunity” resources
» Return to acquisition levels of early 1990’sReturn to acquisition levels of early 1990’s» Target 120 MWa/year next five yearsTarget 120 MWa/year next five years
Employ a mix of mechanismsEmploy a mix of mechanisms» Local acquisition programs (utility, SBC Administrator & Local acquisition programs (utility, SBC Administrator &
BPA programs)BPA programs)» Regional acquisition programs and coordinationRegional acquisition programs and coordination» Market transformation venturesMarket transformation ventures

slide 20
Northwest Power and ConservationCouncil
Implementation Implementation ChallengesChallenges

slide 21
Northwest Power and ConservationCouncil
The Total Resource Acquisition Cost* of The Total Resource Acquisition Cost* of 55thth Plan’s Conservation Targets Plan’s Conservation Targets
2005 – 2009 = $1.64 billion2005 – 2009 = $1.64 billion
$0
$50
$100
$150
$200
$250
$300
$350
$400
2005 2006 2007 2008 2009
Tota
l R
eso
urc
e C
ost
s(M
illio
ns
20
00
$)
Residential - Lost Opportunity
Commercial - Lost Opportunity
I rrigated Agriculture - Non LostOpportunity
Industrial - Non Lost Opportunity
Residential - Non Lost Opportunity
Commercial - Non Lost Opportunity
*Incremental capital costs to install measure plus program administration costs estimated at 20% of capital.

slide 22
Northwest Power and ConservationCouncil
Meeting the Plan’s Efficiency Targets Will Meeting the Plan’s Efficiency Targets Will Likely Require Increased Regional InvestmentsLikely Require Increased Regional Investments
$0
$50
$100
$150
$200
$250
$300
$350
$400
$450
1991
1992
1993
1994
1995
1996
1997
1998
1999
2000
2001
2002
2003
2004
Avera
ge 1
991-
04
Avera
ge 2
001-
2004
2005
2009
Uti
lity
In
vestm
en
ts (
mil
lio
n 2
00
0$
)

slide 23
Northwest Power and ConservationCouncil
Although, The Share of Utility Although, The Share of Utility Revenues Required is ModestRevenues Required is Modest
0.0%
1.0%
2.0%
3.0%
4.0%
5.0%
6.0%
1991
1992
1993
1994
1995
1996
1997
1998
1999
2000
2001
2002
2003
2004
Avera
ge 1
991-
04
Avera
ge 2
001-
2004
2005
2009
Sh
are
of
Reta
il R
even
ues (
%)
Regional Average Revenues/kWh will need to increase by $0.000006/kWh

slide 24
Northwest Power and ConservationCouncil
Utility* Efficiency Acquisition Plans for 2005 Are Utility* Efficiency Acquisition Plans for 2005 Are Close to 5Close to 5thth Plan Targets Plan Targets
0
20
40
60
80
100
120
2005 5th Plan Target 2005 Utility Acquistion Plan
Con
serv
ati
on
Levels
(M
Wa)
*Targets for 15 Largest PNW Utilities. These utilities represent approximately 80% of regional load.

slide 25
Northwest Power and ConservationCouncil
Most IOU Efficiency Plans are Close Most IOU Efficiency Plans are Close to 5to 5thth Plan’s Targets Plan’s Targets
0
5
10
15
20
25
Pacifi
Corp
(OR,W
A,ID)
Puge
t Sou
nd E
nerg
y
Portland
Gen
eral
Idah
o Po
wer
Avist
a Util
ities
North
weste
rn E
nerg
y
Con
serv
ati
on
Levels
(M
Wa)
Plan Targets
Utility Plans

slide 26
Northwest Power and ConservationCouncil
However, Several Large Public Utility Efficiency However, Several Large Public Utility Efficiency
Plans Are Well Below 5Plans Are Well Below 5thth Plan Targets Plan Targets
0
1
2
3
4
5
6
7
8
9
10
Seattl
e City
Lig
ht
Snoho
mish
PUD
Taco
ma
Power
Cowlit
z PU
D
Clark
PUD
EWEB
Grant
PUD
Bento
n PU
D
Flat
head
REA
Con
serv
ati
on
Levels
(M
Wa)
Plan Targets
Utility Plans

slide 27
Northwest Power and ConservationCouncil
Summary – The PNWSummary – The PNW
Council and Recent Utility IRPs (PSE, Council and Recent Utility IRPs (PSE, Avista, Northwestern, Snohomish PUD) all Avista, Northwestern, Snohomish PUD) all found that accelerating energy efficiency found that accelerating energy efficiency acquisitions reduces projected system cost acquisitions reduces projected system cost and riskand risk
The Council’s 5The Council’s 5thth Plan Target is Plan Target is AchievableAchievable . . . but some major utilities are . . . but some major utilities are “behind the curve”“behind the curve”