The North American Approach to North-South Integration: Mexico, Canada, and the United States Under...
40
The North American Approach to North- South Integration: Mexico, Canada, and the United States Under NAFTA Colloque du Réseau Intégration Nord Sud (RINOS) INTÉGRATIONS RÉGIONALES ET STRATÉGIES DE DÉVELOPPEMENT : Les relations Nord-Sud dans l’Euromed, les Amériques et l’Asie Université du Québec à Montréal Conférence Spéciale 2 Juin 2005 Robert A. Blecker Professor of Economics American University Washington, DC
-
Upload
brendan-beasley -
Category
Documents
-
view
214 -
download
1
Transcript of The North American Approach to North-South Integration: Mexico, Canada, and the United States Under...

The North American Approach to North-South Integration:Mexico, Canada, and the United
States Under NAFTAColloque du Réseau Intégration Nord Sud (RINOS)
INTÉGRATIONS RÉGIONALES ET STRATÉGIES DE DÉVELOPPEMENT :Les relations Nord-Sud dans l’Euromed, les Amériques et l’Asie
Université du Québec à Montréal Conférence Spéciale
2 Juin 2005
Robert A. BleckerProfessor of Economics
American UniversityWashington, DC

Alternative Title:
“¡Pobre México!
¡Tan lejos de la Unión Europea, y tan cerca de los Estados Unidos!”

Distinguishing Characteristics ofNorth American Integration
1. Large and persistent development gap between Northern (US, Canada) and Southern (Mexico) economies in a FTA
2. Asymmetries in economic size and political power, US vs. Canada/Mexico
3. Mostly “dual bilateral” relations, Canada-US and Mexico-US; weak trilateral ties
4. Narrow institutional framework (NAFTA) does not cover important aspects of the integration process
5. Legal and institutional framework mostly ignores the development dimension and North-South issues

Sources: World Bank, World Development Indicators, on-line version, and
U.S. Department of Labor, Bureau of Labor Statistics, "International Comparisons of Hourly Compensation Costs for Production Workers in
Manufacturing, 2003" and "Supplementary Tables, 1975-2003," on-line at www.bls.gov/fls/home.htm.
Persistent Income Gaps in North America:
No Convergence of Mexico from 1993 to 2003 Mexico Canada United States
1993 2003 1993 2003 1993 2003
GDP (current US$ billions) 403.2 626.1 554.7 834.4 6,582.910,881.
6
GDP per capita (constant 1995 US$) 3,327 3,717 18,726 23,843 26,592 32,514
GNI per capita, Atlas method (current US$) 4,230 6,230 20,250 23,930 25,800 37,610
GNI per capita, PPP (current international $) 6,680 8,950 19,480 29,740 25,570 37,500
Hourly compensation of mfrg. workers, in US$ $2.40 $2.48 $16.97 $19.28 $16.28 $21.97
Mexico Canada United States
Percentages of U.S. Levels: 1993 2003 1993 2003 1993 2003
GDP (current US$ billions) 6.1% 5.8% 8.4% 7.7% 100.0% 100.0%
GDP per capita (constant 1995 US$) 12.5% 11.4% 70.4% 73.3% 100.0% 100.0%
GNI per capita, Atlas method (current US$) 16.4% 16.6% 78.5% 63.6% 100.0% 100.0%
GNI per capita, PPP (current international $) 26.1% 23.9% 76.2% 79.3% 100.0% 100.0%
Hourly compensation of mfrg. workers, in US$ 14.7% 11.3% 104.2% 87.8% 100.0% 100.0%

Dimensions of North American Economic Integration: Trade
• Trade Flows: the US accounts for:– nearly 90 percent of Mexico’s exports and over 80
percent of Canada’s exports– about 60 percent of Mexico’s imports and 70 percent
of Canada’s imports
• Canada and Mexico are the United States’ two largest trading partners, but together account for only 30 percent of US trade (exports + imports)
• Intra-NAFTA trade grew rapidly in the 1990s, but has grown more slowly since 2000– Rising imports from China and other Asian countries
have displaced intra-NAFTA trade since 2000

Source: U.S. Department of Commerce, Bureau of Economic Analysis, International Transactions Accounts, Release of March 16, 2005 <www.bea.gov>. Data for 2004 are preliminary.
U.S.-Canadian and U.S.-Mexican Trade in Goods:Grew Rapidly in 1990s, Slowed Down After 2000
-300
-200
-100
0
100
200
Bill
ions
of U
.S. D
olla
rs
Exports to Canada Imports from Canada Exports to Mexico Imports from Mexico

Dimensions of North American Economic Integration: Investment
• N.A. capital markets have been integrated through financial market liberalization and the liberalization of trade in financial services
• The US accounts for a majority of the FDI in Mexico and Canada– But other countries (European, Asian) also provide FDI inflows
• FDI inflows into Mexico have increased in financial services as well as in manufacturing
• Mexico succeeded in replacing “hot money” inflows with FDI after the 1994 crisis and NAFTA
• But FDI inflows into Mexico have diminished since 2000 – FDI inflows were surpassed by remittances in 2003-04

Mexican Net Financial Inflows, Direct Investment, and Remittances, 1990-2004
-12
-6
0
6
12
18
24
30
36
1990 1991 1992 1993 1994 1995 1996 1997 1998 1999 2000 2001 2002 2003 2004
Bill
ions
of
U.S
. D
olla
rs
Net Financial Inflows Foreign Direct Investment Remittances
NAFTA
Sources: International Monetary Fund, Banco de México.

Dimensions of North American Economic Integration: Migration
• Mexican emigration is driven by:– Rapid growth of the labor force (nearly 1 million
workers per year) – Inadequate domestic job creation – Lower wages (roughly 1/10 of US and Canada)
• An estimated 4-5 million Mexicans migrated to the United States in the 1990s– roughly half of them were illegal (“undocumented”)
• US efforts to enforce migration restrictions have not stopped migration, but have increased hardships for migrants—and have induced Mexicans who reach the US to stay

Dimensions of North American Economic Integration: Migration
continued
• An estimated 8% of all Mexican-born people live in the United States
• Existing networks of immigrants attract more migrants
• Mexican immigration in Canada is smaller but legalized through a guest worker program in agriculture
• By 2003-04, annual inflows of remittances from Mexicans abroad exceeded FDI inflows into Mexico– Remittances reached nearly $17 billion in 2004

Employment in Mexico Since NAFTA:Overview
• Overall, job creation in export-oriented manufactures and agriculture has been offset by job losses in domestic/import-competing manufactures and agriculture
• Most net job growth in Mexico has been in non-traded services and the “informal sector” in spite of NAFTA and export promotion efforts
• Trade liberalization has not solved Mexico’s employment problems

Employment in Mexico Since NAFTA:Details
• No single, comprehensive data source exists– We have to rely on partial and incomplete surveys, some of which have
changed over time (Polaski, others)• Maquiladoras:
– Increased by approx. 750,000 from 1993-2001– Then fell by 180,000 from 2001-2004– Net increase of 570,000 from 1993-2004 (more than doubled)– Decreasing female share (now just over half)
• Large non-maquiladora manufacturing firms:– Net decrease of about 100,000 (roughly 7%) from 1994-2004, but with
larger cyclical fluctuations up and down in-between• Agriculture:
– New survey shows decline of 730,000 from 1998-2003 – Old survey showed decline of 370,000 from 1991-1998 – Census data show an 8 percentage point drop in the share of agriculture
in male employment, little change in female share (Hanson)• Evidence of skill upgrading in the most dynamic export industries
(Hanson, Verhoogen)

Why NAFTA Didn’t Create More Jobs in Mexico: (1) Slow GDP growth
• Growth rates have been lower since trade liberalization than in the import substitution era:– Average for 1951-1980, 6.4 percent per year– Post-GATT (1987-2004), 3.0 "– Post-NAFTA (1994-2004), 2.8 "– Post-peso crisis (1996-2004), 3.7 "
• Mexico needs a higher GDP growth rate (at least 6 percent) to keep up with productivity growth, raise real wages, and promote convergence to US-Canadian income levels and real wages

Macro Factors that Have Affected Mexican Employment
• Mexican growth is positively correlated with US growth since 1996
• US business cycles: late 1990s boom, 2001 recession, 2002-03 slow recovery
• Exchange rate fluctuations– Peso or “tequila” crisis of 1994-95– Subsequent real appreciation
• Restrictive macro policies designed to prevent another financial crisis since 1995– under both Zedillo and Fox
• Trade surplus with US is outweighed by a larger deficit with rest-of-world

Annual Growth Rates of Real GDP,United States, Canada, and Mexico, 1970-2004
-8
-4
0
4
8
12
1970 1972 1974 1976 1978 1980 1982 1984 1986 1988 1990 1992 1994 1996 1998 2000 2002 2004
Perc
ent
USA Canada Mexico
U.S.-Canada FTA NAFTA
Source: International Monetary Fund, World Economic Outlook, on-line databases.

Multilateral Real Effective Exchange Rate Indexes: USA, Canada, and Mexico, Monthly January 1990 - December 2004
60
80
100
120
140
160
180
JAN1990
JAN1991
JAN1992
JAN1993
JAN1994
JAN1995
JAN1996
JAN1997
JAN1998
JAN1999
JAN2000
JAN2001
JAN2002
JAN2003
JAN2004
Inde
x, 1
990
= 1
00
USACanadaMexico
Sources: Federal Reserve (USA), International Monetary Fund (Canada), Banco de Mexico (Mexico).
Why NAFTA Didn’t Create More Jobs: (2) Rapid productivity growth
• Rapid productivity growth allows output to increase with proportionally smaller increases in employment
• Features of Mexican productivity growth:– Trade liberalization destroys jobs in import-competing industries
as less efficient plants shut down and surviving plants increase efficiency to compete (similar to Canada – see Trefler)
– Significant inter-industry reallocation to export sectors with higher (and faster growing) productivity (Lopez-Cordova)
– Productivity has increased in both maquiladora and non-maquiladora manufacturing plants
• Quality upgrading in non-maquiladora exports emphasizes activities with higher capital intensity, higher productivity, and greater skill requirements (Verhoogen)

Why NAFTA Didn’t Create More Jobs:(3) Exports not linked to rest of economy
• Value added in Mexican manufacturing has not kept up with the growth of exports (UNCTAD)
• Export activities are increasingly integrated into regional (North American) and global production chains, but not well integrated into the Mexican economy
• Exports accounted for 17.7% of output but only 10.6% of employment in 1995-2000; less than one indirect job is created for each direct export job (Ruiz-Napoles)
• Maquiladora imports account for 76% of maquiladora exports and 36% of total exports
• MNC exporters have higher import coefficients than domestic firms
• Export growth is not generating adequate “backward linkages”

Mexican Exports of Goods, 1991-2004Corrected for Maquiladora Imports
0
25
50
75
100
125
150
175
200
1991 1992 1993 1994 1995 1996 1997 1998 1999 2000 2001 2002 2003 2004
Billi
ons
of U
.S. D
olla
rs
Total Exports True Exports (Adj. for Maq. Imports) Non-Maquiladora Exports
Maquiladora imports

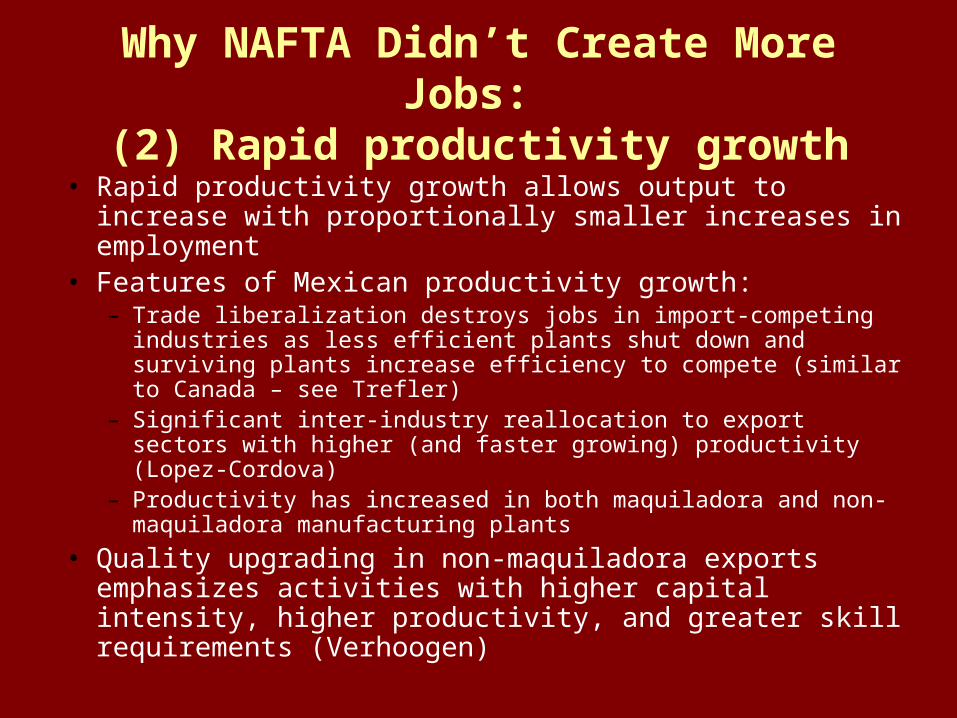
Why NAFTA Didn’t Create More Jobs: (4) Growing competition from China
• Mexico is a victim of the “fallacy of composition” in the export-led growth paradigm. Especially:
• China displaced Mexico as the second largest source of US goods imports (after Canada) in 2003-04.
• China has kept its currency undervalued while Mexico has let the peso appreciate (in real terms) to hold down inflation
• China and other Asian countries are also increasing their shares of Mexico’s imports at the expense of imports from the US (and at the expense of Mexican domestic production)– American “big box” retailers (Wal-Mart etc.) encourage
consumption of cheap consumer goods from outside N.A.
U.S. Imports of Goods from Mexico and China, 1980-2004(p)
0
25
50
75
100
125
150
175
200
Billi
ons
of U
.S. D
olla
rs
Mexico China
NAFTA

More Unequal Income Distribution• Overall, real wages in manufacturing still had not
recovered to their 1994 level by 2004 in spite of rapid productivity growth (in both maquiladoras and non-maquiladoras)
• Wages for more “skilled” (educated) workers have risen relative to less “skilled” (educated) workers in Mexico as well as the US (Hanson)
• Real wages have fallen more in the center/south compared with the border/north regions (increasing regional disparities) (Hanson)
• Adjustment costs have been severe in both expanding and contracting regions
• Less skilled workers have to compete with lower-wage workers in other developing countries, including China

Real Hourly Wages and Productivity for All Persons in Mexican Manufacturing, 1994-2004
60
80
100
120
140
160
1994 1995 1996 1997 1998 1999 2000 2001 2002 2003 2004
Inde
xes,
199
4 =
100 Output per hour
Real hourly wage
Source: INEGI official data series, not including maquiladoras.

Political and Institutional Framework: NAFTA
• North American “Free Trade” Agreement (NAFTA)– Not completely free trade, many exceptions– Includes strong protections for property rights and liberalization
of capital flows– No significant institutions or governance mechanisms (except for
dispute resolution tribunals)
• Side Agreements– Labor and Environmental Commissions: small budgets, no
enforcement powers– N.A. Development Bank: very limited mandate and funding for
projects in the Mexican-US border region
• NAFTA restricts industrial development policies and government regulation of foreign investment– “Expropriation” clause used to overturn social and environmental
regulations at state/provincial levels

What’s NOT Included in NAFTA:
• No common external tariffs or harmonization of other trade barriers– Not a customs union
• No coordination of monetary, fiscal, and exchange rate policies– No common currency/monetary union
• No significant development assistance for Mexico (infrastructure, education, etc.)– No parallel to the EU’s regional and social cohesion funds– Exception: the NADBank in border areas only (very limited funds
and mandate)• No provisions for free migration, labor mobility, or rights
of migrant workers– Except for highly educated professional and technical workers

What’s NOT Included in NAFTA: continued
• No harmonization of social standards and policies– Labor rights/standards, environmental protection, consumer
health & safety, occupational safety & health, etc. are all left up to individual countries
– Some progress in phytosanitary standards and a few other technical areas
• No integration of security, borders, customs, etc. – Businesses complain this creates barriers to trade (increases
costs of border crossings)– Politically difficult because of US post-9/11 security concerns
and desire to limit Mexican immigration• No continental governance mechanisms
– Few international (trinational) institutions– Nothing like the European Commission, European Parliament,
etc.

Political Obstacles to Further North American Integration
• Asymmetrical economic weight and power relations– US has greater bargaining leverage, imposes
its interests– US sees itself as a global power, tends to
ignore Canada and Mexico – Intra-N.A. relations are relatively more
important for Canada and Mexico than for US– Canadians and Mexicans resent/fear US
domination

Political Obstacles to Further North American Integration
• Lack of North American identity or consciousness– Citizens identify with their individual nationalities and
regional/ethnic groups – Governments often prefer to address issues on a
bilateral basis, not trilaterally– Very different political cultures; no sense of shared
history
• Deep political/partisan divisions within each country– George Bush’s unilateralist foreign policy has
lessened Canadian and Mexican interest in deeper ties with the US
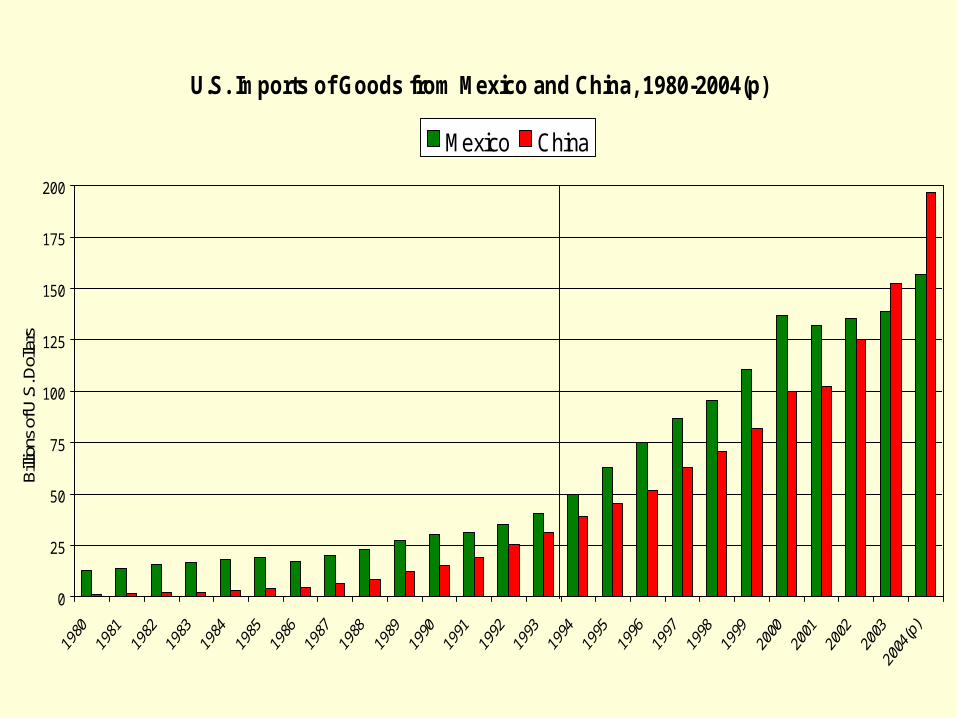
Political Obstacles to Further North American Integration
• Free-market views enshrined in NAFTA (“ideological lock-in”)– Lasting influence of Mulroney/Salinas/Bush
administrations– Ideological belief in relying on markets (“trade not
aid”)– Resistance to public policy solutions to development
problems
• Official integration agenda is limited to trade and investment issues (business perspectives dominate)– Now augmented by US “security” concerns

“NAFTA Plus”: Expanding the Institutional Framework
• Certain business interests, governmental actors, political activists (NGOs), international agencies, and intellectual elites are promoting various types of additional trilateral integration efforts– Proposals vary according to interests and ideologies
• Various proposals include:– customs union– monetary union– labor rights/environmental standards– migration reform– framework for intergovernmental policy coordination– development assistance funds
• For example:

Independent Task Force Report:“Building a North American Community”
(May 2005)
• Sponsored (but not endorsed) by – US Council on Foreign Relations– Consejo Mexicano de Asuntos Internacionales– Canadian Council of Chief Executives
• Members consisted of ex-government officials, corporate & financial leaders, think-tank scholars, academic experts, etc. – Mostly center-right leaning with a few exceptions
• Proposes to create a “North American security and economic community” by 2010– Much less ambitious than the EU– Less “bureaucracy” and institutions compared with EU

Caveats:• These proposals are presented as an important
example, for information and discussion only• I do not endorse all of these proposals, although
I think some have merit• The report contains the task force’s majority or
consensus views• The task force also had many dissenting views
from various perspectives (left/right, national)• Warning: this sort of elite opinion can be very
influential!

Specific Recommendations of Task Force for N.A. Community:
• Security issues:– Common security perimeter and harmonized
border policies (emphasis on anti-terrorism)– N.A. border pass for expedited passage of
individuals with security clearances– Move toward freer flows of people in the long
run (deliberately vague what this means)– Military and intelligence cooperation– This is a reaction to post-9/11 US political/
military concerns, but also linked to trade and migration issues

Specific Recommendations of Task Force for N.A. Community:
continued
• Economic development:– Mexico to rely primarily on domestic reforms and
initiatives– US and Canada to fund a “North American
Investment Fund” for Mexican development• Focused on infrastructure and technical education to attract
private capital• Conditioned on Mexican reforms and financial contributions
– Enhanced capacity for the NADBank– Further opening of the energy sector especially in
Mexico • But no commitment to privatization of PEMEX
– Emissions controls and conservation efforts (weak exhortations)
Specific Recommendations of Task Force for N.A. Community:
continued
• Deeper economic integration efforts– Common external tariffs on individual goods (but not a
complete customs union?)– Review NAFTA exclusions– Permanent N.A. tribunal for dispute resolution– Joint approach to unfair trade practices (very vague)– Trinational competition (anti-trust) policies– Greater harmonization of domestic regulations– Increased labor mobility, including temporary migrant
worker programs, eventual North American preferences in employment, full labor mobility between US and Canada (but delayed with Mexico)
– Greater educational cooperation

Specific Recommendations of Task Force for N.A. Community:
continued
• Political framework– Regular trinational summits and intergovernmental
consultation– A permanent North American Advisory Council (with
members appointed by the 3 governments)– No politically representative or democratic bodies
(e.g., no elected N.A. parliament or congress)
• All of this seems to represent a consensus view of what is considered politically feasible in North America in the near future (post-Bush and Fox?)

Conclusions• The official N.A. integration process
(NAFTA) has largely ignored North-South issues, lacks a developmental agenda– Also neglects labor migration—or allows it to
be regulated by unilateral US border policies– Undemocratic process largely geared to
business interests and US priorities
• There has been no convergence of Mexico with the US and Canada in the 11 years since NAFTA went into effect– Some indicators show a slight divergence

Conclusions (continued)• Limited gains to Mexico in trade and FDI have
not fostered rapid enough growth to solve the country’s employment problem– Both structural obstacles and macroeconomic
constraints have impeded rapid growth– Result is continued out-migration and increased
reliance on remittances• Mexican society is also becoming more unequal
– There is a growing North-South divide and a rising “skill premium” within Mexico
– Sectors, regions, and interests positioned to benefit from the global/regional economy have prospered (relatively) while other parts of the domestic economy have suffered dislocations and declines

Conclusions (continued)• North America is sufficiently integrated that regional
cooperation is essential to solving continental problems• Yet political obstacles have prevented a European-style
approach to promoting convergence of less-developed regions
• Mexico does need more domestic reforms (strengthen democracy, rule of law, transparency, justice system, anti-corruption efforts)
• Global developments (e.g., WTO, China, other FTAs) are undermining Mexico’s special preferences in the US market and US preeminence in Mexico
• Yet NAFTA commitments restrict Mexican policy makers’ ability to manage trade and investment in the national interest

The Road Forward:NAFTA Plus What?
• Status Quo: free trade and investment, no social integration or development aid
• Deeper Economic Integration: improve borders and infrastructure, move toward a customs union, common market, and/or monetary union
• Social NAFTA: migration reform, development assistance, labor/environmental cooperation
• US Strategic Interests: energy, security• A North American political community
– what kind of community, and whose interests will be served?