The Nordic Covered Bond Handbook (2016-17) - Danske...
100
www.danskeresearch.com Investment Research 6 September 2016 Nordic Covered Bond Handbook The handbook of the Nordic covered bond markets and issuers Markets Senior Analyst Lukas Platzer +45 45 12 84 30 [email protected] This document is intended for institutional investors and is not subject to all the independence and disclosure standards applicable to debt research reports prepared for retail investors. Important disclosures and certif ications are contained from page 97 of this report. Senior Analyst Sverre Holbek +45 45 14 88 82 [email protected]
Transcript of The Nordic Covered Bond Handbook (2016-17) - Danske...

www.danskeresearch.com
Investment Research
6 September 2016
Nordic Covered Bond HandbookThe handbook of the Nordic covered bond markets and issuers
Markets
Senior AnalystLukas Platzer+45 45 12 84 [email protected]
This document is intended for institutional investors and is not subject to all the independence and disclosure standards applicable to debt research reports prepared for retail investors.
Important disclosures and certifications are contained from page 97 of this report.
Senior AnalystSverre Holbek+45 45 14 88 [email protected]

Important disclosures and certifications are contained from page 97 of this report. www.danskeresearch.com
Investment Research — General Market Conditions
Welcome to the 12th edition of the Nordic Covered Bond Handbook from the Covered Bond
Research team at Danske Bank Markets.
This publication is intended to act as a quick reference guide to the Nordic covered bond
markets, providing an overview of covered bond issuers in Denmark, Finland, Norway and
Sweden. Further, we provide an overview of the legislative framework in each of the four
markets, as well as updates on housing market developments and the macroeconomic backdrop.
Table 1. Issuers included in this edition
Denmark Finland Norway Sweden
BRFkredit Aktia Bank plc DnB BK Landshypotek Danske Bank Bank of Åland Eika BK LF Hypotek DLR Kredit Danske Bank plc Nordea EK Nordea Hypotek Nordea Kredit Mortg. Society of Finl. SpareBank 1 BK SCBC/SBAB Nykredit/Totalkredit Nordea Finland Sparebanken Sør BK SEB Realkredit Danmark OP MB Sparebanken Vest BK Stadshypotek
SR-Boligkreditt AS Swedbank Hypotek Storeband KF
Most covered bond issuers are subsidiaries of larger, universal banks. The specialist banking
principle is applied in Norway and partly in Denmark, while there is no such requirement in
Sweden and Finland. Parent banks are covered only briefly in this handbook.
Issuer profiles of Danish specialist mortgage banks are included in this handbook, drawing on
the Danish Covered Bond Handbook. We refer readers to the latter for an in-depth description
of this unique market.
6 September 2016
Senior Analyst Lukas Platzer +45 45 12 84 30 [email protected]
Senior Analyst Sverre Holbek +45 45 14 88 82 [email protected]
Nordic Covered Bond
Handbook
12th edition

2 | 6 September 2016 www.danskeresearch.com
No
rdic C
overed
Bo
nd
Ha
nd
bo
ok
Nordic Covered Bond Handbook
3 | 6 September 2016 www.danskeresearch.com
No
rdic C
overed
Bo
nd
Ha
nd
bo
ok
Nordic Covered Bond Handbook
Contents
Introduction ..................................................................................................................... 5
Danish Covered Bonds ............................................................................................. 9
BRFkredit ............................................................................................................................................................................ 16
Danske Bank ..................................................................................................................................................................... 18
DLR Kredit .......................................................................................................................................................................... 20
Nordea Kredit .................................................................................................................................................................. 22
Nykredit/Totalkredit .................................................................................................................................................... 24
Realkredit Danmark..................................................................................................................................................... 26
Finnish Covered Bonds ......................................................................................... 29
Aktia Bank plc .................................................................................................................................................................. 36
Bank of Åland plc ........................................................................................................................................................... 38
Danske Bank plc ............................................................................................................................................................. 40
Mortgage Society of Finland .................................................................................................................................. 42
Nordea Bank Finland ................................................................................................................................................... 44
OP Mortgage Bank ....................................................................................................................................................... 46
Norwegian Covered Bonds ................................................................................. 49
DNB Boligkreditt ............................................................................................................................................................ 56
Eika Boligkreditt ............................................................................................................................................................. 58
Nordea Eiendomskreditt .......................................................................................................................................... 60
SpareBank 1 Boligkreditt ........................................................................................................................................ 62
Sparebanken Sør BK AS .......................................................................................................................................... 64
Sparebanken Vest Boligkreditt ............................................................................................................................ 66
SR-Boligkreditt AS ........................................................................................................................................................ 68
Storebrand Boligkreditt ............................................................................................................................................ 70
Swedish Covered Bonds ...................................................................................... 73
Landshypotek Bank AB ............................................................................................................................................. 78
LF Hypotek.......................................................................................................................................................................... 80
Nordea Hypotek ............................................................................................................................................................. 82
SCBC (SBAB Bank) ...................................................................................................................................................... 84
SEB .......................................................................................................................................................................................... 86
Stadshypotek AB ........................................................................................................................................................... 88
Swedbank Hypotek ....................................................................................................................................................... 90
Covered Bonds Regulatory Framework and Treatment .................. 93

4 | 6 September 2016 www.danskeresearch.com
No
rdic C
overed
Bo
nd
Ha
nd
bo
ok
Nordic Covered Bond Handbook
5 | 6 September 2016 www.danskeresearch.com
Intro
du
ction
Introduction
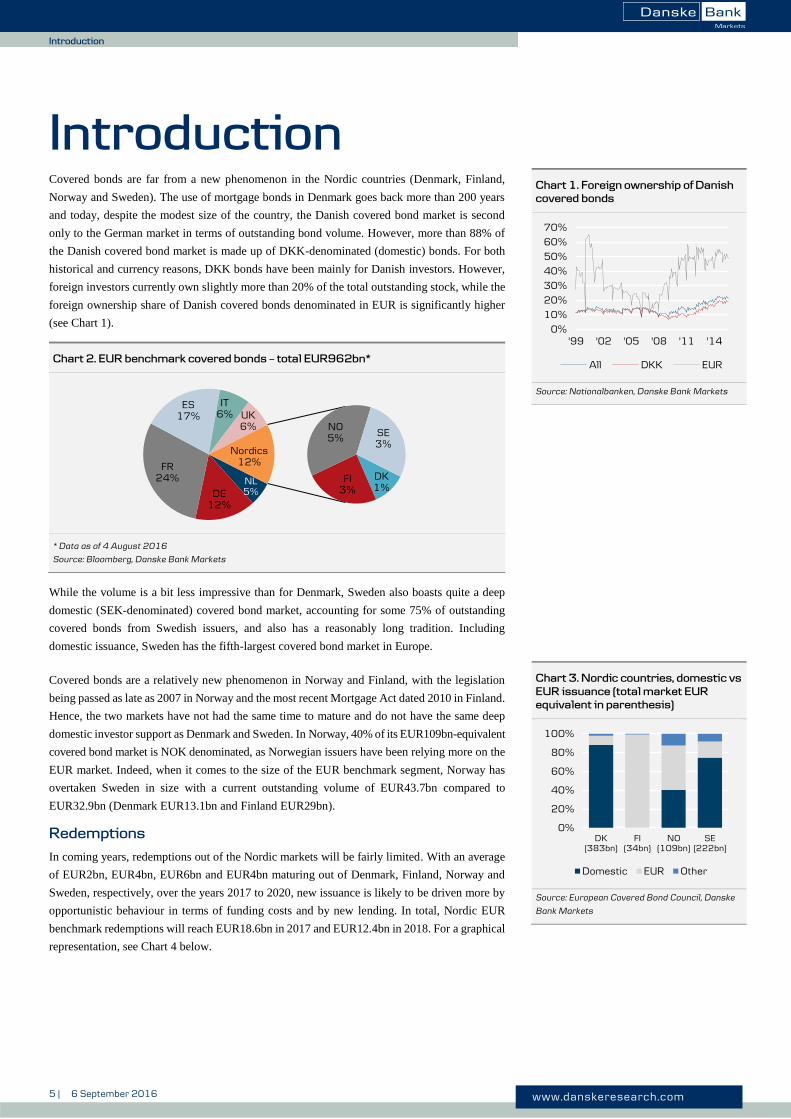
Introduction Covered bonds are far from a new phenomenon in the Nordic countries (Denmark, Finland,
Norway and Sweden). The use of mortgage bonds in Denmark goes back more than 200 years
and today, despite the modest size of the country, the Danish covered bond market is second
only to the German market in terms of outstanding bond volume. However, more than 88% of
the Danish covered bond market is made up of DKK-denominated (domestic) bonds. For both
historical and currency reasons, DKK bonds have been mainly for Danish investors. However,
foreign investors currently own slightly more than 20% of the total outstanding stock, while the
foreign ownership share of Danish covered bonds denominated in EUR is significantly higher
(see Chart 1).
Chart 2. EUR benchmark covered bonds – total EUR962bn*
* Data as of 4 August 2016
Source: Bloomberg, Danske Bank Markets
While the volume is a bit less impressive than for Denmark, Sweden also boasts quite a deep
domestic (SEK-denominated) covered bond market, accounting for some 75% of outstanding
covered bonds from Swedish issuers, and also has a reasonably long tradition. Including
domestic issuance, Sweden has the fifth-largest covered bond market in Europe.
Covered bonds are a relatively new phenomenon in Norway and Finland, with the legislation
being passed as late as 2007 in Norway and the most recent Mortgage Act dated 2010 in Finland.
Hence, the two markets have not had the same time to mature and do not have the same deep
domestic investor support as Denmark and Sweden. In Norway, 40% of its EUR109bn-equivalent
covered bond market is NOK denominated, as Norwegian issuers have been relying more on the
EUR market. Indeed, when it comes to the size of the EUR benchmark segment, Norway has
overtaken Sweden in size with a current outstanding volume of EUR43.7bn compared to
EUR32.9bn (Denmark EUR13.1bn and Finland EUR29bn).
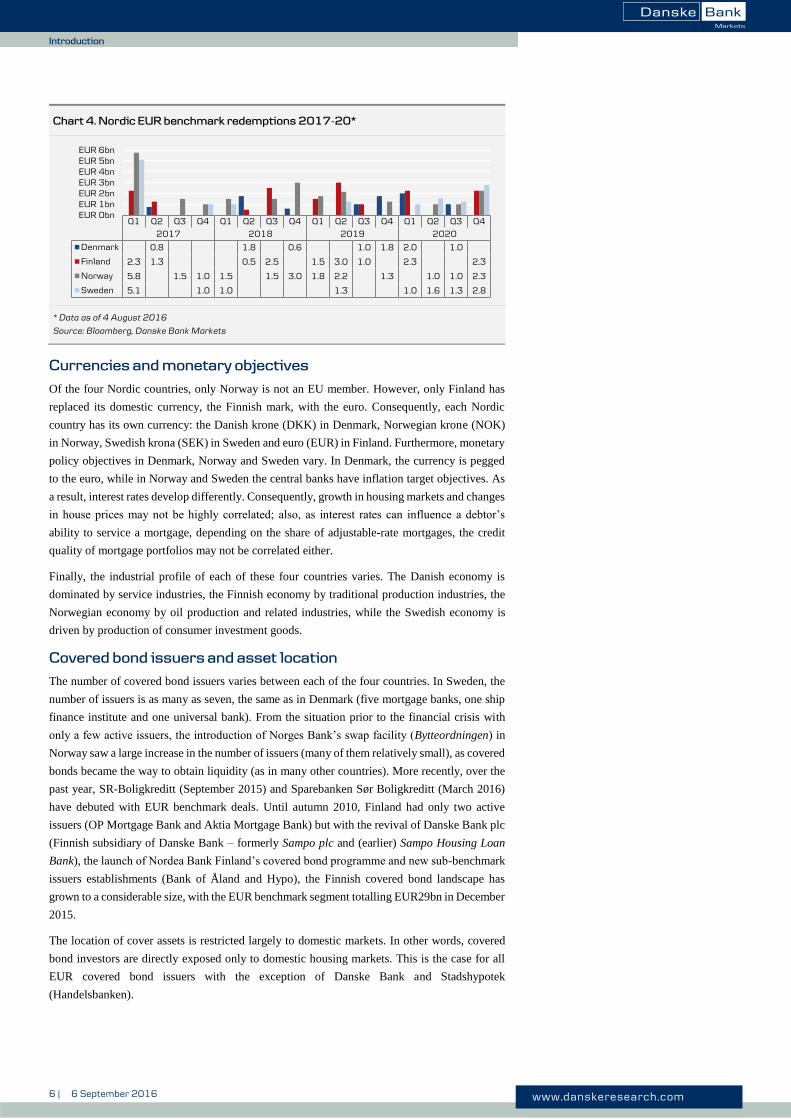
Redemptions
In coming years, redemptions out of the Nordic markets will be fairly limited. With an average
of EUR2bn, EUR4bn, EUR6bn and EUR4bn maturing out of Denmark, Finland, Norway and
Sweden, respectively, over the years 2017 to 2020, new issuance is likely to be driven more by
opportunistic behaviour in terms of funding costs and by new lending. In total, Nordic EUR
benchmark redemptions will reach EUR18.6bn in 2017 and EUR12.4bn in 2018. For a graphical
representation, see Chart 4 below.
NL5%DE
12%
FR24%
ES17%
IT6% UK
6%
DK1%
FI3%
NO5% SE
3%Nordics
12%
Chart 1. Foreign ownership of Danish
covered bonds
Source: Nationalbanken, Danske Bank Markets
Chart 3. Nordic countries, domestic vs
EUR issuance (total market EUR
equivalent in parenthesis)
Source: European Covered Bond Council, Danske
Bank Markets
0%
10%
20%
30%
40%
50%
60%
70%
'99 '02 '05 '08 '11 '14
All DKK EUR
0%
20%
40%
60%
80%
100%
DK(383bn)
FI(34bn)
NO(109bn)
SE(222bn)
Domestic EUR Other
6 | 6 September 2016 www.danskeresearch.com
Intro
du
ction
Introduction
Chart 4. Nordic EUR benchmark redemptions 2017-20*
* Data as of 4 August 2016
Source: Bloomberg, Danske Bank Markets
Currencies and monetary objectives
Of the four Nordic countries, only Norway is not an EU member. However, only Finland has
replaced its domestic currency, the Finnish mark, with the euro. Consequently, each Nordic
country has its own currency: the Danish krone (DKK) in Denmark, Norwegian krone (NOK)
in Norway, Swedish krona (SEK) in Sweden and euro (EUR) in Finland. Furthermore, monetary
policy objectives in Denmark, Norway and Sweden vary. In Denmark, the currency is pegged
to the euro, while in Norway and Sweden the central banks have inflation target objectives. As
a result, interest rates develop differently. Consequently, growth in housing markets and changes
in house prices may not be highly correlated; also, as interest rates can influence a debtor’s
ability to service a mortgage, depending on the share of adjustable-rate mortgages, the credit
quality of mortgage portfolios may not be correlated either.
Finally, the industrial profile of each of these four countries varies. The Danish economy is
dominated by service industries, the Finnish economy by traditional production industries, the
Norwegian economy by oil production and related industries, while the Swedish economy is
driven by production of consumer investment goods.
Covered bond issuers and asset location
The number of covered bond issuers varies between each of the four countries. In Sweden, the
number of issuers is as many as seven, the same as in Denmark (five mortgage banks, one ship
finance institute and one universal bank). From the situation prior to the financial crisis with
only a few active issuers, the introduction of Norges Bank’s swap facility (Bytteordningen) in
Norway saw a large increase in the number of issuers (many of them relatively small), as covered
bonds became the way to obtain liquidity (as in many other countries). More recently, over the
past year, SR-Boligkreditt (September 2015) and Sparebanken Sør Boligkreditt (March 2016)
have debuted with EUR benchmark deals. Until autumn 2010, Finland had only two active
issuers (OP Mortgage Bank and Aktia Mortgage Bank) but with the revival of Danske Bank plc
(Finnish subsidiary of Danske Bank – formerly Sampo plc and (earlier) Sampo Housing Loan
Bank), the launch of Nordea Bank Finland’s covered bond programme and new sub-benchmark
issuers establishments (Bank of Åland and Hypo), the Finnish covered bond landscape has
grown to a considerable size, with the EUR benchmark segment totalling EUR29bn in December
2015.
The location of cover assets is restricted largely to domestic markets. In other words, covered
bond investors are directly exposed only to domestic housing markets. This is the case for all
EUR covered bond issuers with the exception of Danske Bank and Stadshypotek
(Handelsbanken).
Q1 Q2 Q3 Q4 Q1 Q2 Q3 Q4 Q1 Q2 Q3 Q4 Q1 Q2 Q3 Q4
2017 2018 2019 2020
Denmark 0.8 1.8 0.6 1.0 1.8 2.0 1.0
Finland 2.3 1.3 0.5 2.5 1.5 3.0 1.0 2.3 2.3
Norway 5.8 1.5 1.0 1.5 1.5 3.0 1.8 2.2 1.3 1.0 1.0 2.3
Sweden 5.1 1.0 1.0 1.3 1.0 1.6 1.3 2.8
EUR 0bnEUR 1bnEUR 2bnEUR 3bnEUR 4bnEUR 5bnEUR 6bn

7 | 6 September 2016 www.danskeresearch.com
Intro
du
ction
Introduction
Danske Bank includes two non-domestic cover pools in its covered bond programme. The
international cover pool (I) can comprise mortgages from all countries other than Denmark in
which the bank operates. Currently, only mortgages from Norway and Sweden are included in
this pool. In 2010, Danske Bank also launched a combined cover pool – Cover Pool C – currently
containing both residential and commercial mortgages from Norway and Sweden. However,
Danske Bank is in the process of restructuring its covered bond programmes – please see issuer
profile for details.
In late 2011, Stadshypotek added a second cover pool to its covered bond programme. While
the original cover pool remains solely Swedish in its asset composition, the new cover pool
comprises solely Norwegian assets and will be used to obtain NOK funding. However, the
Norwegian pool is very small relative to the Swedish pool, making up only NOK29bn compared
with the SEK641bn Swedish pool (as of June 2016). Furthermore, in 2016, Stadshypotek
announced that it would establish a third cover pool consisting entirely of Finnish residential
collateral.
Nordic housing markets
The large majority of collateral backing Nordic covered bonds is residential mortgages.
Regardless of the unique features of covered bonds, collateral is ring-fenced with the investor
enjoying a dual recourse: firstly to the issuer and secondly to the collateral pool.
Ultimately, regulatory frameworks and housing traditions in the Nordic countries supporting the
credit quality of cover pools become at least as important as specific covered bond acts. In the
(theoretical) case of default by the homeowner as well as the covered bond issuer, payments to
bondholders depend on foreclosure procedures in the country in which the collateral is located.
Based on data from the European Banking Industry Committee, the average duration for the
entire foreclosure procedure in European countries is six to 12 months, although in Italy the
average duration is, exceptionally, five to seven years. As the following table shows, foreclosure
proceedings in the Nordic countries can be carried out relatively quickly compared with in other
European countries.
Table 2. Foreclosure period in housing markets
Finland Sweden Denmark Spain Germany France
3 months 6 months 6 months 9 months 12 months 25 months
Source: European Banking Industry Committee
Finally, should the foreclosure price on a property prove insufficient to cover the outstanding
mortgage debt and additional costs, the mortgage provider has a claim on the borrower. In other
words, borrowers are personally liable for their mortgage loans.
Nordic authorities minding their housing markets
In general, with the exception of Denmark, the Nordic housing markets have all fared fairly well
over the course of the financial crisis. In order to maintain stability, the financial authorities in
the Nordic countries have adopted several measures over the past few years.
8 | 6 September 2016 www.danskeresearch.com
Intro
du
ction
Introduction
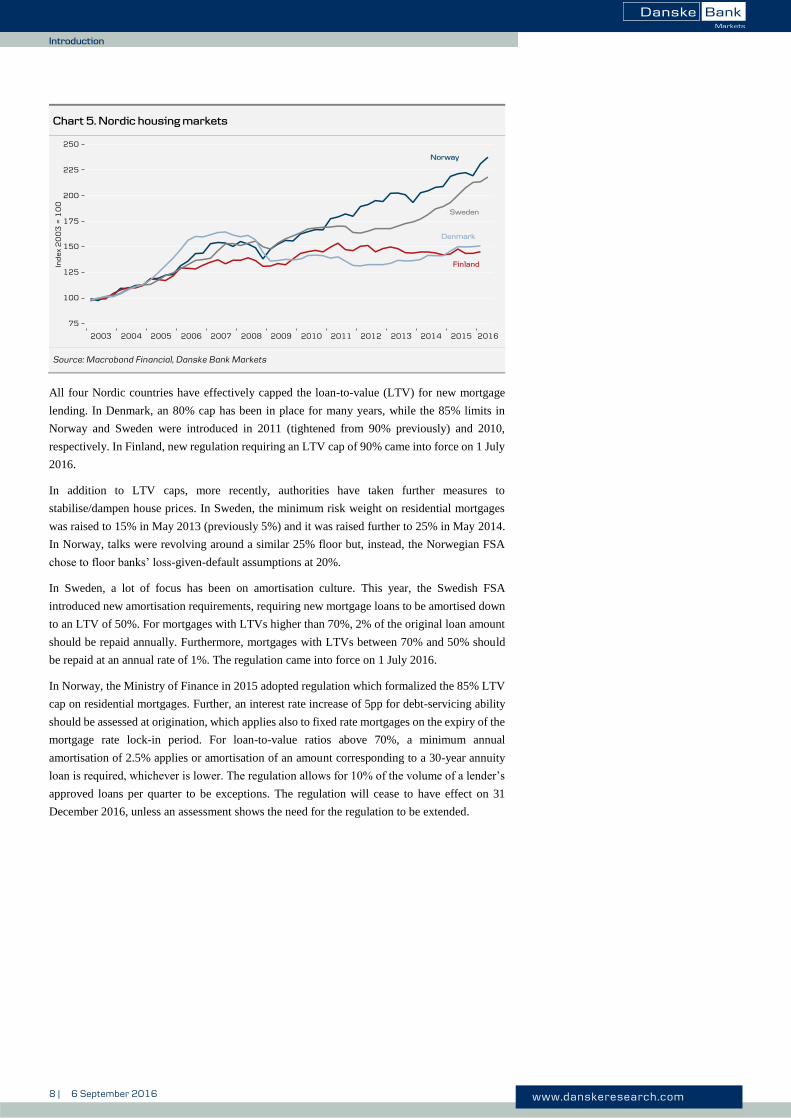
Chart 5. Nordic housing markets
Source: Macrobond Financial, Danske Bank Markets
All four Nordic countries have effectively capped the loan-to-value (LTV) for new mortgage
lending. In Denmark, an 80% cap has been in place for many years, while the 85% limits in
Norway and Sweden were introduced in 2011 (tightened from 90% previously) and 2010,
respectively. In Finland, new regulation requiring an LTV cap of 90% came into force on 1 July
2016.
In addition to LTV caps, more recently, authorities have taken further measures to
stabilise/dampen house prices. In Sweden, the minimum risk weight on residential mortgages
was raised to 15% in May 2013 (previously 5%) and it was raised further to 25% in May 2014.
In Norway, talks were revolving around a similar 25% floor but, instead, the Norwegian FSA
chose to floor banks’ loss-given-default assumptions at 20%.
In Sweden, a lot of focus has been on amortisation culture. This year, the Swedish FSA
introduced new amortisation requirements, requiring new mortgage loans to be amortised down
to an LTV of 50%. For mortgages with LTVs higher than 70%, 2% of the original loan amount
should be repaid annually. Furthermore, mortgages with LTVs between 70% and 50% should
be repaid at an annual rate of 1%. The regulation came into force on 1 July 2016.
In Norway, the Ministry of Finance in 2015 adopted regulation which formalized the 85% LTV
cap on residential mortgages. Further, an interest rate increase of 5pp for debt-servicing ability
should be assessed at origination, which applies also to fixed rate mortgages on the expiry of the
mortgage rate lock-in period. For loan-to-value ratios above 70%, a minimum annual
amortisation of 2.5% applies or amortisation of an amount corresponding to a 30-year annuity
loan is required, whichever is lower. The regulation allows for 10% of the volume of a lender’s
approved loans per quarter to be exceptions. The regulation will cease to have effect on 31
December 2016, unless an assessment shows the need for the regulation to be extended.

9 | 6 September 2016 www.danskeresearch.com
Da
nish
Co
vered B
on
ds
Danish Covered Bonds
Særligt dækkede obligationer and realkreditobligationer
Background
Despite Denmark having a long and internationally recognised tradition of funding residential
and commercial properties by issuing mortgage bonds, in May 2007, a proposal for a new
Mortgage Act was passed, which became effective on 1 July 2007. Executive orders concerning
the Mortgage Act were passed shortly afterwards.
The main reasons for amending the Danish Mortgage Act were to ensure that Danish covered
bonds complied with the EU Capital Requirement Directive (CRD) – and therefore qualified for
preferential risk weighting – and to abandon the specialist banking principle. This enabled
Danish universal banks to access attractive covered bond funding.
Traditionally, Danish mortgage bonds are tapped into the market on a daily basis. Mortgage
bonds are matched with mortgages in order to ensure that mortgage banks are not exposed to
any kind of interest, currency, option or liquidity risk. Furthermore, the Danish mortgage market
is the only one (besides the US) where 30-year, fixed-rate, callable loans remain the predominant
mortgage type. See our Danish Covered Bond Handbook for a more in-depth description of the
traditional Danish mortgage market.
Key elements of the Covered Bond Act
Danish covered bonds fall into three categories.
Særligt dækkede obligationer (SDOs).
Særligt dækkede realkreditobligationer (SDROs).
Realkreditobligationer and Skibskreditobligationer (ROs).
The legal framework for ROs is almost unchanged compared with the previous Mortgage Act.
We expect the market for ROs to be insignificant, as they do not comply with the CRD. Besides
issuer privileges related to SDROs, the primary difference between SDOs and SDROs concerns
the types of substitution assets allowed in the cover pool. However, in both cases eligible
substitution assets must comprise safe and liquid securities, in accordance with the CRD.
The specialist banking principle, allowing only specialised institutions restricted in their
business to issue covered bonds, has been abandoned. This is also the case in Germany, Sweden
and Finland. Specialist mortgage banks still enjoy the privilege of issuing realkreditobligationer
(ROs) and SDROs, while Danmarks Skibskredit has the privilege of issuing
Skibskreditobligationer (ROs).
Danish Covered Bonds

10 | 6 September 2016 www.danskeresearch.com
Da
nish
Co
vered B
on
ds
Danish Covered Bonds
Universal banks, specialist mortgage banks and Danmarks Skibskredit can apply for the right to
issue SDOs.
In accordance with UCITS 52(4) requirements, the issuer is subject to special public
supervision. The issuer must keep a cover register of collateral (including open hedge
positions) and bonds issued. Collateral assets may include residential and commercial
mortgages, public loans, derivatives and substitute assets. Universal banks issuing SDOs may
also include ships as collateral assets. LTV ratio limits are 80% and 60% for mortgage and
commercial loans, respectively. The LTV ratio is limited to 75% for 30Y interest-only
mortgages. Regarding substitution assets in the form of short-term guarantees from loan-
providing banks or SDOs issued by another credit institution (only when issuing SDOs), the
15% limit on exposure to other credit institutions (according to the CRD) has been abandoned
in the Danish Covered Bond Act. The valuation of cover assets must be carried out in a prudent
manner and not exceed the market value and the assessment must be on an individual basis. If
approved by the Danish FSA, statistical models can be used. Properties in the cover asset pool
must be valued on an ongoing basis, i.e. commercial properties annually and residential
properties every third year. If LTV ratio limits are breached, the issuer is obliged to include
substitution assets in the cover asset pool. Specialist mortgage banks can issue senior debt
secured on the cover pool (ranking second to covered bonds) to fund such assets.
Mandatory minimum over-collateralisation (OC) is fixed at 8% of risk-weighted assets for
specialist mortgage banks, regardless of the type of covered bond issued. There is no legal
minimum OC requirement for universal banks issuing SDOs. Asset segregation and
bankruptcy proceedings concerning bondholders are unchanged in the new legislation but, in
line with other European covered bond acts, the revised act specifies that derivatives
counterparties rank pari passu with bondholders. Lenders of senior debt rank second to covered
bondholders regarding claims for cover assets but rank above lenders of subordinated debt or
hybrid core capital. There is no acceleration of payment following bankruptcy of the issuer.
As regards ALM requirements, the executive order sets strict limits for interest rate risk, currency
risk, option risk and liquidity requirements. We consider Danish ALM requirements to be the strictest
in Europe. Issuers can choose to adhere to one of two different balance principles: the general balance
principle (illustrated below) or the specific balance principle. Regarding liquidity risk, the executive
order states that interest payable to bondholders in any given 12-month period must not exceed interest
received from assets, according to the specific balance principle. Furthermore, NPV coverage is
required.
Table 3. General balance principle
Requirement Universal banks Specialist banks
Interest rate risk - scenario 1 (+/-100bp change in ir. curve)
10% of OC 1% of capital requirement + 2% of voluntary OC
Interest rate risk - scenario 2 (+/-250bp change in ir. curve)
100% of OC 5% of capital requirement + 10% of voluntary OC
Currency risk (+/-10%/50% change in ex. rate)
5% of OC 10% of capital requirement + 10% of voluntary OC
Option risk (+/-100% change in vol. curve)
5% of OC 0.5% of capital requirement + 1% of voluntary OC
Source: Danske Bank Markets
With regard to exposure of cross currencies other than EUR/DKK, the currency risk limit for
specialist mortgage banks is 1% of the capital requirement plus 1% of voluntary OC.

11 | 6 September 2016 www.danskeresearch.com
Da
nish
Co
vered B
on
ds
Danish Covered Bonds
Below, we show how issuers in the Danish market have positioned themselves regarding the
type of covered bond and type of balance principle. Nordea Kredit and Realkredit Danmark,
owned by the two large banks Nordea and Danske Bank, respectively, are the only ones to issue
covered bonds in the SDRO format and adhere to the specific balance principle. DLR Kredit
also adheres to the specific balance principle. Danmarks Skibskredit is the only issuer that does
not issue CRD-compliant covered bonds. In the case of Danmarks Skibskredit, these non-
compliant bonds are so-called skibskreditobligationer (ROs).
Table 4. Covered bond positions
Issuer Covered bond type Balance principle Issuing principle
BRFkredit SDO & RO General principle Pass-through Danmarks Skibskredit RO Specific principle - Danske Bank SDO General principle Euro style DLR Kredit SDO Specific principle Pass-through Nordea Kredit SDRO Specific principle Pass-through Nykredit/Totalkredit SDO & RO General principle Pass-through Realkredit Danmark SDRO Specific principle Pass-through
Source: Danske Bank Markets
BRFkredit and Nykredit/Totalkredit have opted for the general balance principle and (like DLR
Kredit) issue covered bonds in the SDO format. The main reasons for doing so are to have the
option of carrying out joint funding, to benefit from a slightly more flexible balance principle
and to have the choice of including a broader range of collateral in the cover pool.
Not being a specialised mortgage bank, Danske Bank is allowed to issue covered bonds in the
SDO format only. Obviously, the general balance principle within the ALM suits it best as a
universal bank. So far, Danske Bank has been the only Danish bank to issue covered bonds in a
euro benchmark style.
FSA supervision
The risk profile of mortgage banks is closely monitored by the Danish FSA.
Property valuations are reported directly to the FSA for control purposes. If the value of a
pledged property is set too high, the FSA will carry out a second valuation. If the second
valuation confirms that the value is set too high, the FSA will instruct the mortgage bank to
reduce the size of the loan to observe the maximum LTV ratio.
Reports to the FSA are prepared on a quarterly basis on the following.
Credit risk exposures.
Market risk exposures.
Solvency.
Inspections of mortgage banks by the FSA are performed on a regular basis. During inspections
the FSA will monitor to ensure that risk mitigating procedures are sufficient and adhered to.
On 2 December 2014, the Danish FSA published the final version1 of a ‘Supervisory Diamond’
for mortgage-credit institutions (MCIs). The Supervisory Diamond contains five indicators with
corresponding limits on risk of the mortgage banks. The five indicators are listed on the next
page.
1 A proposal was published on 11 September 2014.

12 | 6 September 2016 www.danskeresearch.com
Da
nish
Co
vered B
on
ds
Danish Covered Bonds
Chart 6. Supervisory Diamond for Danish mortgage-credit institutions
Source: Danske Bank Markets
1. Lending growth. Growth in lending to individual customer segments should not exceed
15% per year. The four customer segments are private homeowners, rental property,
agriculture and other corporates.
2. Borrower interest-rate risk. Share of lending where Loan-to-Value (LTV) exceeds 75%
of the lending limit for MCIs and where the interest rate is only fixed for up to two years, it
should be less than 25%. Applies only to loans to private homeowners and rental property.
Loans hedged by interest rate swaps and the like are excluded.
3. Interest-only lending to personal borrowers. The share of interest-only loans in the LTV
band above 75% of the lending limit should not exceed 10% of total lending. Interest-only
loans are included regardless of position in order of priority.
4. Loans with short-term funding. The share of lending to be refinanced should be less than
12.5% of the total loan portfolio per quarter and less than 25% of the loan portfolio annually.
5. Large exposures: Sum of the 20 largest exposures should be less than the institution’s CET
1 (core equity tier 1 capital).
The benchmarks for interest-only lending (point 3) and loans with short-term funding (point 4)
are set to apply from 2020, while the other benchmarks are set to apply from 2018.
Our general assessment is that the coming Supervisory Diamond will prompt the mortgage-
credit institutions to maintain their focus on reducing the proportion of interest-only loans and
loans with annual refinancing and on spreading out the auctions.
Along with the Supervisory Diamond, the FSA will launch two initiatives intended to counter
the risk of price bubbles in the real estate market. These initiatives will be implemented via
changes to existing executive orders.
Requirement that private homebuyers should in general provide a 5% deposit.
Rental properties should generally be able to generate positive liquidity before they can be
mortgaged.
Further requirements apply for borrowers seeking a mortgage in so-called growth areas. The
guidance defines growth areas as the largest cities and towns with more significantly
1. Lending growth
2. Borrower
interest-rate risk
3. Interest-only lending
to personal borrowers
4. Loans with short-
term funding
Supervisory
Diamond
5. Large
exposures

13 | 6 September 2016 www.danskeresearch.com
Da
nish
Co
vered B
on
ds
Danish Covered Bonds
appreciating prices on owner-occupied property and where the price level for apartments and
single-family homes is considerably higher than in the rest of the country. Currently, this applies
to Copenhagen and surrounding districts and Aarhus.
A key point in this guidance applies to mortgages on residential property in growth areas where
the customer opts for an adjustable rate loan. In this instance, the mortgage bank’s assessment
of whether disposable income is sufficient at the time of granting the loan should generally be
based on a fixed interest rate that is 1 percentage point higher than the current fixed interest rate,
though at least 4%, and with a repayment period of maximum 30 years.
Issuers and credit quality
The Danish covered bond set-up is recognised as one of the strongest in the world, with high
systemic support. In particular, the almost non-existent market risk, eliminated by the balance
principle, is a major advantage for traditional Danish covered bonds.
Until June 2011, Danish covered bonds issued by mortgage banks enjoyed the best timely
payment indicator (TPI) possible at Moody’s (‘Very High’). However, for most Danish
mortgage banks, Moody’s changed this one step down to ‘High’ due to the increased use of
loans with embedded refinancing (in contrast to loans where the maturity of the loan is exactly
matched by the maturity of the bond). For specialist lender DLRkredit, this was further reduced
to ‘Probable High’ in July 2011. Covered bonds issued by universal bank Danske Bank were
not affected as they already had a lower TPI score of ‘Probable’.
Besides the TPI revision, Moody’s, in particular, was quite active regarding Danish issuers in 2011.
Issuer ratings came under pressure mainly as a result of Moody’s changed view on the Danish
banking sector and the systemic support expected to be available for banks. The agency
consequently reclassified Denmark from a ‘High’ support country to a ‘Low’ support country in
terms of expected systemic support.
In 2012, in addition to taking action on ratings and rating outlooks, Moody’s raised its OC
requirements for the various mortgage banks. Most Danish mortgage banks decided to end their
collaboration with Moody’s following these events. This means that Nordea Kredit is now the
only Danish covered bond issuer to have its bonds rated by Moody’s. Instead, S&P has become
the main rating agency of Danish mortgage banks.

14 | 6 September 2016 www.danskeresearch.com
Da
nish
Co
vered B
on
ds
Danish Covered Bonds
Table 5. Capital centres and cover pool overview as of Q1 16
Issuer (capital centre) BRFkredit (E) Danske Bank (C) Danske Bank (D) Danske Bank (I) DLR Kredit
Cover pool (DKKbn) 226 53.9 38.8 120.7 127 OC 6.5% 19.6% 14.9% 13.3% 15.8% WA indexed LTV 63% 55.9% 57.8% 57.3% 58% Interest-only loans 49% 31% 89% 58% 48% Fixed-rate loans 32% 0% 0% 0% 17% Geography (main) 99% DK 69% SE & 21% NO 100% DK 51% NO & 49% SE 99% DK
Issuer (capital centre) Nykredit (E) Nykredit (H) Nordea Kredit Realkredit (S) Realkredit (T)
Cover pool (DKKbn) 341 589 375 222 465 OC 4.3%* 5.2%* 9.8% 8.4% 8.3% WA indexed LTV 64% 62% 64% 61% 63% Interest-only loans 38% 69% 49% 28% 59% Fixed-rate loans 88% 0% 39% 88% 0%
Geography (main) 99% DK 82% DK DK DK DK
*S&P available credit enhancment
Source: Company data, Moody's
Table 6. Rating overview as of Q2 16
Ratings (Moody’s/S&P/Fitch) Moody’s S&P Fitch
Covered bond Issuer/parent C-score/TPI leeway Unused uplift D-Cap/IDR uplift
BRFkredit (E) - /AAA/- -/A-/- 2 notches Danske Bank (C) -/AAA/AAA -A2/A/A N/A 3/2 notches Danske Bank (D) -/AAA/AAA -A2/A/A N/A 3/2 notches Danske Bank (I) -/AAA/AAA -A2/A/A 0 notches 3/2 notches DLR Kredit (B) -/AAA/- -/BBB+/- 0 notches Nykredit (E) -/AAA/- Baa1u/A/A 2 notches Nykredit (H) -/AAA/- Baa1u/A/A 2 notches Nordea Kredit Aaa/AAA/- Aa3/AA-/AA- 13.6%/6 4 notches Realkredit (S) -/AAA/AAA -/-/A 4/N/A Realkredit (T) -/AAA/AA+ -/-/A 2/N/A
Source: Moody’s, Standard & Poor’s, Fitch
15 | 6 September 2016 www.danskeresearch.com
Da
nish
Co
vered B
on
ds
Danish Covered Bonds
Outlook for the Danish economy
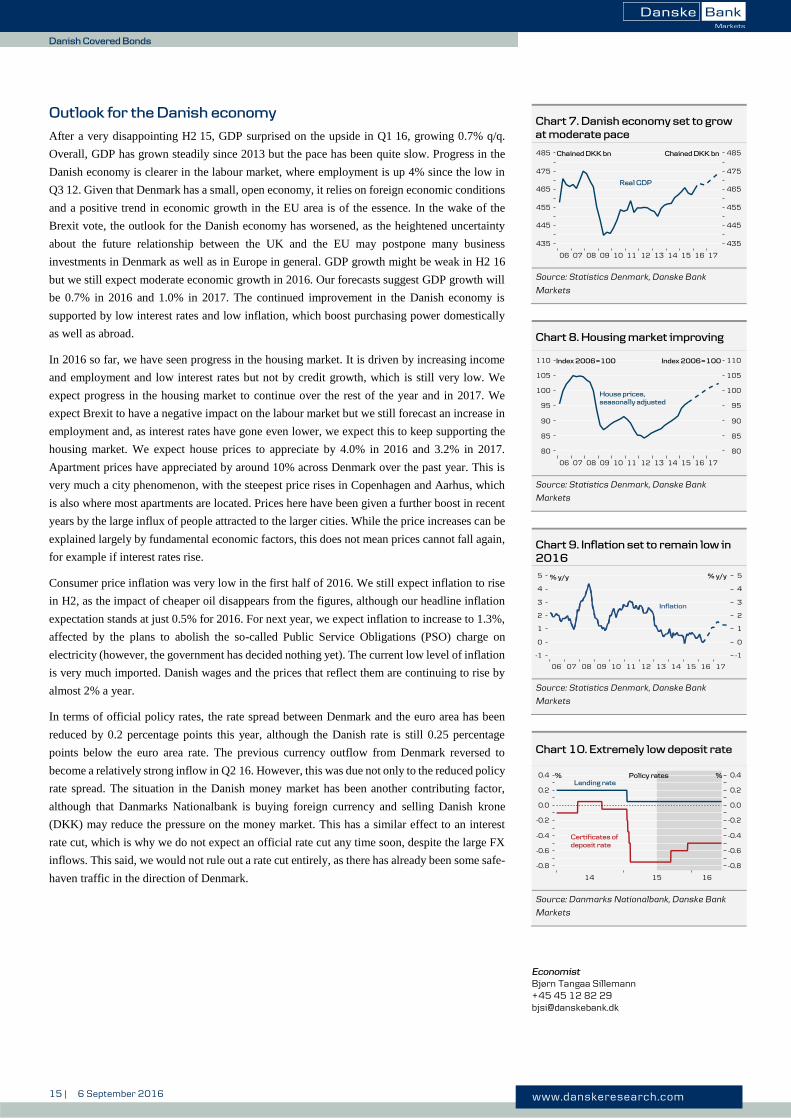
After a very disappointing H2 15, GDP surprised on the upside in Q1 16, growing 0.7% q/q.
Overall, GDP has grown steadily since 2013 but the pace has been quite slow. Progress in the
Danish economy is clearer in the labour market, where employment is up 4% since the low in
Q3 12. Given that Denmark has a small, open economy, it relies on foreign economic conditions
and a positive trend in economic growth in the EU area is of the essence. In the wake of the
Brexit vote, the outlook for the Danish economy has worsened, as the heightened uncertainty
about the future relationship between the UK and the EU may postpone many business
investments in Denmark as well as in Europe in general. GDP growth might be weak in H2 16
but we still expect moderate economic growth in 2016. Our forecasts suggest GDP growth will
be 0.7% in 2016 and 1.0% in 2017. The continued improvement in the Danish economy is
supported by low interest rates and low inflation, which boost purchasing power domestically
as well as abroad.
In 2016 so far, we have seen progress in the housing market. It is driven by increasing income
and employment and low interest rates but not by credit growth, which is still very low. We
expect progress in the housing market to continue over the rest of the year and in 2017. We
expect Brexit to have a negative impact on the labour market but we still forecast an increase in
employment and, as interest rates have gone even lower, we expect this to keep supporting the
housing market. We expect house prices to appreciate by 4.0% in 2016 and 3.2% in 2017.
Apartment prices have appreciated by around 10% across Denmark over the past year. This is
very much a city phenomenon, with the steepest price rises in Copenhagen and Aarhus, which
is also where most apartments are located. Prices here have been given a further boost in recent
years by the large influx of people attracted to the larger cities. While the price increases can be
explained largely by fundamental economic factors, this does not mean prices cannot fall again,
for example if interest rates rise.
Consumer price inflation was very low in the first half of 2016. We still expect inflation to rise
in H2, as the impact of cheaper oil disappears from the figures, although our headline inflation
expectation stands at just 0.5% for 2016. For next year, we expect inflation to increase to 1.3%,
affected by the plans to abolish the so-called Public Service Obligations (PSO) charge on
electricity (however, the government has decided nothing yet). The current low level of inflation
is very much imported. Danish wages and the prices that reflect them are continuing to rise by
almost 2% a year.
In terms of official policy rates, the rate spread between Denmark and the euro area has been
reduced by 0.2 percentage points this year, although the Danish rate is still 0.25 percentage
points below the euro area rate. The previous currency outflow from Denmark reversed to
become a relatively strong inflow in Q2 16. However, this was due not only to the reduced policy
rate spread. The situation in the Danish money market has been another contributing factor,
although that Danmarks Nationalbank is buying foreign currency and selling Danish krone
(DKK) may reduce the pressure on the money market. This has a similar effect to an interest
rate cut, which is why we do not expect an official rate cut any time soon, despite the large FX
inflows. This said, we would not rule out a rate cut entirely, as there has already been some safe-
haven traffic in the direction of Denmark.
Chart 7. Danish economy set to grow
at moderate pace
Source: Statistics Denmark, Danske Bank
Markets
Chart 8. Housing market improving
Source: Statistics Denmark, Danske Bank
Markets
Chart 9. Inflation set to remain low in
2016
Source: Statistics Denmark, Danske Bank
Markets
Chart 10. Extremely low deposit rate
Source: Danmarks Nationalbank, Danske Bank
Markets
Economist Bjørn Tangaa Sillemann +45 45 12 82 29 [email protected]

16 | 6 September 2016 www.danskeresearch.com
Da
nish
Co
vered B
on
ds
BRFkredit
BRFkredit
Company profile
BRFkredit (BRF) was established in 1959 as an independent business foundation authorised to
grant third-lien mortgages. Originally, it was intended that BRFkredit grants mortgage loans for
specific purposes. Until 30 April 2014 BRFkredit was an independent specialist mortgage bank
providing customers with financial solutions and other services connected with real estate and
was wholly owned by BRFfonden, an independent business foundation, through the holding
company BRFholding. On 30. April 2014 a merger between BRFkredit and Jyske Bank A/S
came into effect, and today BRFkredit is owned by Jyske Bank A/S through the holding
company BRFholding A/S. BRFkredit continues as a subsidiary subject to Danish mortgage
finance legislation.
The merger between BRFkredit and Jyske Bank A/S is expected to strengthen the distribution
of banking and mortgage products through an extended base of approx. 900.000 clients, 149
branches, approx. 4,600 employees and a balance sheet of approx. 480bn.
Less than 10 years ago, BRFkredit was the third-largest mortgage bank in Denmark but over the
past couple of years it has lost market share due to weak distribution. Today, Jyske Bank and
BRFkredit is the fourth largest financial institution in Denmark, and BRFkredit has a 9.7%
market share of the total Danish mortgage market.
BRFkredit issues SDO covered bonds in the form of traditional pass-through callable bonds and
bullet bonds. In addition, BRFkredit adheres to the general balance principle.
In December 2012 BRF established an EMTN (Euro Medium Term Notes) programme listed
on Bourse de Luxembourg. Under the EMTN programme, BRF can issue bonds pursuant to §15
of the Danish Mortgage-Credit Act (Senior Secured Notes) and senior debt (Senior Unsecured
Notes) equivalent to up to EUR4bn.
In October 2011 S&P assigned BRFkredit a long-term issuer rating of A- and AAA for covered
bonds issued out of Capital Centres B and E. BRFkredit’s covered bonds issued out of the
General Capital Centre received an AAA rating from S&P in December 2013. For more rating
details, see Chapter 4.
Financial performance
BRFkredit Group reported an operating profit of DKK909m in 2015, an increase from the 2014
level of DKK-348m. Net interest income decreased from DKK2.12bn to DKK1.98bn. Loan
losses and provisions decreased from DKK1.1bn to DKK103m. The core capital ratio increased
from 17.5% as of 31 December 2014 to 18.9% as of 31 December 2015.
The arrears rate (90 days) was 0.3% as at end-September 2015, down from 0.5% in 2014. The
number of repossessed properties decreased from 50 to 41.
Table 7. Ratings (M/S/F)
Covered bond rating WR/AAA/-
Issuer rating WR/A-/-
Source: Rating agencies, Danske Bank Markets
Table 8. Financial information - BRF
DKKm 2015 2014 2009
Net interest income 1,979 2,116 1,730
Fees and commissions 256 185 114
Net gain/losses -354 -636 351
Pre-provision income 1,012 721
Loan losses & provisions 103 1,069 2,125
Operating profit 909 -348 -858
Core capital ratio 18.9% 17.5% 13.3%
Total capital ratio 19.1% 17.7% 13.0%
Arrears rate 0.3% 0.5%
Repossessed properties 41 50
Source: BRFkredit, Danske Bank Markets
Table 9. More info
Bond ticker BRF
Website www.brf.dk
Source: Danske Bank Markets

17 | 6 September 2016 www.danskeresearch.com
Da
nish
Co
vered B
on
ds
BRFkredit
Business model and funding profile
BRFkredit is a specialist mortgage bank subject to supervision by the Danish FSA. BRFkredit
offers mortgages through Jyske Bank A/S and several partnerships. For example, BRFkredit has
entered into agreements with a range of independent real estate agencies and financial
institutions. In 2012 BRFkredit entered into a range of referral agreements with enterprises that
meet the customers before a financing requirement arises, for instance estate agents and
companies operating in energy renovation and large consumer durables. BRFkredit also
distributes mortgages through its website (www.brf.dk) and directly from its headquarters.
BRFkredit primarily offers mortgages secured on properties in Denmark, specialising in those
used for residential properties and office and shop premises. Loans for residential properties,
including owner-occupied homes, co-operative homes, rental homes and publicly subsidised
housing projects, comprise most of the total mortgage book. BRFkredit’s main lending segment
are owner-occupied dwellings and vacation homes (51%), private rentals (18%) and subsidised
housing (18%). BRFkredit offers interest-reset loans (55%), fixed rate callable loans (29%),
floaters 11% and a small share of other types of loans (5%).
Mortgage-backed covered bonds issued by BRFkredit are divided into different cover registers
(capital centres). Bonds issued prior to 31 December 2007 are issued out of capital centre B and
are grandfathered to the CRD. New ROs (Realkreditobligationer) are also issued from Capital
Centre B but they do not comply with the CRD and hence do not get preferential treatment in
terms of risk weighting. According to the revised Mortgage Act, any new SDOs must be issued
out of separate capital centres and new SDOs are issued out of Capital Centre E.
BRFkredit first entered into a joint funding agreement with Jyske Bank and Sydbank in February
2012. Since then, two more banks (Arbejdernes Landsbank and Ringkjøbing Landbobank) have
joined. Furthermore, in October 2013, BRFkredit began funding fixed rate mortgages through the
joint funding agreement. Following the merger in April 2014, the joint funding agreements with
Jyske Bank and Ringkjøbing Landbobank have continued.
The Danish FSA approved the joint funding model in 2012 and it enables financial institutions
to fund private residential mortgage loans through BRFkredit for a fee. The mortgages are
funded through BRFkredit’s SDO covered bond programme and must comply with the
requirements of Danish mortgage finance legislation. Furthermore, the underwriting standards
must comply with BRFkredit’s policies.
The portfolio of jointly funded loans has increased steadily, from DKK5bn at end-2013 to
DKK42bn at end-2015, fuelled primarily by Jyske Bank's focus on the housing area, with loans
jointly funded at BRFkredit. Since the accounts were finalised, the portfolio recorded a further
increase of DKK5bn on 1 January 2016.
BRFkredit announced in February 2016, that it will finance part of the mortgage loans under the
joint funding agreements with bonds denominated in EUR. Since the announcement, BRF has
issued two EUR denominated SDO bonds: EUR 500m in BRF 0.25% Apr-2021 (ISIN
XS1385173734) and EUR 750m in BRF 0.25% Jul-23 (ISIN XS1435774903).
Cover pool and asset quality
At end of Q1 2016, BRFkredit’s cover pool E stood at DKK226bn, made up of 99% Danish-
based loans. The average LTV ratio is 63%. Loans are well diversified; however, the majority
of the properties (46%) are located in the Copenhagen area. Of the cover pool, 55% is residential
property and 11% is commercial. Fixed-rate assets constitute 32% of the pool.
Table 10. Funding profile
Market funds (match-funded) 93%
Other 3%
Equity 4%
Source: BRF, Danske Bank Markets
Table 11. Cover pool info – CC E
Capital Centre E DKK226bn
Junior covered bonds DKK1bnx
WA LTV 63%
OC 6.5%
Fixed-rate loans 32%
IO loans 49%
Geography 99% Denmark
-Copenhagen area 46%
-Zealand & Bornholm 12%
-Northern Jutland
-Eastern Jutland
-Southern Jutland & Funen
7%
19%
15%
Asset type
-Residential 55%
-Subsidised 16%
-Private rental housing 16%
-Commercial 11%
-Other 2%
Source: Investor Report Q1 2016 from BRF and
Danske Bank Markets.

18 | 6 September 2016 www.danskeresearch.com
Da
nish
Co
vered B
on
ds
Danske Bank
Danske Bank
Company profile
Danske Bank A/S (Danske Bank) is part of the Danske Bank Group, which also includes the
wholly-owned subsidiaries Realkredit Danmark (one of the largest Danish mortgage credit
institutions) and Danica Pension (a leading Danish life insurance company). Danske Bank is the
largest bank in Denmark, where it operates 128 branches and holds market shares in deposits
and lending (excluding mortgage loans issued by Realkredit Danmark) of around 28% and 26%.
However, the group also has a significant international presence, operating in 15 countries. In
addition to Denmark, Danske Bank is one of the largest banks in Northern Ireland and Finland,
and has challenger positions in Sweden, Norway, Estonia, Lithuania and Latvia.
Danske Bank provides a wide range of banking products and services to retail, corporate and
institutional clients. It has three main operating units (Personal Banking, Business Banking,
Corporates & Institutions), as well as Danske Capital (asset management) and Danica Pension.
The group also reports a non-core division (consisting mainly of the portfolio of non-core Irish
exposures, which are being wound up), and other activities (encompassing Group Treasury,
Group IT, Group Services and eliminations).
Danske Bank’s issuer ratings from Moody’s, S&P and Fitch are ‘A2’, ‘A’ and ‘A’, respectively.
The most recent rating action was by Moody’s which lifted its rating by one notch in June 2015,
reflecting the progressive strengthening of the bank's performance in recent years, including
improvements in asset quality and capitalisation. S&P has affirmed the ratings and changed the
outlook to stable reflecting the expectations of stable capital ratios and further earnings
improvements. Danske Bank’s covered bonds issued out of cover pools D, I and C are rated
AAA by S&P and Fitch.
Financial performance
Group net profit for 2015 was DKK13.1bn. The result was affected by goodwill impairments of
DKK4.6bn. Net profit before goodwill impairments rose 36% to DKK17.7bn. Net interest
income was down 4%. The negative short-term interest rates continued to put pressure on deposit
margins and net interest income. Lending volume growth and lower funding costs partly offset
this pressure.
Operating expenses fell 4% to DKK21.8bn, and the cost/income ratio before goodwill
impairments improved 2.1 percentage points to 49.4%. At the end of 2015, the total capital ratio
was 21.0% (2014: 19.3%) and the CET 1 capital ratio was 16.1% (2014: 15.1%). Danske Bank
has set two capital targets: a total capital ratio of at least 17% and a CET1 capital ratio of at least
13%. Danske Bank has met the targets since the end of 2012.
Business model and funding profile
Danske Bank is a universal bank subject to supervision by the Danish FSA. The group has a
well-diversified funding platform including a solid deposit base. Much of the lending consists
of Danish mortgages, financed by Realkredit Danmark (RD) mortgage bonds. However, the
group also issues covered bonds under the Danske Bank name in a SDO format, under the
general balance principle (cf. the Danish Covered Bond Act).
Table 12. Ratings
(Moody’s/S&P/Fitch)
Covered bond rating -/AAA /AAA (D/I/C)
Issuer rating A2 / A / A Fitch D-Cap 3 (D/I/C)
Fitch IDR uplift 2 notches
S&P unused notches: N/A/0/N/A (D/I/C)
Source: Rating agencies, Danske Bank Markets
Table 13. Financial information
DKKm 2015 2014
Net interest income 33,333 34,607
Fees & commissions 10,679 9,814 Net gain/losses 6,908 9,720 Pre-provision income 17,701 11,553
Losses & provisions -61 3,718 Profit before tax 17,762 7,969 Cost/income ratio 59.8% 72.1%
CET 1 capital ratio 16.1% 15.1% Total capital ratio 21.0% 19.3%
Source: Danske Bank Annual Report 2015
Table 14. More information
Bond ticker DANBNK Website www.danskebank.com
Source: Danske Bank Markets

19 | 6 September 2016 www.danskeresearch.com
Da
nish
Co
vered B
on
ds
Danske Bank
Danske Bank has established three active cover pools within its EUR30bn covered bond
programme. Cover Pool D comprises 100% domestic mortgages while Cover Pool I and C
include international mortgages originated by Danske Bank, stemming from Norway and
Sweden. Cover Pool C is made up of a diverse combination of loan types, while the I pool is
purely residential, and they are both used for issuance of EUR benchmark covered bonds.
In 2016, Danske Bank announced changes to its cover pool setup. This entails establishing a
new mortgage institution under Swedish law (Danske Hypotek), as well as separating the
Swedish and Norwegian assets contained in cover pool I, and possibly also to some extent cover
pool C, by removing Swedish ‘residential-like’ assets from the latter. When the changes have
been fully implemented, in addition to its existing D-pool, Danske Bank should thus have a new,
purely residential Swedish cover pool in Danske Hypotek, a purely residential Norwegian cover
pool (cover pool I), as well as a combined cover pool of both Norwegian and Swedish assets (C-
pool). The timing for these changes are dependent on the establishment of the new Swedish
mortgage subsidiary. According to Danske Bank, cover pool I will be partly dedicated to NOK
funding. However, regarding both cover pools C and I, the bank states that it will continue to
issue EUR benchmark covered bonds on a regular basis. There is also a Cover Pool R, which
consisted of Irish residential mortgages. The cover pool is inactive, containing no assets, having
been moved to the bank’s non-core business unit.
Danske Bank’s outstanding EUR benchmark covered bonds all have soft bullet maturities,
allowing for a 12-month extension period. Covered bonds secured by Danish cover assets issued
after 1 January 2015, i.e. Cover Pool D, are affected by the new legislation on maturity extension
for Danish covered bonds. According to the legislation, an administrator will have the possibility
of extending the maturity of the covered bonds in the cover pools by up to one year at a time to
avoid temporary shortfalls of liquidity, but only after other refinancing options have been
exhausted. If there is a maturity extension, the interest rate will be fixed at a reference rate plus
a maximum of 5pp. The maturity of new issues will be limited to a minimum of two years.
Cover pool and asset quality
As of 31 March 2016, Cover Pool D totalled DKK38.8bn and consisted exclusively of Prioritet
Plus mortgage loans, which offer the borrower the flexibility to partially draw down or repay
amounts held in a dedicated savings account. In a bank’s default scenario, the borrower cannot
set off the deposit account against its loan account, thus protecting bondholders against set-off
risk. The underlying assets are residential properties in Denmark (92% primary homes, 8%
secondary homes). All the mortgages in Cover Pool D are floating rate. The average indexed
LTV ratio in Cover Pool D is 57.8%. The pool is well seasoned (91 months) and has an OC of
14.9% (of which 2% is committed).
Cover Pool I – the main cover pool – amounted to DKK120.7bn and comprised 51% Norwegian
and 49% Swedish mortgages. Of the mortgages in Cover Pool I, 100% are floating rate. The
average indexed LTV ratio in Cover Pool I is 57.3%. The pool has an overall weighted seasoning
of 49 months. OC stood at 13.3%, of which 2% is committed.
Cover Pool C stood at DKK55.6bn and comprised Swedish and Norwegian floating-rate assets
– mainly offices (42%), rental housing (23%) and manufacturing industries (16%). The average
indexed LTV ratio in Cover Pool C is 55.9%. The 6,436 loans in cover Pool C reflect the more
business-oriented nature of the pool.
Loans in arrears (over 90 days) are not allowed in any of the cover pools. Furthermore, Danske
Bank commits to a voluntary minimum OC of 2% (agreed with the Danish FSA). Approval of
mortgages by Danske Bank is based on a strict credit policy, identical to that of Realkredit
Danmark.
Table 15. Funding profile
Total balance DKK3,293bn
Retail deposits 25% Due to credit & central Inst. 10% Bonds issued by RD 21% Other debt issued 11% Trading portfolio liabilities 14% Liab. (insurance contracts) 9% Subordinated debt 1% Equity 5% Other 5%
Source: Danske Bank Annual Report 2015
Table 16. Cover pool information (D)
Cover Pool D DKK 38.8bn
Number of loans 68,345 OC (committed) 14.9% (2%) WA Indexed LTV 57.8% Seasoning 91 months Arrears (> 90 days) None Floating rate 100% Geography 100% Denmark -Greater Copenhagen 37% -South Denmark 24% -Eastern Jutland 20% -Remaining Zealand 13% -North Jutland 6% Asset type 100% residential -Primary home 92% -Secondary home 8%
Source: Danske Bank ECBC template, Mar 2016
Table 17. Cover pool information (I)
Cover Pool I DKK 120.7bn
Number of loans 128,704 OC (committed) 13.3% (2%)
WA Indexed LTV 57.3%
Seasoning
Arrears (> 90 days)
49 months None
Floating rate 100%
Geography
-Norway 51%
-Sweden 49%
Asset type
-Owner-occupied 79%
-Cooperative housing -Holiday homes
21% 5%
Source: Danske Bank ECBC template, Mar 2016
Table 18. Cover pool information (C)
Cover Pool C DKK53.9bn
Number of loans 6,436 OC (committed) 19.6% (2%) WA Indexed LTV 55.9% Seasoning Arrears (> 90 days)
23 months None
Floating rate 100% Geography -Sweden 69% -Norway 21% Property type -Private rental 23% -Agricultural properties 10% -Cooperative housing 5% -Offices and businesses 42% -Manufacturing industries 16% -Other 4%
Source: Danske Bank ECBC template, Mar 2016

20 | 6 September 2016 www.danskeresearch.com
Da
nish
Co
vered B
on
ds
DLR Kredit
DLR Kredit
Company profile
Dansk Landbrugs Realkreditfond (DLR) is a Danish mortgage lender, specialised in agricultural
and commercial mortgages. DLR was founded in 1960 on the initiative of the banks and savings
banks associations (now the Danish Bankers Association). DLR’s formation was driven by
farmers’ requirements for long-term capital in the 1950s, which were covered only partially by
first- and second-lien mortgage banks. Lack of funding resulting from hesitant lending policies
of first- and second-lien mortgage banks led in part to the establishment of DLR, which was
allowed to operate with a loan-to-value ratio of 70% of DLR’s valuation of the mortgaged
property.
Between its establishment in 1960 and 1 July 2000, DLR operated on its own individual legal
basis pursuant to the DLR Act. DLR’s exclusive right to grant loans based on a LTV ratio of 45-
70% was abandoned from 1 January 1999. DLR became subject to the Mortgage Credit Act as
of 1 July 2000 and in 2001 it became a company limited by shares. Shares in DLR are held by
65 local and regional banks and savings banks. The shareholders are members of Local Banks
in Denmark (39%), members of the Association of Regional Banks (34%), Nykredit (11%),
PRAS A/S (6%), DLR (5%), the Danish centralbank (4%) and other shareholders (0.3%). As
well as providing mortgage loans, DLR has managed the loan portfolio of LR Realkredit
(majority owned by Nordea, Danske Bank, Jyske Bank, SEB and Arbejdernes Landsbank) since
1994. DLR takes no credit risk on this portfolio.
DLR’s market share was 5.2% as at the end of 2015. If we look at DLR’s main lending areas
(agriculture, office and business properties, private rental housing properties and private co-
operative housing properties), the market share was 15.2%.
DLR has a BBB+ issuer-rating from Standard & Poor’s and a AAA covered bond rating (Capital
Centre B and “General Capital Centre”).
Financial performance
DLR Kredit A/S reported operating profit of DKK875m in 2015 – a decrease from the 2014
level of DKK933m. Net interest income increased from DKK1.680bn to DKK1.724bn. Loan
losses and provisions decreased from DKK191m to DKK94m. The core capital ratio increased
from 12.3% to 12.9%.
The arrears rate (3.5 months) as of mid-January 2016 was 1.24%, up from 1.15% as at mid-
January 2015. The number of repossessed properties decreased from 30 as of end 2014 to 26 as
of end 2015.
Table 19. Ratings (M/S/F)
Covered bond rating: WR/AAA/- Issuer rating: WR/BBB+/-
Source: Rating agencies, Danske Bank Markets.
Table 20. Financial info
DKKm 2015 2014 2009
Net interest income 1,724 1,680 1,047
Fees and commissions -217 -172 -240
Net gain/losses -330 -188 -14
Pre-provision income 969 1,124
Loan losses & provisions 94 191 159
Operating profit 875 933 450
Cost/income ratio 27% 30% 45%
Core capital ratio 12.9% 12.3% 11.6%
Total capital ratio 12.9% 12.3% 11.7%
Arrears rate 1.24% 1.15%
Repossessed properties 26 30
Source: DLR Kredit, Danske Bank Markets
Table 21. More info
Bond ticker LANDBR
Website www.dlr.dk
Source: Danske Bank Markets

21 | 6 September 2016 www.danskeresearch.com
Da
nish
Co
vered B
on
ds
DLR Kredit
Business model and funding profile
DLR is a specialist mortgage bank subject to supervision by the Danish FSA. DLR provides
mortgages through the branch networks of its shareholder banks. In order to support the
customer advisory services of the banks in connection with mortgage loans DLR has developed
an electronic communications system – DLRxperten. DLR has no branches itself.
DLR only offers mortgages secured on properties in Denmark. It focuses on mortgages on
agricultural and commercial properties as well as co-operative homes, rental homes and publicly
subsidised housing projects. The bank offers interest-reset loans (52%), fixed rate callable loans
(17%) and floating rate loans (31%). All mortgages are based on the pass-through principle,
meaning that consumers have a delivery option on underlying bonds. Interest-reset loans are
funded by issuing a portfolio of fixed rate, non-callable bonds, while other types of mortgages
are funded individually by issuing bonds with exactly the same characteristics as the mortgages.
DLR has a management agreement with all shareholder banks, which requires loan-providing
banks to put up an individual loan loss guarantee covering the most risky part of each mortgage.
The agreement includes all commercial properties.
As a result, DLR’s risk of losses arising from the granting of loans for the property types
mentioned is very limited. Loans for agricultural properties are also protected by a collective
guarantee scheme set up between DLR and the loan-providing banks, which comes into force in
the event that the losses suffered by DLR within a given financial year exceed a given level. The
guarantee scheme means that DLR’s risk of losses arising from the granting of loans for
agricultural properties is relatively limited. As at the end of Q1 2016, the guarantee scheme
covered 90% of DLR’s total loan portfolio; the remaining loans often have a very low LTV.
Mortgage-backed covered bonds issued by DLR are divided into different cover registers
(capital centres). According to the revised Mortgage Act, any new SDOs must be issued out of
separate capital centres. By the end of 2007 DLR closed and subsequently grandfathered the
existing series in General Capital Centre, according to the Capital Requirement Directive
(CRD), with new SDOs issued out of Capital Centre B.
Cover pool and asset quality
As of Q1 2016 DLR’s capital centre B totalled DKK127bn and consisted mainly of Danish-
based assets, distributed as 62% in agricultural assets and 18% in commercial assets. All assets
are geographically well diversified with a slight tendency to be concentrated in Jutland.
Approval of mortgages by DLR is based on a strict credit policy. Only mortgages on properties
stated in the Mortgage Act are allowed in the cover pool. The LTV ratio on each mortgage is
monitored on an ongoing basis while the borrower’s ability to pay is reviewed each month.
Table 22. Funding profile
Market funds (match-funded) 91%
Equity 8%
Other 1%
Source: DLR, Danske Markets
Table 23. Cover pool info – CC B
DLR Kredit DKK127bn
WA LTV 58%
OC 15.8%
Fixed rate loans 17%
IO-loans 48%
Geography 99% Denmark
-Copenhagen area 6%
-Zealand 13%
-South Denmark 28%
-Jutland 51%
-International 1%
Asset type
-Owner-occupied 5%
-Agricultural 62%
-Commercial 18%
-Rental housing 11%
-Co-operative housing 2%
Source: Cover pool report Q1 2016 from DLR and
Danske Bank Markets

22 | 6 September 2016 www.danskeresearch.com
Da
nish
Co
vered B
on
ds
Nordea Kredit
Nordea Kredit
Company profile
Nordea Kredit Realkreditaktieselskab (NOR) is a wholly-owned subsidiary of Nordea Bank
Danmark, which is part of the Nordea Group. In 1997 Swedish Nordbanken merged with Finnish
Merita Bank to form MeritaNordbanken. In 2000 Danish Unibank merged with
MeritaNordbanken, which, at the same time, changed its name to Nordea. Later in 2000 the
Norway-based Christiania Bank joined the newly formed Scandinavian banking group. Today
Nordea is the largest bank in Scandinavia with activities in Scandinavia, the Baltic region and
Russia.
Nordea’s main business areas include retail banking, corporate banking, asset management, life
insurance and pensions and mortgage finance.
NOR began its mortgage activities in September 1993. Initially, it provided only lending for
residential properties and holiday homes. Currently, however, mortgage loans are offered for
most types of property. NOR’s share of the domestic mortgage market as at Q1 2016 was 15.0%
(mortgage loans at nominal value as a share of all Danish mortgage bank loans).
Nordea’s long-term issuer ratings by Moody’s, S&P and Fitch are A1, AA- (negative outlook)
and AA-, respectively. Covered bonds issued by NOR have Aaa and AAA ratings from Moody’s
and S&P, respectively. For more rating details, see Chapter 4.
Financial performance
Nordea Kredit reported operating profit of DKK1.9bn for 2015, an increase from the 2014 level
of DKK1.8bn. Net interest income increased from DKK2.7bn to EUR2.8bn and loan losses and
provisions decreased from DKK366m to DKK114m. The core capital ratio and the total capital
ratio increased from 28.6% as of 31 December 2014 to 29.7% as of 31 December 2015.
The arrears rate (3.5 months) for residential properties and holiday homes for Nordea Kredit was
0.17% as at end-2015, down from 0.24% as at end-2014. The number of repossessed properties
fell from 41 to 35.
Business model and funding profile
NOR is a specialist mortgage bank subject to supervision by the Danish FSA. The objective of
NOR is to carry on business as a mortgage bank, including any kind of business permitted
pursuant to the Danish Mortgage Act. NOR only has mortgage credit activities in Denmark,
while all mortgages in the cover pool are secured on properties situated in Denmark. All
mortgages included in the cover pool are distributed through Nordea’s branch network and that
of the real estate chain, DanBolig.
A management agreement exists between NOR and Nordea Bank Danmark. It states the
following: Nordea Bank Danmark A/S provides a guarantee for the upper 25% of mortgage
loans originated by the bank. For loans granted for non-profit housing, youth housing and
housing for the elderly, there is only a 10% guarantee. For loans for all-year dwellings, co-
operative housing, private rental housing, non-profit rental housing and properties for social,
cultural and educational purposes, the guarantee covers that part of the mortgage loan that
exceeds 60% of the valuation made in conjunction with the loan origination process. For loans
granted to agricultural properties, the guarantee covers that part of the mortgage loan that
exceeds 55% of the valuation made in conjunction with the loan origination process.
Table 24. Ratings (M/S/F)
Covered bond rating Aaa/AAA/-
Issuer rating Aa3/AA-/AA-
Source: Rating agencies, Danske Bank Markets
Table 25. Financial info
DKKm 2015 2014 2009
Net interest income 2,791 2,679 5,281
Fees and commissions 2,135 2,066 1,693
Net gain/losses 124 274 1,946
Pre-provision income 2,027 2,141 4,513
Loan losses & provisions 114 366 1,486
Operating profit 1,913 1,775 3,027
Cost/income ratio 10.6% 8.6% 50%
Core capital ratio* 29.7% 28.6% 10.2%
Total capital ratio* 29.7% 28.6% 11.9%
Arrears rate** 0.17% 0.24%
Repossessed properties 35 41
*Excluding Basel I floor
**Residential properties and holiday homes
Source: Nordea, Danske Bank Markets
Table 26. More info
Bond ticker: NDASS
Website www.nordea.com
Source: Danske Bank Markets
23 | 6 September 2016 www.danskeresearch.com
Da
nish
Co
vered B
on
ds
Nordea Kredit
For loans granted to recreational dwellings, industrial and craftsmen’s properties, office and
retail properties and collective energy supply plants, the guarantee covers that part of the loan
that exceeds 45% of the valuation made in conjunction with the loan origination process.
The guarantee periods begins when the loan is disbursed or remortgaged. The former guarantee
period of 10 years or 5 years for loans granted to owner-occupied, all-year and recreational
dwellings was changed to the lifetime of the loan on December 9, 2013.
As at the end of 2015 guarantees from Nordea Bank Danmark A/S covered loans worth
DKK358bn, of which guarantees amounted to DKK100bn.
The management agreement between NOR and Nordea Bank Denmark also includes the
following:
The branch that originated the mortgage is responsible for all customer handling.
NOR receives all payments from customers directly. In turn, NOR pays provisions to Nordea
Bank Denmark.
The mortgages backing the covered bonds issued by NOR are divided into different cover pools
(capital centres). According to the revised Mortgage Act, new SDROs must be issued out of
separate capital centres. Therefore, at the end of 2007, NOR closed the RO Capital Centre 1 and
subsequently grandfathered the existing series, according to the Capital Requirement Directive
(CRD) and new SDROs have been issued out of Capital Centre 2. Capital Centre 2 holds 96%
of the total mortgage book.
Cover pool and asset quality
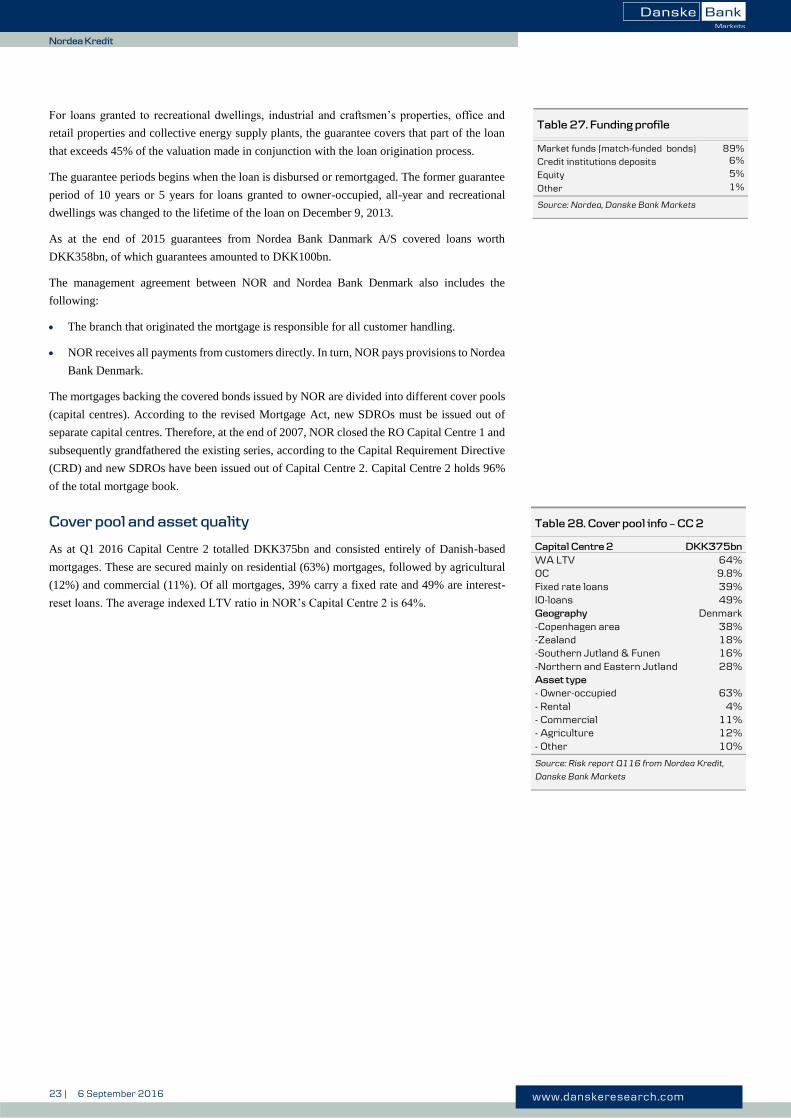
As at Q1 2016 Capital Centre 2 totalled DKK375bn and consisted entirely of Danish-based
mortgages. These are secured mainly on residential (63%) mortgages, followed by agricultural
(12%) and commercial (11%). Of all mortgages, 39% carry a fixed rate and 49% are interest-
reset loans. The average indexed LTV ratio in NOR’s Capital Centre 2 is 64%.
Table 27. Funding profile
Market funds (match-funded bonds) 89% Credit institutions deposits 6%
Equity 5%
Other 1%
Source: Nordea, Danske Bank Markets
Table 28. Cover pool info – CC 2
Capital Centre 2 DKK375bn
WA LTV 64% OC 9.8% Fixed rate loans 39% IO-loans 49% Geography Denmark -Copenhagen area 38% -Zealand 18% -Southern Jutland & Funen 16% -Northern and Eastern Jutland 28% Asset type - Owner-occupied 63% - Rental 4% - Commercial 11% - Agriculture 12% - Other 10%
Source: Risk report Q116 from Nordea Kredit,
Danske Bank Markets

24 | 6 September 2016 www.danskeresearch.com
Da
nish
Co
vered B
on
ds
Nykredit/Totalkredit
Nykredit/Totalkredit
Company profile
Nykredit Realkredit (NYK) is a wholly-owned subsidiary of Nykredit Holding. Nykredit
Holding is an unlisted holding company owned by Foreningen Nykredit (90%), Industriens
Realkreditfond (5%), Foreningen Østifterne (3%) and PRAS (2%). As a mortgage association,
NYK originated in 1851. Today, besides mortgage finance, NYK is active in retail and corporate
banking, asset management, insurance and real estate. Mortgage finance is the most important
business area. Nykredit announced in February 2016 that it is planning a stock exchange listning
which is expected to be ready within a period of 12-24 months.
In 2003 NYK acquired Totalkredit (TOT), which is currently a wholly-owned subsidiary of
NYK. Following the acquisition of TOT, NYK became the largest specialist mortgage bank in
Denmark with a current market share based on outstanding mortgages of 41.3%. There are nearly
60 partner banks in the TOT corporation network, making it crucial for the distribution of NYK
mortgages. NYK and both local and regional banks are competitors in agricultural mortgage and
non-mortgage markets. In 2008 NYK acquired Forstædernes Bank, which increased NYK’s
market share within banking to 5.2%. Forstædernes Bank has subsequently been merged with
Nykredit Bank.
Nykredit’s covered bonds issued out of Capital Centre E and H are rated AAA by S&P. Nykredit
has a A long-term rating from S&P and Fitch. For more rating details, see Chapter 4.
Financial performance
Nykredit Group reported operating profit of DKK4.7bn in 2015 – a significant increase from the
2014 level of DKK-186m. Net interest income increased from DKK11.4bn to DKK11.9bn and
loan losses and provisions decreased from DKK2.4bn to DKK0.9bn.
The core capital ratio increased from 15.4% as of end-2015 to 19.4% as of end and the total
capital ratio increased to 18.2% from 23.9%. The arrears rate (75 days) as of September 2015
was 0.39% – a fall from the 2014 level. The number of repossessed properties decreased from
356 to 159.
Business model and funding profile
NYK is a specialist mortgage bank subject to supervision by the Danish FSA. Banking, asset
management and insurance activities are carried out by wholly-owned separate subsidiaries of
NYK. As mentioned above, TOT is also a wholly-owned subsidiary of NYK. Retail and
commercial customers are offered mortgages through Nykredit’s distribution channels, which
include 54 customer centres, Nykredit.dk, mobile app downloads, a central customer services
centre and the real estate agencies of the Nybolig and Estate chains. Like NYK, TOT is a
specialist mortgage bank under the supervision of the Danish FSA.
In 1994 TOT was established as a joint mortgage bank by local and regional banks in Denmark.
Since the acquisition of TOT in 2003, NYK has developed a partnership with over 60 Danish
local and regional banks (incl. Nykredit Bank) with substantial distribution networks. Mortgage
products under the Totalkredit brand are sold through these local and regional banks. The vast
majority of growth in mortgage lending is delivered by local and regional banks.
Table 29. Ratings (M/S/F)
Covered bond rating – CC E: WR/AAA/-
Covered bond rating - CC H WR/AAA/-
Issuer rating: Baa1u/A/A
Source: Rating agencies, Danske Bank Markets
Table 30. Financial information
DKKm 2015 2014 2009 2008
Net interest income 11,877 11,353 11,230 7,866
Fees and commissions -199 52 508 108
Net gain/losses 652 -3,557 2,195 -2,921
Loan losses & provisions 920 2,351 7,919 3,390
Operating profit 4,685 -186 179 1,443
Cost/income ratio 42% 44% 62% 0.8%%
Core capital ratio 19.4% 15.4% 16.7% 69%
Total capital ratio 23.9% 18.2% 17.8% 13.5%
Arrears rate 0.39% 0.22%
Repossessed properties 159 356
Source: Nykredit, Danske Bank Markets
Table 31. More info
Bond ticker NYKRE
Website www.nykredit.com
Source: Danske Bank Markets

25 | 6 September 2016 www.danskeresearch.com
Da
nish
Co
vered B
on
ds
Nykredit/Totalkredit
Denmark is the largest market for NYK and TOT. In addition, NYK provides loans secured by
residential property in France and Spain and loans secured in commercial property in Germany
and Sweden. TOT only offers mortgages secured on residential property, while NYK’s core
markets in Denmark are in residential housing and commercial properties, which comprise loans
to customers for urban trade, agriculture and residential rental properties.
A management agreement exists between NYK/TOT and the local and regional banks. The
agreement states the following.
The branch that originated the mortgage is responsible for all handling of customers.
The bank that originated the mortgages covers all losses (LTV between 60% and 80%) on
mortgages originated by the said bank.
TOT receives all payments directly from customers. In turn, TOT pays provisions to the
banks.
Since 2006 NYK and TOT have been jointly funded, so all mortgages originated by NYK or
TOT were funded by covered bonds issued out of NYK Capital Centre D. According to the
revised Mortgage Act, new SDOs must be issued out of separate capital centres. Therefore, since
1 January 2008, NYK/TOT has issued SDOs out of a new capital centre E, with existing series
in Capital Centre D closed at the end of 2007. The series in Capital Centre D were grandfathered
according to the Capital Requirement Directive (CRD). Nykredit announced in June 2011 that
existing interest-reset and floating-rate loans – issued out of Capital Centre E – would be
refinanced in to the new capital centre H starting from the refinancing auction in September
2011. Hence, going forward, joint funding will be carried out from Capital Centre E for the fixed
rate loans and Capital Centre H for the interest-reset and floating-rate loans.
Nykredit introduced two-tier mortgaging for commercial borrowers (in 2009) and residential
borrowers (in Q2 2012), where all new loans were funded using SDO covered bonds up to a
LTV of 45% for commercial real estate and 60% for residential real estate, while the top
15%/20% were funded using RO bonds issued out of capital centres G and I. Furthermore, the
top loan had to be amortising. However, Nykredit announced in 1H 2014 that they will once
again be offering one-tier mortgaging for residential loans with a LTV up to 80% starting as of
mid-2014. This also allies for interest only loans.
Cover pool and asset quality
As at end of Q1 2016, NYK’s Cover Pool E and H totalled DKK341bn and DKK589bn,
respectively, of which 99%/92% was Danish-based mortgages. These are secured on residential
(75%/59%), agricultural (3%/8%) and commercial properties (5%/13%). The cover pools have
a weighted-average LTV of 64% and 62%, respectively. Of all mortgages in Capital Centre E,
88% carry a fixed rate whereas Capital Centre H consists of 100% ARMs.
Table 32. Funding profile
Market funds (match-funded bonds) 82% Other 6% Retail deposits 5% Equity 5% Subordinated debt 1%
Source: Nykredit, Danske Bank Markets
Table 33. Cover pool info – CC E
Capital Centre E DKK341bn
Junior covered bonds DKK5bn
WA LTV 64%
Fixed rate loans 88%
IO-loans 38%
Geography
-Copenhagen area 24%
-Remaining Zealand 12%
-Northern and Eastern Jutland
-Southern Jutland & Funen
40%
22%
-International 1%
Asset type -Owner-occupied 75% -Private rental 3% -Non-profit housing 6% -Commercial -Agriculture
5% 3%
-Other 8%
Source: Risk report Q1 16 from Nykredit, Danske
Bank Markets
Table 34. Cover pool info – CC H
Capital Centre H DKK589bn
Junior covered bonds DKK13bn
WA LTV 62%
Fixed rate loans 0%
IO-mortgages 69%
Geography
-Copenhagen area 25%
-Remaining Zealand 12%
-Northern and Eastern Jutland
-Southern Jutland & Funen
36%
19%
-International 8%
Asset type -Owner-occupied 59% -Private rental 9% -Non-profit housing 4% -Commercial -Agriculture
13% 8%
-Other 7%
Source: Risk report Q1 16 from Nykredit, Danske
Bank Markets

26 | 6 September 2016 www.danskeresearch.com
Da
nish
Co
vered B
on
ds
Realkredit Danmark
Realkredit Danmark
Company profile
Realkredit Danmark (RD) is a wholly-owned subsidiary of Danske Bank, the largest financial
institution in Denmark, originated in 1871. Today, Danske Bank is a global bank with activities
in northern Europe and the Baltic region under various brands. In 2006 Danske Bank acquired
Sampo Bank in Finland. Its main business areas are retail banking, corporate banking, asset
management, life insurance and pensions and mortgage finance.
RD was established in 1851 under the name Østifternes Kreditforening. In 2001 RD merged
with Danske Kredit A/S and BG Kredit A/S following the merger of Danske Bank A/S and
RealDanmark A/S. RD is the continuing mortgage credit arm of the Danske Bank Group and
the second-largest specialist mortgage bank in Denmark, with a loan portfolio market share of
27%. RD was the first to issue CRD-compliant covered bonds under the revised Danish Covered
Bond Act.
RD’s covered bonds issued out of Capital Centre S and T and the General Capital Centre are
rated AAA by Standard & Poor’s. Capital Centre S is rated AAA and Capital Centre T is rated
AA+ (positive outlook) by Fitch. For more rating details, see Chapter 4.
Financial performance
Realkredit Danmark reported an operating profit of DKK5.1bn in 2015, a significant increase
from DKK4.0bn in 2014. Net interest income increased from DKK7.0bn to DKK7.1bn. The
cost/income ratio decreased from 13.5% in 2014 to 12.5% in 2015. Loan losses and provisions
fell from 1.2bn to 0.4bn.
The core capital ratio increased from 34.0% as of 31 December 2014 to 38.3% as of 31
December 2015 and the total capital ratio increased from 34.5% to 38.8%. The arrears rate (three
months) for RD decreased marginally from 0.36% as at end-2014 to 0.38% as at end-2015. The
number of repossessed properties decreased from 70 to 58.
Business model and funding profile
RD is a specialist mortgage bank subject to supervision by the Danish FSA. RD’s objective is
to carry out business as a mortgage bank, including any kind of business permitted by the Danish
Mortgage Act. RD’s principal market is Denmark. In 2012 RD started issuing loans in Norway
to large corporate customers who are already customers in Danske Bank. Following the
expansion of Realkredit Danmark's geographical business area in 2012 to include Norway,
mortgage lending to selected business customers in Sweden and Norway continued in 2013.
RD’s core markets in Denmark are residential housing – defined as lending for the financing of
owner-occupied housing and holiday homes – and the corporate market, which comprises loans
to customers with property in urban trade, agriculture and residential rental property.
Table 35. Ratings (M/S/F) - RD
Covered bond rating – CC S WR/AAA/AAA Covered bond rating – CC T WR/AAA/AA+ Issuer rating -/-/A
Source: Rating agencies, Danske Bank Markets
Table 36. Financial information
DKKm 2015 2014
Net interest income 7,065 6,992 Fees and commissions 508 524
Net gains/losses 6,557 6,468
Pre-provision income 5,524 5,201
Loan losses and provisions 432 1,171
Operating profit 5,092 4,030
Cost/income ratio 12.5% 13.5%
Core capital ratio 38.3% 34.0%
Total capital ratio 38.8% 34.5%
Arrears rate 0.36% 0.38%
Repossessed properties 58 70
Source: Danske Bank and RD
Table 37. Further information
Bond ticker RDKRE Websites www.danskebank.com www.rd.dk
Source: Danske Bank

27 | 6 September 2016 www.danskeresearch.com
Da
nish
Co
vered B
on
ds
Realkredit Danmark
All mortgages included in the cover pool are distributed through the branch networks of Danske
Bank, the joint finance centres and the wholly-owned real estate agent ‘Home’ in Denmark.
Realkredit Danmark also offers customers online and self-service solutions provided at the rd.dk
and danskebank.dk websites, and Home Direct serves customers over the telephone during
extended opening hours.
A management agreement exists between RD and Danske Bank, stating the following.
The branch that originated the mortgages is responsible for all handling of customers.
Danske Bank covers all losses (with a LTV of 60-80%) on mortgages originated at Danske
Bank branches.
RD receives all payments directly from customers. In turn, RD pays provisions to Danske
Bank.
As at the end of 2015, loss guarantees issued by Danske Bank amounted to DKK58bn.
All mortgages are transparent (pass-through), which means that consumers have a delivery
option on the underlying bonds. Interest-reset loans are funded by a portfolio of fixed-rate non-
callable bonds, while other types of mortgages are funded individually by issuing bonds with
exactly the same characteristics as the mortgages.
Mortgages backing covered bonds issued by RD are divided into different cover registers
(capital centres). According to the revised Mortgage Act, new SDROs must be issued out of
separate capital centres. Therefore, since July 2007, SDROs have been issued out of Capital
Centre S. Existing RO series in the General Capital Centre have been closed since end of 2007
and are grandfathered according to the Capital Requirement Directive (CRD). RD have since
2011 issued all new interest-reset loans (ARMs) out of Capital Centre T and a large part of the
interest-reset loans in capital centre S have been refinanced into the new Capital Centre T,
starting from the refinancing auctions set for December 2011. Today the majority of the entire
mortgage book is included in Capital Centre S and T.
Cover pool and asset quality
As at end Q1 2016, the cover pool for Capital Centre S and T totalled DKK222bn and
DKK465bn, respectively. These are secured on private (67% and 55%), rental residential (20%
and 16%) and commercial mortgages (9% and 21%). Of the assets in capital centre S, 88% carry
a fixed interest rate whereas the assets in capital centre T only consist of ARM and floating rate
loans. The IO loans in Capital Centre S and T amount to 28% and 59%, respectively.
Geographically, the pool is well diversified across Denmark, with 40% and 38%, respectively,
of the loan portfolio located in the Metropolitan area. As of the end of Q1 2016, the average
LTV ratio for capital centre S and T was 61 and 63%, respectively. The LTV is capped at 80%
for residential and 60% for commercial mortgages.
Table 38. Funding profile
Market funds 91%
Equity 6%
Corporate deposits 2%
Other 1%
Source: Danske Bank
Table 39. Cover pool info – CC S
Capital Centre S DKK222bn
Junior covered bonds DKK2bn
WA Indexed LTV 61% LTV
LTV > 80% 16.6%
OC 8.4%
IO-mortgages 28%
Fixed rate loans 88%
Geography Primarily
Denmark
- Metropolitan area 40%
- Other Zealand 17%
- Western region 24%
- Southern region 19%
- Other area 0%
Asset type - Private 67% - Rental residential 20% - Commercial 9% - Agriculture 3%
Source: Risk report Q1 16 from Realkredit
Danmark
Table 40. Cover pool info – CC T
Capital Centre T DKK465bn
Junior covered bonds DKK16bn
WA Indexed LTV 63% LTV
LTV > 80% 17.1%
OC (mandatory) 8.3%
IO-mortgages 59%
Fixed rate loans 0%
Geography Primarily
Denmark
- Metropolitan area 38%
- Other Zealand 16%
- Western region 24%
- Southern region 18%
- Other area 4%
Asset type - Private 55% - Rental residential 16% - Commercial 21% - Agriculture 9%
Source: Risk report Q1 16 ffrom Realkredit
Danmark

28 | 6 September 2016 www.danskeresearch.com
Da
nish
Co
vered B
on
ds

29 | 6 September 2016 www.danskeresearch.com
Finn
ish C
overed
Bo
nd
s
Finnish Covered Bonds
Background
In December 1999, the Finnish parliament passed the Act on Finnish mortgage banks (MB).
However, there were several amendments before the first Kiinteistövakuudellinen
joukkovelkakirjalaina (mortgage bonds) were issued in 2004.
In October 2000, amendments were made to the initial act. The primary goal was to clarify investor
rights in the event of default, by including the provisions on insolvency proceedings. Furthermore,
the amount of substitution assets was capped at 20%.
In January 2003, the Mortgage Act was again revised in order to strengthen its effectiveness.
The main amendments included the introduction of ALM requirements, as well as the
introduction of a 10% cap on commercial loans.
Aktia Real Estate Mortgage Bank (now Aktia Bank plc – Aktia MB) was the first issuer of
covered bonds in June 2004, with Sampo Housing Loan Bank (now Danske Bank plc) following
suit in 2005 with the first Finnish benchmark-sized covered bond. At end-May 2007, OP Bank
Group Mortgage Bank (OP MB) became Finland’s third issuer with an inaugural five-year
EUR1bn issue.
In 2010, the Finnish Mortgage Act was subject to a larger revision, allowing for the issuance of
katettu joukkolaina (covered bonds). The changes and clarifications that came into effect on 1
August 2010 include the following.
Abandoning the specialist bank principle.
Maximum LTV for residential mortgages was raised from 60% to 70% (commercial lending
unchanged at 60%).
Derivatives counterparties now rank pari passu with covered bondholders.
One cover pool for both mortgages and public loans instead of separate cover pools.
Cash can be used as substitute assets but substitute assets are still limited to 20% of the total
cover pool.
The share of loans with LTV ratios above 60% is no longer restricted to one-sixth of the
issuer’s mortgage portfolio.
Clarification of the administrator’s rights post default, including the possibility of raising
liquidity (the insolvency process will be written directly into the covered bond act instead
of relying on references to, for example, the general banking law).
Following the abandoning of the specialist banking principle in 2010, Nordea Bank Finland
introduced the first covered bond programme from a universal bank, launching its inaugural
issue in November that year. Furthermore, in 2010, Danske Bank decided to revive its Sampo
Housing Loan Bank Covered Bond programme (now Danske Bank plc) after it had been
dormant for more than four years.
Finnish Covered Bonds
Katettu joukkolaina
30 | 6 September 2016 www.danskeresearch.com
Finn
ish C
overed
Bo
nd
s
Finnish Covered Bonds
Recent developments in the Finnish covered bond market
In Nordic Covered Bond Handbook 2015, 31 August 2015, we included four Finnish issuers but
with ongoing activity in the market we introduce Bank of Åland and the Mortgage Society of
Finland (Hypo) in this publication. Bank of Åland has been active since 2012 and for the first
time issued a EUR250m covered bond in May 2015, which was its largest issue size so far. The
Hypo had its premiere in May 2016 issuing a EUR250m bond, and the issuer has stated its
intention that at least one deal a year will follow. Further in March this year, the Central Bank
of Savings Banks of Finland updated its EMTN base prospectus, in which it stated that a separate
mortgage bank, SP-Mortgage Bank plc, had received authorisation from the ECB. The mortgage
bank was established for future covered bond issuances, which underlines the lively activity in
the Finnish covered bond market and the potential for more issuers in the future.
Nordea Bank Finland (NBF) has published plans to merge into its parent Nordea Bank AB in
March 2016. As a consequence, a Finnish mortgage bank will be established to take over the
Finnish banking operations but will transfer the banking business into a Finnish branch once the
demerger of the business and the subsequent (cross-border) merger of NBF is completed.
However, the covered bond business will remain at the newly established Finnish mortgage
bank, which also has to obtain a credit bank licence in order to be able to continue as a covered
bond issuer. The original plans stated the restructuring would start in July 2016 but Nordea has
postponed the process and expects the procedure to start during the second half of 2016.
Key elements of the Mortgage Act
As in Denmark and Sweden, the specialist banking principle has been abandoned and
universal banks can obtain a licence to issue covered bonds. Collateral assets may include
residential and commercial mortgages, public loans, derivatives and substitute assets. The
amount of commercial assets is typically limited at 10% of the cover pool (unless stated
otherwise in the covered bond terms).
Up to 20% of substitution assets is allowed but only on a temporary basis. The act does not
allow for ABS/RMBS to be included in the cover pool. Consistent with UCITS 52(4)
requirements, the issuer will be subject to special public supervision. The issuer must keep a
cover register of collateral (including open hedge positions) and bonds issued. So far, only
mortgage-backed covered bonds have been issued. Non-performing loans more than 90 days in
arrears cannot be taken into account when performing coverage/matching calculations but may
remain in the pool.
Further, LTV ratio limits are 70% for mortgage and 60% for commercial loan. Loans with
LTV ratios up to 100% are allowed in the cover pool but only the part within LTV ratio limits
will be accounted for in coverage/matching calculations. In the event of an issuer default, the
covered bondholder’s priority right applies only to the part of the loan that falls within the LTV
ratio limits.
The valuation of cover assets must be carried out prudently and any assessment must be on an
individual basis. Properties in the cover asset pool must be valued on an ongoing basis:
commercial properties every year and residential properties every third year. Eventually, if LTV
ratio limits are breached, the issuer is obliged to include substitution assets in the cover pool.
In respect of ALM requirements, the law states that the value of the cover pool, including
derivatives, must exceed the value of outstanding bonds issued. Bonds, loans, substitute assets
and derivatives must be calculated at book value. No nominal minimum over-collateralisation
is required. However, on a net present value basis, 2% over-collateralisation is required by
law. Further, aggregate interest income from the cover pool must at all times be greater than or
equal to the interest due on outstanding covered bonds over the following 12 months, while

31 | 6 September 2016 www.danskeresearch.com
Finn
ish C
overed
Bo
nd
s
Finnish Covered Bonds
taking into account the possibility of a +/-100bp shift in the yield curve. No currency risk is
accepted (hedging allowed).
Asset segregation is secured through the cover register. Regarding bankruptcy proceedings,
the preferential right to cover assets is explicitly stipulated. Therefore, in the event of mortgage
bank insolvency, bondholders have a statutory preferential right to the cover pool. Swap
counterparties rank pari passu with bondholders respecting claims on the cover pool.
The law explicitly defines the mandatory procedures to be followed in the event of bankruptcy
as well as those necessary to ensure punctual payments. As in Germany, after an issuer has been
placed in liquidation or declared bankrupt, the Finnish FSA is required to appoint an attorney to
supervise the interests of bondholders. Note that an issuer default does not prompt an
acceleration of covered bonds or a determination of derivative contracts. The attorney shall in
particular supervise the management of funds placed as collateral for bonds and their conversion
into cash as well as contractual payments to be made to bondholders. A bankruptcy trustee shall,
if required by an attorney, conclude derivatives contracts necessary to hedge against risks
relating to bonds and sell collateral for the bond in order to fulfil the obligations relating to the
bond. In addition, the trustee may, by permission of the attorney, transfer liability for a bond and
funds placed as its collateral to another mortgage bank. The trustee may convey the collateral
for a bond only after the trustee has obtained permission from the FSA. Should funds prove
insufficient to honour the bondholder’s claims, the covered bonds will accelerate. Any
unfulfilled claim will rank pari passu with other creditors.
The issuer should continually ensure that the remaining average maturity of the covered bonds
is shorter than the remaining average maturity of the cover assets. The average term to maturity
is calculated as the present-value-weighted average of the terms to maturity of a contract’s
remaining (nominal) cash flows (derivative contracts included).
In Table 41, we provide an overview of the relative strengths and weaknesses of the Finnish
covered bond framework, as outlined by Moody’s in ‘Finland– Legal Framework for Covered
Bonds’, published on 3 July 2015.
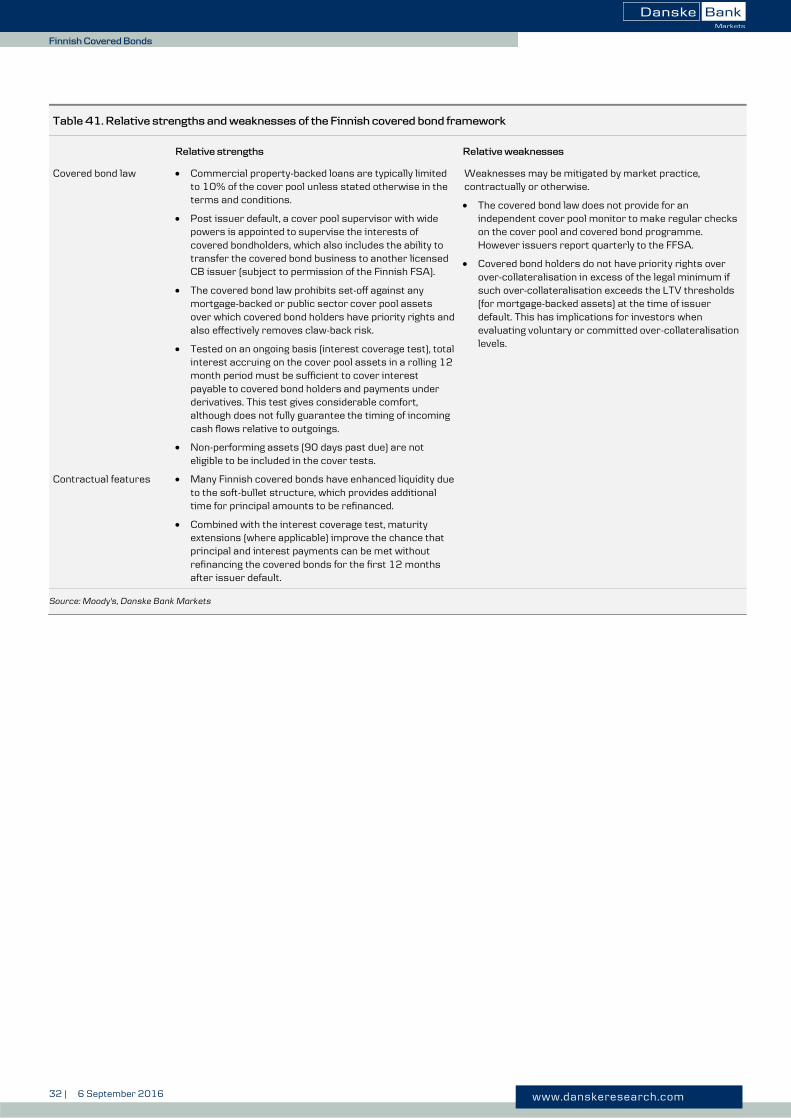
32 | 6 September 2016 www.danskeresearch.com
Finn
ish C
overed
Bo
nd
s
Finnish Covered Bonds
Table 41. Relative strengths and weaknesses of the Finnish covered bond framework
Relative strengths Relative weaknesses
Covered bond law Commercial property-backed loans are typically limited to 10% of the cover pool unless stated otherwise in the terms and conditions.
Post issuer default, a cover pool supervisor with wide powers is appointed to supervise the interests of covered bondholders, which also includes the ability to transfer the covered bond business to another licensed CB issuer (subject to permission of the Finnish FSA).
The covered bond law prohibits set-off against any mortgage-backed or public sector cover pool assets over which covered bond holders have priority rights and also effectively removes claw-back risk.
Tested on an ongoing basis (interest coverage test), total interest accruing on the cover pool assets in a rolling 12 month period must be sufficient to cover interest payable to covered bond holders and payments under derivatives. This test gives considerable comfort, although does not fully guarantee the timing of incoming cash flows relative to outgoings.
Non-performing assets (90 days past due) are not eligible to be included in the cover tests.
Weaknesses may be mitigated by market practice, contractually or otherwise.
The covered bond law does not provide for an independent cover pool monitor to make regular checks on the cover pool and covered bond programme. However issuers report quarterly to the FFSA.
Covered bond holders do not have priority rights over over-collateralisation in excess of the legal minimum if such over-collateralisation exceeds the LTV thresholds (for mortgage-backed assets) at the time of issuer default. This has implications for investors when evaluating voluntary or committed over-collateralisation levels.
Contractual features Many Finnish covered bonds have enhanced liquidity due to the soft-bullet structure, which provides additional time for principal amounts to be refinanced.
Combined with the interest coverage test, maturity extensions (where applicable) improve the chance that principal and interest payments can be met without refinancing the covered bonds for the first 12 months after issuer default.
Source: Moody's, Danske Bank Markets

33 | 6 September 2016 www.danskeresearch.com
Finn
ish C
overed
Bo
nd
s
Finnish Covered Bonds
Issuers and credit quality
Table 42. Cover pool overview as of Q1 16-Q2 16
Aktia Bank plc Bank of Åland Danske Bank plc
Cover pool (EURbn) 2.1 1.2 6.3 Avg. loan size (EUR) 61,000 79,000 69,000 WA indexed LTV 56% 56% 54% WA seasoning 33 months N/A 62 months* Interest-only loans <1%* 20% 5% Fixed-rate loans 8% 70% 14% Geography 100% Finland 100% Finland 100% Finland South (73%), West (25%) South (48%), West (30%)
Åland islands (19%)
Uusimaa (47%), Pirkanmaa (8%)
Varsinais-Suomi (5%), N. Ostrob. (5%)
Residential 100% 100% 100% Public sector Commercial Mortgage Society of Finland Nordea Finland OP Mtg Bank
Cover pool (EURbn) 0.4 21.3 10 Avg. loan size (EUR) 134,000 63,000 54,000 WA indexed LTV 34% 52% 48% WA seasoning 42 months** 65 months* 65 months* Interest-only loans <1% 8% <1% Fixed-rate loans 1% 3% 1% Geography 100% Finland 100% Finland 100% Finland Uusimaa (73%), Pirkanmaa (8%)
Varsinais-Suomi (7%)
Helsinki (40%), Pirkanmaa (10%),
Varsinais-Suomi (7%)
Uusimaa (29%), Pirkanmaa (10%)
Varsinais-Suomi (11%), N. Ostrob. (9%)
Residential 100% 99% 100% Public sector 1.2% Commercial 0.4%
* Moody's deal performances
** Standard & Poor’s New Issue report
Source: Company data, Moody’s, Standard & Poor’s, Danske Bank Markets
Table 43. Ratings overview
Rating (Moody’s/S&P/Fitch) Moody's S&P
Covered bond Issuer/parent TPI C-score CB anchor Unused uplift
Aktia Bank plc Aaa / - / - A3(p) / A-(n) / - Prob.-High 5.4% A2(cr) + 1 Bank of Åland - / AAA / - - / BBB(n) / - 1 notch Danske Bank plc Aaa / - / - A2 / A / - Prob.-High 5.0% Aa3(cr) + 1 Mortg. Society of Finland - / AAA / - - / BBB(n) / - 1 notch Nordea Finland Aaa / - / - Aa3 / AA-(n) / AA- Probable 5.2% Aa2(cr) + 1 OP Mtg Bank Aaa / AAA / - Aa3 / AA-(n) / - Prob.-High 5.0% Aa2(cr) + 1 2 notches
Source: Moody’s, Standard & Poor’s, Fitch, Danske Bank Markets

34 | 6 September 2016 www.danskeresearch.com
Finn
ish C
overed
Bo
nd
s
Finnish Covered Bonds
Outlook for the Finnish economy
The Finnish economy has finally lifted away from the recession into which Finland sank in the
aftermath of the financial crisis. GDP increased by 1.6% year-on-year in the first quarter of
2016. Yet, GDP is still more than 5% below the peak reached before the crisis. Growth has been
driven by consumption and housing construction, while goods exports fell. The outlook for the
latter part of 2016 is modestly positive as confidence indicators have improved and export
markets are growing. However, we do not expect growth to accelerate much, because there are
several restraints.
Finland is struggling with external and internal challenges. Low investment activity in the euro
area and declining demand for printing paper have kept Finnish manufacturing orders under
pressure. Finnish competitiveness has also been an issue in the European markets, because
labour costs have risen faster than in many other countries. Also, a recession in the Russian
economy has hit Finnish exports. In addition to these external difficulties, Finland is under
pressure from domestic factors. The poor performance of the electrotechnical industry and
structural change in the forest industry have left a large gap in manufacturing employment.
Recently service industries have started to perform better. As a long-run issue, an aging
population has diminished the economy’s growth potential. According to the latest estimates,
the size of the working-age population began to decline in 2010 and will continue on a downward
path until the mid-2020s. Ageing is also weighing on the public sector, which has to find savings.
External factors are slowly improving thanks to economic growth in the euro area and the US,
while Russia might bottom out in 2017. A new competitiveness pact between labour market
participants improves competitiveness by freezing wages for a year, making employees liable
for a larger share of social security payments, increasing annual working hours by 24 hours
without any impact on wages, cutting public sector holiday bonuses and adding some flexibility
to local agreements. The competitiveness pact is estimated to cut unit labour costs by 3.7%,
which, together with higher wage increases in other countries such as Germany, boosts price
competiveness a fair amount by the end of 2017. The pact should have a positive impact on
exports and capex.
Domestic demand has proven stronger than expected but we still expect austere fiscal policy and
a slow improvement in purchasing power to dent consumption in 2017. The public deficit has
improved to some extent but debt continues to grow and the government is running austere fiscal
policy. We expect GDP to grow 1.2% in 2016 and 1.3% in 2017. In our view, the unemployment
rate should fall below 9% in 2017 at the latest. However, despite the sluggish outlook, the
Finnish economy has several strengths: well-capitalised banks, low interest rates and healthy
corporate balance sheets have helped to endure the crisis.
The housing market survived the downturn relatively well. Thanks to low rates and an improving
economic outlook, prices of old flats and terraced houses increased by 1.7% y/y in April. Private
buyers and various funds have kept up activity in larger cities, while markets are weaker in towns
with shrinking populations. Credit channels remain open and loan stocks are growing, albeit
slowly. Low rates and improving employment keep conditions favourable for housing markets
in the near future.
Chief Economist Pasi Petteri Kuoppamäki +358 (0)50 424 0025 [email protected]

35 | 6 September 2016 www.danskeresearch.com
Finn
ish C
overed
Bo
nd
s

36 | 6 September 2016 www.danskeresearch.com
Finn
ish C
overed
Bo
nd
s
Aktia Bank plc
Aktia Bank plc
Katettu joukkolaina
Company profile
Aktia Bank plc (Aktia) is the issuer of covered bonds within the Aktia Group, replacing Aktia
Real Estate Mortgage Bank (Aktia REMB), which has been placed in run-off mode.
In March 2013, the Finnish FSA granted Aktia a licence to act as a mortgage bank under the Act on
Mortgage Credit Bank Operations and issue covered bonds. All covered bond issuance will be done
directly from Aktia’s balance sheet, through the new EUR3bn covered bond and medium-term note
programme. As it is in run-off mode, Aktia REMB’s existing programme will focus solely on
maintenance and refinancing of the loan portfolio. While in run-off mode, all owners (including POP
and savings banks, who own 49.1% of Aktia REMB) are committed to maintaining the cover pool
quality and ensuring that Aktia REMB continues to meet all legal requirements.
Under Aktia’s new covered bond programme, the cover pool will comprise only Aktia-
originated assets (mortgages and shares in housing associations) – the POP and savings banks
that were part of Aktia REMB will no longer rely on the Aktia Group for mortgage funding.
At a parent level, with approximately EUR10bn in total assets, Aktia services its 300,000
customers through 50 branches in the larger cities in Finland, the coastal areas and selected
inland growth centres. It has a 4.1% share of the mortgage market and a 3.8% share of deposits.
Further, Aktia offers both internet and telephone banking services.
Aktia offers a wide range of products including asset management, real estate services and life
and non-life insurance but the main pillar of its operations is its banking business, which
accounted for EUR51m of the EUR68m in operating profits in 2014. Following its break with
the POP and savings banks, Aktia holds a 3.8% market share of Finnish household lending.
Aktia Bank is the fourth largest bank in the Finnish retail market, with focus on growth areas in
Finland such as the Helsinki Metropolitan Area, the coastal area and selected inland growth
centres. With regard to segments, households account for 88% of the loan portfolio and 77% of
the deposit stock.
In 2013, Aktia plc merged into Aktia Bank plc and all assets and liabilities of Aktia plc transferred
to Aktia Bank plc (now the group parent). The aim of the merger was to achieve a more streamlined
group structure as changing regulation and rating criteria favour an approach in which the universal
bank with a solid balance sheet operates as the issuer of covered bonds. In itself, the merger will
not influence any of the group’s business areas.
Financial performance
Year-on-year Aktia’s operating profit decreased by EUR4m to EUR64m in 2015. Net
commission income increased by 7% to EUR80m (2014 EUR75m). Due to low interest rates,
net interest income decreased by 5%, amounting to a total of EUR97m (2014 EUR103m). Net
interest income from traditional borrowing and lending operations improved by 22% to
EUR57m (2014 EUR47m), while income from interest rate risk management and hedging
measures fell. Total capitalisation increased to 27.1% (2014 19.1%) and the tier 1 ratio rose to
20.7% (2014 14.6%) due to the new IRB approach.
Table 44. Ratings
(Moody's/S&P/Fitch)
Covered bond rating Aaa / - / -
Issuer rating A3(p) /A-(n)/ - Moody's C-score 5.4%
Moody's TPI Probable-High
Moody's CB anchor A2(cr) + 1
(p) = positive outlook
Source: Moody’s, Danske Bank Markets
Table 45. Financial information
EURm 2015 2014
Net interest income 97 103 Net commission 80 75
Net gain/losses 4 7
Operating income 208 212
Operating expenses 144 144
Impairments & writedowns 0.3 2
Operating profit 64 68
Cost/income ratio 69% 68%
Total capital ratio* 27.1% 19.1%
Tier 1 capital ratio* 20.7% 14.6%
* 2014 STD/2015 IRB
Source: Aktia Bank plc annual report 2015
Table 46. More info
Ticker AKTIA Website aktia.fi
Source: Danske Bank Markets

37 | 6 September 2016 www.danskeresearch.com
Finn
ish C
overed
Bo
nd
s
Aktia Bank plc
Business model and funding profile
At a group level, Aktia is funded mainly via deposits and the issuance of debt securities,
accounting for approximately 40% and 31% of total funding respectively. Market funding is
done mainly through Aktia’s existing covered bond programmes, accounting for approximately
22% of total funding.
Previously, Aktia REMB was responsible for both the distribution (together with the POP and
savings banks) and funding of mortgages. Following the transformation of Aktia into the main
(and listed) entity of the Aktia group, Aktia now has the responsibility of granting and funding
mortgages. The collaboration with the smaller POP and savings banks will no longer be
effective. All Aktia’s covered bond issuance will be done directly from Aktia’s balance sheet
and will be backed solely by assets originated by Aktia itself.
Aktia holds a liquidity buffer covering at least 12 months liquidity outflow, equivalent to
EUR2.3bn. According to the Q1 16 investor report, the group’s liquidity buffer covered
approximately 36 months of outflow. The portfolio comprises 52% covered bonds, 29% state-
guaranteed bonds and supra-nationals, 14% investments in banks and 3% in corporate bonds.
Cover pool and asset quality
As at end-March 2016, Aktia’s cover pool stood at EUR2.127bn. With three outstanding covered
bonds of a total of EUR1,500m at the cut-off date, this is equivalent to 41.8% of over-
collateralisation. On 31 March 2015, Aktia Bank issued its latest benchmark covered bond which
is a 7Y bond, amounts to EUR500m and pays a coupon of 0.25%. The nominal over-
collateralisation is still well above Aktia’s committed 10% minimum over-collateralisation and
comfortably above Moody’s most recently published 7% requirement for Aktia to maintain its
‘Aaa’ rating.
The cover pool holds solely Finnish prime residential mortgage loans, carrying mostly floating
rates (92%). The loans are concentrated in southern (73%) and western (25%) Finland. The
weighted-average LTV is 56% (indexed 56%) and there are no non-performing loans in the pool.
Table 47. Funding profile
Total balance EUR9.9bn
Deposits, public 5% Deposits, credit inst. 40%
Debt securities 31%
- Covered bonds 22%
Subord. debt 2%
Equity 6%
Other 16%
Source: Aktia Bank plc annual report 2015,
Danske Bank Markets
Table 48. Cover pool info
Cover pool EUR2.127bn
OC (committed) 41.8% (10%) Avg. loan balance EUR61,000
Type of loans 100% residential
NPLs (>90D in arrears) None
WA seasoning 33 months
WA LTV 56%
WA indexed LTV 56%
Floating rate loans 92%
Geography 100% Finland
- South 73%
- Western 25%
Source: Aktia Bank plc cover pool report Q1 16

38 | 6 September 2016 www.danskeresearch.com
Finn
ish C
overed
Bo
nd
s
Bank of Åland plc
Bank of Åland plc
Katettu joukkolaina
Company profile
The Bank of Åland (Ålandsbanken) operates on the Åland Islands, the Finnish mainland and in
Sweden. Its main business focus is entrepreneurs, wealthy families and individual customers with
sound finances, to whom it offers private and premium banking services. However, in its home
region, the Åland Islands, Ålandsbanken maintains a more retail banking-oriented focus. It offers a
full product range to its customers in all of its branches, provided by 663 employees.
Ålandsbanken had total assets of EUR4.6bn as of end-2015. The size of the loan book equalled
EUR3.6bn, of which the private segment accounts for around two-thirds. Of this amount, loans to
households account for around 50%, creating a solid foundation for the bank, as losses in this
segment are typically lower than in the corporate segment.
There is some concentration risk in the loan book, as the degree of diversification in terms of
geography and client segments is limited, also noted by S&P. However, operations on the Finnish
mainland and in Sweden increase diversification. Currently, approximately 70% of Ålandsbanken’s
loan portfolio is located in Finland, while the remainder is in Sweden. According to the annual report,
growth in 2015 derived predominantly from the home mortgage loan segment and tenant-owned co-
operative housing associations, which comprise the bank’s specially selected growth area in Sweden.
Ålandsbanken is rated ‘BBB’ (negative outlook) by S&P, reflecting the view that Finland's weak
economic recovery could hamper the banking sector's performance over the next two years,
which could have a negative impact on Finnish banks, including Ålandsbanken.
Financial performance
During 2015, Ålandsbanken improved the bank’s net operating profit by 35% (EUR7.9m) to
EUR30.3m. These earnings represented a 12.0% return on equity after taxes, which exceeded
the bank’s long-term target. Despite a continued decline in market interest rates, net interest
income improved to EUR54m compared with EUR49m at end-2014. Three factors counteracted
falling market rates for Ålandsbanken: higher volume, improved margins and declining costs of
funding in issuing covered bonds.
Fees and commissions came in at EUR46.5m, marking a slight increase from 2014’s EUR46.2m.
In terms of asset quality, loan losses rose somewhat from low levels in 2014 and ended up at
EUR3m, equivalent to a loan loss level of 0.09% of loans outstanding. Capitalisation improved
as Tier 1 capital stood at 11.9% (2014 10.9%) and the total capital ratio stood at 12.9% (2014
12.1%).
Table 49. Ratings
(Moody's/S&P/Fitch)
Covered bonds - / AAA / -
Issuer/parent - / BBB(n) / - S&P unused notches: 1
(n) = negative outlook
Source: Standard & Poor’s
Table 50. Financial information
(group)
EURm 2015 2014
Net interest income 54.0 49.3 Fees & commissions 46.5 46.2
Operating income 124.9 120.6
Total expenses 91.6 96.4
Profit before impairments 33.3 24.2
Loan losses & provisions 3.0 1.8
Net operating profit 30.3 22.4
Profit after tax 24.3 17.6
Loan loss level 0.09% 0.06%
Cost/income ratio 73% 80%
Tier 1 capital ratio 11.9% 10.9%
Total capital ratio 12.9% 12.1%
Source: Ålandsbanken annual report 2015
Table 51. More information
Bond ticker AABHFH Website alandsbanken.fi
Source: Danske Bank Markets

39 | 6 September 2016 www.danskeresearch.com
Finn
ish C
overed
Bo
nd
s
Bank of Åland plc
Funding profile
Ålandsbanken benefits from a strong deposit base and demand deposits, time deposits and
certificates of deposits from core private customers and their companies remain the main funding
source. At end-2015, liabilities to the public accounted for 55% of the bank’s total balance.
In order to diversify funding sources and secure cost-effective long-term financing,
Ålandsbanken established its original covered bond programme in early 2012. The inaugural
issue was launched in September 2012. Since then, both EUR- and SEK-denominated covered
bonds have been issued. Covered bonds are the main long-term funding instrument for
Ålandsbanken.
With its updated prospectus dated 30 September 2015, Ålandsbanken’s Euro Medium Term
Note and Covered Bond Programme had a scope of EUR2bn. Moreover, Ålandsbanken
maintains two separate cover pools: (1) ‘the FIN cover pool’ containing Finnish EUR-
denominated mortgages issued by Ålandsbanken’s Finnish branches (this is the original cover
pool) and (2) ‘the SWE pool’ containing Swedish SEK-denominated mortgages issued by the
Swedish branches. All covered bonds are issued under the Finnish Covered Bond Act and
maintained in a separate register in accordance with the Act.
In order to mitigate liquidity risk, Ålandsbanken maintains a liquidity reserve of a total amount
of EUR805m as of end-2015. The reserve comprises primarily cash, account balances and
investments with other banks, liquid interest-bearing securities plus holdings of unencumbered
covered bonds issued by the bank.
Cover pool and asset quality
As of June 2016, Ålandsbanken’s Finnish cover pool amounted to EUR1.2bn, comprised
entirely of Finnish residential mortgages, backing EUR859m outstanding covered bonds. Hence,
nominal over-collateralisation was 40%, while over-collateralisation on a net present value basis
stood at 43%. In line with Finnish covered bond legislation, Ålandsbanken has to maintain a
minimum over-collateralisation of 2% at all times.
Mortgages are all secured on properties located in Finland, with a focus on major cities Helsinki
(47%), Tampere (13%) and Turku (14%). The loans have an average size of EUR79,000 and an
average loan-to-value ratio of 56%. Most of the mortgages are at fixed rates (70%). Most are
also amortising, as 20% of the mortgages are interest only. The cover pool does not include any
loans in arrears.
The Swedish cover pool amounted to SEK3bn as of Q2 16. The weighted average LTV is 58%
and the assets are 100% residential and all located in Sweden.
Table 52. Funding profile
Total balance EUR4,602m
Liabilities to fin. inst. 7% Liabilities to the public 55%
Debt securities 31%
- Covered bonds 21%
Equity 5%
Other liabilities 3%
Source: Ålandsbanken annual report 2015,
Danske Bank Markets
Table 53. Cover pool info (FIN)
Cover pool EUR1.2bn
Outstanding covered bonds EUR859m OC nom. (legal) 40% (2%)
Avg. loan size EUR79,000
WA LTV 56%
WA seasoning N/A
Fixed rate assets 70%
Interest-only assets 20%
NPL (>90d in arrears) None
Asset type
- Single-family housing & flats 99.2%
- Multi-family housing 0.8%
Geography 100% Finland
- Helsinki 47%
- Tampere 13%
- Turku 14%
- South 48%
- West 30%
- Åland Islands 19%
- Other 3%
Source: Ålandsbanken investor presentation and
cover pool report June 2016
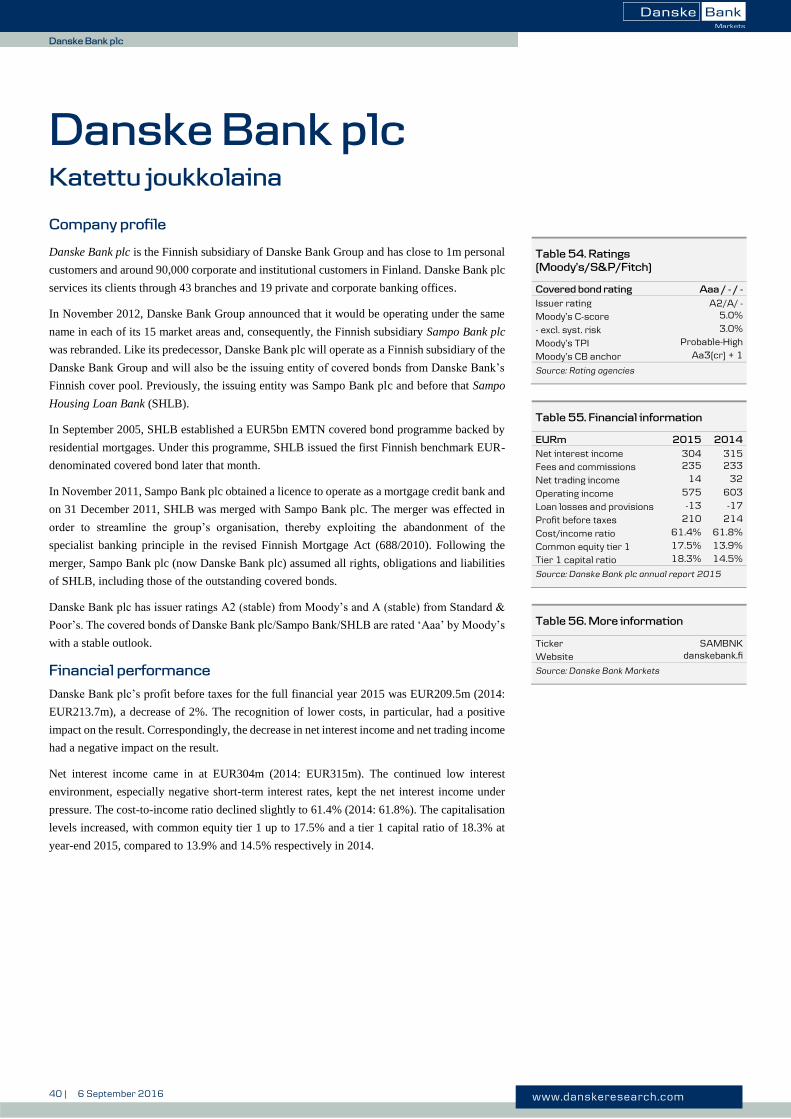
40 | 6 September 2016 www.danskeresearch.com
Finn
ish C
overed
Bo
nd
s
Danske Bank plc
Danske Bank plc
Katettu joukkolaina
Company profile
Danske Bank plc is the Finnish subsidiary of Danske Bank Group and has close to 1m personal
customers and around 90,000 corporate and institutional customers in Finland. Danske Bank plc
services its clients through 43 branches and 19 private and corporate banking offices.
In November 2012, Danske Bank Group announced that it would be operating under the same
name in each of its 15 market areas and, consequently, the Finnish subsidiary Sampo Bank plc
was rebranded. Like its predecessor, Danske Bank plc will operate as a Finnish subsidiary of the
Danske Bank Group and will also be the issuing entity of covered bonds from Danske Bank’s
Finnish cover pool. Previously, the issuing entity was Sampo Bank plc and before that Sampo
Housing Loan Bank (SHLB).
In September 2005, SHLB established a EUR5bn EMTN covered bond programme backed by
residential mortgages. Under this programme, SHLB issued the first Finnish benchmark EUR-
denominated covered bond later that month.
In November 2011, Sampo Bank plc obtained a licence to operate as a mortgage credit bank and
on 31 December 2011, SHLB was merged with Sampo Bank plc. The merger was effected in
order to streamline the group’s organisation, thereby exploiting the abandonment of the
specialist banking principle in the revised Finnish Mortgage Act (688/2010). Following the
merger, Sampo Bank plc (now Danske Bank plc) assumed all rights, obligations and liabilities
of SHLB, including those of the outstanding covered bonds.
Danske Bank plc has issuer ratings A2 (stable) from Moody’s and A (stable) from Standard &
Poor’s. The covered bonds of Danske Bank plc/Sampo Bank/SHLB are rated ‘Aaa’ by Moody’s
with a stable outlook.
Financial performance
Danske Bank plc’s profit before taxes for the full financial year 2015 was EUR209.5m (2014:
EUR213.7m), a decrease of 2%. The recognition of lower costs, in particular, had a positive
impact on the result. Correspondingly, the decrease in net interest income and net trading income
had a negative impact on the result.
Net interest income came in at EUR304m (2014: EUR315m). The continued low interest
environment, especially negative short-term interest rates, kept the net interest income under
pressure. The cost-to-income ratio declined slightly to 61.4% (2014: 61.8%). The capitalisation
levels increased, with common equity tier 1 up to 17.5% and a tier 1 capital ratio of 18.3% at
year-end 2015, compared to 13.9% and 14.5% respectively in 2014.
Table 54. Ratings
(Moody’s/S&P/Fitch)
Covered bond rating Aaa / - / -
Issuer rating A2/A/ - Moody’s C-score 5.0%
- excl. syst. risk 3.0%
Moody’s TPI Probable-High
Moody’s CB anchor Aa3(cr) + 1
Source: Rating agencies
Table 55. Financial information
EURm 2015 2014
Net interest income 304 315 Fees and commissions 235 233
Net trading income 14 32
Operating income 575 603
Loan losses and provisions -13 -17
Profit before taxes 210 214
Cost/income ratio 61.4% 61.8%
Common equity tier 1 17.5% 13.9%
Tier 1 capital ratio 18.3% 14.5%
Source: Danske Bank plc annual report 2015
Table 56. More information
Ticker SAMBNK Website danskebank.fi
Source: Danske Bank Markets
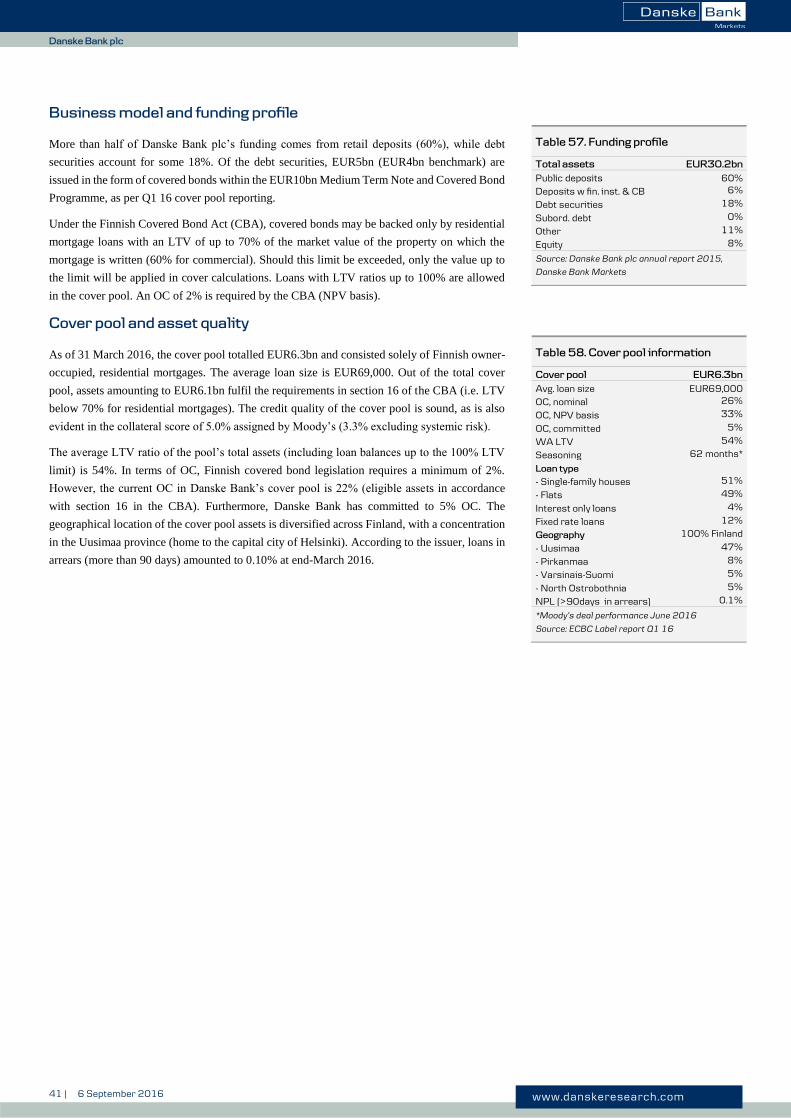
41 | 6 September 2016 www.danskeresearch.com
Finn
ish C
overed
Bo
nd
s
Danske Bank plc
Business model and funding profile
More than half of Danske Bank plc’s funding comes from retail deposits (60%), while debt
securities account for some 18%. Of the debt securities, EUR5bn (EUR4bn benchmark) are
issued in the form of covered bonds within the EUR10bn Medium Term Note and Covered Bond
Programme, as per Q1 16 cover pool reporting.
Under the Finnish Covered Bond Act (CBA), covered bonds may be backed only by residential
mortgage loans with an LTV of up to 70% of the market value of the property on which the
mortgage is written (60% for commercial). Should this limit be exceeded, only the value up to
the limit will be applied in cover calculations. Loans with LTV ratios up to 100% are allowed
in the cover pool. An OC of 2% is required by the CBA (NPV basis).
Cover pool and asset quality
As of 31 March 2016, the cover pool totalled EUR6.3bn and consisted solely of Finnish owner-
occupied, residential mortgages. The average loan size is EUR69,000. Out of the total cover
pool, assets amounting to EUR6.1bn fulfil the requirements in section 16 of the CBA (i.e. LTV
below 70% for residential mortgages). The credit quality of the cover pool is sound, as is also
evident in the collateral score of 5.0% assigned by Moody’s (3.3% excluding systemic risk).
The average LTV ratio of the pool’s total assets (including loan balances up to the 100% LTV
limit) is 54%. In terms of OC, Finnish covered bond legislation requires a minimum of 2%.
However, the current OC in Danske Bank’s cover pool is 22% (eligible assets in accordance
with section 16 in the CBA). Furthermore, Danske Bank has committed to 5% OC. The
geographical location of the cover pool assets is diversified across Finland, with a concentration
in the Uusimaa province (home to the capital city of Helsinki). According to the issuer, loans in
arrears (more than 90 days) amounted to 0.10% at end-March 2016.
Table 57. Funding profile
Total assets EUR30.2bn
Public deposits 60% Deposits w fin. inst. & CB 6%
Debt securities 18%
Subord. debt 0%
Other 11%
Equity 8%
Source: Danske Bank plc annual report 2015,
Danske Bank Markets
Table 58. Cover pool information
Cover pool EUR6.3bn
Avg. loan size EUR69,000 OC, nominal 26%
OC, NPV basis 33%
OC, committed 5%
WA LTV 54%
Seasoning 62 months*
Loan type
- Single-family houses 51%
- Flats 49%
Interest only loans 4%
Fixed rate loans 12%
Geography 100% Finland
- Uusimaa 47%
- Pirkanmaa 8%
- Varsinais-Suomi 5%
- North Ostrobothnia 5%
NPL (>90days in arrears) 0.1%
*Moody’s deal performance June 2016
Source: ECBC Label report Q1 16

42 | 6 September 2016 www.danskeresearch.com
Finn
ish C
overed
Bo
nd
s
Mortgage Society of Finland
Mortgage Society of Finland
Katettu joukkolaina
Company profile
With its 156 years of operation, The Mortgage Society of Finland (Hypo) is the oldest private
credit institution in Finland. Together, Hypo and the deposit bank Suomen AsuntoHypoPankki
(SAHP) form The Mortgage Society of Finland Group (Hypo Group). Hypo is the parent entity.
The group serves nearly 25,000 customers, who are members of the society as long as they have
loans outstanding and no arrears. As a mutual company, Hypo is governed by the member
customers.
Hypo Group specialises in housing financing in Finland, with an array of related retail banking
products such as online banking, credit cards (acting as an intermediary, assuming no credit risk)
and retail deposits. However, the key business for the group is to offer loans to households and
housing companies secured by residential collateral.
Hypo operates almost entirely in the major growth centres in Finland, especially in the Greater
Helsinki area and the Uusimaa region, as well as other selected areas. By end-2015, Hypo’s loan
portfolio stood at EUR1.4bn, having doubled in size since the end of 2012. During the same
time, Hypo’s deposit base increased even more, by EUR738m to EUR1.04bn. Even so, in a
national context, Hypo remains a fairly small lender with a mortgage lending market share of
0.4%. Instead, Hypo benefits from its niche position within mortgage lending, relying on its
strong reputation and product offerings, e.g. reverse mortgages and loans to housing companies.
More than half of Hypo’s loan book is composed of lending to housing companies (51%),
followed by households (33%) and housing investors (14%). Lending focuses exclusively on
Finland, with a concentration in the Helsinki area (74%), and more than 99% is secured by
residential properties. The average loan-to-value is 41%.
On an issuer level, Hypo is rated ‘BBB’ (negative) by S&P. The negative outlook reflects the
rating agency’s view on the weak Finnish economic recovery. In June 2016, S&P assigned an
‘AAA’ (stable) rating to Hypo’s covered bond programme.
Financial performance
In 2015, Hypo Group’s operating profit before tax remained stable at EUR7.5m. While net
interest income decreased to EUR4.6m (2014: EUR6.4m) due to the low interest rate
environment and the large increase in the liquidity buffer, net fee and commission income was
little changed at EUR3.4m (2014: EUR3.6m). Total other income, including Treasury operations
and housing and residential land investments, increased to EUR8.7m (2014: EUR7.2m).
Total expenses decreased to EUR9.1m (2014: EUR9.8m), despite the payment to the national
resolution fund. By end-2015, the Core Tier 1 capital ratio stood at 13.8% (2014: 15.1%), with
the calculation notably based on standardised risk weights. Considering S&P’s Risk Adjusted
Capital (RAC) ratio, which provides a uniform measure of capital, Hypo ranks as the third-best
capitalised Nordic financial institution with an RAC ratio of 20.5%. In 2015, asset quality
remained high, with the share of non-performing assets within the loan portfolio declining
further to 0.16% (2014: 0.23%).
Table 59. Ratings
Covered bond rating
(M/S&P/F) -/AAA/-
Issuer unsec. rating -/BBB(n)/-
S&P jurisdiction supp. uplift 3 (0 unused) S&P collateral supp. uplift 4 (1 unused) S&P total unused uplift 1 notch
(n) =negative outlook
Source: S&P, Danske Bank Markets
Table 60. Financial information
(group)
(EURm) 2015 2014 2012
Net interest income 4.6 6.4 346 Fees & commissions 3.4 3.6 43
Total other income 8.7 7.2
Total expenses 9.1 9.8 -13
Operating profit 7.5 7.5 124
Core Tier 1 ratio 13.8% 15.1% 13.7%
Cost/income ratio 54.9% 56.4% 54%
Non-perf. assets % of loan portfolio
0.16% 0.23% 1.69%
Source: Hypo Annual Report 2015
Table 61. Further information
Ticker SUOHYP
Website www.hypo.fi
Source: Danske Bank Markets

43 | 6 September 2016 www.danskeresearch.com
Finn
ish C
overed
Bo
nd
s
Mortgage Society of Finland
Business model and funding profile
The Hypo Group has gradually increased its deposit base to EUR1.04bn by end-2015, through
its deposit-taking subsidiary SAHP. As a result, deposits now constitute 57% of the group’s
funding base (up from 38% in 2012), followed by senior unsecured bonds (29%), other funding
(10%), certificates of deposits (4%) and subordinated debt (1%).
Hypo Group’s wholesale funding, including upcoming issues of covered bonds, is done through
the parent company Hypo (Bloomberg ticker: SUOHYP) under its EUR1.5bn debt issuance
programme. Hypo was granted an authorisation to conduct mortgage bank operations by the
Finnish FSA in January 2016 and in March, the covered bond programme was approved. As a
result, Hypo is now able to further diversify its funding base by issuing covered bonds.
According to Hypo, the intention is to be a fairly frequent issuer in the sub-benchmark segment
(i.e. deals sized below EUR500m), coming to the market with EUR250m covered bonds on a
yearly basis. The bonds should qualify for inclusion in banks’ liquidity buffers as level 2A assets.
In terms of the structure, covered bonds will be issued directly from Hypo’s balance sheet. The
cover pool assets, which consist of euro-denominated Finnish residential mortgage loans and
loans to housing companies, are segregated by the covered bond register and will thus be isolated
from the issuer’s other assets in the event of insolvency. The maturity structure is soft-bullet.
By end-2015, Hypo’s liquidity portfolio amounted to EUR459m, comprising mainly cash and
cash equivalents (EUR455m). Of this amount, 77% were at least ‘AA-’ rated and 99% were
eligible as ECB collateral. Of the total liquidity, EUR430m is unencumbered. According to
Hypo, the liquidity covers wholesale funding maturities for 22 months.
Cover pool and asset quality
By May 2016, Hypo’s cover pool stood at EUR375m, comprising exclusively euro-denominated
Finnish residential mortgage loans. There are currently no substitute assets in the cover pool.
The level of over-collateralisation (OC) available was 50% on a nominal basis. This is well
above the minimum legal requirement of 2%. Hypo has also stated that it is committed to always
maintaining sufficient OC to achieve an ‘AAA’ rating from S&P.
In terms of asset types, almost half of the cover pool is composed of mortgages backed by multi-
family housing (shares in housing companies, 49%), followed by apartments (39%) and single-
family housing (11%). Shares in housing companies confer on the borrower a right to reside in
the property and to deal with the property, including pledging the shares as security for a
mortgage loan. Finnish housing companies are generally non-profit seeking limited liability
entities and while they may file for bankruptcy, historically it is very unusual. Households in a
housing company have an obligation to pay maintenance fees. These fees are normally the sole
source of income of a housing company. Should an individual owner become insolvent, other
owners have an obligation to cover the losses.
Almost all mortgage loans included have contractual repayment schedules. The weighted
average indexed LTV of the pool is low at 33.8%. Furthermore, the pool contains no non-
performing loans or even loans that are in arrears (>30 days). The cover pool is well-seasoned
at 42 months. In line with Finnish peers, there is a high proportion of floating rate loans, which
could cause arrears to pick up if interest rates were to increase. However, Hypo’s customers
must pass a stress test against an increase of 6pp in interest rates before the loan is granted.
Table 62. Hypo liability split
Total balance EUR1.96bn
Due to credit institutions 151m (8%) Deposits 1,039m (53%)
Debt issues 591m (30%)
Subordinated debt 13m (1%)
Other 63m (3%)
Equity 102m (5%)
Source: Hypo Annual Report 2015, Danske Bank
Markets
Table 63. Cover pool information
Cover pool EUR375m
- of which subst. assets 0%
OC* / NPV* 47.2% / 48.3%
Average loan size EUR134,000 WA indexed LTV 33.8% Seasoning** 42 months
NPL (>30 days) 0% Fixed rate-mortgages 1% Interest-only mortgages <1%
Geography 100% Finland - Uusimaa (incl. Helsinki) 73% - Pirkanmaa (Tampera) 8%
- Varsinais-Suomi (Turku) 7% - North Ostrobothnia 3% - Central Finland 3%
Collateral type - Multi-family housing 49% - Apartments 39%
- Single-family housing 11%
* Calculated for eligible assets, in accordance with
section 16 in the CBA
** Source: S&P New Issue: The Mortgage Society
of Finland (Covered Bond Program) June 2016
Source: Hypo Investor Report data as of May
2016, Danske Bank Markets

44 | 6 September 2016 www.danskeresearch.com
Finn
ish C
overed
Bo
nd
s
Nordea Bank Finland
Nordea Bank Finland
Katettu joukkolaina
Company profile
Nordea Bank Finland (NBF) is the market leader in both household and corporate lending. The
bank also engages in other core areas such as private banking, mutual funds, pensions and
insurance. The Nordea franchise is organised at a group level. NBF is a wholly owned subsidiary
of Nordea Bank AB, which forms part of the Nordea Group. The Finnish insurance group Sampo
Oyj is the largest shareholder of Nordea, with 21.3% of the shares (June 2016). The Swedish
state sold its remaining shares in September 2013.
At the beginning of 2016, Nordea Bank AB announced plans to merge with its subsidiary banks
Nordea Bank Danmark, Nordea Bank Finland and Nordea Bank Norge, which will result in NBF
becoming part of the mother company. At the same time, a new mortgage bank will be created
which will run the covered bond business for Finland, while NBF will continue to operate as a
branch. As the new issuer is a mortgage bank, the covered bonds will have recourse solely to
the assets of the new issuer (mortgage bank). Existing bondholders have been provided with a
guarantee from Nordea Bank AB. The original plan for the implementation was set at 1 July
2016 but Nordea postponed the process; however, the bank still expects the restructuring to take
place in 2016.
Nordea Bank AB is the leading bank in the Nordic region in terms of market value and total
assets. The group has operated as Nordea since 2001 and targets a European cross-border
operating model. The group originated with the establishment of MeritaNordbanken in 1997,
which combined Merita Bank of Finland and Nordbanken of Sweden and was completed in 2000
with the merger with Unidanmark of Denmark and acquisition of Christiana Bank of Norway.
Nordea has a distinctive footprint in the Nordic area and leading positions in retail banking,
corporate finance and savings management, supported by around 11 million customers and over
32,000 employees.
Parent bank Nordea Bank AB is rated ‘Aa3’/‘AA-’/‘AA-’ by Moody’s/Standard & Poor’s/Fitch,
respectively. Moody’s has a ‘Aa3’ rating assigned to Nordea Bank AB with a stable outlook,
reflecting the banking group's diversified regional footprint in the Nordic region, its stable and
resilient earnings stream, good operational efficiency and credit quality. S&P rates the bank
‘AA-’ but with a negative outlook. The covered bonds issued by NBF enjoy a triple-A rating
from Moody’s.
Financial performance
In 2015, operating profit increased 9% to EUR4,704m (2014 EUR4,324m). Net interest income
decreased by 7% compared with 2014, due to negative interest in Denmark and Sweden and
euro countries. Feed and commission income rose 6%. Furthermore, net loan loss provisions fell
10% to EUR479m, corresponding to a loan loss ratio of 14bp (2014 19bp).
The core tier 1 capital ratio excluding transition rules improved further in 2015 to 18.5%, up
from 17.6% at end-2014. The total capital ratio increased to 21.6%. Nordea’s capital policy
stipulates a target minimum for the common equity tier 1 capital ratio (above 13%) and for the
total capital ratio (above 17%).
Table 64. Ratings
(Moody’s/S&P/Fitch)
Covered bond rating: Aaa/-/-
Issuer rating:* Aa3/AA-(n)/AA- Moody’s C-score: 5.2%
Moody’s TPI: Probable
- Excl. syst. risk 2.2%
Moody’s CB anchor: Aa2(cr) + 1
* Rating of Nordea Bank AB
‘n’ = negative outlook
Source: Moody’s, Danske Bank Markets
Table 65. Financial info (Nordea
Group)
EURm 2015 2014
Net interest income 5,110 5,482
Fees and commissions 3,025 2,842 Net gain/losses 1,703 1,425 Pre-provision income 5,183 4,858
Loan losses and provisions 479 534 Operating profit 4,704 4,324 Net interest margin 0.92% 1.08%
Net charge-off rate 0.14% 0.19% Tier 1 capital ratio 18.5% 17.6% Total capital ratio 21.6% 20.7%
Source: Nordea Annual Report 2015
Table 66. More information
Bond ticker NDASS Website www.nordea.fi
Source: Danske Bank Markets
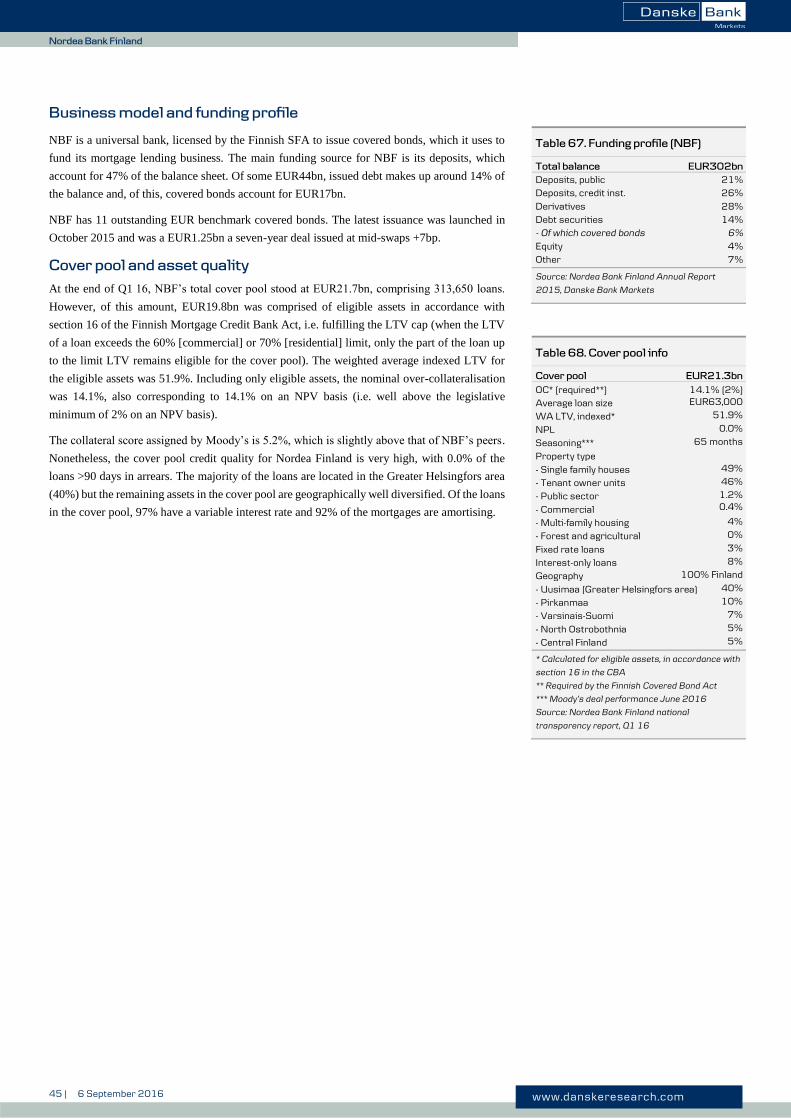
45 | 6 September 2016 www.danskeresearch.com
Finn
ish C
overed
Bo
nd
s
Nordea Bank Finland
Business model and funding profile
NBF is a universal bank, licensed by the Finnish SFA to issue covered bonds, which it uses to
fund its mortgage lending business. The main funding source for NBF is its deposits, which
account for 47% of the balance sheet. Of some EUR44bn, issued debt makes up around 14% of
the balance and, of this, covered bonds account for EUR17bn.
NBF has 11 outstanding EUR benchmark covered bonds. The latest issuance was launched in
October 2015 and was a EUR1.25bn a seven-year deal issued at mid-swaps +7bp.
Cover pool and asset quality
At the end of Q1 16, NBF’s total cover pool stood at EUR21.7bn, comprising 313,650 loans.
However, of this amount, EUR19.8bn was comprised of eligible assets in accordance with
section 16 of the Finnish Mortgage Credit Bank Act, i.e. fulfilling the LTV cap (when the LTV
of a loan exceeds the 60% [commercial] or 70% [residential] limit, only the part of the loan up
to the limit LTV remains eligible for the cover pool). The weighted average indexed LTV for
the eligible assets was 51.9%. Including only eligible assets, the nominal over-collateralisation
was 14.1%, also corresponding to 14.1% on an NPV basis (i.e. well above the legislative
minimum of 2% on an NPV basis).
The collateral score assigned by Moody’s is 5.2%, which is slightly above that of NBF’s peers.
Nonetheless, the cover pool credit quality for Nordea Finland is very high, with 0.0% of the
loans >90 days in arrears. The majority of the loans are located in the Greater Helsingfors area
(40%) but the remaining assets in the cover pool are geographically well diversified. Of the loans
in the cover pool, 97% have a variable interest rate and 92% of the mortgages are amortising.
Table 67. Funding profile (NBF)
Total balance EUR302bn
Deposits, public 21% Deposits, credit inst. 26%
Derivatives 28% Debt securities 14% - Of which covered bonds 6%
Equity 4% Other 7%
Source: Nordea Bank Finland Annual Report
2015, Danske Bank Markets
Table 68. Cover pool info
Cover pool EUR21.3bn
OC* (required**) 14.1% (2%) Average loan size EUR63,000
WA LTV, indexed* 51.9%
NPL 0.0%
Seasoning*** 65 months
Property type
- Single family houses 49%
- Tenant owner units 46%
- Public sector
- Commercial
1.2% 0.4%
- Multi-family housing 4%
- Forest and agricultural 0%
Fixed rate loans 3%
Interest-only loans 8%
Geography 100% Finland
- Uusimaa (Greater Helsingfors area) 40%
- Pirkanmaa 10%
- Varsinais-Suomi 7%
- North Ostrobothnia 5%
- Central Finland 5%
* Calculated for eligible assets, in accordance with
section 16 in the CBA
** Required by the Finnish Covered Bond Act
*** Moody’s deal performance June 2016
Source: Nordea Bank Finland national
transparency report, Q1 16
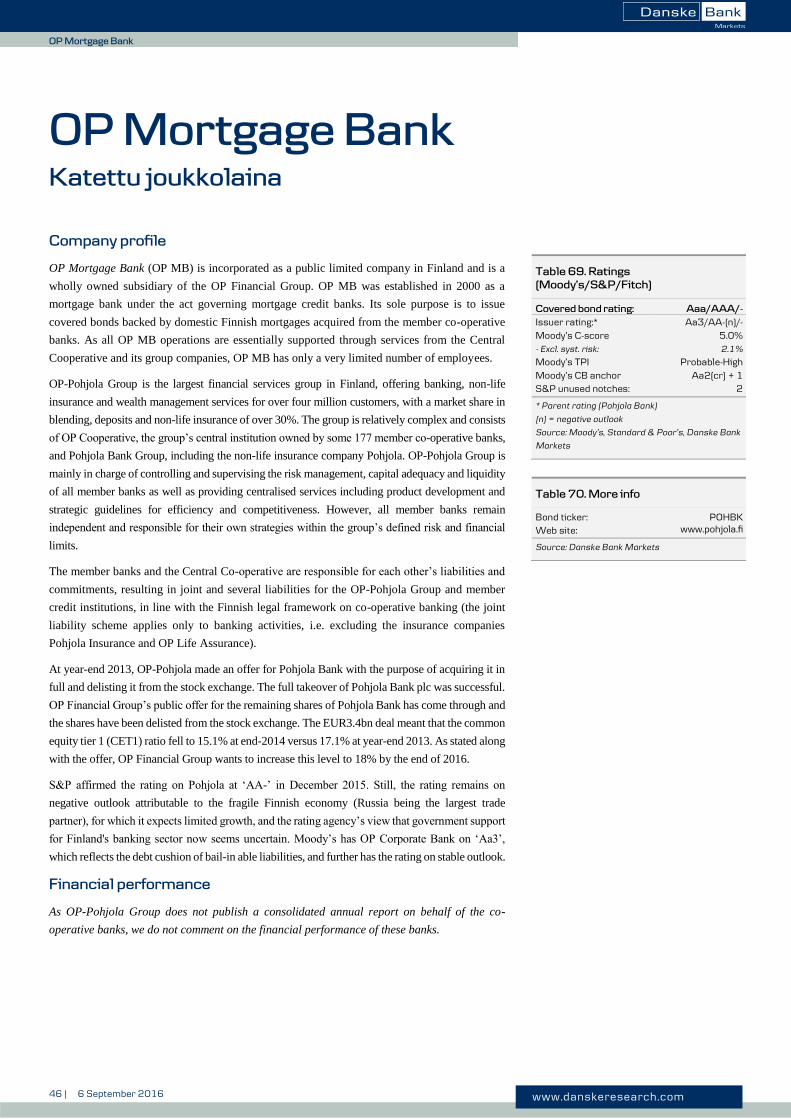
46 | 6 September 2016 www.danskeresearch.com
Finn
ish C
overed
Bo
nd
s
OP Mortgage Bank
OP Mortgage Bank
Katettu joukkolaina
Company profile
OP Mortgage Bank (OP MB) is incorporated as a public limited company in Finland and is a
wholly owned subsidiary of the OP Financial Group. OP MB was established in 2000 as a
mortgage bank under the act governing mortgage credit banks. Its sole purpose is to issue
covered bonds backed by domestic Finnish mortgages acquired from the member co-operative
banks. As all OP MB operations are essentially supported through services from the Central
Cooperative and its group companies, OP MB has only a very limited number of employees.
OP-Pohjola Group is the largest financial services group in Finland, offering banking, non-life
insurance and wealth management services for over four million customers, with a market share in
blending, deposits and non-life insurance of over 30%. The group is relatively complex and consists
of OP Cooperative, the group’s central institution owned by some 177 member co-operative banks,
and Pohjola Bank Group, including the non-life insurance company Pohjola. OP-Pohjola Group is
mainly in charge of controlling and supervising the risk management, capital adequacy and liquidity
of all member banks as well as providing centralised services including product development and
strategic guidelines for efficiency and competitiveness. However, all member banks remain
independent and responsible for their own strategies within the group’s defined risk and financial
limits.
The member banks and the Central Co-operative are responsible for each other’s liabilities and
commitments, resulting in joint and several liabilities for the OP-Pohjola Group and member
credit institutions, in line with the Finnish legal framework on co-operative banking (the joint
liability scheme applies only to banking activities, i.e. excluding the insurance companies
Pohjola Insurance and OP Life Assurance).
At year-end 2013, OP-Pohjola made an offer for Pohjola Bank with the purpose of acquiring it in
full and delisting it from the stock exchange. The full takeover of Pohjola Bank plc was successful.
OP Financial Group’s public offer for the remaining shares of Pohjola Bank has come through and
the shares have been delisted from the stock exchange. The EUR3.4bn deal meant that the common
equity tier 1 (CET1) ratio fell to 15.1% at end-2014 versus 17.1% at year-end 2013. As stated along
with the offer, OP Financial Group wants to increase this level to 18% by the end of 2016.
S&P affirmed the rating on Pohjola at ‘AA-’ in December 2015. Still, the rating remains on
negative outlook attributable to the fragile Finnish economy (Russia being the largest trade
partner), for which it expects limited growth, and the rating agency’s view that government support
for Finland's banking sector now seems uncertain. Moody’s has OP Corporate Bank on ‘Aa3’,
which reflects the debt cushion of bail-in able liabilities, and further has the rating on stable outlook.
Financial performance
As OP-Pohjola Group does not publish a consolidated annual report on behalf of the co-
operative banks, we do not comment on the financial performance of these banks.
Table 69. Ratings
(Moody’s/S&P/Fitch)
Covered bond rating: Aaa/AAA/-
Issuer rating:* Aa3/AA-(n)/-
Moody’s C-score 5.0% - Excl. syst. risk: 2.1%
Moody’s TPI Probable-High
Moody’s CB anchor Aa2(cr) + 1 S&P unused notches: 2
* Parent rating (Pohjola Bank)
(n) = negative outlook
Source: Moody’s, Standard & Poor’s, Danske Bank
Markets
Table 70. More info
Bond ticker: POHBK Web site: www.pohjola.fi
Source: Danske Bank Markets

47 | 6 September 2016 www.danskeresearch.com
Finn
ish C
overed
Bo
nd
s
OP Mortgage Bank
Business model and funding profile
As stated above, OP MB is the mortgage bank of OP Financial Group and it is responsible for
the group’s secured funding by issuing mortgage-backed covered notes under its EUR15bn Euro
Medium-Term Covered Note programme.
The purpose of OP MB is to acquire refinancing for the OP-Pohjola Group through the issuance
of covered bonds. The housing loans used by OP MB as collateral are subject to strict eligibility
criteria and may be transferred from the member co-operative banks to OP MB. Alternatively,
origination can be performed directly in OP MB, with the member co-operative bank acting as
a broker.
OP MB’s loan portfolio (receivables from customers) increased to EUR10.9bn in 2015, from
EUR9.3bn in 2014.
For OP MB, the funding structure consisted of 83% covered bonds and private placements, 13%
liabilities to financial institutions, 3% equity and 1% other liabilities.
Cover pool and asset quality
As of March 2016, OP MB’s cover pool totalled EUR10bn. The cover pool consists of 100%
first-lien Finnish residential mortgages with an average loan size of EUR53,501. The indexed
LTV level for the cover pool currently stands at 48%. The credit quality of the cover pool is very
good, as is also evident in the collateral score of 5.0% assigned by Moody’s (2.1% excluding
systemic risk).
The over-collateralisation as of Q1 16 was 11.2% and remained comfortably above the legal
minimum (2%). OP MB has not committed to maintaining additional OC above this level. The
geographical location of the cover pool assets is diversified across Finland, with a concentration
in Uusimaa province (home to the capital city of Helsinki). According to the issuer, loans in
arrears (more than 90 days) amounted to 0% at end-March 2016.
Moody’s and S&P have both assigned triple-A ratings to OP MB’s covered bond issues.
Table 71. Funding profile (OP MB)
Total balance EUR10.9bn
Covered bonds & private placements 83%
Liabilities to financial inst. 13%
Other liabilities 1%
Equity 3%
Source: OP MB Financial Statements 2015,
Danske Bank Markets calculations
Table 72. Cover pool
Cover pool EUR10bn
OC* (legal minimum) 11.2% (2%) Average loan size EUR54,000 WA LTV, indexed* 48%
Seasoning** 65 months
NPL (>90 days) None
Floating rate 99%
IO-mortgages <1%
Geography 100% Finland
- Uusimaa (Greater Helsingfors area) 29%
- Varsinais-Suomi 11%
- Pirkanmaa 10%
- North Ostrobothnia 9%
- Other <6%
Asset type 100% residential
- Single-family housing 56%
- Flats 44%
* Calculated for eligible assets, in accordance with
section 16 in the CBA
** Source: Moody’s deal performance June 2016
Source: OP MB Cover Pool data, March 2016

48 | 6 September 2016 www.danskeresearch.com
Finn
ish C
overed
Bo
nd
s

49 | 6 September 2016 www.danskeresearch.com
No
rwe
gian
Co
vered B
on
ds
Norwegian Covered Bonds
Obligasjoner med fortrinsrett
Background
In 2002, the Norwegian Parliament introduced the Mortgage Act to facilitate the issuance by
mortgage institutions of bonds secured by mortgage loans. However, several areas in the act
required further clarification.
There were uncertainties in the law regarding the separation of the cover pool from the issuer
bank in the event of the bank’s default. Covered bondholders had a priority claim only over
cover assets in the event of default by the issuer and not a statutory right to the asset pool in
that circumstance.
Bankruptcy proceedings – under the original version of the 2002 Mortgage Act, mortgage
institutes were subject to ordinary bankruptcy proceedings.
Furthermore, additional regulations had to be implemented in areas such as derivatives,
valuation, registration, auditing, liquidity and market risk. The first step to addressing these
issues was taken in January 2004, when a new set of rules was incorporated into the Financial
Services Act from 1988 that allows the following.
All Norwegian financial institutions to securitise loan portfolios and obtain capital relief
under certain conditions.
Mortgage institutions to finance mortgage loans by issuing covered bonds.
In December 2006, a proposal for a new Mortgage Act was made. The proposal was passed and
became effective in March 2007. In May 2007, secondary legislation was passed.
Key elements of the Covered Bond Act
The specialist banking principle applies, allowing only specialised institutions restricted in
their business to issue covered bonds. This is also the case in Ireland and France, while Finland,
Germany, Sweden and Denmark have abandoned the principle. In accordance with UCITS 22(4)
requirements, the issuer will be subject to special public supervision. The issuer must keep a
cover register of the collateral (including open hedge positions) and bonds issued. Collateral
assets may include residential and commercial mortgages, public loans, derivatives and
substitute assets (up to 20% – on a temporary basis, the FSA can allow up to 30% of substitution
assets). The issuer may decide to keep eligible assets in separate pools (residential, commercial
and public loans) or in a single pool. LTV ratio limits are 75% and 60% for mortgage and
commercial loans, respectively. For second/vacation homes, the LTV ratio is capped at 60%.
Loans must be within the LTV ratio limit upon inclusion in the cover pool. There is no LTV
ratio limit, at which the loan must be removed from the cover pool; however, in terms of
coverage calculations, only the part of the loan up to the LTV limit is taken into account but
covered bond investors continue to have recourse to the full loan. Non-performing loans are
allowed in the cover pool, yet they are not taken into account when matching assets and
liabilities.
Norwegian Covered Bonds

50 | 6 September 2016 www.danskeresearch.com
No
rwe
gian
Co
vered B
on
ds
Norwegian Covered Bonds
The valuation of covered assets must be carried out in a prudent manner, must not exceed the
market value and the assessment must be made on an individual basis by an independent
valuation agent. In respect of ALM requirements, the law states that the value of the cover
pool, including derivatives, must exceed the value of outstanding bonds issued. Bonds, loans,
substitute assets and derivatives must be calculated at market value, so there is only a nominal
match and no net present value match, as for example in Sweden and Germany. There is no
minimum required over-collateralisation.
The issuer must set limits for interest rate risk (measured against subordinated capital) allowing
for the possibility of 100bp parallel shifts and twists in the yield curve (divided into maturity
classes). With respect to liquidity requirements, section 2-32 of the revised Mortgage Act states
that cash flow from collateral assets must at all times meet scheduled payments of covered
bondholders and derivatives’ counterparties. Secondary legislation states only that an issuer
must not take on more liquidity risk than can be considered ‘secure’. Therefore, it is up to
separate issuers to set liquidity limits. Currency risk must be hedged but again secondary
legislation does not state how much risk is ‘secure’. No stress test is mentioned.
In terms of asset segregation and bankruptcy proceedings, the legislation explicitly stipulates
the preferential rights of bondholders and derivatives counterparties to the cover pool assets.
Furthermore, the law explicitly defines the mandatory procedures to be followed in the event of
bankruptcy and procedures to ensure timely payments.
In Table 73, we provide an overview of the relative strengths and weaknesses of the Norwegian
covered bond framework, as outlined by Moody’s in ‘Norway – Legal Framework for Covered
Bonds’, published on 29 July 2014.
Table 73. Relative strengths and weaknesses of the Norwegian covered bond framework
Relative strengths Relative weaknesses
Covered bond law Non-performing assets excluded from cover pool tests but remain in the cover pool.
The covered bond law excludes set-off in respect of any asset in the cover pool (and issuers are not deposit-taking).
A parent bank default would not necessarily trigger an issuer default, the latter being specialist institutions.
Issuer is required to limit interest rate risk.
The issuer’s swap counterparties must post collateral (or provide other security) if their credit quality reduces.
The covered bond law does not provide for any minimum over-collateralisation level and there is no nominal asset coverage test.
However, issuers may agree to hold a certain minimum amount of over-collateralisation and to date have always provided full nominal asset coverage of their bond issuance.
Although there is an unsecured claim on the issuer, the issuer is unlikely to hold significant assets outside the cover pool and the typical legal structure does not allow for a claim on the issuer’s parent.
There are no requirements in relation to enforceability of non-EEA assets.
Contractual features The issuer's administrator may reset rates on floating-rate mortgage loans with limited notice, reducing the length of time the cover pool is exposed to refinancing risk following issuer default.
Most issuers (though not all) provide for a contractual 12-month covered bond maturity extension on the covered bonds at the issuer's discretion. This provides additional liquidity for principal payments.
Most issuers (though not all) enter into swap agreements with external counterparties to manage interest rate and currency risk.
Source: Moody's, Danske Bank Markets
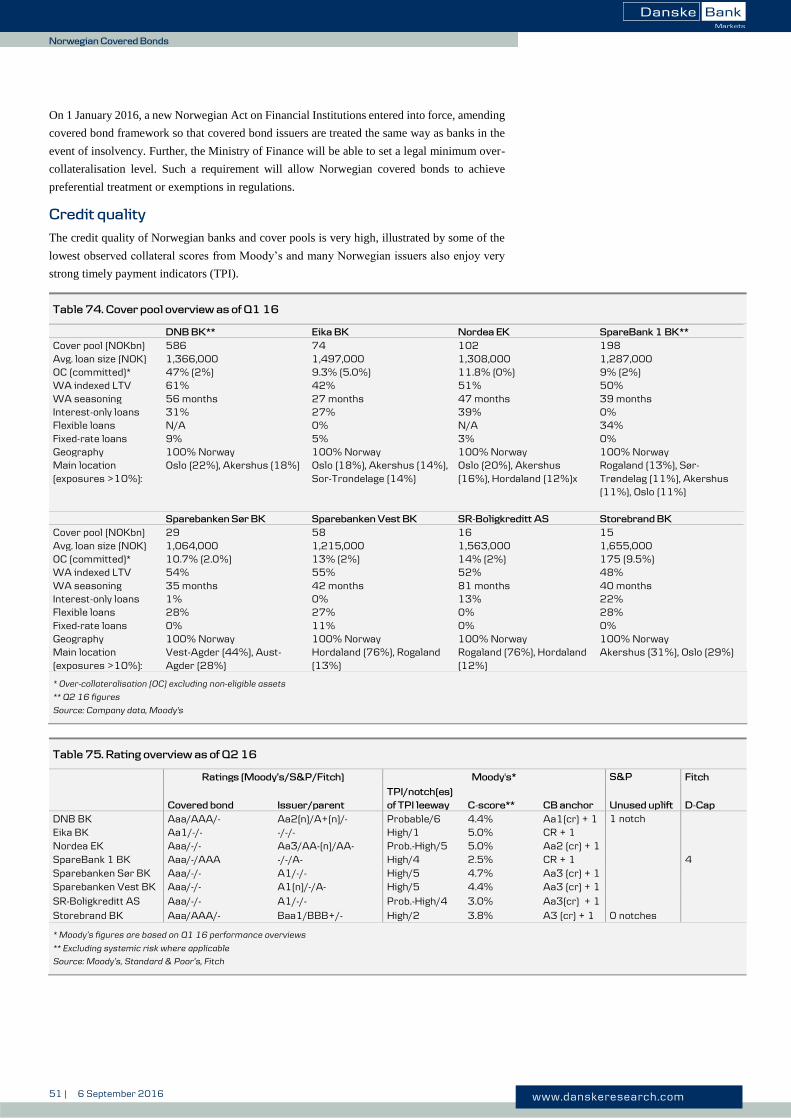
51 | 6 September 2016 www.danskeresearch.com
No
rwe
gian
Co
vered B
on
ds
Norwegian Covered Bonds
On 1 January 2016, a new Norwegian Act on Financial Institutions entered into force, amending
covered bond framework so that covered bond issuers are treated the same way as banks in the
event of insolvency. Further, the Ministry of Finance will be able to set a legal minimum over-
collateralisation level. Such a requirement will allow Norwegian covered bonds to achieve
preferential treatment or exemptions in regulations.
Credit quality
The credit quality of Norwegian banks and cover pools is very high, illustrated by some of the
lowest observed collateral scores from Moody’s and many Norwegian issuers also enjoy very
strong timely payment indicators (TPI).
Table 74. Cover pool overview as of Q1 16
DNB BK** Eika BK Nordea EK SpareBank 1 BK**
Cover pool (NOKbn) 586 74 102 198 Avg. loan size (NOK) 1,366,000 1,497,000 1,308,000 1,287,000 OC (committed)* 47% (2%) 9.3% (5.0%) 11.8% (0%) 9% (2%) WA indexed LTV 61% 42% 51% 50% WA seasoning 56 months 27 months 47 months 39 months Interest-only loans 31% 27% 39% 0% Flexible loans N/A 0% N/A 34% Fixed-rate loans 9% 5% 3% 0% Geography 100% Norway 100% Norway 100% Norway 100% Norway Main location (exposures >10%):
Oslo (22%), Akershus (18%) Oslo (18%), Akershus (14%), Sor-Trondelage (14%)
Oslo (20%), Akershus (16%), Hordaland (12%)x
Rogaland (13%), Sør-Trøndelag (11%), Akershus (11%), Oslo (11%)
Sparebanken Sør BK Sparebanken Vest BK SR-Boligkreditt AS Storebrand BK
Cover pool (NOKbn) 29 58 16 15 Avg. loan size (NOK) 1,064,000 1,215,000 1,563,000 1,655,000 OC (committed)* 10.7% (2.0%) 13% (2%) 14% (2%) 175 (9.5%) WA indexed LTV 54% 55% 52% 48% WA seasoning 35 months 42 months 81 months 40 months Interest-only loans 1% 0% 13% 22% Flexible loans 28% 27% 0% 28% Fixed-rate loans 0% 11% 0% 0% Geography 100% Norway 100% Norway 100% Norway 100% Norway Main location (exposures >10%):
Vest-Agder (44%), Aust-Agder (28%)
Hordaland (76%), Rogaland (13%)
Rogaland (76%), Hordaland (12%)
Akershus (31%), Oslo (29%)
* Over-collateralisation (OC) excluding non-eligible assets
** Q2 16 figures
Source: Company data, Moody's
Table 75. Rating overview as of Q2 16
Ratings (Moody’s/S&P/Fitch) Moody's* S&P Fitch
Covered bond Issuer/parent
TPI/notch(es)
of TPI leeway C-score** CB anchor Unused uplift D-Cap
DNB BK Aaa/AAA/- Aa2(n)/A+(n)/- Probable/6 4.4% Aa1(cr) + 1 1 notch Eika BK Aa1/-/- -/-/- High/1 5.0% CR + 1 Nordea EK Aaa/-/- Aa3/AA-(n)/AA- Prob.-High/5 5.0% Aa2 (cr) + 1 SpareBank 1 BK Aaa/-/AAA -/-/A- High/4 2.5% CR + 1 4 Sparebanken Sør BK Aaa/-/- A1/-/- High/5 4.7% Aa3 (cr) + 1 Sparebanken Vest BK Aaa/-/- A1(n)/-/A- High/5 4.4% Aa3 (cr) + 1
SR-Boligkreditt AS Aaa/-/- A1/-/- Prob.-High/4 3.0% Aa3(cr) + 1
Storebrand BK Aaa/AAA/- Baa1/BBB+/- High/2 3.8% A3 (cr) + 1 0 notches
* Moody’s figures are based on Q1 16 performance overviews
** Excluding systemic risk where applicable
Source: Moody’s, Standard & Poor’s, Fitch

52 | 6 September 2016 www.danskeresearch.com
No
rwe
gian
Co
vered B
on
ds
Norwegian Covered Bonds
Developments in the Norwegian covered bond landscape
Until the outbreak of the financial crisis, the number of Norwegian issuers was limited.
However, the introduction of ‘the swap facility’ at Norges Bank prompted many new issuers.
While many issuers initially issued only for this repo facility, increasing interest from domestic
investors over the past few years – fuelled not least by the incentives provided in regulations
such as Basel III/CRD4 and Solvency 2 – has resulted in a rapid build-up of a domestic market
for NOK covered bonds, though still far from the size of the Danish and Swedish markets. The
EUR market has also seen a high growth rate and the Norwegian EUR covered bond market
took over the lead from Sweden in 2013 in terms of outstanding volume, ranking as the biggest
EUR market in the Nordic region.
The past year has seen two new Norwegian covered bond issuers enter the European benchmark
segment. In March 2015, SpareBank 1 SR-Bank, a founding member of the SpareBank 1
Alliance and one of the largest stakeholders in SpareBank 1 Boligkreditt, established its own
covered bond entity SR-Boligkreditt. In September 2015, SR-Boligkreditt issued its inaugural
EUR benchmark deal and has since come to the market on two occasions. In March 2016,
Sparebanken Sør Boligkreditt launched its first EUR benchmark deal, having until then been
active only in the domestic market. Later this year, OBOS Boligkreditt is set to issue its first
covered bond, although we expect the issuer to be active only in the domestic market. OBOS
Boligkreditt is the wholly owned residential mortgage company of OBOS-Banken, which is one
of the owners of Eika Boligkreditt. Going forward, OBOS intends to use its own covered bond
subsidiary for financing residential mortgage loans (see the Eika Boligkreditt issuer profile for
further details).
Macro prudential measures to target household credit growth
In response to the sharp increase in house prices and credit growth in the household sector, on
15 June 2015 the Norwegian Ministry of Finance adopted regulation on requirements for
residential mortgage loans. The regulation is based on existing FSA guidelines and took effect
on 1 July 2015.
The loan-to-value ratio on residential mortgage loans is capped at 85%.
Lenders should make allowance for an interest rate increase of 5 percentage points when
assessing a borrower’s debt-servicing ability. In addition, in the case of fixed interest
mortgages, a similar interest rate increase will be applied on the expiry of the mortgage rate
lock-in period.
For residential mortgage loans with a loan-to-value ratio above 70%, the regulation requires
lenders to demand repayments. Minimum annual amortisation of 2.5% applies from the first
year. Alternatively, the borrower must amortise an amount corresponding to the amortisation
on a 30-year annuity loan (whichever is lower). However, under special circumstances that
were unknown at the time the loan was granted, lenders are permitted to grant temporary
suspension of the amortisation requirements.
To ensure that lenders are able to offer loans to creditworthy borrowers, the regulation allows
for 10% of the volume of a lender’s approved loans per quarter to be loans that do not meet
the regulatory requirements for debt-servicing capacity, loan-to-value ratio or repayments.
To ensure competition in the market for residential mortgage loans, loans that are moved
from one bank to another are not counted in the 10% quota.
The regulation will be evaluated continually in the light of regional developments in the
housing market, household borrowing and the impact on competition between lenders. The
regulation will cease to have effect on 31 December 2016, unless an assessment shows the
need for the regulation to be extended.

53 | 6 September 2016 www.danskeresearch.com
No
rwe
gian
Co
vered B
on
ds
Norwegian Covered Bonds
Outlook for the Norwegian economy
Growth in the Norwegian economy seems to be slowly but surely picking up again. Mainland
GDP grew 0.3% q/q in Q1 and domestic demand is improving especially.
The decline in oil investment is still bringing low growth in manufacturing and much of the service
sector but the headwinds clearly seem to be easing. The decrease in industrial activity in Q1 was the
smallest for more than a year and the current data suggests there could have been a return to growth
as early as Q2. Higher unemployment and lower real wage growth are putting the brakes on growth
in private consumption. While consumption of services is holding up somewhat better due to
structural changes and a weak Norwegian krone, retail sales suggest that the consumption of goods
is moving sideways. Growth in mainland exports was also down versus Q1 15, even when we take
refined oil products out of the equation. In contrast, there was strong growth in government demand
and housing investment and business investment surprised on the upside.
Norges Bank’s regional network survey is giving clearer indications that growth will accelerate
further over the next six months. The aggregated output index is now at its highest for 18 months.
Looking further into the results, the downturn in oil-related industries is continuing at roughly
the same rate as for much of 2015. This ties in well with oil prices falling further at the start of
the year, prompting even bigger cuts in the oil companies’ investment budgets. However, the oil
investment survey brought only a minor revision to expected investment levels in 2016 and the
estimates for next year were more or less as expected. The rise in oil prices in recent months has
also reduced the risk of further cuts in oil investment, so we still expect the outlook for the
supply sector to improve gradually even though the oil price has fallen over the summer.
Equally important, however, are the clear signs that the outlook outside the oil sector is
improving. Firms in all the other sectors reported stronger growth expectations in the May
Regional Survey, with the exception of household services, where they were already very high
in February. Construction and household services look particularly optimistic. It is also worth
noting that the important business services sector seems to be well on its way out of the doldrums
– the improvement in February was not a one-off.
This may mean the danger of second- and third-round effects of the oil shock sending the
Norwegian economy into a deep and protracted recession is now receding. Such a scenario ought
to indicate a gradual slowdown in non-oil sectors two and a half years after the downturn began
but it appears that the exact opposite is happening. This could mean that the positive growth
effects of lower interest rates, expansionary fiscal policy and a weak Norwegian krone are
outweighing the negative effects of dwindling oil activity.
Nor can we see growing spillover effects when looking at the regional picture. There is now the
prospect of growth in all regions other than the southwest and the growth outlook seems to be
improving in all of the oil-heavy regions despite the continued decline in the oil sector. This is
at any rate an indication that there are forces pulling in the other direction and that there is
currently relatively strong growth outside the oil sector.
Hard data largely confirms the picture painted by the regional network. Manufacturing
production, which includes oil and manufacturing for the domestic and export markets, is very
clearly bottoming out and may have returned to growth in Q2, as mentioned previously. Both
residential and commercial building starts were up around 10% y/y in Q1. The one exception is
development in the retail sector, which has been disappointing so far this year, although the
regional network now points to growth picking up. The number of bankruptcies in the retail
trade is not abnormally high and employment and unemployment figures in the sector seem to
be more or less unchanged. This may mean that the weakness in the sector is not as bad as retail
sales might suggest.
Chief Economist Frank Jullum +47 85 40 65 40 [email protected]

54 | 6 September 2016 www.danskeresearch.com
No
rwe
gian
Co
vered B
on
ds
Norwegian Covered Bonds
We believe the main reason the economy has avoided a full-on recession relates to government
demand. Based on the revised national budget for 2016 and additional allocations relating to the
influx of asylum seekers, we now expect a fiscal policy contribution of 1.1% of GDP in 2016,
which is 0.4pp or just over NOK10bn more than we assumed in our previous forecast in March.
This should boost growth in H2 and despite a slightly weaker start to the year, we have revised
down our mainland growth estimate by only a tenth of a percentage point to 1.2% this year.

55 | 6 September 2016 www.danskeresearch.com
No
rwe
gian
Co
vered B
on
ds

56 | 6 September 2016 www.danskeresearch.com
No
rwe
gian
Co
vered B
on
ds
DNB Boligkreditt
DNB Boligkreditt
Obligasjoner med fortrinsrett
Company profile
DNB Boligkreditt AS is a wholly-owned subsidiary of the largest bank in Norway, DNB Bank
ASA, which in turn is the largest entity of DNB Group ASA. The group is the largest financial
group in Norway and one of the largest banking groups in the Nordic region with a domestic
market share of retail deposits of 31% (December 2015). DNB is also Norway’s largest asset
management company as well as the second-largest pension and life insurance company with
about 1.1m customers. In addition, the bank is one of the world leaders in shipping finance and
has top expertise in other important industries in Norway, such as fisheries and oil drilling. It is
also the largest real estate broker in Norway. While most of the group’s income stems from
Norway, DNB also has international operations e.g. in Scandinavia, the Baltic region and
Poland. In addition to Norway, DNB is active in 19 countries, and sourced 19% of its income
from its international units in 2015.
The Norwegian State owns 34% of DNB but the ownership is not active in the sense that the
state is not represented on the board. The purpose of ownership is to ensure that the group
remains headquartered in Norway, serving as a partner for Norwegian companies. Further, DNB
Savings Bank foundation holds 9.5%.
The sole purpose of DNB Boligkreditt is to issue covered bonds backed by mortgages on retail
properties in Norway. The company was the first to issue covered bonds according to the
Norwegian Mortgage Act. The mortgages included in the cover pool are originated within DNB
Bank’s distribution network in accordance with the bank’s credit policy.
DNB Bank ASA is rated ‘Aa2’ (negative) and ‘A+’ (negative) by Moody’s and S&P. Moody’s
lifted its rating by one notch in March 2016, reflecting the increase in loss absorbing liabilities
on the bank’s balance sheet. Simultaneously, however, the outlook was changed to negative,
with Moody’s citing the slowdown in Norway’s economic growth as the reason. Likewise, S&P
assigns a negative outlook to its rating, due to the combined impact of the eventual removal of
government support and negative trends associated with economic risks in the Norwegian
banking sector. Covered bonds issued by DNB Boligkreditt enjoy stable triple-A ratings from
both agencies. DNB Boligkreditt does not have an issuer rating.
Financial performance
In 2015, DNB recorded profits of NOK24.8bn, marking an increase of NOK4.1bn from 2014.
The increase stemmed mainly from higher net interest income, due to higher volumes and wider
deposit spreads, while other operating income was also NOK1.8bn higher, reflecting the effect
of basis swaps and an increase in gains on other financial instruments. Operating expenses were
reduced as wage costs fell due to the transition from a defined-benefit to a defined-contribution
pension scheme. However, impairment losses on loans and guarantees increased by NOK0.6bn,
reflecting a rise in individual impairment in the shipping and offshore segments. By end-2015,
the group had a CET1 ratio of 14.4% and a total capital ratio of 17.8% (2014 values were 12.7%
and 15.2%, respectively).
Table 76. Ratings
(Moody’s/S&P/Fitch)
Covered bond rating: Aaa/AAA/-
Issuer rating: Aa2(n)/A+(n)/-
Moody’s C-score: 5.9%
- excl. syst. risk 4.4%
Moody’s TPI: Probable
Moody’s CB anchor: Aa1(cr) + 1 Moody’s TPI leeway 6 notches S&P unused uplift: 1 notch
Source: Rating agencies, Danske Bank Markets
Table 77. Financial information (DNB
Group)
NOKm 2015 2014 2013 2012 2011 2010 2009
Net interest income 35,358 32,487 30,192 27,216 25,252 23,436 22,633 Fees and commissions 8,862 8,970 7,393 6,962 6,879 7,293 6,655
Net gain/losses 8,683 5,317 4,622 18,129 13,495 20,035 19,748
Pre-provision profit 34,083 28,689 24,744 20,957 21,853 21,081 18,716
Loan losses and provisions 2,270 1,639 2,185 3,179 3,445 2,997 7,710
Loan loss ratio 0.25% 0.27% 0.29% 0.31% 0.3% 0.3% 0.7%
Operating profit (pre-tax) 31,858 27,102 22,709 17,776 18,407 18,108 11,032
Cost/income ratio 36.9% 41.9% 45.7% 1.50% 1.50% 1.55% 1.71%
CET1 capital ratio* 14.4% 12.7% 11.8% 49.1% 47.1% 47.6% 48.4%
Tier 1 capital ratio* 15.3% 13.0% 12.1% 10.7%
Total capital ratio* 17.8% 15.2% 14.0% 11.0% 9.9% 10.1% 9.3%
*Transitional rules
Source: DNB Group Annual Report 2015
Table 78. More information
Bond ticker: DNBNO Website: www.dnb.no
Source: Danske Bank Markets
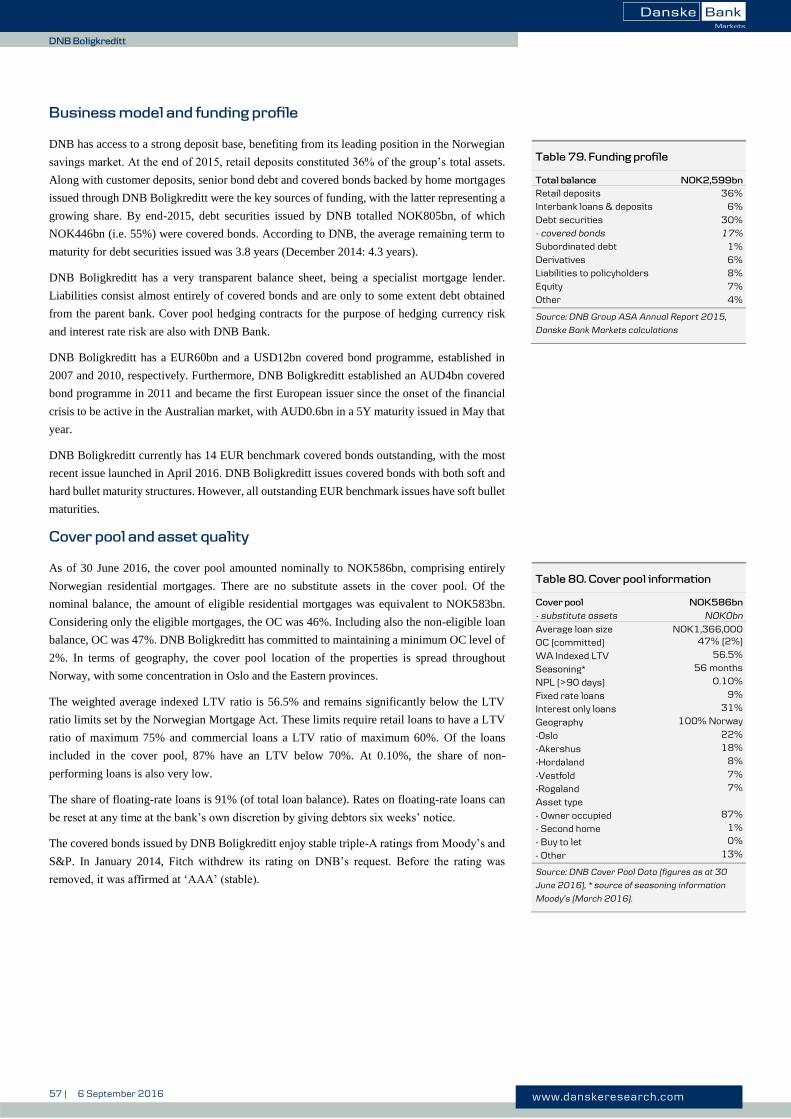
57 | 6 September 2016 www.danskeresearch.com
No
rwe
gian
Co
vered B
on
ds
DNB Boligkreditt
Business model and funding profile
DNB has access to a strong deposit base, benefiting from its leading position in the Norwegian
savings market. At the end of 2015, retail deposits constituted 36% of the group’s total assets.
Along with customer deposits, senior bond debt and covered bonds backed by home mortgages
issued through DNB Boligkreditt were the key sources of funding, with the latter representing a
growing share. By end-2015, debt securities issued by DNB totalled NOK805bn, of which
NOK446bn (i.e. 55%) were covered bonds. According to DNB, the average remaining term to
maturity for debt securities issued was 3.8 years (December 2014: 4.3 years).
DNB Boligkreditt has a very transparent balance sheet, being a specialist mortgage lender.
Liabilities consist almost entirely of covered bonds and are only to some extent debt obtained
from the parent bank. Cover pool hedging contracts for the purpose of hedging currency risk
and interest rate risk are also with DNB Bank.
DNB Boligkreditt has a EUR60bn and a USD12bn covered bond programme, established in
2007 and 2010, respectively. Furthermore, DNB Boligkreditt established an AUD4bn covered
bond programme in 2011 and became the first European issuer since the onset of the financial
crisis to be active in the Australian market, with AUD0.6bn in a 5Y maturity issued in May that
year.
DNB Boligkreditt currently has 14 EUR benchmark covered bonds outstanding, with the most
recent issue launched in April 2016. DNB Boligkreditt issues covered bonds with both soft and
hard bullet maturity structures. However, all outstanding EUR benchmark issues have soft bullet
maturities.
Cover pool and asset quality
As of 30 June 2016, the cover pool amounted nominally to NOK586bn, comprising entirely
Norwegian residential mortgages. There are no substitute assets in the cover pool. Of the
nominal balance, the amount of eligible residential mortgages was equivalent to NOK583bn.
Considering only the eligible mortgages, the OC was 46%. Including also the non-eligible loan
balance, OC was 47%. DNB Boligkreditt has committed to maintaining a minimum OC level of
2%. In terms of geography, the cover pool location of the properties is spread throughout
Norway, with some concentration in Oslo and the Eastern provinces.
The weighted average indexed LTV ratio is 56.5% and remains significantly below the LTV
ratio limits set by the Norwegian Mortgage Act. These limits require retail loans to have a LTV
ratio of maximum 75% and commercial loans a LTV ratio of maximum 60%. Of the loans
included in the cover pool, 87% have an LTV below 70%. At 0.10%, the share of non-
performing loans is also very low.
The share of floating-rate loans is 91% (of total loan balance). Rates on floating-rate loans can
be reset at any time at the bank’s own discretion by giving debtors six weeks’ notice.
The covered bonds issued by DNB Boligkreditt enjoy stable triple-A ratings from Moody’s and
S&P. In January 2014, Fitch withdrew its rating on DNB’s request. Before the rating was
removed, it was affirmed at ‘AAA’ (stable).
Table 79. Funding profile
Total balance NOK2,599bn
Retail deposits 36% Interbank loans & deposits 6%
Debt securities - covered bonds
30% 17%
Subordinated debt
Derivatives
1%
6% Liabilities to policyholders 8% Equity 7%
Other 4%
Source: DNB Group ASA Annual Report 2015,
Danske Bank Markets calculations
Table 80. Cover pool information
Cover pool NOK586bn
- substitute assets NOK0bn
Average loan size NOK1,366,000 OC (committed) 47% (2%)
WA Indexed LTV 56.5%
Seasoning* 56 months
NPL (>90 days) 0.10%
Fixed rate loans 9%
Interest only loans 31%
Geography 100% Norway
-Oslo 22%
-Akershus 18%
-Hordaland 8%
-Vestfold 7%
-Rogaland 7%
Asset type
- Owner occupied 87%
- Second home 1%
- Buy to let 0%
- Other 13%
Source: DNB Cover Pool Data (figures as at 30
June 2016), * source of seasoning information
Moody’s (March 2016).

58 | 6 September 2016 www.danskeresearch.com
No
rwe
gian
Co
vered B
on
ds
Eika Boligkreditt
Eika Boligkreditt
Obligasjoner med Fortrinnsrett
Company profile
Eika Boligkreditt is part of the Eika Alliance and is thus owned directly by 72 local savings
banks and the OBOS (Oslo Bolig and Sparelag) housing association. The alliance comprises the
Eika banks, Eika Gruppen and Eika Boligkreditt. It is the third-largest banking group in Norway,
with total assets of more than NOK370bn, almost a million clients and over 3,000 employees.
Eika Gruppen’s products and services are distributed through some 200 offices in Norway. The
Eika banks are present in 18 out of the 19 Norwegian counties, with a strong position in the
economic centres in Central and Eastern Norway.
In 2012, some changes were made to Eika Boligkreditt’s ownership structure and support
mechanisms. As of May 2012, ownership of Eika Boligkreditt (then Terra Boligkreditt) was
transferred from the group directly to the owner banks and OBOS. The ownership is dynamic in
the sense that each individual owner bank’s share is determined annually, on the basis of the
lending volume contributed to Eika Boligkreditt. Further measures were taken to improve
financial strength comprising a Note Purchase Agreement (NPA) and a Shareholder's
Agreement (SA). The NPA is structured to ensure the liquidity of Eika Boligkreditt, by
committing the owner banks to purchasing covered bonds from Eika Boligkreditt (primarily on
a pro rata basis) if funds should prove insufficient to cover redemptions. The SA commits the
owner banks to pay a pro rata share of any capital increase adopted at the issuer’s general
meeting and subscribe to a pro rata share of any capital instruments issued.
In November 2014, Sandnes Sparebank joined the Eika Alliance. Sandnes Sparebank is the 12th-
largest saving bank in Norway and is listed with equity certificate capital on the Oslo Stock Exchange.
As Sandnes Sparebank has its own covered bond entity (SSB Boligkreditt) and due to structural and
technical differences including different maximum LTV limit and separate lending systems, Sandnes
Sparebank decided in February 2016 to continue using SSB Boligkreditt instead of Eika Boligkreditt
for covered bond funding.
Furthemore, in January 2016, OBOS announced its intention to establish its own covered bond
issuance entity, OBOS Boligkreditt. As a result, the distribution agreement with Eika Boligkreditt was
terminated as of February 2017, at which point OBOS will no longer be able to transfer mortgage to
Eika Boligkreditt. By end-March 2017, OBOS had transferred residential mortgage amounting to
NOK7.9bn to Eika Boligkreditt, holding a 11.7% share in the latter. Eika Boligkreditt states in its Q1
2016 report that Eika Boligkreditt and OBOS will seek to reach agreement before the termination date
on the continuation of OBOS’s distributor responsibility for the existing residential mortgage portfolio
currently financed through Eika Boligkreditt, meaning that it will remain with the latter. The parties
consider it ‘very likely’ that such an agreement will be reached, according to Eika Boligkreditt.
Moody’s upgraded Eika Boligkreditt’s covered bonds from ‘Aa2’ to ‘Aa1’ in October 2014. The
upgrade was due to the increase in the CB anchor by one notch as Eika Boligkreditt’s debt ratio
went above 5%. This increases its ability to absorb losses in an issuer resolution scenario.
Although Moody’s does not disclose an issuer rating, together with a Timely Payment Indicator
(TPI) of ‘High’ and one notch TPI leeway, this indicates a shadow issuer CR assessment of
‘Baa2’. The rating of ‘Aa1’ was confirmed by Moody’s on 17 July 2015.
Table 81. Ratings
(Moody's/S&P/Fitch)
Covered bond rating Aa1/ - / -
Issuer rating - / - / - Moody's C-score 5.0%
- excl. syst. risk 2.0%
Moody's TPI High
Moody’s TPI Leeway 1
Moody's CB anchor CR Assessment +1
Source: Moody’s
Table 82. Financial information
No aggregated financial statements are
published by the owner banks
Source: Danske Bank Markets
Table 83. More information
Ticker EIKBOL Website eikabk.no
Source: Danske Bank Markets

59 | 6 September 2016 www.danskeresearch.com
No
rwe
gian
Co
vered B
on
ds
Eika Boligkreditt
Business model and funding profile
Eika Boligkreditt is the strategic funding company in the Eika Alliance, licensed as a credit
institution and authorised to raise loans in the market by issuing covered bonds. Issuance is done
under the EUR20bn European Medium-Term Covered Note Programme (EMTCN). Covered
bonds issued by Eika Boligkreditt are soft bullet with a 12 months maturity extension feature.
According to Eika Boligkreditt, the aim is to be a frequent benchmark issuer in both the EUR
and NOK covered bond markets, with the intention of maintaining two liquid yield curves.
Furthermore, the latest investor presentation from Eika Boligkreditt (June 2016) states that Eika
Boligkreditt will remain a frequent issuer in EUR, given the outlook for stable organic growth
and upcoming redemptions in EUR-denominated issues. We note that Eika Boligkreditt has two
EUR benchmark covered bonds maturing in 2017 (in January and November, respectively).
To ensure that originating banks are held responsible for potential losses, there is a two pillar
guarantee mechanism in place, including a loss guarantee and set-off rights.
Of any losses, including unpaid interest, on mortgages in Eika Boligkreditt’s portfolio, 80%
will be covered by the owner bank.
The guarantee from an owner bank will have a floor of NOK5m or 100% of the relevant
owner’s loan portfolio if it is lower than NOK5m.
The owner bank guarantee is limited to 1% of the owner bank’s total portfolio.
Of the loan, 100% is guaranteed by the bank until the collateral is registered.
The remaining 20% of the losses will be covered by a counter-claim on all commission
receivables due from Eika Boligkreditt to each owner bank.
Set-off rights are limited to a period of up to 12 months after such losses are incurred.
An agreement on loans in arrears is in place. In cases of a delayed payment (>35days), the
distributor solves the problem no later than two months after a delinquency by either giving the
customer extra credit or transferring the loan back to the bank.
Cover pool and asset quality
As of 31 March 2016, the cover pool totalled NOK74.0bn, comprising residential mortgage
assets (76%), co-operative housing mortgages (12%) and substitute/liquidity assets (12%).
Geographically, the majority of mortgage assets are located in Oslo (18%), Akershus (14%) and
Sør-Trøndelage (14%). Almost all mortgages are floating rate (95%). The weighted-average
LTV of the cover pool is low, at 42% on an indexed basis. Eika Boligkreditt does not allow for
loans in arrears in the pool.
Eika Boligkreditt states in the offering circular of its EMTCN Programme that it requires a level
of over-collateralisation higher than 5%. The C-score excluding systemic risk (2.0%) assigned
by Moody's, is the lowest of all rated programmes by the agency.
Eika Boligkreditt applies a number of eligibility criteria for mortgages included in the cover
pool. For example, customer categories are restricted to Norwegian retail clients and co-
operative housing associations. Furthermore, the LTV at the time of origination is limited to
60% (as opposed to the 75% limit stipulated by Norwegian legislation) and underlying properties
are restricted to standalone residential mortgages and co-operative residential housing. Also,
mortgages transferred to Eika Boligkreditt are not allowed to have had any arrears or losses since
inception.
Table 84. Cover pool information
Cover pool NOK74.0bn
- Residential housing NOK56.1bn
- Co-operative housing NOK9.1bn
- Substitute assets NOK8.7bn
Current OC (committed) 9.3% (5.0%)
WA LTV (indexed) 42.0%
WA seasoning* 27 months
NPL (>90D arrears) None
Floating rate loans 95%
Interest-only mortgages 27%
Flexible loans 0%
Geography: 100% Norway
- Oslo 18%
- Akershus 14%
- Sor-Trondelag 14%
- Rogaland 9%
- Ostfold 6%
Source: Eika Boligkreditt cover pool report Q1 16,
except *, which is Moody’s

60 | 6 September 2016 www.danskeresearch.com
No
rwe
gian
Co
vered B
on
ds
Nordea Eiendomskreditt
Nordea Eiendomskreditt
Obligasjoner med Fortrinnsrett
Company profile
Nordea Eiendomskreditt is a wholly owned subsidiary of Nordea Bank Norge ASA. The latter is
wholly owned by Nordea Bank AB (Nordea), which is rated ‘Aa3’/‘AA-’ (neg.)/‘AA-’ by
Moody’s/S&P/Fitch and is the parent company of the Nordea group.
Nordea Eiendomskreditt was first incorporated in 1927 as a credit association known as Norges
Hypotekforening for Næringslivet and it was acquired by Nordea in 1996. In 2008, the name
was changed to Nordea Eiendomskreditt and, in 2009, the company’s commercial property
lending activities were sold to Nordea Bank Norge. With effect from 2010, Nordea
Eiendomskreditt has been operating solely as a mortgage credit institution, with the business’s
objective to grant and acquire residential mortgage loans and to fund its lending activities
primarily via issuance of covered bonds. The loans are originated by Nordea Bank Norge and
subsequently transferred to Nordea Eiendomskreditt.
At the beginning of 2016, Nordea Bank AB announced plans to merge with its subsidiary banks
Nordea Bank Danmark, Nordea Bank Finland and Nordea Bank Norge, which will become
branches of the mother company. The original plan for the implementation was set at 1 July
2016 but Nordea postponed the process; however, the bank still expects the restructuring to take
place in 2016.
Nordea Bank AB is the leading bank in the Nordic region in terms of market value and total
assets. The group has operated as Nordea since 2001 and targets a European cross-border
operating model. The group originated with the establishment of MeritaNordbanken in 1997,
which combined Merita Bank of Finland and Nordbanken of Sweden and was completed in 2000
with the merger with Unidanmark of Denmark and the acquisition of Christiana Bank of
Norway. Nordea has a distinctive footprint in the Nordic area and leading positions in retail
banking, corporate finance and savings management, supported by around 11 million customers
and over 32,000 employees.
Parent bank Nordea Bank AB is rated ‘Aa3’, ‘AA-’, ‘AA-’ by Moody’s, S&P and Fitch,
respectively. Moody’s has a ‘Aa3’ rating assigned to Nordea Bank AB with a stable outlook,
reflecting the banking group’s diversified regional footprint in the Nordic region, its stable and
resilient earnings stream, good operational efficiency and credit quality. S&P rates the bank
‘AA-’ but with a negative outlook.
Financial performance
In 2015, operating profit increased 9% to EUR4,704m (2014: EUR4,324m). Net interest income
decreased by 7% compared with 2014, due to negative interest in Denmark, Sweden and euro
countries. Feed and commission income rose 6%. Furthermore, net loan loss provisions fell 10%
to EUR479m, corresponding to a loan loss ratio of 14bp (2014: 19bp).
The core tier 1 capital ratio excluding transition rules improved further in 2015 to 18.5%, up
from 17.6% at end-2014. The total capital ratio increased to 21.6%. Nordea’s capital policy
stipulates a target minimum for the common equity tier 1 capital ratio (above 13%) and for the
total capital ratio (above 17%).
Table 85. Ratings
(Moody’s/S&P/Fitch)
Covered bond rating: Aaa/-/-
Issuer rating* Aa3/AA-(n)/AA- Moody’s C-score: 5.0%
Moody’s TPI: Probable-High
Moody’s CB anchor Aa2 (cr) + 1
Moody’s TPI leeway 5 notches
* Rating of Nordea Bank AB
(n) = negative outlook
Source: Moody’s, Standard & Poor’s, Fitch, Danske
Bank Markets
Table 86. Financial info (Nordea group)
EURm 2015 2014
Net interest income 5,110 5,482
Fees and commissions 3,025 2,842 Net gain/losses 1,703 1,425 Pre-provision income 5,183 4,858
Loan losses and provisions 479 534 Operating profit 4,704 4,324 Net interest margin 0.92% 1.08%
Net charge-off rate 0.14% 0.19% Tier 1 capital ratio 18.5% 17.6% Total capital ratio 21.6% 20.7%
Source: Nordea Annual Report 2015
Table 87. More info
Bond ticker: NDASS Web site: www.nordea.com
Source: Danske Bank Markets
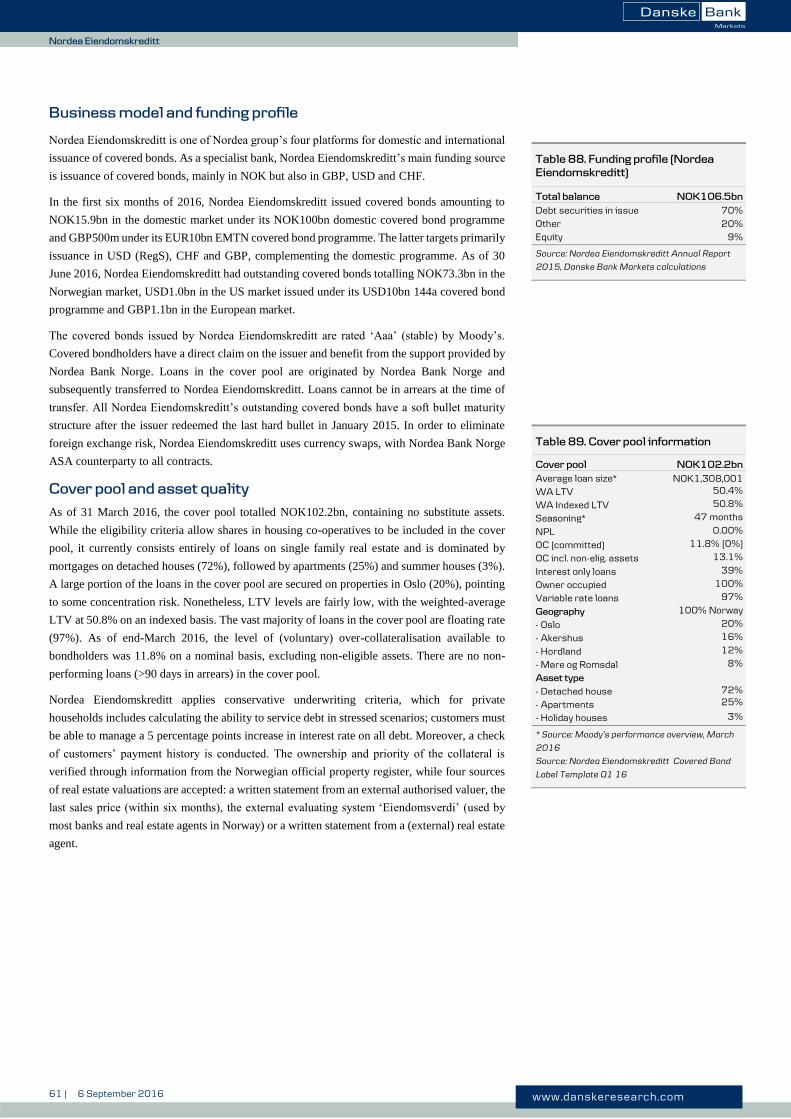
61 | 6 September 2016 www.danskeresearch.com
No
rwe
gian
Co
vered B
on
ds
Nordea Eiendomskreditt
Business model and funding profile
Nordea Eiendomskreditt is one of Nordea group’s four platforms for domestic and international
issuance of covered bonds. As a specialist bank, Nordea Eiendomskreditt’s main funding source
is issuance of covered bonds, mainly in NOK but also in GBP, USD and CHF.
In the first six months of 2016, Nordea Eiendomskreditt issued covered bonds amounting to
NOK15.9bn in the domestic market under its NOK100bn domestic covered bond programme
and GBP500m under its EUR10bn EMTN covered bond programme. The latter targets primarily
issuance in USD (RegS), CHF and GBP, complementing the domestic programme. As of 30
June 2016, Nordea Eiendomskreditt had outstanding covered bonds totalling NOK73.3bn in the
Norwegian market, USD1.0bn in the US market issued under its USD10bn 144a covered bond
programme and GBP1.1bn in the European market.
The covered bonds issued by Nordea Eiendomskreditt are rated ‘Aaa’ (stable) by Moody’s.
Covered bondholders have a direct claim on the issuer and benefit from the support provided by
Nordea Bank Norge. Loans in the cover pool are originated by Nordea Bank Norge and
subsequently transferred to Nordea Eiendomskreditt. Loans cannot be in arrears at the time of
transfer. All Nordea Eiendomskreditt’s outstanding covered bonds have a soft bullet maturity
structure after the issuer redeemed the last hard bullet in January 2015. In order to eliminate
foreign exchange risk, Nordea Eiendomskreditt uses currency swaps, with Nordea Bank Norge
ASA counterparty to all contracts.
Cover pool and asset quality
As of 31 March 2016, the cover pool totalled NOK102.2bn, containing no substitute assets.
While the eligibility criteria allow shares in housing co-operatives to be included in the cover
pool, it currently consists entirely of loans on single family real estate and is dominated by
mortgages on detached houses (72%), followed by apartments (25%) and summer houses (3%).
A large portion of the loans in the cover pool are secured on properties in Oslo (20%), pointing
to some concentration risk. Nonetheless, LTV levels are fairly low, with the weighted-average
LTV at 50.8% on an indexed basis. The vast majority of loans in the cover pool are floating rate
(97%). As of end-March 2016, the level of (voluntary) over-collateralisation available to
bondholders was 11.8% on a nominal basis, excluding non-eligible assets. There are no non-
performing loans (>90 days in arrears) in the cover pool.
Nordea Eiendomskreditt applies conservative underwriting criteria, which for private
households includes calculating the ability to service debt in stressed scenarios; customers must
be able to manage a 5 percentage points increase in interest rate on all debt. Moreover, a check
of customers’ payment history is conducted. The ownership and priority of the collateral is
verified through information from the Norwegian official property register, while four sources
of real estate valuations are accepted: a written statement from an external authorised valuer, the
last sales price (within six months), the external evaluating system ‘Eiendomsverdi’ (used by
most banks and real estate agents in Norway) or a written statement from a (external) real estate
agent.
Table 88. Funding profile (Nordea
Eiendomskreditt)
Total balance NOK106.5bn
Debt securities in issue 70%
Other 20% Equity 9%
Source: Nordea Eiendomskreditt Annual Report
2015, Danske Bank Markets calculations
Table 89. Cover pool information
Cover pool NOK102.2bn
Average loan size* NOK1,308,001 WA LTV 50.4%
WA Indexed LTV 50.8%
Seasoning* 47 months
NPL 0.00%
OC (committed) 11.8% (0%)
OC incl. non-elig. assets 13.1%
Interest only loans 39%
Owner occupied 100%
Variable rate loans 97%
Geography 100% Norway
- Oslo 20%
- Akershus 16%
- Hordland 12%
- Møre og Romsdal 8%
Asset type
- Detached house - Apartments
72% 25%
- Holiday houses 3%
* Source: Moody’s performance overview, March
2016
Source: Nordea Eiendomskreditt Covered Bond
Label Template Q1 16
62 | 6 September 2016 www.danskeresearch.com
No
rwe
gian
Co
vered B
on
ds
SpareBank 1 Boligkreditt
SpareBank 1 Boligkreditt
Obligasjoner med fortrinsrett
Company profile
SpareBank 1 Boligkreditt (SPABOL) is a separate legal entity owned by the banks in the
SpareBank 1 Alliance. The alliance was established in 1996 by major Norwegian regional
savings banks. The founding banks were SpareBank 1 SNN (rated ‘A1/A’ by Moody’s/Fitch),
SpareBank 1 SMN (‘A1/A-’) and SpareBank 1 SR-bank (‘A1/A-’). A group of smaller savings
banks in eastern/southern Norway joined the alliance shortly thereafter, and in 2005 SpareBank
1 Hedmark (‘A2’ by Moody’s) in the east of the country joined. Today, the alliance consists of
the four regional banks, and 11 local savings banks. By total assets, SpareBank 1 Alliance is the
second largest lender in Norway (after DNB).
The SpareBank 1 banks operate exclusively in Norway and are mostly involved in retail
mortgage lending. Approximately 70% of the aggregated loan book represents retail mortgage
lending, while lending to commercial real estate projects is the second largest category of loans
(12%). In the areas where the large regional banks are domiciled, the SpareBank 1 Alliance has
a market share of 30-50%. However, on a national level, the market share in residential
mortgages is only c.20%, due to an under-representation in Oslo and the surrounding areas,
where the population is concentrated.
The member banks in the alliance work in part through common projects and in part through the
jointly owned holding company SpareBank 1 Gruppen AS (SP1G). The latter was founded by
the alliance in 1996 and is an unlisted financial holding company. Through its subsidiaries,
SP1G provides general and life insurance, fund management and other financial products and
services to members of the alliance and their customers, as well as to members of the Norwegian
Federation of Trade Unions. Furthermore, the member banks in the alliance are the direct owners
of several subsidiaries, including SpareBank 1 Næringskreditt (covered bond issuer based on
commercial cover pool assets) and SPABOL.
SPABOL was established in 2005 with the sole purpose of issuing covered bonds backed by
mortgages on retail properties and governmental loans in Norway. This involves purchasing and
transferring mortgages from constituent banks of the SpareBank 1 Alliance and marketing the
covered bonds to investors (SPABOL itself does not originate loans). The relative share of
mortgage loans in SPABOL’s cover pool determines each bank’s ownership share of SPABOL.
As of 1 January 2016, SpareBank 1 Hedmark held the largest share (19.7%), followed by
Sparebank 1 SMN (19.0%), SpareBank 1 SNN (14.5%) and SpareBank 1 SR-Bank (16.7%),
with the remaining 30.1% held by the 11 smaller SpareBank 1 banks.
The ownership banks have agreed to support SPABOL’s capital if there is a credit event, and
have thus committed to maintain a minimum core Tier 1 ratio in SPABOL of 9% (currently
under review for an increase to 11%). The commitment is first determined on a pro-rata basis
based on the banks’ ownership shares, but in the second instance it is a joint commitment limited
to twice each bank’s initial commitment.
Table 90. Ratings
(Moody’s/S&P/Fitch)
Covered bond rating Aaa/-/AAA
Issuer rating -/-/A- Moody’s C-score: 5.0%
- excl. systemic risk: 2.5%
Moody’s TPI: High
Moody’s CB anchor: CR Ass. + 1
Moody’s TPI leeway 4 notches
Fitch D-Cap 4
Source: Rating agencies, Danske Bank Markets
Table 91. Financial information
No aggregated financial statements are published by the owner banks
Source: Danske Bank Markets
Table 92. More information
Bond ticker: SPABOL Website: www.sparebank1.no
Source: Danske Bank Markets

63 | 6 September 2016 www.danskeresearch.com
No
rwe
gian
Co
vered B
on
ds
SpareBank 1 Boligkreditt
Business model and funding profile
SPABOL issues covered bonds backed by loans purchased from and originated by its owner
banks. The SpareBank 1 Alliance banks grant mortgage loans using the same mortgage
origination process. The general lending policy includes a maximum LTV limit of 85%.
Furthermore, the guidelines restrict lending amounts to three times gross income and
affordability to the borrower is stressed by a 5% interest rate rise when evaluating a mortgage
application. In addition, the customer’s past behaviour plays a key role. For amortizing loans
included in the cover pool, SPABOL applies an LTV limit of 75%, in line with the legal
requirement. Loans for which the LTV level has risen above the legal limit may stay in the pool,
but the share of the loan above 75% is disregarded for asset-liability testing. By end-June 2016,
the share of the number of loans in the cover pool with LTV above this limit was 2.1%.
SPABOL issues covered bonds in EUR, NOK, SEK and USD out of its EUR25bn Global
Medium Term Note Covered Bond Programme. EUR issuance is intended to provide access to
longer-term funding, while the USD leg was set up in October 2010 for diversification purposes.
Currency exposure is hedged back to NOK via swaps. Issuance in NOK is done on a tap basis
and although the market is shallower than the EUR market, it offers advantages in terms of
hedging costs. In addition to one SEK covered bond outstanding (SEK250m), SPABOL set up
a AUD2bn covered bond programme in February 2014 for further diversification (no bonds have
yet been issued).
As a specialist bank, SPABOL’s liabilities consist primarily of issued covered bonds. On the
individual bank level, the SpareBank 1 Alliance has both a strong deposit base and access to
senior unsecured markets. However, covered bonds remain a core funding source and SPABOL
is committed to maintaining its benchmark curves.
Cover pool and asset quality
As of 30 June 2016, the total cover pool stood at NOK198bn, of which mortgages made up
NOK172bn. The remaining substitute assets comprised a 67/33 mix of NOK and EUR (plus
minor exposures in USD) mainly placed in covered bonds (83%).
The relatively large share of substitute assets is due to upcoming bond maturities. SPABOL is
committed to maintaining a liquidity reserve with a minimum size covering all maturities within
six months and 50% of all maturities between six and 12 months, in effect meeting the proposed
NSFR criteria and the already implemented LCR rule.
The pool LTV (indexed) is fairly low at 50%. The pool seasoning is 39 months. Geographically,
the pool is well diversified across Norway with a fairly modest share in Oslo, reflecting the
relatively broad physical coverage of the banks in the SpareBank 1 Alliance. The OC level stands
at 9.0%, of which 2% is provided on a committed basis. SPABOL further reports a ‘stressed
OC’ (assuming 15% house-price declines) of 7.6%, indicating the strength of the cover pool.
The eligibility criteria for the cover pool permit only prime retail residential mortgages
originated by the SpareBank 1 Alliance banks and certain other banks owned by the Alliance
banks on property located in Norway. Borrowers must be either employed or self-employed.
Furthermore, the criteria exclude mortgages used to finance buy-to-let properties, by limiting
the number of mortgages per customer. Mortgages with a balance below NOK0.2m or above
NOK12m are excluded, as are new mortgages backed by holiday properties (as of H1 2013).
SPABOL applies a 75% LTV limit for amortizing mortgages, in line with the legal criteria.
However, in the case of revolving balance mortgages (flexible mortgage loans), the eligibility
criteria stipulate a 60% LTV limit, which is stricter than the 75% legislative LTV limit (under
the new regulation, banks may only grant non-amortizing mortgages up to an LTV level of 70%).
Table 93. Funding profile (SPABOL)
Total balance NOK269.2bn
Debt securities 81%
- Covered bonds 80%
Collateral received 14%
Equity 4%
Other 1%
Source: SpareBank 1 Boligkreditt Annual Report
2015, Danske Bank Markets calculations
Table 94. Cover pool information
Cover pool NOK198bn
- substitute assets* NOK26bn
Average loan size NOK1,286,759 WA LTV 59%
WA Indexed LTV 50%
Seasoning 39 months
NPL (>90d) 0.00%
OC (committed) 9% (2%)
Interest-only loans 0%
Flexible loans 34%
Owner occupied 100%
Variable rate loans 100%
Geography 100% Norway
- Rogaland
- Sør Trøndelag
13% 11%
- Akershus 11%
- Oslo 11%
- Hedmark 7%
Asset type
- House 76%
- Apartment 19%
- Holiday houses 4%
*NOK/EUR/USD: 67%/33%/0%
Covered bonds: 83%
SSA Senior unsecured bonds (rated ‘AAA’): 10%
Norwegian government bills: 4%
Deposits: 3%
Source: SPABOL Covered Bond Investor Report
Q2 2016

64 | 6 September 2016 www.danskeresearch.com
No
rwe
gian
Co
vered B
on
ds
Sparebanken Sør BK AS
Sparebanken Sør BK AS
Obligasjoner med fortrinsrett
Company profile
Sparebanken Sør is a Norwegian regional bank, formed by the January 2014 merger of
Sparebanken Pluss and Sparebanken Sør. The bank is based in Kristiansand on the southern
coast of Norway and has 40 branches spread across the Norwegian counties of Vest-Agder,
Aust-Agder and Telemark. Sparebanken Pluss, the acquiring bank in the merger, traces its
origins back to Christianssands Sparebank (established in 1824) and emerged from a series of
mergers with local savings banks. The wholly owned mortgage subsidiary Sparebanken Pluss
Boligkreditt was established in 2009. Following the merger of the parent banks, Sparebanken
Pluss Boligkreditt merged with Sparebanken Sør Boligkreditt in 2014. The resulting entity
Sparebanken Sør Boligkreditt is owned wholly by Sparebanken Sør.
Sparebanken Sør provides retail and corporate banking services to individuals, companies and
public authorities. In terms of total assets, Sparebanken Sør ranks fifth among Norwegian
savings banks, with a group balance sheet of some NOK100bn. While its national market share
is limited at around 2%, it commands considerable market shares within the counties of Vest-
Agder, Aust-Agder and Telemark of nearly 26% for lending and 35% for deposits, according to
Moody’s. In addition to Sparebanken Sør Boligkreditt, subsidiaries include Sørmegleren, which
provides real estate brokerage services. Furthermore, Sparebanken Sør is affiliated with Frende
Forsikring (insurance, 10% held), Brage Finans (financing, 14% held) and Norne Securities
(investment banking, 18% held).
Regarding its ownership structure, in line with other Norwegian savings banks, Sparebanken
Sør is an independent foundation with equity certificate (EC) holders. ECs have clear similarities
to shares but differ in their owners’ rights to the bank’s assets and influence over the bank’s
governing bodies. The main holder is Sparebankstiftelsen Sparebank Sør, a foundation
established in connection with the conversion of Sparebanken Sør’s primary capital to ECs in
2012. According to its articles, Sparebankstiftelsen Sparebank Sør must always hold 51% of the
outstanding ECs.
Sparebanken Sør’s loan book is dominated by retail loans, mostly mortgages, representing 65%
of the loan book at end-2015. Of the remainder, rental properties, real estate development and
construction account for a combined 65% of the total exposure.
Financial performance
Sparebanken Sør achieved a pre-tax profit of NOK855m in 2015, which was slightly lower than
in 2014 (NOK1,100m). The decline was due mainly to lower net trading income. Net interest
income was slightly higher at NOK1,521m (2014 NOK1,511m), as the 9.2% lending volume
increase recorded in the year compensated for lower margins. Income from commissions
increased slightly to NOK300m (2014 NOK284m), reflecting mainly increased activity in real
estate brokerage services. Loan losses declined to NOK97m (2014 NOK268m), corresponding
to 11bp of total lending (2014 33bp). In this regard, we note that impairments in 2014 were
adversely affected by the corporate portfolio review undertaken during the year, resulting in
increased provisions for future losses. The return on equity in 2015 was 8.4%.
During 2015, Sparebanken Sør’s CET1 ratio declined to 12.7%, reflecting strong lending
growth. In the third quarter, the Norwegian FSA communicated its expectation that the bank
Table 95. Ratings
(Moody’s/S&P/Fitch)
Covered bond rating Aaa/-/-
Issuer rating A1/-/- Moody’s C-score: 5.0%
- Excl. syst. risk 4.7%
Moody’s TPI: High
Moody’s CB anchor: Aa3(cr) + 1
Moody’s TPI leeway 5 notches
Source: Rating agencies, Danske Bank Markets
Table 96. Financial information
(Sparebanken Sør Group)
NOKm 2015 2014 2013 2012 2011 2010 2009
Net interest income 1,521 1,511 2,119 27,216 25,252 23,436 22,633 Fees and commissions 300 284 1,824 6,962 6,879 7,293 6,655
Net gain financial instr. -66 184 167 18,129 13,495 20,035 19,748
Operating costs 817 634
Pre-provision profit 952 1,368 2,479 20,957 21,853 21,081 18,716
Loan losses and provisions 97 268 132 3,179 3,445 2,997 7,710
Operating profit (pre-tax) 855 1,100 2,347 17,776 18,407 18,108 11,032
Cost/income ratio 46.2% 43.2% 44.9% 1.50% 1.50% 1.55% 1.71%
CET1 capital ratio 12.7% 13.1% 11.1% 49.1% 47.1% 47.6% 48.4%
Total capital ratio 15.5% 15.1% 12.8% 10.7%
Source: Sparebanken Sør Q4 15 report
Table 97. More information
Bloomberg ticker: PLUSSB/SPBKPL Website: www.sor.no
Source: Danske Bank Markets
65 | 6 September 2016 www.danskeresearch.com
No
rwe
gian
Co
vered B
on
ds
Sparebanken Sør BK AS
should target a CET1 ratio of 14.5% by end-2016. In February 2016, Sparebanken Sør
announced a rights issue of up to NOK600m to meet the increased capital requirement.
According to the bank, the rights issue, which was fully subscribed, should raise its CET1 ratio
by 1pp. Thus, further measures would still be needed to achieve the required increase in the
CET1 capital ratio.
Funding profile and liquidity
Until now, Sparebanken Sør has relied on the domestic market for its debt issues. At end-2015,
total wholesale funding amounted to NOK42bn, of which NOK22bn was covered bonds issued
through Sparebanken Sør Boligkreditt. However, the bank also has a strong deposit base,
amounting to 48% of total liabilities at end-2015.
Sparebanken Sør’s fixed income portfolio, which is included in the liquidity buffer, totalled
NOK11bn at end-2015, comprising government and government-guaranteed bonds, covered
bonds and municipal bonds.
Cover pool and asset quality
As of 31 March 2016, the total cover pool stood at NOK28.6bn, comprising 100% Norwegian
residential mortgage loans. There are no substitute assets in the cover pool. The weighted-
average loan-to-value (LTV) is 54% on an indexed basis (59% using non-indexed figures). The
Norwegian covered bond legislation stipulates a 75% LTV cap for residential mortgage loans
based on prudent market value. We note that a share of the loans in the cover pool has indexed
LTVs exceeding this cap. Such loans are eligible for cover pool inclusions but only the part that
has an LTV below 75% is taken into account for coverage calculations. The weighted-average
seasoning of the cover pool is 35 months, which is relatively low. There are no non-performing
loans in the cover pool.
Geographically, the pool reflects the bank’s main operating area, being concentrated in southern
Norway, as well as a share of loans backed by properties in Oslo. In particular, there is some
concentration risk in the cover pool due to the large exposure to properties located in the county
of Vest-Agder (44% of the cover pool balance). This said, we note that recent price
developments in this region have been relatively more stable than in, for example, the western
parts of the country, which we view as positive.
The level of overcollateralisation (OC) stands at 10.7%, taking into account any non-eligible
loan balances. Moreover, the issuer has committed to maintaining an OC level of 2%. The level
consistent with the current ‘Aaa’ Moody’s rating is 1.0%.
The share of amortising loans is 70%, with the remainder being either bullet loans (1%) or
flexible loans (27%). The latter permit borrowers to increase the loan amount within the agreed
limit, or to make early repayments.
Sparebanken Sør Boligkreditt currently has 12 NOK-denominated covered bonds outstanding,
amounting to NOK20.3bn, as well as one EUR500m March 2021 benchmark outstanding. The
covered bonds have a 12-month soft bullet maturity structure.
Covered bonds issued by Sparebanken Sør Boligkreditt are rated ‘Aaa’ by Moody’s. According
to Moody’s, the covered bond rating is linked to the credit strength of the issuer’s parent
company, as Sparebanken Sør has established a revolving credit facility for the benefit of the
issuer and performs a range of functions for Sparebanken Sør Boligkreditt. The collateral score
assigned by Moody’s is 5.0% (4.7% excluding systemic risk). This is quite low, pointing to
strong cover pool credit quality.
Table 98. Funding profile (group)
Total balance NOK101bn
Due to banks 0.6% Retail deposits 23.5%
Other deposits 24.2%
Bonds issued 41.3%
Other liabilities 2.7%
Equity certificates 0.5%
Other equity 7.2%
Source: Sparebanken Sør Q4 15 report , Danske
Bank Markets calculations
Table 99. Cover pool information
Cover pool NOK28.6bn
Substitute assets 0%
Average loan size NOK1,064,160 WA indexed LTV 54.0%
WA LTV 59.2%
WA seasoning 35 months
WA remaining term 207 months
NPL (>90d) 0.00%
OC (committed) 10.7% (2.0%)
Interest-only mortgages 1.2%
Flexible loans 28.4%
Floating rate 100%
Owner occupied 100%
Geography 100% Norway
- Vest-Agder 44.3%
- Aust-Agder 28.2%
- Oslo 8.6%
- Telemark 8.3%
- Other (<5%) 10.6.%
Source: Sparebanken Sør Cover Pool report, 31
March 2016
66 | 6 September 2016 www.danskeresearch.com
No
rwe
gian
Co
vered B
on
ds
Sparebanken Vest Boligkreditt
Sparebanken Vest Boligkreditt
Obligasjoner med Fortrinnsrett
Company profile
Sparebanken Vest Boligkreditt, the wholly owned covered bond issuing subsidiary of
Sparebanken Vest, was established on 22 May 2008, with the sole intent of issuing covered
bonds, thus broadening the bank’s funding base. The parent, Sparebanken Vest, is an
independent savings bank, incorporated in 1823, offering traditional banking services to both
retail and corporate clients. Moreover, the bank offers life and non-life insurance through Frende
Forsikring (39.7% ownership), securities brokerage through Norne securities (47.6%), leasing
through Brage Finans (49.9%) and real estate agency services through Eiendomsmegler Vest
(100%). The bank is the leading financial services group in western Norway, headquartered in
Bergen, with strong ties to the local and regional communities, and it is the third-largest savings
bank in Norway based on assets.
Sparebanken Vest was one of the original members of the Sparebank 1 Alliance, which consists
of three regional and several local savings banks. However, in 2004, Sparebanken Vest left
Sparebank 1 Alliance, acknowledging the importance of being a local bank rooted in the
neighbouring community. In 2011, Sparebanken Vest entered into an agreement concerning a
merger with Sparebanken Hardanger in order to strengthen further its market position in western
Norway.
As a savings bank, Sparebanken Vest has no owners or shareholders and like other savings
banks, the original ownership structure was based on a foundation. Since 1987, however,
Norwegian savings banks have been allowed to issue equity certificates in order to obtain capital.
Sparebanken Vest first issued equity certificates in 1995. Equity certificates have almost the
same characteristics as shares, being traded on the Oslo Stock Exchange, taxed as shares and
entitled to potential dividends. However, equity certificates give ownership rights to specific
parts of a bank’s capital. After merging with Sparebanken Hardanger, Hardanger Sparebankstift
has become the largest holder of Sparebanken Vest’s equity certificates with a 25.3% share.
Sparebanken Vest Boligkreditt’s covered bonds carry ‘Aaa’ rating by Moody’s. Sparebanken
Vest Boligkreditt itself is not rated but Moody’s considers its credit quality to be linked to that
of the parent bank, considering the revolving credit facility provided by the latter. Sparebanken
Vest itself is rated ‘A1’. In March 2016, Moody’s changed the outlook from ‘stable’ to
‘negative’ on five Norwegian banks, including Sparebanken Vest, citing asset quality concerns
due to its expectation of slowing growth in Norway. Given a TPI leeway of five notches, covered
bonds issued by Sparebanken Vest Boligkreditt have considerable buffer against potential
downgrades of the parent bank.
Financial performance
SVEG recorded an operating profit of NOK1,396m in 2015 (2014 NOK1,493m). The profit
performance was positively influenced by one-offs due to the sale of Nets AS for NOK166m
and the sale of some of the bank’s properties for NOK143m
Table 100. Ratings
(Moody's/S&P/Fitch)
Covered bond rating Aaa / - / -
Issuer rating (parent) A1(n)/ - / A- Moody's C-score 5.0%
- Excl. syst. risk 4.4%
Moody's TPI High
Moody's CB anchor Aa3 (cr) + 1
Moody’s TPI leeway 5 notches
Source: Rating agencies
Table 101. Financial information
(group)
NOKm 2015 2014 2013 2012
Net interest income 2,354 2,320 2,161 1,797 Fees & commission 403 400 378 346
Net gain/losses -83 248 114 276
Pre-provision income 1,505 1,760 1,501 147
Losses & provisions 185 410 280 2,658
Operating profit 1,396 1,493 1,221 1,283
Cost/income ratio 48.9% 45.5% 48.8% 56%
Core tier 1 capital ratio 13.7% 12.2% 11.2% 10.6%
Total capital ratio 18.6% 17.9% 18.1% 12.7%
Source: Sparebanken Vest Group annual report
2015
Table 102. More information
Bond ticker SVEGNO Web site spv.no
Source: Danske Bank Markets

67 | 6 September 2016 www.danskeresearch.com
No
rwe
gian
Co
vered B
on
ds
Sparebanken Vest Boligkreditt
Furthermore, 2015 saw an increase in net interest and credit commission income was also
slightly higher, while costs fell and the contribution to profits from associated companies was
stable. However, the contribution from financial instruments was negative, due primarily to the
widening of spreads in the bank’s liquidity portfolio, particularly in H2 15. Writedowns on loans
and losses on guarantees amounted to NOK185m (2014 NOK410m), corresponding to 0.15%
(0.35%) of gross lending.
The CET1 capital adequacy ratio (taking into account the Basel I floor) increased by 1.5
percentage points to 13.7% (2014 12.2%). Sparebanken Vest has set a target for its CET1 ratio
of 14.5% by end-2016 (previously 13.5%), reflecting a change in the authorities’ expectations.
Accordingly, Sparebanken Vest raised EUR750m of capital in Q4 15 through a rights issue to
existing equity certificate holders, as retained earnings alone would not have been sufficient to
cover the increase in the capital target. According to Moody’s, the bank will also have to limit
growth in risk-weighted assets to around 4% in 2016 in order to achieve the goal, down from
7.4% growth recorded in 2015.
Business model and funding profile
On a group basis, Sparebanken Vest is largely funded via deposits (40%) and debt
securities/bonds (48%). The bank pursues a strategy whereby long-term funding is raised by
issuing covered bonds through Sparebanken Vest Boligkreditt.
Sparebanken Vest Boligkreditt acquires mortgages from Sparebanken Vest via a true sale
process. Following this, Sparebanken Vest Boligkreditt issues covered bonds out of its
Boligkreditt using the transferred mortgages as collateral. Sparebanken Vest Boligkreditt issues
covered bonds out of its EUR8bn EMTN programme. Originally, the scope was limited to
EUR5bn but it was raised in 2012 as a part of the annual update of the documentation.
Cover pool and asset quality
As at end-March 2016, the cover pool amounted to NOK58.2bn, comprising prime residential
Norwegian mortgages and NOK3.7bn of substitute collateral. The latter consists of triple-A
rated Norwegian covered bonds (35%), Norwegian government bonds (20%) and a deposit
placed with Sparebanken Vest (64%). The overcollateralisation is reported at 13%, of which 2%
is provided on a committed basis. Sparebanken Vest Boligkreditt allows only for primary
residences and co-operative housing loans in the pool, i.e., no holiday and/or second homes are
included.
The WA indexed LTV is 55% and the seasoning 42 months. Most of the mortgage loans in the
pool carry a floating rate, with the share of fixed rate reported at 11%. The pool holds 0.06%
non-performing loans but these are not included in coverage calculations.
Geographically, the properties securing the mortgages in the cover pool are concentrated in the
western part of Norway, especially in the Hordaland region (76%) but also in neighbouring
Rogaland (13%) and Sogn and Fjordane (6%).
Table 103. Funding profile (group)
Total balance NOK162bn
Deposits 40% Debt to credit institutions 3%
Debt securities 48%
Subordinated debt 1%
Equity 7%
Other 2%
Source: Sparebanken Vest Group annual report
2014, Danske Bank Markets calculations
Table 104. Cover pool information
Cover pool NOK58.2bn
- substitute assets NOK3.7bn
Average loan size NOK1,215,000 OC (committed) 13% (2%)
WA Indexed LTV 55%
Seasoning 42 months
NPL (>90 days) 0.06%
Fixed rate loans 11%
Interest only loans 0%
Flexible loans 27%
Geography 100% Norway
-Hordaland 76%
-Rogaland 13%
-Sogn & Fjordane 6%
-Oslo 2%
-Akershus 1%
Source: Sparebanken Vest Boligkreditt Cover Pool
Data (figures as at 31 March 2016).

68 | 6 September 2016 www.danskeresearch.com
No
rwe
gian
Co
vered B
on
ds
SR-Boligkreditt AS
SR-Boligkreditt AS
Obligasjoner med Fortrinnsrett
Company profile
SR-Boligkreditt is a separate legal entity owned by SpareBank 1 SR-Bank (SR-Bank). SR-Bank,
headquartered in Stavanger, is the largest regional bank in Norway and the second-largest
Norwegian-owned bank after DNB. It mainly operates in south-west Norway and has a leading
market position in Rogaland (the county in which Stavanger is the main city) with a market share
of c.35% for lending. The bank services around 270,000 retail customers and some 14,000
corporate clients. In addition to banking, SR-Bank also has leasing activities, asset management
and owns a relatively large real estate broker.
With its roots going back to 1839, the bank is a result of a merger between 22 savings banks in
1976, when it was established as Sparekassen Rogaland. In 2007, it was renamed to its current
name. In January 2012, SR-Bank converted its equity certificates into ordinary shares. The
largest owner is the SpareBank-Foundation SR-Bank, with a stake of around 28%, while
Gjensidige Insurance owns around 10%. According to the articles, the foundation will own at
least 25% of the outstanding shares at all times – the aim being to ensure local regional
ownership. There are no voting restrictions.
In 1996, the SpareBank 1 Alliance was established with SR-Bank as one of the founding members
and it owns a 19.5% share of the holding company SpareBank 1 Gruppen. The alliance focuses on
bank and product cooperation among member banks in order to exploit economies of scale and
includes joint-product companies (such as fund management as well as life and non-life insurance).
As part of the SpareBank 1 Alliance, SR-Bank also owns a 16.7% stake in SpareBank 1
Boligkreditt (see separate issuer profile) and a 26.8% share in SpareBank 1 Næringskreditt
(ownership shares as of end-2015). The sole purpose of the two entities is to acquire residential and
commercial mortgages, respectively, from the owner banks in the SpareBank 1 Alliance, financed
by the issuance of covered bonds.
In March 2015, SR-Boligkreditt was established with the sole purpose of issuing covered bonds
backed by mortgages acquired from its owner, SR-Bank. According to SR-Bank, the motivation
for establishing SR-Boligkreditt was to optimise the funding mix while eliminating possible
limitations due to regulatory limits on large exposures. SR-Boligkreditt itself is unrated but
Moody’s considers the covered bond rating to be linked to the credit strength of the issuer’s
parent company, mainly because SR-Bank has established a revolving credit facility for the
benefit of the issuer. SR-Bank’s senior unsecured rating was lifted one notch to ‘A1’ (stable) in
May 2015. Covered bonds issued by SR-Boligkreditt are rated ‘Aaa’ by Moody’s. Given a TPI
leeway of four notches, there is a considerable buffer against potential downgrades of SR-Bank.
Financial performance
SR-Bank Group achieved pre-tax profits of NOK2,146m in 2015 (2014: NOK2,601m). The
net profit totalled to NOK1,746m, compared with NOK2,046m in 2014. Net interest
income amounted to NOK2,593m (2014: NOK2,404m). However, as a share of total assets
it fell to 1.42% (2014: 1.45%) due to pressure on home mortgage interest rates.
Table 105. Ratings
(Moody’s/S&P/Fitch)
Covered bond rating Aaa/-/-
Issuer rating (parent): A1/-/- Moody’s C-score: 5.0%
-excl. syst. risk 3.0%
Moody’s TPI: Probable-High
Moody’s CB anchor: Aa3(cr) + 1
Moody’s TPI leeway 4 notches
Source: Rating agencies, Danske Bank Markets
Table 106. Financial information
(SpareBank 1 SR-Bank Group )
NOKm 2015 2014 2013 2012 2011 2010 2009
Net interest income 2,593 2,404 2,119 27,216 25,252 23,436 22,633 Fees and commissions 1,532 1,732 1,824 6,962 6,879 7,293 6,655
Net gain/losses -135 236 167 18,129 13,495 20,035 19,748
Pre-provision profit 2,566 2,858 2,479 20,957 21,853 21,081 18,716
Loan losses and provisions 420 257 132 3,179 3,445 2,997 7,710
Operating profit (pre-tax) 2,146 2,601 2,347 17,776 18,407 18,108 11,032
Cost/income ratio 42.1% 41.8% 44.9% 1.50% 1.50% 1.55% 1.71%
CET1 capital ratio 13.3% 11.5% 11.1% 49.1% 47.1% 47.6% 48.4%
Tier 1 capital ratio 14.2% 12.3% 12.8% 10.7%
Total capital ratio 16.7% 14.5% 14.1% 11.0% 9.9% 10.1% 9.3%
Source: SpareBank 1 SR-Bank Group annual report
2015
Table 107. More information
Bond ticker: SRBANK Web site: http://www.sr-bank.no/sr-
boligkreditt
Source: Danske Bank Markets

69 | 6 September 2016 www.danskeresearch.com
No
rwe
gian
Co
vered B
on
ds
SR-Boligkreditt AS
Net commissions fell to NOK1,532 (2014: NOK1,732) primarily due to lower commissions
from SpareBank 1 Boligkreditt and SpareBank 1 Næringskreditt stemming from a lower share
of loans sold to the mortgage companies. Impairment losses on loans totalled NOK420m (2014:
NOK257m) as impairments on groups of loans increased by NOK140m due to external market
conditions and greater uncertainty arising from lower oil prices. In 2015, the CET1 ratio
increased from 11.5% to 13.3%, while the Tier 1 ratio including hybrid capital increased from
12.3% to 14.2%. SR-Bank has a CET1 target of 14.0% in 2016 and 14.5% in 2017, which it
expects to reach through retained profits and limited growth in risk-weighted assets.
Business model and funding profile
SR-Boligkreditt issues covered bonds backed by loans purchased from and originated by its
owner bank SR-Bank. For loans included in the cover pool, SR-Boligkreditt applies an LTV
limit of 70%, which is lower than the legal criteria of 75% for residential mortgages. By end-
June 2015, the share of loans in the cover pool with an indexed LTV above 70% was 11.1%.
Loans that rise above 75% LTV as a result of the revaluation remain in the cover pool but the
share of loans above 75% is disregarded for asset liability testing.
In terms of liquidity, SR-Boligkreditt is committed to maintaining a liquidity reserves,
committed loan facilities and other cash inflows shall as a minimum cover maturities and other
cash outflows over the next six months.
As of July 2016, SR-Boligkreditt has issued five covered bonds out of its EUR5bn Euro Medium
Term Note Covered Bond Programme, of which three were in EUR benchmark format maturing
in September 2020, September 2021 and January 2023, respectively. According to SR-
Boligkreditt, the intention is to be a regular issuer in the euro market, establishing a curve similar
to SR-Bank’s presence in the euro senior unsecured market (SR-Bank currently has five
outstanding senior unsecured euro benchmarks). All SR-Boligkreditt’s covered bonds are issued
with a 12-monts soft-bullet extension feature.
As a specialised mortgage credit institution, SR-Boligkreditt’s funding structure relies heavily
on covered bonds. As of Q1 16, 95% of its total liabilities consisted of covered bonds. On the
individual bank level, SR-Bank group has both a strong deposit base and access to senior
unsecured markets.
Cover pool and asset quality
As of 31 March 2016, the total cover pool stood at NOK16.1bn, of which mortgages made up
NOK15.6bn. The substitute assets totalled NOK554m. The cover pool’s indexed LTV is fairly
low at 52% and the pool is very well-seasoned with a weighted average of 81 months.
Geographically, the pool is concentrated in the south-west of Norway with 76% of the
underlying properties being located in Rogaland. Hordaland accounts for 12% of the pool,
followed by Vest-Agder (7%). Of the cover pool, 1% consist of loans originated in Oslo
inclusive Akershus.
The nominal OC level stood at 14%. The majority of the loans are secured by detached and
semi-detached houses (82%), followed by apartments (14%) and apartments in housing
cooperatives (1%). Only mortgages on owner-occupied properties are included in the cover pool.
SR-Boligkreditt applies a number of eligibility criteria to mortgages included in the cover pool
in addition to the requirements stipulated in the Norwegian covered bond legislation. For
example, mortgages used to finance buy-to-let properties and holiday homes are excluded and a
maximum LTV limit of 70% at the time of transfer (60% for flexible loans) applies.
Furthermore, there is a loan volume limit of NOK12m per client.
Table 108. Funding profile (Group)
Total balance NOK192.0bn
Deposits from customers 47%
Debt to financial institutions 3%
Debt securities 37%
Subordinated debt 2%
Equity 9%
Other 3%
Source: SpareBank 1 SR-Bank Group annual
report 2015, Danske Bank Markets calculations
Table 109. Cover pool information
Cover pool NOK16.1bn
- substitute assets NOK554m
Average loan size NOK1,563,080 WA Indexed LTV 52%
Seasoning 81 months
NPL (>90d) 0.00%
OC (committed) 14% (2%)
Interest-only loans 13%
Owner occupied 100%
Variable rate loans 100%
Geography 100% Norway
- Rogaland
- Hordaland
76% 12%
- Vest-Agder 7%
- Aust-Agder 2%
- Oslo 1%
Asset type
- Houses
- Apartments
82% 14%
- Apartment in housing cooperatives 4%
Source: SR-Boligkreditt Cover pool cut 31 March
2016

70 | 6 September 2016 www.danskeresearch.com
No
rwe
gian
Co
vered B
on
ds
Storebrand Boligkreditt
Storebrand Boligkreditt
Obligasjoner med Fortrinnsrett
Company profile
Storebrand Boligkreditt (formerly Storebrand Kredittforetag) is a wholly owned subsidiary of
Storebrand Bank ASA, part of the Storebrand Group. The Storebrand Group originated in 1767
and has offered occupational pensions to Norwegian employees since 1917. Storebrand Bank
was established in 1996 and in 2006 the group commenced sales of property and casualty
insurance products to the retail market. In 2007, the group acquired the Swedish life insurance
and pension provider SPP, which transformed Storebrand into the largest Nordic life and
pensions insurer. Today, the Storebrand Group consists of the business areas life and pension,
asset management, bank and insurance. At end-2015, the Storebrand Group had total assets of
NOK521bn.
Storebrand Bank is a web-based bank that offers traditional banking products to the Norwegian
market. Its main target group is employees with occupational pensions at Storebrand. At the end
of 2015, the bank group had 74,000 active Retail Market customers, with a lending volume of
NOK26.9bn and a volume of deposits of NOK17.4bn. In April 2013, Storebrand decided to wind
up the bank’s Corporate Market operations. According to Storebrand, the Corporate Market
business has a large portfolio of commercial property loans, which ties up a significant amount
of capital. Given that the bank’s Corporate Market is not a prioritised core activity, a decision
has thus been made to reduce capital consumption. According to Storebrand, the winding up of
the operation will be gradual and controlled, with existing customers being well looked after.
Storebrand Bank is rated ‘Baa1’ and ‘BBB+’ by Moody’s and S&P, respectively. In July 2016,
S&P revised the outlook to ‘stable’ from ‘negative’, reflecting the rating agency’s view that
Storebrand Bank is a core subsidiary of the Storebrand Group. Storebrand Bank has a stable
‘Baa1’ long-term rating from Moody’s. In July 2016, S&P initiated coverage of Storebrand
Boligkreditt’s covered bond programme, assigning a ‘AAA’ rating. In the absence of any unused
uplift, the stable outlook on the covered bonds reflects the stable outlook on the issuer’s parent
bank, i.e. Storebrand Bank. Likewise, Moody’s assigns a ‘Aaa’ rating to covered bonds issued
by Storebrand Boligkreditt. While Storebrand Boligkreditt itself is rated by neither Moody’s nor
S&P, both agencies consider its credit strength to be linked to that of the parent bank.
Financial performance
In 2015, Storebrand Bank achieved operating profits before taxes of NOK86m (2014 NOK192m).
Net interest income amounted to NOK377m (2014 NOK462m), equivalent to 1.13% of average
total assets, 0.13 percentage points lower than in 2014. The interest margin contracted due to the
reduced proportion of commercial loans and increased competition in the retail market. The decision
to wind up the Corporate Market was also the primary reason for the decline in net commission
income, which fell from NOK57m to NOK41m. Total loan losses amounted to NOK45m, compared
with minus NOK74m in 2014. The total volume of non-performing loans represented 0.6% of gross
lending in 2015 (2014 0.5%). Storebrand Bank’s capital adequacy ratio was 17.1% and the core
capital ratio was 15.2% (versus 15.0% and 13.3%, respectively, at end-2014).
Table 110. Ratings
(Moody’s/S&P/Fitch)
Covered bond rating Aaa/AAA/-
Issuer rating:* Baa1/BBB+/- Moody’s C-score: 5.0%
- Excl. syst. risk 3.8%
Moody’s TPI: High
Moody’s CB anchor: A3(cr) + 1
Moody’s TPI leeway 2 notches
S&P unused uplift: 0 notches
* Rating of Storebrand Bank ASA
‘n’ = negative outlook
Source: Moody’s, Standard & Poor’s, Fitch, Danske
Bank Markets
Table 111. Financial information
(Storebrand Bank Group)
NOKm 2015 2014 2013 2012 2011 2010 2009 2008
Net interest income 377 462 547 490 443 457 423 512 Fees and commissions 41 57 70 71 73 74 76 62
Net gain/losses* -26 7 -16 60 32 12 - -
Pre-provision profit 131 266 247 201 176 149 80 190
Loan losses and provisions 45 -74 -11 -8 -14 15 46 122
Operating profit 86 192 235 209 190 135 35 33
NPL 0.6% 0.5% 1.4% 0.8% 1.0% 2.0% 2.45% 1.8%
Cost/income ratio 68% 46% 57% 64% 66% 68% 71% 66%
Core tier 1 capital ratio 15.2% 13.3% 12.8% 11.2% 11.4% 10.6% 10.4% 8.1%
Core capital excl. hybrids 13.8% 11.9%
Total capital ratio 17.1% 15.0% 13.6% 11.8% 13.3% 13.0% 13.5% 10.8%
* Financial instruments
Source: Storebrand, Danske Bank Markets
Table 112. More information
Bond ticker: STBNO Web site: www.storebrand.no
Source: Danske Bank Markets
71 | 6 September 2016 www.danskeresearch.com
No
rwe
gian
Co
vered B
on
ds
Storebrand Boligkreditt
Business model and funding profile
The purpose of Storebrand Boligkreditt is to grant or purchase home mortgages. To do so,
Storebrand Boligkreditt may issue covered bonds and it is licensed as an issuer by the Norwegian
FSA. The mortgages are acquired from Storebrand Bank, which manages the mortgages owned
by Storebrand Boligkreditt. At end-2015, Storebrand Boligkreditt’s balance was NOK14.9bn
and it is an important part of Storebrand Bank’s strategic funding.
As of 31 December 2015, customer deposits were the dominant source of funding, making up
53% of Storebrand Bank Group’s funding. Saying this, most of these are internet deposits, which
Moody’s considers less sticky, and thus riskier from a funding perspective, than traditional
deposits. At end-2015, the deposit-to-loan ratio was 61% (2014 68%).
In addition, Storebrand Bank obtains its funding from the issuance of debt securities (36% of
total liabilities), of which the majority in percentage points terms is covered bond funding done
out of Storebrand Boligkreditt.
As a specialist mortgage lender, Storebrand Boligkreditt itself has a very transparent balance
sheet (not shown here). Liabilities consist almost entirely of covered bonds. Storebrand
Boligkreditt has established a EUR2.5bn European Medium-Term Covered Note Programme,
from which it may issue in any currency. However, the covered bonds currently outstanding are
all NOK denominated. The most recent issue took place in March 2016 and was a NOK2.5bn
floating-rate bond maturing in June 2021. At end-July 2016, five covered bonds were
outstanding, with maturities from 11 months to five years.
Due to a technical error in the payment process, Storebrand Boligkreditt failed to repay a
maturing bond on 15 June 2016. However, the bonds were repaid in full two days later and,
according to Moody’s, this incident did not result in a default, or affect the credit quality of the
programme.
Cover pool and asset quality
As at 31 March 2016, the cover pool stood at NOK14.7bn, comprised of NOK14.3bn residential
mortgages and NOK0.4bn substitute assets. The latter consists of NOK0.3bn deposits from
Storebrand Bank ASA and NOK0.1bn deposits from Nordea Bank Norge ASA. Over-
collateralisation based on eligible collateral only was 17%, given a total volume of issued
covered bonds of NOK12.4bn (nominal value). Storebrand Boligkreditt has committed to
maintaining a minimum over-collateralisation level of 9.5%, which is positive as Norwegian
legislation does not require mandatory over-collateralisation. The level of committed over-
collateralisation is above 5.0%, which Moody’s sees as consistent with the current triple-A rating
(according to the most recent performance overview). All mortgages in the cover pool are
floating rate. In terms of geography, Moody’s notes that the cover pool has some regional
concentration in Oslo and Akershus, two of the wealthiest regions in Norway.
As of end-March 2015, the weighted-average indexed LTV ratio was 48%. Overall, the credit
quality of the cover pool seems sound, with non-performing loans amounting to 0.08% of gross
lending, although matching tests do not take into account non-performing loans. The healthy
asset quality is also underscored by the covered bond programme achieving a Moody’s collateral
score of 3.8% excluding systemic risk.
Table 113. Funding profile 2015
(Storebrand Bank Group)
Total balance NOK33.6bn
Due to credit institutions 1% Deposits from customers 53%
Debt securities 36%
- Covered bonds 28%
Subordinated debt 1%
Equity 7%
Other 1%
Source: Storebrand Bank ASA Annual Report
2015, Danske Bank Markets calculations
Table 114. Cover pool info
Cover pool NOK14.7bn
- Substitute assets NOK0.4bn
Average loan size NOK1,654,876
OC (committed) 17% (9.5%)
WA Indexed LTV 48.0%
Seasoning* 40 months
NPL (>90 days) 0.08%
Fixed-rate loans 0%
Interest-only loans 22%
Flexible loans 28%
Geography 100% Norway
- Akershus 31%
- Oslo 29%
- Østfold 8%
- Rogaland 8%
* Comprising deposits from Storebrand Bank ASA
(76%) and Nordea Bank Norge ASA (24%)
Source: Storebrand Boligkreditt Q1 16 cover pool
report, Danske Bank Markets

72 | 6 September 2016 www.danskeresearch.com
No
rwe
gian
Co
vered B
on
ds

73 | 6 September 2016 www.danskeresearch.com
Sw
edish
Co
vered B
on
ds
Swedish Covered Bonds
Säkerställda obligationer
Background
The Swedish Covered Bond Act was passed in July 2004 but did not come into effect until 2006,
when the first Swedish issuers were licensed and started issuing covered bonds. Swedish
mortgage bonds (Bostadsobligationer) were, however, already an established asset class before
the Covered Bond Act became effective, with Sweden having one of the largest mortgage bond
markets in Europe (according to ECBC, total outstanding domestic Swedish covered bonds
amounted to EUR222bn as per end-2015). However, because investor protection in previous
Bostadsobligationer was unsatisfactory, they did not enjoy European covered bond status. In order
to issue covered bonds under the new Act, Swedish issuers were required to convert existing
Bostadsobligationer to Säkerställda obligationer (covered bonds). All previous
Bostadsobligationer now have the status of covered bonds.
In October 2006, Nordea Hypotek became the first issuer of a Swedish EUR covered bond.
SCBC (SBAB) and Stadshypotek (Handelsbanken) soon followed. Today, all former Swedish
mortgage bond issuers actively issue covered bonds. SEB has taken advantage of the
abandonment of the specialist banking principle in Sweden and merged former SEB Bolån into
parent bank SEB AB. SEB has taken over the licence to issue covered bonds under the Swedish
Covered Bond Act from SEB Bolån.
On 20 August 2012, Moody’s collectively raised the Timely Payment Indicator (TPI) for the
Swedish covered bond programmes rated by Moody’s from ‘Probable’ to ‘Probable-High’. The
main drivers, according to Moody’s, were (1) the strong liquidity and performance seen in
Swedish covered bond markets throughout the financial crisis and (2) the increased systemic
importance of the Swedish covered bond market as a funding tool for banks and the potential
government support implied by this.
In January 2015, Standard & Poor’s commented on the resilience of Swedish covered bond
ratings. According to the rating agency, even in a severe case, where Swedish house prices were
to fall by 30%, Swedish covered bond programmes rated by S&P are unlikely to be downgraded.
Further, in October 2015, Moody’s published a statement that the new 2% minimum OC
requirement is credit positive for investors in Swedish covered bonds because it provides an
absolute minimum buffer of cover pool assets that cannot be legally removed before or in the
event of an issuer default.
Key elements of the Covered Bond Act
As in Finland, Germany and Denmark, there is no specialist banking principle in Sweden.
Collateral assets may include residential and commercial mortgages (commercial mortgages are
limited to 10% of the total cover pool), public loans, derivatives and substitution assets to a
maximum 20% (the FSA can temporarily allow 30%). In line with UCITS 22(4) requirements, the
issuer will be subject to special public supervision. The issuer must keep a cover register of
collateral (including open hedge positions) and bonds issued. The issuer is not required to keep a
separate register of mortgage and public covered bonds, as is the case in Germany and Ireland.
Swedish Covered Bonds
74 | 6 September 2016 www.danskeresearch.com
Sw
edish
Co
vered B
on
ds
Swedish Covered Bonds
Mortgages that are more than 60 days in arrears cannot be recognised for the purpose of coverage
calculations.
LTV ratio limits are 75% and 60% for residential mortgages and commercial loans,
respectively. Agricultural loans can be included subject to an LTV ratio of 70% (if additional
security for that part of the loan that exceeds 60% is provided). Loans with higher LTVs may be
included in the cover pool, but only accounted up to the legal threshold.
The valuation of cover assets must be made prudently and the assessment must be on an
individual basis. Properties in the cover pool must be valued on an ongoing basis, i.e.
commercial properties every year and residential properties every third year. Eventually, if LTV
ratio limits are breached, the issuer is obliged to include substitution assets in the cover pool.
Substitution assets are limited to 20% of the pool and must comprise highly liquid assets.
In terms of ALM requirements, the Swedish Mortgage Act requires that the nominal value of
the cover assets must be greater than the aggregated nominal claims arising from the covered
bonds. Furthermore, the present value of the cover pool must exceed that of covered bonds and
derivatives, also under certain interest rate and currency rate stressed scenarios. If a loan is more
than 60 days in arrears, it cannot be included in the calculation of asset value. Additionally on
21 June 2016, the Swedish parliament has approved changes to the Covered Bond Act, proposed
by the government, to implement a minimum 2% legal over-collateralisation requirement.
Also, the 2% legal requirement is necessary for Swedish covered bonds to meet the criteria for
exemption from central clearing of cover pool derivatives under EMIR.
Asset segregation is secured through the cover register. Regarding bankruptcy proceedings,
the preferential right to cover assets is explicitly stipulated. Consequently, in the event of an
issuer’s insolvency, bondholders have a statutory preferential right to the cover pool. As in
Denmark and Germany, Swedish law stipulates that swap counterparties (for cover pool hedging
only) rank pari passu with bondholders regarding claims on the cover pool.
Further, the law defines mandatory procedures to be followed in case of bankruptcy and
procedures to ensure payments are made on time. Note that an issuer default does not prompt
an acceleration of covered bonds or a determination of derivative contracts. After an issuer has
been placed in liquidation or declared bankrupt, the Swedish FSA must appoint an administrator
to supervise the interests of all creditors. Therefore, there is no special covered bond
administrator as is the case in, for example, Germany. As of June 2010, amendments to the act
require that the bankruptcy administrator be given an express mandate, on behalf of the
bankruptcy estate, to take out liquidity loans and enter into other agreements for the purpose of
maintaining matching between the cover pool, covered bonds and derivative contracts.
Should funds prove insufficient to honour the bondholder’s claims, the covered bonds will
accelerate. Any unfulfilled claim will rank pari passu with other creditors.
In Table 115, we provide a summarised overview of the relative strengths and weaknesses of
the Swedish covered bond framework, as outlined by Moody’s in ‘Sweden – Legal Framework
for Covered Bonds’, published on 30 July 2014.

75 | 6 September 2016 www.danskeresearch.com
Sw
edish
Co
vered B
on
ds
Swedish Covered Bonds
Table 115. Relative strengths and weaknesses of the Swedish covered bond framework
Relative strengths Relative weaknesses
Covered bond law Commercial mortgages limited to 10% of the cover pool.
Loans <60 days past due not eligible for cover tests. Loan parts materially above LTV thresholds must be removed, which supports OC.
Stress tests for up to 30% in property value decline. Outcome must be reported to the FSA.
Post issuer default, the administrator can enter into, e.g. senior-ranking liquidity loans to mitigate refinancing risk.
Issuers must limit interest rate and currency risk by reference to material stresses (limited effectiveness if swap agreements in place).
Hedging agreements entered into (1) cannot provide for termination upon insolvency of the issuer and (2) are subject to initial requirements for counterparty credit quality (less effective for internal swap agreements).
Weaknesses may be mitigated by market practice, contractually or otherwise.
Before June 2016, the law did not provide for any minimum OC level. This has now changed (2%).
The law allows for an unsecured claim on the issuer. However, for the majority of specialist issuers there is no senior unsecured claim on the issuer’s rated parent.
Most derivative agreements are internal swaps that are generally less likely to survive issuer default compared to external swaps. Typically, collateral posting and replacement triggers are included to mitigate this risk.
Contractual features Post issuer default, the right to re-set interest rates on residential mortgages on a quarterly basis reduces the time the cover pool is exposed to refinancing risk.
Specialist issuers - no deposit taking will likely mitigate any set-off risk. Others may have contractual mitigants.
Bankruptcy of a parent/group from a specialist issuer does not necessarily trigger an immediate default/insolvency of the issuer. Solvent operation may continue for a period with possible access to other liquidity sources.
Source: Moody's, Danske Bank Markets
Credit quality
Overviews of Swedish cover pool characteristics are provided in the following table. As regards
most cover pool indicators, there is a high degree of homogeneity in Swedish cover pools.
Table 116. Cover pool overview Q1 16 – Q2 16
Landshypotek LF Hypotek Nordea Hyp. SCBC SEB Stadshypotek* Swedbank Hyp.
Cover pool (SEKbn) 68 156 488 240 485 634 791 Average loan size (SEK) 570,000 478,000 558,000 685,000 696,000 637,000 500,000 WA indexed LTV 43% 61% 51% 56% 57% 54% 63% WA seasoning 76 months 48 months** 63 months** 61 months** 65 months** 42 months 65 months Interest-only loans 4% 61% 40% 52% 40% 42% 48% Fixed-rate loans 49% 37% 21% 36% 26% 53% 31% Geography Sweden Sweden Sweden Sweden Sweden Sweden Sweden Asset type: - Residential 1% 100% 93% 99% 100% 98% 91% - Agriculture/forestry 99% 1% 7% - Commercial 3% - Public sector 3% 1% 2% 1%
* Swedish pool; ** Moody’s
Source: Company reports
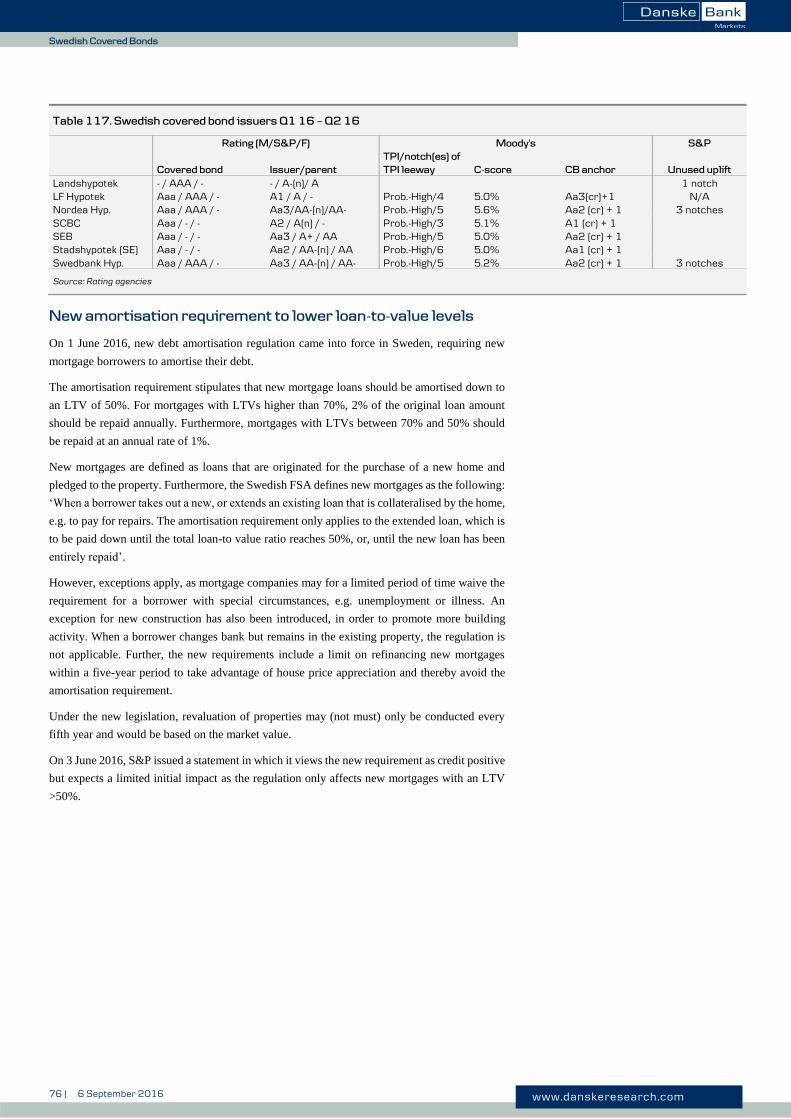
76 | 6 September 2016 www.danskeresearch.com
Sw
edish
Co
vered B
on
ds
Swedish Covered Bonds
Table 117. Swedish covered bond issuers Q1 16 – Q2 16
Rating (M/S&P/F) Moody's S&P
Covered bond Issuer/parent
TPI/notch(es) of
TPI leeway C-score CB anchor Unused uplift
Landshypotek - / AAA / - - / A-(n)/ A 1 notch LF Hypotek Aaa / AAA / - A1 / A / - Prob.-High/4 5.0% Aa3(cr)+1 N/A Nordea Hyp. Aaa / AAA / - Aa3/AA-(n)/AA- Prob.-High/5 5.6% Aa2 (cr) + 1 3 notches SCBC Aaa / - / - A2 / A(n) / - Prob.-High/3 5.1% A1 (cr) + 1 SEB Aaa / - / - Aa3 / A+ / AA Prob.-High/5 5.0% Aa2 (cr) + 1 Stadshypotek (SE) Aaa / - / - Aa2 / AA-(n) / AA Prob.-High/6 5.0% Aa1 (cr) + 1 Swedbank Hyp. Aaa / AAA / - Aa3 / AA-(n) / AA- Prob.-High/5 5.2% Aa2 (cr) + 1 3 notches
Source: Rating agencies
New amortisation requirement to lower loan-to-value levels
On 1 June 2016, new debt amortisation regulation came into force in Sweden, requiring new
mortgage borrowers to amortise their debt.
The amortisation requirement stipulates that new mortgage loans should be amortised down to
an LTV of 50%. For mortgages with LTVs higher than 70%, 2% of the original loan amount
should be repaid annually. Furthermore, mortgages with LTVs between 70% and 50% should
be repaid at an annual rate of 1%.
New mortgages are defined as loans that are originated for the purchase of a new home and
pledged to the property. Furthermore, the Swedish FSA defines new mortgages as the following:
‘When a borrower takes out a new, or extends an existing loan that is collateralised by the home,
e.g. to pay for repairs. The amortisation requirement only applies to the extended loan, which is
to be paid down until the total loan-to value ratio reaches 50%, or, until the new loan has been
entirely repaid’.
However, exceptions apply, as mortgage companies may for a limited period of time waive the
requirement for a borrower with special circumstances, e.g. unemployment or illness. An
exception for new construction has also been introduced, in order to promote more building
activity. When a borrower changes bank but remains in the existing property, the regulation is
not applicable. Further, the new requirements include a limit on refinancing new mortgages
within a five-year period to take advantage of house price appreciation and thereby avoid the
amortisation requirement.
Under the new legislation, revaluation of properties may (not must) only be conducted every
fifth year and would be based on the market value.
On 3 June 2016, S&P issued a statement in which it views the new requirement as credit positive
but expects a limited initial impact as the regulation only affects new mortgages with an LTV
>50%.

77 | 6 September 2016 www.danskeresearch.com
Sw
edish
Co
vered B
on
ds
Swedish Covered Bonds
Outlook for the Swedish economy
From an international viewpoint, the Swedish economy has managed an impressive recovery in
the wake of the global financial crisis (GFC) of 2007/08. In 2015, GDP growth was above 4%
y/y and all demand components are now above pre-crisis levels.
This said, from an historical perspective, the upswing fails to impress and, in particular, goods
exports have been weak, so the gap between pre-crisis GDP trend growth and the current GDP
level is still around 8%. Furthermore, the main impetus for Swedish GDP growth is undoubtedly
the very expansionary economic policies enacted over the past few years. Sweden’s strong fiscal
position has allowed for both tax cuts and public investment growth of some magnitude. In
addition, the Riksbank has been very aggressive, even pushing the main policy rate, the repo
rate, to -0.50% and buying government bonds to the tune of SEK245bn (by year-end 2016).
Domestic demand has responded in force to the significant stimuli; consumption growth and
(housing) investment growth is almost in line with pre-crisis trends and household savings have
simultaneously been historically high, implying some additional room for expanding
consumption. In a similar vein, Danske Bank’s international forecasts suggest a continued slow
improvement of the global economy. Alas, global investments are set to continue on the same
weak trajectory established following the global financial crisis. This is important input when
contemplating the outlook for the Swedish export sector, which consists mainly of input and
investment goods industries but also goes some way to explaining the stark deceleration in GDP
growth over the forecast period. In our forecasts, GDP grows by 2.6% y/y in 2016 and 1.4% y/y
in 2017.
Risks to the above forecasts stem mainly from external events such as those unfolding in Europe
(Brexit, Italian NPLs, etc.). However, the high leverage in the household sector and stretched
valuations on housing also constitute non-negligible risks to the outlook. The Swedish FSA and
other authorities are, nonetheless working to address these risks, with a newly instated
mandatory amortisation rule and weighing up a future debt to income target, or a phasing out of
the interest rate tax deductions.
Swedish labour markets are continuing to improve, with hours worked and employment rising
undeterred. However, the labour force is also increasing rapidly, due to large age cohorts
entering the labour force and due to a strong influx of immigrants. Given that migration has
recently been brought to an abrupt halt, we deem this to be of a transitory nature but the
‘backlog” of immigrants should nonetheless keep unemployment rates elevated throughout the
forecast horizon as the newly arrived leave introductory programmes and enter the workforce.
Albeit high from an international perspective, the historically slow GDP growth and rather
strong employment and hours worked growth puts Sweden in the same situation as many other
developed economies, with stubbornly low productivity growth. Simultaneously, due to a high
unemployment rate and low total demand, labour costs are low from an historical perspective
keeping inflation low. However, from an international perspective, costs are high and worsening
relative ULC (competitiveness) helps to explain why export growth has been so low and why
the forecast improvement in exports is weak from a cyclical perspective.
In our view, the current low-inflation situation and a sizable output gap should warrant extremely
low rates for the near future and it is only in 2018 that we expect a Riksbank hike. Also, near
term, we believe that the Riksbank will prolong its QE programme for at least another six months
(i.e. until summer 2017).
Chart 11. Swedish economy
Note: CPIF is CPI with fixed interest rates; GDP is
in volume terms and working days adjusted
Sources: Macrobond Financial, Danske Bank
calculations
Chief Economist Michael Boström +46 8 568 805 87 [email protected]

78 | 6 September 2016 www.danskeresearch.com
Sw
edish
Co
vered B
on
ds
Landshypotek Bank AB
Landshypotek Bank AB
Säkerställda obligationer
Company profile
Landshypotek Bank AB (LANHYP) is a borrower-owned bank, specialising in first mortgage
lending, secured on agricultural and forestry properties. LANHYP is owned by the 42,000
members of Landshypotek Ekonomisk Förening (LEF). As a LANHYP borrower, one
automatically becomes a member of LEF and thereby an owner of LANHYP. As a result of this
special structure, there is no conflict between the interests of the borrowers and those of the
owners. The bank originated in 1836 when the first mortgage bank was founded in Sweden.
With total lending of SEK64.5bn, according to its annual report for 2015, LANHYP is a
relatively small lender in the Swedish mortgage market. However, within its core markets
(agriculture and forestry) LANHYP is the leading lender. LANHYP’s covered bonds are rated
‘AAA’ (stable) by S&P while LANHYP itself carries ‘A-’ (negative) and ‘A’ (stable) ratings
from S&P and Fitch, respectively. Most recently, LANHYP’s outlook was changed to negative
by S&P to indicate the possibility of a downgrade should the negative economic risk trend in
Sweden materialise and if difficult operating conditions for the country's agricultural sector
erode Landshypotek's capital position.
LANHYP employs around 160 people distributed throughout eight districts and 19 sales offices
throughout Sweden, with customers also able to obtain loans and advisory services through the
internet. The eight districts all have access to a network of representatives who themselves run
agricultural businesses.
In March 2012, LANHYP applied for a licence to conduct banking operations. Following a
review from the Swedish FSA, the licence was granted in November 2012. One of the main
effects of LANHYP getting its banking licence is that it will now be licensed to take deposits.
Following this, LANHYP is able to offer deposit accounts, not only to its mortgage borrowers
but also to other clients. LANHYP stated that it intends to establish deposits as a key source of
funding. The aim is for deposits to make up 20% of funding. According to the year-end report
for 2015, deposits amounted to more than SEK10bn, up SEK4.5bn since end-2014. As at end-
2015, LANHYP’s holding of interest-bearing securities amounted to SEK13.4bn, comprising
mainly Swedish covered bonds and, to some extent, bonds issued by Swedish municipalities.
These securities make up LANHYP’s liquidity portfolio. LANSHYP’s management has decided
that the liquidity portfolio must be able to cover all cash outflows over a six-month period
without accessing market funding. By end-2015, this requirement was met by a factor of 1.6.
Financial performance
In 2015, LANHYP posted operating profit of SEK331m (2014: SEK385m), driven by an increase
in net interest income (up SEK102m), which improved due to higher lending, lower borrowing
costs and a higher percentage of interest compensation received. However, this was to some extent
offset by higher costs (up SEK40.6m), linked to the development of the bank. The total capital
ratio amounted to 26.1% and the CET1 ratio increased to 23.4% (2014: 21.0%)
Table 118. Ratings
(Moody’s/S&P/Fitch)
Covered bond rating: -/AAA/-
Issuer rating: -/A- (n)/A S&P unused notches: 1
Source: Rating agencies
(n) = negative outlook
Table 119. Financial information
(Group)
SEKm 2015 2014 2013 2012 2011 2010
Net interest income 779 677 656 578 505 472 Fees and commissions -25 -14 -20 -9 -9 -9
Financial transactions 8 146 -35 -49 -3 4
Pre-provision income 377 465 321 277 522 357
Loan losses and provisions 46 80 54 22 9 6.7
Operating profit 331 385 267 255 514 351
Loan loss level 0.07% 0.13% 0.09% 0.04% 0.86%
Cost/income ratio 0.51 0.52 0.44 0.42 0.43 37%
CET 1 ratio 23.4% 21.0% 27.8% 29.7% 7.8%
Total capital ratio 26.1% 24.5% 32.0% 34.7% 9.0
Source: Landshypotek year-end report 2015
Table 120. More information
Bond ticker: LANHYP Website: landshypotek.se
Source: Danske Bank Markets

79 | 6 September 2016 www.danskeresearch.com
Sw
edish
Co
vered B
on
ds
Landshypotek Bank AB
Business model and funding profile
In July 2007, the Swedish FSA approved LANHYP’s application to convert existing
bostadsobligationer into covered bonds. In August 2007, LANHYP made its first covered bond
issue. As a specialist mortgage lender, the bank was allowed to carry out only mortgage lending
and funding business. Consequently, it used to rely on wholesale funding. However, in
November 2012, LANHYP was granted a banking licence and is now taking deposits. The goal
is to be 20% deposit funded by 2018. However, for now, wholesale funding still accounts for
78% of total funding – the majority of which is SEK-denominated covered bonds. In 2015,
covered bonds were issued to an amount of approximately SEK10.4bn. In addition, senior bonds
were issued to a value of some SEK1.5bn.
Market risk is very limited, with both lending and funding predominantly carried out in SEK.
Where financing is done in currencies other than SEK, the currency risk is managed by hedging
foreign currency cash flows with swap contracts.
LANHYP finances its business mainly through bond loans and money market instruments.
Funding is also obtained via borrowing from credit institutions but recently the share of funding
from credit institutions has been greatly reduced.
Cover pool and asset quality
As at Q1 16, the cover pool amounted to SEK68bn, of which SEK8bn was made up by substitute
assets comprising Swedish AAA-rated covered bonds (59%) and bonds issued by Swedish
municipalities (41%). The average loan size was SEK569,890. Of the EUR60bn mortgages in
the pool, 99% are secured on agricultural and forestry properties and 1% are residential
mortgages. However, according to Fitch, a significant proportion of the total loan book is to
what is classified as residential farmers, whose principal occupation is not agriculture or forestry.
The cover pool is well seasoned with an average of 76 months on a loan level and 244 months
on a customer level. The weighted average LTV ratio of the pool is 43%. At the reporting date,
LANHYP had SEK53bn in outstanding covered bonds, leading to an over-collateralisation level
of 28%.
Table 121. Funding profile
Total balance SEK80.7bn
Liab. to credit institutions 0.5% Public deposits 13%
Debt securities 78% Subordinated debt 1% Equity 6%
Other 2%
Source: Landshypotek year-end report 2015,
Danske Bank Markets
Table 122. Cover pool
Cover pool SEK68bn
Of which substitute assets SEK8bn - Swedish AAA covered bonds 59% - Municipalities 41%
Covered bonds SEK53bn
OC 28%
Average loan size SEK570,000 WA LTV (volume weighted) 43%
WA LTV (property weighted) 24%
Seasoning (loan level) 76 months
Seasoning (customer level) 244 months
Non-performing loans None
Fixed rate-mortgages 49%
Interest-only mortgages 4%
Geography Only Sweden
- Linkjöping 15%
- Lund 12%
- Skara 8%
- Örebro 8% (remaining areas at 7% or lower)
Asset type
- Residential 1%
- Agriculture 99%
Source: Landshypotek cover pool report Q1 16,
Danske Bank Markets

80 | 6 September 2016 www.danskeresearch.com
Sw
edish
Co
vered B
on
ds
LF Hypotek
LF Hypotek
Säkerställda obligationer
Company profile
Länsförsäkringar Hypotek (LF Hypotek) is a wholly-owned subsidiary of Länsförsäkringar Bank
(LF Bank), which in turn is part of the Länsförsäkringar Alliance. The latter comprises 23 local,
independent and customer-owned regional insurance companies that jointly own
Länsförsäkringar AB with subsidiaries. LF Bank was originally established to deliver banking
products and services to customers of the independent mutual insurance companies, which have
a customer base totalling some 3.5m.
Today, LF Bank is a full-service retail bank offering a full range of financial products and
services to its customers, although it focuses on providing savings and lending products for
private customers and farmers. With a business volume of SEK404bn and 378,000 customers
(for which LF Bank is the primary bank). LF Bank is Sweden’s fifth-largest retail bank.
LF Hypotek provides financing for LF Bank’s banking and retail mortgage operations through
its covered bond programme. All customer contacts take place through the 128 branches of the
23 regional insurance companies, although loans are also distributed via internet and telephone.
In 2015, lending increased by13% to SEK202bn and deposits by 9% to SEK84bn.
As a measure of the financial strength of the parent bank, LF Bank was one of only two major
banks in Sweden not to issue under or apply for a state guarantee during the financial crisis.
While LF Bank retains a stable ‘A’ rating from S&P, Moody’s assigned the bank a ‘A1’ long-
term deposit and senior unsecured debt rating also on stable outlook in May 2016.
Financial performance
LF Bank’s operating profit grew by 26% to SEK1,175m in 2015 (2014: SEK935m) attributable
to a higher net interest income and increased commission income. Return on equity increased to
8.9% (2014: 8.3%). Operating income increased 12% to SEK2,747m (2014: SEK2,451m), due to
higher net interest income. Net interest income increased 16% to SEK2,994m (2014:
SEK2,580m), mainly attributable to higher volumes and improved margins. Net gains from
financial items amounted to SEK97m (2014: SEK98m). Commission income increased 16% to
SEK1,522m (SEK1,312m) due to higher income in the fund and securities businesses. The Tier
1 ratio strengthened to 23.7% (2014: 16.2%) and the capital adequacy ratio also strengthened to
28.2% (2014: 20.6%).
In 2015, LF Hypotek was able to increase its operating income by 22% to SEK594m (2014:
SEK486m) due to higher net interest income as a result of increased volumes and improved
margins. The cost/income ratio before loan losses amounted to 16% (2014: 19%). LF Hypotek
increased its lending by 17% to SEK147bn (2014: SEK126bn) and was able to grow its customer
base by 7% to 216,000.
Table 123. Ratings
(Moody’s/S&P/Fitch)
Covered bond rating: Aaa/AAA/-
Issuer rating:* A1/A/- Moody’s C-score: 5.0%
- excl. syst. risk 3.2%
Moody’s TPI: Probable-High
Moody’s CB anchor: Aa3(cr)+1
S&P unused notches: N/A
* rating for Länsförsäkringar Bank AB (parent)
Source: Rating agencies, Danske Bank Markets
Table 124. Financial info (parent bank)
SEKm 2015 2014 2013 2012 2011 2010
Net interest income 2,994 2,580 2,230 2,071 1,728 1,363 Net commissions -441 -319 -253 -385 -416 -155
Net gain/losses 97 98 -86 5 10 10
Profit before loan losses 1,181 925 773 647 434 1,368
Loan losses net -6 10 126 91 48 60
Operating profit 1,175 935 647 555 385 345
Impaired loans ratio 0.12% 0.17% 0.23% 0.19% 0.17% 0.17%
Cost/income ratio 57% 62% 63% 66% 71% 71%
Tier 1 capital ratio 23.7% 16.2% 14.7% 13.7% 8.0% 8.2%
Capital adequacy ratio 28.2% 20.6% 19.1% 15.6% 9.3% 9.4%
Source: LF Bank Annual Report 2015
Table 125. More info
Bond ticker: LANSBK Web site: lansforsakringar.se
Source: Danske Bank Markets
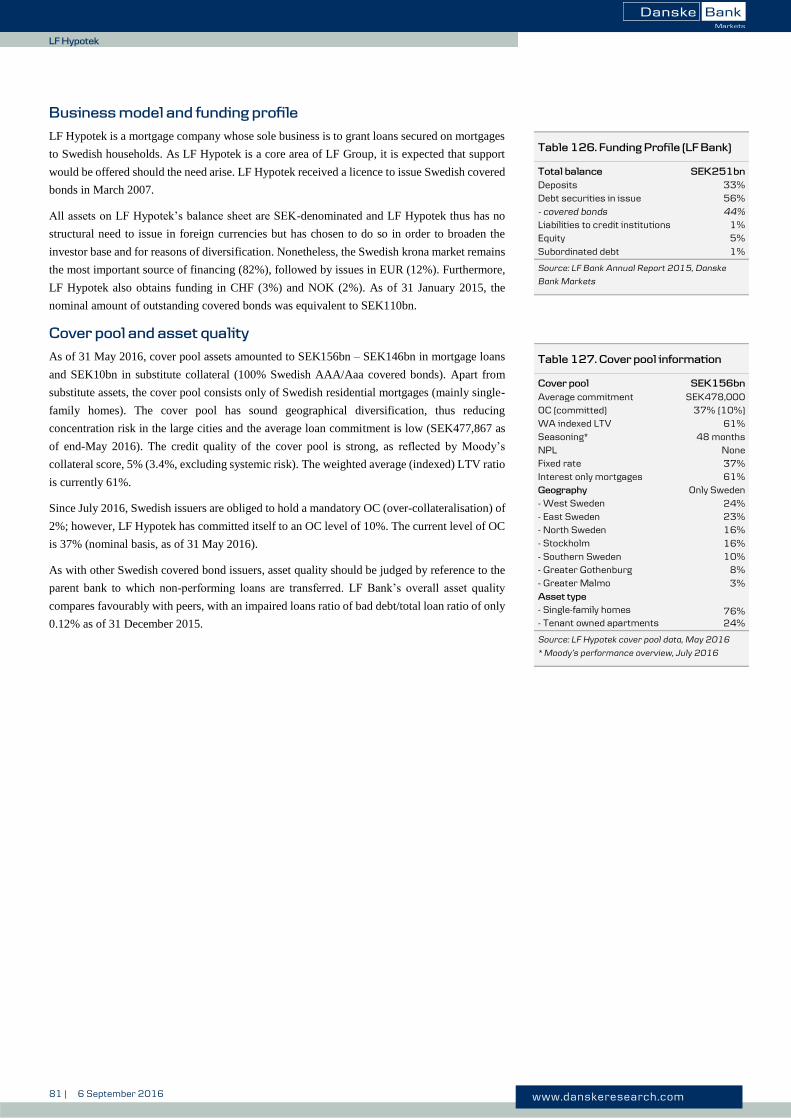
81 | 6 September 2016 www.danskeresearch.com
Sw
edish
Co
vered B
on
ds
LF Hypotek
Business model and funding profile
LF Hypotek is a mortgage company whose sole business is to grant loans secured on mortgages
to Swedish households. As LF Hypotek is a core area of LF Group, it is expected that support
would be offered should the need arise. LF Hypotek received a licence to issue Swedish covered
bonds in March 2007.
All assets on LF Hypotek’s balance sheet are SEK-denominated and LF Hypotek thus has no
structural need to issue in foreign currencies but has chosen to do so in order to broaden the
investor base and for reasons of diversification. Nonetheless, the Swedish krona market remains
the most important source of financing (82%), followed by issues in EUR (12%). Furthermore,
LF Hypotek also obtains funding in CHF (3%) and NOK (2%). As of 31 January 2015, the
nominal amount of outstanding covered bonds was equivalent to SEK110bn.
Cover pool and asset quality
As of 31 May 2016, cover pool assets amounted to SEK156bn – SEK146bn in mortgage loans
and SEK10bn in substitute collateral (100% Swedish AAA/Aaa covered bonds). Apart from
substitute assets, the cover pool consists only of Swedish residential mortgages (mainly single-
family homes). The cover pool has sound geographical diversification, thus reducing
concentration risk in the large cities and the average loan commitment is low (SEK477,867 as
of end-May 2016). The credit quality of the cover pool is strong, as reflected by Moody’s
collateral score, 5% (3.4%, excluding systemic risk). The weighted average (indexed) LTV ratio
is currently 61%.
Since July 2016, Swedish issuers are obliged to hold a mandatory OC (over-collateralisation) of
2%; however, LF Hypotek has committed itself to an OC level of 10%. The current level of OC
is 37% (nominal basis, as of 31 May 2016).
As with other Swedish covered bond issuers, asset quality should be judged by reference to the
parent bank to which non-performing loans are transferred. LF Bank’s overall asset quality
compares favourably with peers, with an impaired loans ratio of bad debt/total loan ratio of only
0.12% as of 31 December 2015.
Table 126. Funding Profile (LF Bank)
Total balance SEK251bn
Deposits 33% Debt securities in issue 56%
- covered bonds 44%
Liabilities to credit institutions 1% Equity 5%
Subordinated debt 1%
Source: LF Bank Annual Report 2015, Danske
Bank Markets
Table 127. Cover pool information
Cover pool SEK156bn
Average commitment SEK478,000 OC (committed) 37% (10%) WA indexed LTV 61% Seasoning* 48 months NPL None Fixed rate 37% Interest only mortgages 61% Geography Only Sweden - West Sweden 24% - East Sweden 23% - North Sweden 16% - Stockholm 16% - Southern Sweden 10% - Greater Gothenburg 8% - Greater Malmo 3% Asset type - Single-family homes - Tenant owned apartments
76% 24%
Source: LF Hypotek cover pool data, May 2016
* Moody’s performance overview, July 2016

82 | 6 September 2016 www.danskeresearch.com
Sw
edish
Co
vered B
on
ds
Nordea Hypotek
Nordea Hypotek
Säkerställda obligationer
Company profile
Nordea Hypotek is the third largest mortgage lender in Sweden. It grants long-term loans for the
financing of Swedish households, municipalities, municipal housing companies and corporate.
Loans are issued out of the parent bank’s (Nordea Bank AB) branch network. The Finnish
insurance group Sampo plc is the largest shareholder of Nordea, with 21.3% of the shares (Dec
2015). The Swedish state sold its remaining shares in September 2013.
Nordea Bank AB (Nordea) is the leading bank in the Nordic region in terms of market value and
total assets. The group has operated as Nordea since 2001 and targets a European cross-border
operating model. The group originated with the establishment of MeritaNordbanken in 1997,
which combined Merita Bank of Finland and Nordbanken of Sweden, and was completed in
2000 through the merger with Unidanmark of Denmark and acquisition of Christiana Bank of
Norway. Nordea has a distinctive footprint in the Nordic area, supported by around 11 million
customers and its leading positions in retail banking, corporate finance and savings management.
Furthermore, the bank has foreign branches in Norway, Finland, Denmark, the Baltic countries,
Poland, China, United Kingdom and Germany.
The bulk of earnings comes from the core markets in the Nordic region. Nordea’s market
position differs in each geographical market. The bank’s market position in the Nordic countries
is either the first or second apart from Sweden where the bank ranks fourth with household and
second/third with corporates/institutional customers.
Parent bank Nordea Bank AB is rated ‘Aa3’/‘AA-’/‘AA-’ by M/S&P/F, respectively. Moody’s
has a ‘Aa3’ rating assigned to Nordea Bank AB with a stable outlook, reflecting the banking
group's diversified regional footprint in the Nordic region, its stable and resilient earnings
stream, good operational efficiency and credit quality. S&P rates the bank ‘AA-’ but with a
negative outlook. However, the covered bonds issued by Nordea Hypotek enjoy stable
‘Aaa/AAA’ ratings from Moody’s and S&P.
Financial performance
In 2015, operating profit increased 9% to EUR4,704m (2014: EUR4,324m). Net interest income
decreased by 7% compared to 2014, due to negative interest in Denmark and Sweden and Euro
countries. Feed and commission income rose 6%. Furthermore, net loan loss provisions fell 10%
to EUR479m, corresponding to a loan loss ratio of 14bp (2014: 19bp).
The core tier 1 capital ratio excluding transition rules improved further in 2015 to 18.5%, up
from 17.6% at end-2014. The total capital ratio increased to 21.6%. Nordea’s capital policy
stipulates a target minimum for the common equity tier 1 capital ratio (above 13%) and for the
total capital ratio (above 17%).
Table 128. Ratings
(Moody’s/S&P/Fitch)
Covered bond rating: Aaa/AAA/-
Issuer rating:* Aa3/AA-(n)/AA- Moody’s C-score: 5.6%
Moody’s TPI: Probable-High
Moody’s CB anchor Aa2 (cr) + 1
S&P unused notches: 3
* Rating of Nordea Bank AB. (n) = negative outlook
Source: Rating agencies, Danske Bank Markets
Table 129. Financial info (Nordea Group) Table 130. Financial info (parent bank)
EURm 2015 2014 2011 2010 2009
Net interest income 5,110 5,482 5,456 5,159 5,281 Fees and commissions 3,025 2,842 2,395 2,156 1,693
Net gain/losses 1,703 1,425 1,517 1,837 1,946
Pre-provision income 5,183 4,858 4,282 4,518 4,513
Loan losses and provisions 479 534 735 879 1,486
Operating profit 4,704 4,324 3,547 3,639 3,027
Net interest margin 0.92% 1.08% 1.3% 1.5% 1.5%
Net charge-off rate 0.14% 0.19% 55% 52% 58.3%
Tier 1 capital ratio 18.5% 17.6% 9.2% 9.8% 50%
Total capital ratio 21.6% 20.7% 11.1% 11.5% 10.2%
EURm 2011 2010 2009
Net interest income 5,456 5,159 5,281 Fees and commissions 2,395 2,156 1,693
Net gain/losses 1,517 1,837 1,946
Pre-provision income 4,282 4,518 4,513
Loan losses and provisions 735 879 1,486
Operating profit 3,547 3,639 3,027
Impaired loans ratio 1.4% 1.5% 1.5%
Cost/income ratio 55% 52% 58.3%
Core capital ratio 10.1% 9.8% 50%
Total capital ratio 11.1% 11.5% 10.2%
11.9%
Source: Nordea Annual Report 2015 Source: Nordea Annual Report 2011
Table 131. More info
Bond ticker: NDASS Web site: www.nordea.com
Source: Danske Bank Markets

83 | 6 September 2016 www.danskeresearch.com
Sw
edish
Co
vered B
on
ds
Nordea Hypotek
Business model and funding profile
As a specialist bank, Nordea Hypotek relies heavily on covered bonds, which represent 72% of
the funding structure. As of 31 December 2015, total wholesale funding from covered bonds
was SEK358bn, of which 91% was SEK denominated, while the remainder was predominantly
in EUR. Apart from this, the funding structure of Nordea Hypotek consists of subordinated debt
(1%) and unsecured funding from Nordea Bank (27%).
Nordea Hypotek can issue Swedish benchmark covered bonds (bostadsobligationer) and also
has a EUR15bn EMTN programme for international funding (in any agreed currency). Private
placements have also been made in NOK, USD and CHF. Nordea Hypotek has not issued EUR
benchmark covered bonds since 2010.
Parent company, Nordea AB, has a broad and diversified funding structure, due to a stable retail
customer base and a variety of funding programmes. Nordea took advantage of the well-
developed mortgage securities markets in Denmark and Sweden throughout the crisis.
Moreover, Nordea has set as a target that the net balance of stable funding should be positive,
which means that stable assets must be funded by stable liabilities (deposits and long-term
bonds). As of 31 December 2015, the net balance of stable funding was EUR63bn. Furthermore,
during 2014, Nordea had a liquidity buffer of EUR61.9bn on average, consisting of high-grade
liquid securities that can be sold or used as collateral in funding operations with central banks.
According to Nordea, the LCR for the group was 134% as at end-2014.
Cover pool and asset quality
As of Q1 16, the cover pool totalled SEK488bn, consisting of mortgage loans secured by
residential or commercial property and public sector loans (currently the pool contains no
substitute assets, according to the Q1 16 cover pool report). The cover pool is dominated by
single-family, residential mortgages and tenant owner rights, while the share of loans secured
by agricultural and commercial property is well below the legislative limit of 10%.
Nordea Hypotek’s cover pool has a current LTV of 51% and the pool has an OC of 42%. As per
June 2016, Swedish covered bond issuers are required to maintain a mandatory legal OC of 2%.
Geographically, the cover pool is well diversified, spanning the entire country of Sweden,
though with an overweight in urban areas. The mortgage types are 21% fixed rate and 60%
amortising mortgages.
Nordea Hypotek applies conservative underwriting criteria, which for private households
includes checking the household budget ‘before-after’, with a buffer requirement and stress test,
including behavioural analysis. Furthermore, an individual valuation of the pledged property is
performed. For corporates and municipalities, a financial analysis, including verification of key
ratios and rating according to Nordea’s in-house models, is conducted. The pledged property is
valued individually, with yearly reassessments.
Table 132. Funding profile (Group)
Total balance EUR647bn
Credit institution deposits 7% Retail deposits 30% Liabilities to policyholders 9%
Debt securities in issue 30% Derivatives 12% Subordinated debt 1%
Equity 5% Other 5%
Source: Nordea Annual Report 2015, Danske
Bank Markets calculations
Table 133. Cover pool info
Cover pool SEK488bn
OC (legal) 42% (2%) Average loan size SEK558,000 WA LTV -
WA Indexed LTV 51%
Seasoning 63 months*
Impaired loans 0.1%
Fixed-rate mortgages 21%
Interest-only mortgages 40%
Geography Only Sweden
-Greater Stockholm 39%
-West Sweden 16%
-East Sweden 14%
-Greater Gothenburg 13%
-Other 19%
Asset type
-Single-family housing 54%
-Tenant owner rights 27%
- Multi-family housing &
tenant owner associations
12%
-Public sector 3%
-Commercial 3%
-Agricultural 1%
Source: Nordea Hypotek cover pool data, Q1 2016
* Moody’s performance overview, June 2016

84 | 6 September 2016 www.danskeresearch.com
Sw
edish
Co
vered B
on
ds
SCBC (SBAB Bank)
SCBC (SBAB Bank)
Säkerställda obligationer
Company profile
SBAB Bank (SBAB) is owned wholly by the Swedish government and was established in 1985
with a mandate to improve competition in the residential mortgage market. For the purpose of
issuing covered bonds, SBAB has created a wholly-owned dedicated covered bond subsidiary,
SCBC (The Swedish Covered Bond Corp.). In March 2006, SCBC was licensed by the Swedish
FSA to issue covered bonds pursuant to the Swedish Covered Bond Act. It issued its first covered
bond in October 2006. SCBC itself does not issue loans but acts as a restricted issuance vehicle
with SBAB Bank as single creditor. SBAB has agreed that all its claims rank below those from
SCBC’s covered bondholders, thus isolating covered assets in case of insolvency. SBAB is
Sweden’s fifth-largest mortgage institution and it has a current market share of around 8% in
retail lending and around 13% in tenant-owner associations.
In 2011, an extraordinary general meeting resolved that SBAB would begin conducting banking
activities and the name was changed to SBAB Bank. SBAB has since received a full banking
licence and in 2012 a new strategy was rolled out, entailing a division of products into three
areas: loans, savings and payments. The lending area offers residential mortgages and personal
loans to private individuals and property loans to property companies and tenant-owner
associations. Savings offers savings accounts and mutual funds to private individuals and
savings accounts to corporate clients and tenant-owner associations.
SBAB’s status as a government-related entity is positive from a credit perspective, as it increases
the likelihood of government support. The Swedish government has said it is considering a
privatisation of SBAB, although there seem to be no imminent plans currently. In that regard, it
should also be noted that SBAB senior debt holders benefit from a government ownership
clause, providing an option to put notes back with the issuer should government ownership fall
below 51%. A change of ownership would have to address this issue, otherwise the debt could
become due immediately, potentially triggering a multi-notch downgrade, according to S&P.
SCBC has no issuer rating, though SBAB Bank is rated A2 (stable)/A (negative) by Moody’s
and S&P, respectively. Both Moody’s and S&P factor in two notches of extraordinary support
above SBAB’s standalone credit profile due to implicit government support if needed.
Financial performance
In 2015, SBAB’s operating profit amounted to SEK1,492m (2014: SEK1,644m). Net interest
income increased by 16% and amounted to SEK2,442m (2014: SEK2,111m), which was
primarily because of a sharp increase in volumes and improved lending margins. The
cost/income ratio decreased to 34% (2014: 32%), due mainly to higher income. Loan losses
remained low during the year. SBAB reported a fully-loaded Basel III CET1 ratio of 28.6% at
end-2015, down from a high 29.8% at end-2014. The high ratio is a result of the low risk in the
loan book (residential first lien mortgages).
Table 134. Ratings
(Moody’s/S&P/Fitch)
Covered bond rating: Aaa/-/-
Issuer rating: A2/A(n)/- Moody’s C-score: 5.1%
Moody’s TPI: Probable-High
Moody’s CB anchor: A1(cr) +1
Source: Rating agencies, Danske Bank Markets
(n) = negative outlook
Table 135. Financial information
(SBAB)
SEKm 2015 2014 2013 2012 2011 2010 2009 2009
Net interest income 2,442 2,111 1,963 1,941 1,618 1,762 1,519 1,519 Fees and commissions -102 -110 -109 -95 -90 -44 -46 -46
Net gain/losses 1 620 39 -601 -349 -289 495 495
Pre-provision income 1,492 1,613 1,078 520 472 1,429 1,974 1,974
Loan losses and provisions 40 -30 -7 20 8 40 107 107
Operating profit 1,492 1,644 1,085 500 464 785 1,289 1,289
Loan loss provision ratio 74% 65% 76% 81% 62% 70% 72% 72%
Cost/income ratio 34% 41% 43% 58% 60% 45% 35% 35%
Common Equity Tier 1* 28.6% 29.8% 23.3% 6.9% 6.7% 6.4% 7.4% 7.4%
Total capital ratio** 11.4% 10.8% 10.5% 11.5% 10.7% 10.2% 9.2% 9.2%
*Without transitional rules
**With transitional regulations
Source: SBAB Annual Report 2015
Table 136. More information
Bond ticker: SBAB Web site: www.sbab.se
Source: Danske Bank Markets
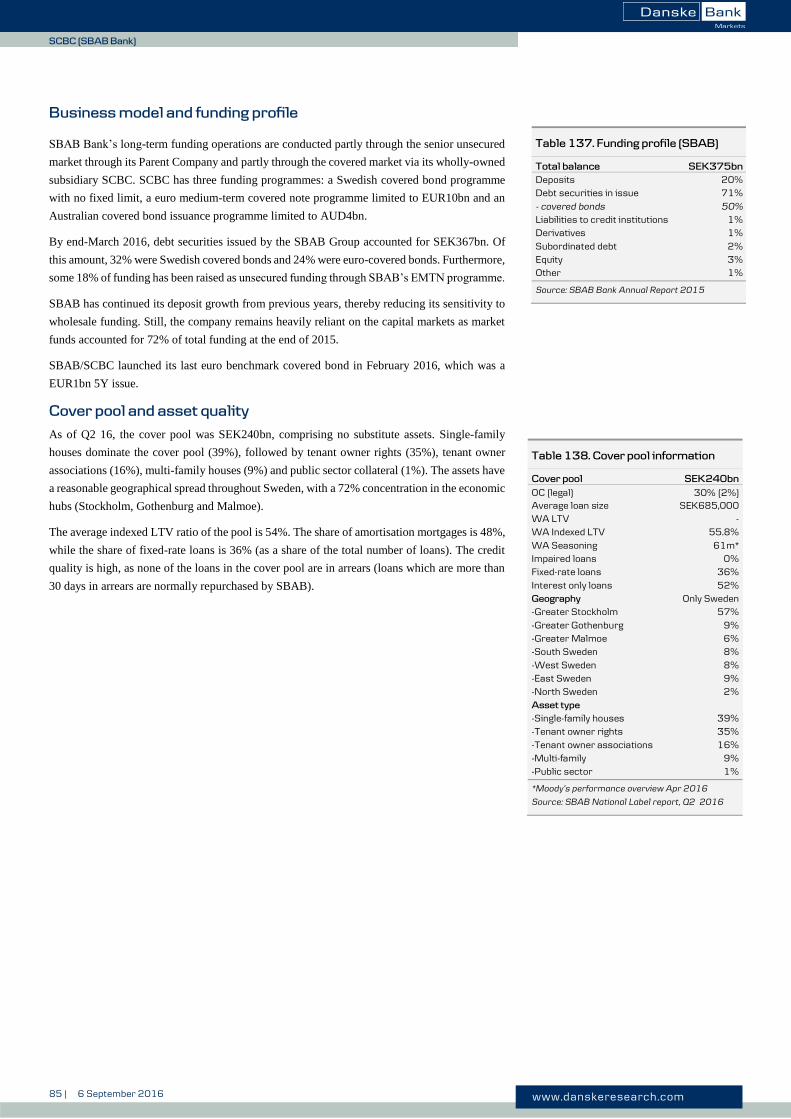
85 | 6 September 2016 www.danskeresearch.com
Sw
edish
Co
vered B
on
ds
SCBC (SBAB Bank)
Business model and funding profile
SBAB Bank’s long-term funding operations are conducted partly through the senior unsecured
market through its Parent Company and partly through the covered market via its wholly-owned
subsidiary SCBC. SCBC has three funding programmes: a Swedish covered bond programme
with no fixed limit, a euro medium-term covered note programme limited to EUR10bn and an
Australian covered bond issuance programme limited to AUD4bn.
By end-March 2016, debt securities issued by the SBAB Group accounted for SEK367bn. Of
this amount, 32% were Swedish covered bonds and 24% were euro-covered bonds. Furthermore,
some 18% of funding has been raised as unsecured funding through SBAB’s EMTN programme.
SBAB has continued its deposit growth from previous years, thereby reducing its sensitivity to
wholesale funding. Still, the company remains heavily reliant on the capital markets as market
funds accounted for 72% of total funding at the end of 2015.
SBAB/SCBC launched its last euro benchmark covered bond in February 2016, which was a
EUR1bn 5Y issue.
Cover pool and asset quality
As of Q2 16, the cover pool was SEK240bn, comprising no substitute assets. Single-family
houses dominate the cover pool (39%), followed by tenant owner rights (35%), tenant owner
associations (16%), multi-family houses (9%) and public sector collateral (1%). The assets have
a reasonable geographical spread throughout Sweden, with a 72% concentration in the economic
hubs (Stockholm, Gothenburg and Malmoe).
The average indexed LTV ratio of the pool is 54%. The share of amortisation mortgages is 48%,
while the share of fixed-rate loans is 36% (as a share of the total number of loans). The credit
quality is high, as none of the loans in the cover pool are in arrears (loans which are more than
30 days in arrears are normally repurchased by SBAB).
Table 137. Funding profile (SBAB)
Total balance SEK375bn
Deposits Debt securities in issue
- covered bonds
20% 71%
50%
Liabilities to credit institutions 1% Derivatives
Subordinated debt
1%
2% Equity 3% Other 1%
Source: SBAB Bank Annual Report 2015
Table 138. Cover pool information
Cover pool SEK240bn
OC (legal) 30% (2%) Average loan size SEK685,000 WA LTV - WA Indexed LTV 55.8%
WA Seasoning Impaired loans Fixed-rate loans
Interest only loans
61m* 0%
36%
52% Geography Only Sweden -Greater Stockholm 57%
-Greater Gothenburg 9% -Greater Malmoe 6% -South Sweden 8%
-West Sweden 8% -East Sweden 9% -North Sweden 2%
Asset type -Single-family houses 39% -Tenant owner rights 35%
-Tenant owner associations 16% -Multi-family 9% -Public sector 1%
*Moody’s performance overview Apr 2016
Source: SBAB National Label report, Q2 2016

86 | 6 September 2016 www.danskeresearch.com
Sw
edish
Co
vered B
on
ds
SEB
SEB
Säkerställda obligationer
Company profile
Skandinaviska Enskilda Bank (SEB) is the third largest of the Swedish banks (after Nordea and
Handelsbanken) measured by total assets and offers a full range of retail, commercial,
investment banking and insurance products. The bank has some four million private clients,
400,000 SME clients and 3,000 corporate and institutional clients. SEB holds a 14.3% market
share in Sweden based on lending to Swedish households and a slightly higher market share of
15.1% in lending to Swedish corporate clients. SEB generates more than half its operating profit
in Sweden, with the remainder split between Germany, Denmark, Norway, Finland and the three
Baltic countries. In addition, the group retains a strong position in offering capital market-related
services to large corporate and institutional clients and is a leading provider of life and unit-
linked pension products in the Swedish market.
Fundamentally, SEB is more of a commercial bank than any of its large Scandinavian peers,
with corporate banking accounting for 39% of its total operating income and total operating
profit. SEB is also a leading Nordic asset manager. Its main shareholders include Investor AB
(‘A1/AA-’), which holds a 20.8% equity stake (and is controlled by the Wallenberg family), and
the Trygg Foundation, with a 6.6% interest. We regard SEB’s shareholder composition as credit
positive.
SEB is currently rated ‘A3’ (stable), ‘A+’ (stable) and ‘A+’ (positive) by M/S&P/F, respectively.
In its credit opinion from May 2016 Moody’s states that SEB has strong domestic market
positions in retail banking, wealth management and commercial banking. SEB is also one of the
largest financial groups in the Nordic region, where it has a leading market position in merchant
banking. S&P rates the bank at ‘A+’ (stable), indicating that the positive development in SEB's
capital over the past few years has been primarily supported by improvements in the bank's
operating efficiency and low credit losses. Fitch upgraded SEB’s rating to ‘AA-’ on 26 May
2016 with a stable outlook. On the covered bond rating, Moody’s assigned the programme an
‘Aaa’ rating.
Financial performance
Operating profit amounted to SEK20,865m (2014: SEK23,348m). Net profit (after tax)
amounted to SEK16,581m (2014: SEK19,219m). One-off items in both 2015 and 2014 affect
the year-on-year comparison. Net interest income decreased by 5% to SEK18,938m from
SEK19,943m in 2014. The repo interest rates decreased by around 0.7 percentage points on
average year-on-year, which affected net interest income negatively. Total operating expenses
were virtually unchanged from 2014 and amounted to SEK22,187m (2014: SEK22,143m).
Higher salary and pension costs were offset by lower consultancy and premises costs. As of
year-end 2015, the Tier 1 capital ratio was 21.3% (2014: 19.5%) and the total capital ratio was
23.8% (2014: 22.2%), calculated according to the Basel III rules.
Table 139. Ratings
(Moody’s/S&P/Fitch)
Covered bond rating: Aaa/-/-
Issuer rating: Aa3/A+/AA Moody’s C-score: 5.0% Moody’s TPI: Probable-High Moody’s CB anchor: Aa2(cr) + 1
Source: Rating agencies, Danske Bank Markets
(p) = positive outlook
Table 140. Financial information
(SEB Group)
SEKm 2015 2014 2011 2010 2009
Net interest income 18,938 19,943 16,901 15,930 18,046 Fees and commissions 16,877 16,306 14,175 14,120 13,285
Net gain/losses 4,118 2,921 3,548 3,148 4,488
Profit before loan losses 21,961 24,793 14,173 12,984 16,377
Net loan losses 883 1,324 -778 1,609 12,030
Operating profit 20,865 23,348 14,953 11,389 4,351
Cost/income ratio 48.8% 49.9 0.39% 1.8% 2.4%
Net charge-off rate 0.07% 0.10% 62% 65% 61%
Tier 1 capital ratio* Total capital ratio*
21.3% 23.8%
19.5% 22.2%
11.2% 13.0%
10.9% 12.8%
11.7%
Source: SEB Annual Report 2015.
*Basel III
Table 141. More information
Bond ticker: SEB Web site: www.sebgroup.com
Source: Danske Bank Markets

87 | 6 September 2016 www.danskeresearch.com
Sw
edish
Co
vered B
on
ds
SEB
Business model and funding profile
SEB’s overall funding strategy is to utilise both the covered bond and senior unsecured bond
markets for long maturities and commercial paper programmes for the shorter maturities. Issued
securities with short and long maturities amounted to SEK639bn. During the year SEK79bn in
long-term funding matured. The bank was able to use its favourable position from a credit risk
point of view to raise new funding at an amount of SEK95bn, in line with the liquidity strategy.
Issued subordinated debt amounted to SEK31bn.
For covered bonds, SEB has acquired SEB Bolån’s licence to issue under the terms of the
Swedish Covered Bond Act. Previously issued Swedish domestic bonds have been converted
into covered bonds as the Act requires. Covered bonds are mainly issued out of the parent bank
(SEB AB) in the form of Swedish säkerställda obligationer but SEB’s German subsidiary (SEB
AG) also issues covered bonds in the form mortgage Pfandbriefe (mainly backed by German
commercial loans) and public Pfandbriefe (backed primarily by German collateral).
As of December 2015, deposits and borrowing from the public amounted to SEK884bn (2014:
SEK943m). Compared to 2014, deposits from households were SEK16bn higher, while
corporate deposits decreased by SEK43bn due to the structural changes in the balance sheet.
Cover pool and asset quality
By end-March 2016, the cover pool comprised assets worth a total of SEK485bn. The cover
pool contains no substitute assets and consists entirely of Swedish residential mortgage loans,
mainly single family houses (59%). The weighted-average indexed LTV ratio is 57% and no
loans have an LTV above 75% (83% of loans have LTV of up to 50% and below). As of March
2016, the total amount outstanding in covered bonds was SEK322bn, yielding a nominal OC of
51%. Loans in arrears (more than 60 days) in the cover pool totalled only 0%.
In terms of loan types, the cover pool is split between amortising (60%) and interest-only
mortgages (40%). Most of the loans are 3M floating rate (74%), while the remainder comprises
loans with a fixed rate (26%).
Covered bonds issued by SEB enjoy a stable ‘Aaa’ rating from Moody’s. The collateral score
assigned by Moody’s is 5.0%, which compares well to Swedish peers.
Table 142. Funding profile (parent
bank)
Total balance SEK2,496bn
Deposits, credit institutions 5%
Deposits, public 35%
Debt securities 26%
- of which covered bonds 13%
Financial liab. at fair value 9%
Subord. debt 1%
Liabilities to policyholders 15%
Other 3%
Equity 6%
Source: SEB Annual Report 2015, Danske Bank
Markets calculations
Table 143. Cover pool info
Cover pool SEK485bn
OC (legal) 51% (2%) Average loan size SEK696,000 WA LTV -
WA Indexed LTV 57%
NPL* 0%
Seasoning** 65 months
Fixed rate-mortgages 26%
Interest-only loans 40%
Geography Only Sweden
-Greater Stockholm 42%
-Gothenburg region 16%
-East Sweden 12%
-South Sweden 10%
-Malmoe region 8%
-Other 13%
Asset type
-Single-family 59%
-Multi-family 14%
-Tenant owned 27%
Source: SEB Cover Pool information, Q1 16
* Loans more than two months in arrears
** Moody’s performance overview May 2016

88 | 6 September 2016 www.danskeresearch.com
Sw
edish
Co
vered B
on
ds
Stadshypotek AB
Stadshypotek AB
Säkerställda obligationer
Company profile
Stadshypotek is a wholly-owned subsidiary of Svenska Handelsbanken (Handelsbanken). The
two largest shareholders are the bank’s own profit-sharing foundation, the Oktogonen
Foundation, and Industrivärden (both with 10% of the shares). Established in 1871,
Handelsbanken provides a full range of retail, commercial and investment banking services
through its extensive branch network in Sweden, other Nordic countries, the UK and the
Netherlands. Based on total assets, Handelsbanken is the second-largest Swedish bank after
Nordea. The bank offers universal banking in all of the Nordic countries (Sweden, Norway,
Denmark and Finland). The operations outside Sweden continue to grow in importance and now
account for around a third of the loan book. Handelsbanken has identified scope for growth in
the UK and the Netherlands and therefore aims to build up its presence there further by growing
organically. Currently, the UK operation accounts for 9% of total lending, after it grew 27% in
2014. Handelsbanken has a distinct internal culture with considerable emphasis on decentralised
decision-making and no budgets, for example. Instead, it uses internal and external
benchmarking extensively. Handelsbanken’s goal is to have higher profitability than the average
of its competitors through having more satisfied customers and lower costs (including loan
losses). This goal has been achieved for 43 consecutive years.
Handelsbanken has a domestic market share of 25% in household mortgage lending (through
Stadshypotek, which was acquired in 1996) and corporate lending. In 2007, the bank sold its life
insurance operations (SPP) to Storebrand, which leaves Handelsbanken Liv as the only life
insurance arm of the group. The bank has a market share of around 20% of total household
lending and deposits in Sweden. The rating agency Fitch upgraded the rating to ‘AA’ on 26 May
2016, and assigned a stable outlook to the rating.
Financial performance
Over the course of 2015, Handelsbanken improved its operating profit by 17% to SEK20,475m
(2014: SEK19,212m). The period’s profit after tax for total operations rose to SEK16,343m
(2014: SEK15,184m) and earnings per share were SEK8.57 (2014: SEK7.96). Net fee and
commission income rose by 9% to SEK9,320m (2014: SEK8,556m), mainly as a result of higher
asset management, advisory and payment commissions. Net gains/losses on financial
transactions increased by 47% to SEK2,608m (2014: SEK1,777m).
The common equity tier 1 ratio increased to 21.2% (2014: 20.4%) and the return on equity for
total operations increased to 13.5% (2014: 13.4%). The cost/income ratio fell to 45.0% (2014:
45.2%) and the loan loss ratio was 0.11% (2014: 0.07%).
Table 144. Ratings
(Moody’s/S&P/Fitch)
Covered bond rating Aaa/-/-
Issuer rating Aa2/AA-(n)/AA Moody’s C-score (SE) 5.0%
Moody’s TPI (both) Probable-High
Moody’s CB anchor (both) Aa1(cr) + 1
Source: Rating agencies, Danske Bank Markets
(n) = negative outlook
Table 145. Financial information
(Handelsbanken)
SEKm 2015 2014 2013 2012 2011 2010
Net interest income 27,740 27,244 26,669 26,081 23,613 21,337 Fees and commissions 9,320 8,556 7,804 7,369 7,673 8,022
Net gain/losses 2,608 1,777 1,357 1,120 1,016 1,377
Pre-provision income 22,065 20,987 19,266 18,362 17,345 16,278
Loan losses 1,597 1,781 1,195 1,251 816 1,507
Operating profit 20,475 19,212 18,088 17,108 16,536 14,770
Net charge-off rate 0.11% 0.07% 1.31% 14,038 12,323
Cost/income ratio 45.3% 45.2% 0.08% 0.18% 0.16% 0.23%
CET 1 21.2% 20.4% 47% 48% 47% 48%
Total capital ratio 27.2% 25.6% 21.0% 17.9% 15.6% 13.8%
Source: Handelsbanken Highlights annual report
2015
Table 146. More information
Bond ticker: SHBASS Web site: handelsbanken.se
Source: Danske Bank Markets

89 | 6 September 2016 www.danskeresearch.com
Sw
edish
Co
vered B
on
ds
Stadshypotek AB
Business model and funding profile
Deposits accounted for more than a third of total funding at the end of 2015, while half of the
funding is obtained through the debt market. The reason for this relatively high wholesale
funding dependence is the financing of mortgages through issuance of AAA-rated covered
bonds through Stadshypotek and senior unsecured debt. Of the covered bonds issued by
Stadshypotek, most are domestic SEK benchmarks (around 75%), while benchmark covered
bonds issued in other currencies constitute around one fourth of the total amount. Stadshypotek
has issued bonds in EUR, GBP and CHF under the EMTCN programme, in USD under the US
Medium Term Covered Bond Programme and in AUD under the AMTCN programme, all of
which were converted into SEK using cross-currency interest rate swaps.
Handelsbanken had a liquidity reserve exceeding SEK800bn by end-2015. Balances with central
banks and banks, as well as securities that are eligible as collateral with central banks, totalled
SEK352bn, with the remainder mainly being an unutilised issue amount for covered bonds at
Stadshypotek. According to Handelsbanken, the total liquidity reserve covers the bank’s
liquidity requirements for more than two years in a stressed scenario with an outflow of deposits
and entirely without access to new market funding.
In late 2011, Stadshypotek added a second cover pool to its covered bond business. While the
original cover pool comprised all Swedish assets, the new cover pool comprises solely
Norwegian assets. So far, the Norwegian cover pool has been used solely for the backing of
NOK-denominated covered bonds (as of January 2016, five NOK floating-rate covered bonds
totalling NOK21.5bn in notional are outstanding).
In 2016, Stadshypotek established a third cover pool consisting entirely of Finnish residential
collateral. Furthermore, based on changes to the issuer's offering circular, a Danish cover pool
also appears to be in preparation. Going forward, Stadshypotek intends to issue EUR covered
bonds backed by the new Finnish cover pool. We understand that this includes issuance in
benchmark format, potentially later this year. Notably, all issuance will be done under the
Swedish covered bond legislation. On 21 April, Moody's assigned a preliminary 'Aaa' rating to
the covered bonds to be issued out of the new Finnish pool.
Cover pool and asset quality
The Swedish pool
As of Q1 16, the Swedish cover pool amounted to SEK634bn, out of which SEK5bn is cash held
in a locked account. The mortgage pool consists mainly of residential mortgages (98%) but also
holds some public sector loans (2%). All loans are issued by Handelsbanken’s branch network.
By type of property, single-family houses account for 61% of total loan collateral, followed by
tenant-owner rights and associations 21% and 14% respectively. The weighted average LTV
ratio of the loan pool is 54% and the cover pool has a fairly even mix between fixed and floating-
rate loans, at 53% fixed-rate loans (i.e. loans with a reset period of minimum one year).
Table 147. Funding profile
(Handelsbanken)
Total balance SEK2.522bn
Retail deposits 30% Interbank 6%
Debt securities 49%
Subordinated debt 1%
Equity 5%
Other 8%
Source: Handelsbanken Highlights annual report
2015
Table 148. Cover pool info (Sweden)
Cover pool SEK634bn
(of which substitute assets*) SEK5bn
OC (legal) 14% (2%) Average loan size SEK637,000 WA LTV 54%
WA Seasoning** 42 months
NPL None
Fixed-rate loans 53%
Interest-only loans 42%
Geography 100% Sweden
-Greater Stockholm 42%
-East Sweden 14%
-West Sweden 12%
-Greater Gothenburg 9%
-North Sweden 10%
-South Sweden 8%
-Greater Malmoe 5%
Asset type
-Single-family home 61%
-Tenant owner rights 21%
-Tenant owner associations 12%
-Multi-family housing 4%
-Public 2%
Data as per Q1 2016
* Cash in a locked account.
** Upon interest reset a loan is considered ‘new’
Source: Stadshypotek, Danske Bank Markets
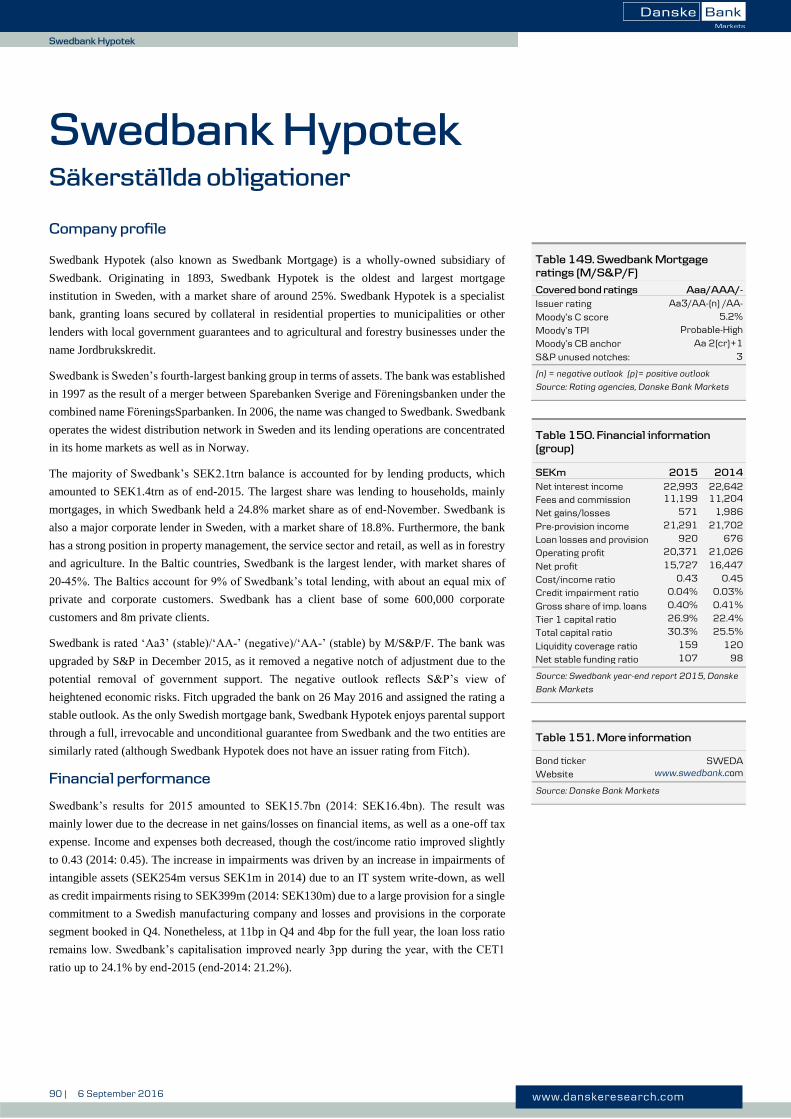
90 | 6 September 2016 www.danskeresearch.com
Sw
edish
Co
vered B
on
ds
Swedbank Hypotek
Swedbank Hypotek
Säkerställda obligationer
Company profile
Swedbank Hypotek (also known as Swedbank Mortgage) is a wholly-owned subsidiary of
Swedbank. Originating in 1893, Swedbank Hypotek is the oldest and largest mortgage
institution in Sweden, with a market share of around 25%. Swedbank Hypotek is a specialist
bank, granting loans secured by collateral in residential properties to municipalities or other
lenders with local government guarantees and to agricultural and forestry businesses under the
name Jordbrukskredit.
Swedbank is Sweden’s fourth-largest banking group in terms of assets. The bank was established
in 1997 as the result of a merger between Sparebanken Sverige and Föreningsbanken under the
combined name FöreningsSparbanken. In 2006, the name was changed to Swedbank. Swedbank
operates the widest distribution network in Sweden and its lending operations are concentrated
in its home markets as well as in Norway.
The majority of Swedbank’s SEK2.1trn balance is accounted for by lending products, which
amounted to SEK1.4trn as of end-2015. The largest share was lending to households, mainly
mortgages, in which Swedbank held a 24.8% market share as of end-November. Swedbank is
also a major corporate lender in Sweden, with a market share of 18.8%. Furthermore, the bank
has a strong position in property management, the service sector and retail, as well as in forestry
and agriculture. In the Baltic countries, Swedbank is the largest lender, with market shares of
20-45%. The Baltics account for 9% of Swedbank’s total lending, with about an equal mix of
private and corporate customers. Swedbank has a client base of some 600,000 corporate
customers and 8m private clients.
Swedbank is rated ‘Aa3’ (stable)/‘AA-’ (negative)/‘AA-’ (stable) by M/S&P/F. The bank was
upgraded by S&P in December 2015, as it removed a negative notch of adjustment due to the
potential removal of government support. The negative outlook reflects S&P’s view of
heightened economic risks. Fitch upgraded the bank on 26 May 2016 and assigned the rating a
stable outlook. As the only Swedish mortgage bank, Swedbank Hypotek enjoys parental support
through a full, irrevocable and unconditional guarantee from Swedbank and the two entities are
similarly rated (although Swedbank Hypotek does not have an issuer rating from Fitch).
Financial performance
Swedbank’s results for 2015 amounted to SEK15.7bn (2014: SEK16.4bn). The result was
mainly lower due to the decrease in net gains/losses on financial items, as well as a one-off tax
expense. Income and expenses both decreased, though the cost/income ratio improved slightly
to 0.43 (2014: 0.45). The increase in impairments was driven by an increase in impairments of
intangible assets (SEK254m versus SEK1m in 2014) due to an IT system write-down, as well
as credit impairments rising to SEK399m (2014: SEK130m) due to a large provision for a single
commitment to a Swedish manufacturing company and losses and provisions in the corporate
segment booked in Q4. Nonetheless, at 11bp in Q4 and 4bp for the full year, the loan loss ratio
remains low. Swedbank’s capitalisation improved nearly 3pp during the year, with the CET1
ratio up to 24.1% by end-2015 (end-2014: 21.2%).
Table 149. Swedbank Mortgage
ratings (M/S&P/F)
Covered bond ratings Aaa/AAA/-
Issuer rating Aa3/AA-(n) /AA-
Moody’s C score 5.2%
Moody’s TPI Probable-High
Moody’s CB anchor Aa 2(cr)+1
S&P unused notches: 3
(n) = negative outlook (p)= positive outlook
Source: Rating agencies, Danske Bank Markets
Table 150. Financial information
(group)
SEKm 2015 2014 2013 2011 2010 2009
Net interest income 22,993 22,642 22,029 19,014 16,329 20,765 Fees and commission 11,199 11,204 10,132 9,597 9,525 7,825
Net gains/losses 571 1,986 1,484 1,584 2,400 2,770
Pre-provision income 21,291 21,702 20,290 15,646 13,402 15,629
Loan losses and provision 920 676 935 -1,911 2,810 24,641
Operating profit 20,371 21,026 19,355 15,423 9,955 -9,461
Net profit 15,727 16,447
Cost/income ratio 0.43 0.45 1.34% 1.87% 2.53% 2.85%
Credit impairment ratio 0.04% 0.03%
Gross share of imp. loans 0.40% 0.41% 0.13% 54% 57% 51%
Tier 1 capital ratio 26.9% 22.4% 19.6% 15.7% 13.9% 12.0%
Total capital ratio 30.3% 25.5% 20.1%
Liquidity coverage ratio 159 120 17.2% 15.2% 13.5%
Net stable funding ratio 107 98
Source: Swedbank year-end report 2015, Danske
Bank Markets
Table 151. More information
Bond ticker SWEDA Website www.swedbank.com
Source: Danske Bank Markets

91 | 6 September 2016 www.danskeresearch.com
Sw
edish
Co
vered B
on
ds
Swedbank Hypotek
Business model and funding profile
As a specialist bank, Swedbank Hypotek relies heavily on covered bonds for funding. For this,
Swedbank Hypotek has four main programmes: (1) a domestic bond programme, (2) an EMTN
programme, (3) a Swedish MTN programme and (4) a US covered bond programme (under rule
144a of the US Securities Act). Benchmark bonds are issued in SEK, EUR, USD and CHF but
Swedbank Hypotek also does private placements in a variety of currencies. As of Q4 15, total
outstanding covered bonds amounted to SEK518bn, distributed as 66% in SEK, 22% in EUR,
7% in USD and 5% in other currencies.
Swedbank is a retail-oriented bank with a substantial domestic branch network providing access
to a relatively stable source of retail deposits. Hence, deposits account for approximately one-
third of total funding in 2015. More than half of Swedbank’s lending consists of Swedish
mortgages, which are primarily financed by the issuance of covered bonds. Swedbank’s senior
debt issuance is determined by the bank's liquidity needs and the buffer it wants to maintain in
its cover pool in the form of over-collateralisation (OC) to manage fluctuations in housing prices.
As an extra capital buffer, Swedbank has a liquidity reserve, amounting to SEK436bn at end-
March 2016. The liquidity reserve consists mainly of cash and holdings in central banks
(SEK339bn), securities issued or guaranteed by sovereigns, central banks or multilateral
development banks (SEK45bn) and covered bonds excluding own issues (SEK46bn). The rating
requirement is ‘AA-’ and 95% of the securities were triple-A rated as of Q1 16. In addition, the
group holds SEK133bn of liquid assets outside the Treasury department.
Cover pool and asset quality
As of May 2016, the cover pool totalled SEK838bn and comprised solely Swedish assets.
Swedbank Hypotek focuses mainly on residential lending, which accounts for 92% of the
portfolio. According to Swedish covered-bond legislation, a maximum of 10% of commercial
assets is allowed in the cover pool. Currently, some 8% of the cover pool consists of commercial
loans (including forestry and agriculture). There are no supplemental assets in the cover pool.
Geographically, the pool is more or less 50/50 between southern and central Sweden. The pool
has a weighted-average seasoning of 66 months, which is fairly high. Loans that are more than
60 days past their due date are not eligible for the cover pool.
Regarding OC, Swedbank Hypotek reports a current level of 49%, which is comfortably above
the 2% legal requirement. The covered bond programme has an ‘Aaa’ rating from Moody’s and
is on stable outlook due to the parent’s senior unsecured rating being on stable outlook.
Furthermore, the programme is also rated ‘AAA’ (stable) by S&P.
Table 152. Funding profile (group)
Total balance SEK2,149bn
Debt securities 38% - covered bonds 26%
Deposits 35% Interbank 7% Equity 6% Other 14%
Source: Swedbank year-end report 2015, Danske
Bank Markets
Table 153. Cover pool information
Cover pool SEK838bn
Avg. loan size SEK529,000 OC (legal) 49% (2%)
WA LTV 51%
Seasoning 66 months
NPL (>90d) None
Geography Sweden only
-South 49%
-Middle (incl. Stockholm) 45%
-North 7%
Interest only loans 40%
Fixed rate loans 29%
Asset type
-Residential 92%
-Public 1%
-Commercial 1%
-Forest & agriculture 7%
Of residential loans:
-Single-family housing 58%
-Tenant owner rights 19%
-Tenant owner associations 10%
-Multi-family 5%
Data as of 31 May 2016
Source: Swedbank Hypotek, Danske Bank Markets

92 | 6 September 2016 www.danskeresearch.com
Sw
edish
Co
vered B
on
ds

93 | 6 September 2016 www.danskeresearch.com
Co
vered B
on
ds R
egula
tory Fra
mew
ork a
nd
Trea
tmen
t
Covered Bonds Regulatory Framework and Treatment
UCITS Directive
The fundamental characteristics of covered bonds (CBs) are set out in the Directive on
Undertakings for Collective Investments in Transferable Securities (UCITS). Article 52(4) of
this directive gives a definition and the minimum requirements that provide the basis for the
privileged treatment of CBs in different areas of European financial market regulation. In short,
Article 52(4) requires that:
The CB issuer has to be a credit institution of a EEA member state.
The issuance must be governed by a special legal framework.
Issuing institutions must be under special prudential public supervision.
Eligible cover assets have to be defined by law.
The pool of cover assets has to offer adequate collateral to bondholders’ claims during the
entire term of the CB.
The bondholders must have a priority claim on the assets in the cover pool in a scenario of
default of the issuing credit institution.
CBs that meet these requirements are thought of as especially safe investments, and are therefore
subject to favourable regulatory treatment. Investment funds (UCITS) can invest up to 25%
(otherwise the maximum is 5%) of their assets in CBs of a single issuer that fulfil the criteria of
Article 52(4). The EU directives on life and non-life insurance permit insurance companies to
invest up to 40% (otherwise the maximum is 5%) in UCITS-compliant CBs of the same issuer
(Directives 92/96/EEC and 92/49/EEC).
Capital Requirements Directive IV and Capital Requirements
Regulation
Current CB regulation at EU level comes in the form of the new CRD IV and CRR (Article 129).
The regulation is based on a proposal from the Basel Committee on Banking Supervision. In
order to be CRR eligible, CBs need to be compliant with UCITS Article 52 (4).
In Article 129 of CRR, CBs are defined as the following:
CBs have to meet the requirements set out in paragraph 7 (issuer transparency rules) to be
eligible for the preferential treatment of Article 129 and must be collateralised by any of the
following eligible assets:
Exposures to or guaranteed by public sector entities, within the EU or from a third country,
which qualify for credit-quality step 1 or are risk-weighted according to Article 115 or 116, or
CQS 2 up to a maximum of 20% of the outstanding nominal CB amount of the issuing institution.
Covered Bonds Regulatory
Framework and Treatment
Key points
The UCITS directive forms the
basis of the European CB
regulatory framework.
CBs need to comply with UCITS in
order to be CRR eligible.
There are three + one different
classifications in LCR’s high-
quality liquid assets of CBs:
o Level 1
o Level 2A
o Third country
o Level 2B
Caps and haircuts applied in CRR
correspond to credit ratings of
high-quality CBs.
CBs are excluded from bail-in in
BRRD, however, uncertainty
remains for the treatment of
voluntary OC.

94 | 6 September 2016 www.danskeresearch.com
Co
vered B
on
ds R
egula
tory Fra
mew
ork a
nd
Trea
tmen
t
Covered Bonds Regulatory Framework and Treatment
Exposures to institutions that qualify for CQS 1 or exposures to institutions in the EU with
a maturity <100 days and that qualify for CQS 2. These exposures may be held up to a
maximum of 15% of the nominal outstanding CB amount of the issuing institution.
Mortgage loans:
• residential loans up to 80% LTV (including all prior liens)
• commercial loans up to 60% LTV (including all prior liens)
Senior units’ MBS issued by securitisation entities, if the units are CQS 1 up to a maximum
of 10% of the nominal amount of the outstanding issue* and if the MBS mortgages meet
the same LTV requirements as for the CBs.
Loans secured on ships up to the difference between 60% of the value of the pledged ship
and the value of any prior maritime liens.
*Exceptions for group internal MBS until end 2017
For those CBs for which a credit assessment by a nominated External Credit Assessment
Institution (ECAI) is available a risk weight according to Table 154 shall be assigned. For CBs
that have no credit assessment (ECAI) available, a risk weight on the basis of the senior
unsecured risk weight of the issuing institution shall be assigned. Table 155 illustrates the
correspondence between the risk weights that are applicable.
Exception: the CRD includes a general exception which states that any CB issued prior to
December 2007 which is UCITS-compliant but does not meet the asset eligibility criteria will
benefit from the preferential treatment until maturity.
Liquidity coverage requirement
The LCR obliges banks to hold enough high-quality liquid assets (HLQA) in a stressed period
of 30-days. The LCR ratio expresses the liquidity buffer to cover the difference between the
expected cash outflows and the expected capped cash inflows in that period.
High−Quality Liquid Assets
Cash outflows−Capped cash inflow = Liquidity Buffer
Net Liquidity Outflows (stressed 30 Days period)≥ 100%
The implementation of the requirement will be gradual, starting from October 2015 (60%) until
fully implementation in January 2018.
Categories of (CB) HLQA are:
Level 1(B) assets (Article 10)
Extremely high-quality CBs, which shall comply with all of the following requirements:
a) Bonds meeting UCITS or CRR requirements.
b) Exposures to institutions in the cover pool shall not exceed 15% of the nominal amount of
outstanding bonds and must qualify for CQS 1 (or 10% of CQS 2 exposure if the national
FSA applies a partial waiver).
c) Credit institutions investing in the CBs and the issuer meet the transparency requirement
referred to in CRR.
d) Issuances of at least EUR500m (or equivalent in domestic currency).
e) Bonds are assigned a credit assessment by a nominated ECAI which is at least CQS 1 in
accordance with CRR, the equivalent CQS in the event of a short-term credit assessment
Table 154. Credit quality steps (CQS)
CQS S&P and Fitch Moody’s
1 AAA to AA- Aaa to Aa3
2 A+ to A- A1 to A3
3 BBB+ to BBB- Baa1 to Baa3
4 BB+ to BB- Ba1 to Ba3
5 B+ to B- B1 to B3
6 CCC+ and below Caa1 and below
Source: CEBS Committee of European Banking
Supervisors, European Banking Authority
Table 155. Risk weight for unrated
CBs
Risk weight issuer Risk weight c. bonds
20% 10% 50% 20%
100% 50%
150% 100%
Source: CRR Article 129

95 | 6 September 2016 www.danskeresearch.com
Co
vered B
on
ds R
egula
tory Fra
mew
ork a
nd
Trea
tmen
t
Covered Bonds Regulatory Framework and Treatment
or, if there is no credit assessment, they are assigned a 10% risk weight in accordance with
CRR.
f) The cover pool meets at all times an asset coverage requirement of at least 2% in excess of
the amount required to meet the claims attaching to the CBs.
Level 2A assets (Article 11)
Exposures in the form of high-quality CBs, which must comply with the following requirements:
a) Bonds meeting UCITS or CRR requirements.
b) Exposures to institutions in the cover pool have to meet CRR conditions (15% of CQS 1).
c) Credit institutions investing in the CBs and the issuer meet the transparency requirement
referred to in CRR.
d) Issue size is at least EUR250m (or the equivalent amount in domestic currency).
e) Bonds are assigned a credit assessment by a nominated ECAI which is at least CQS 2 in
accordance with CRR, the equivalent CQS in the event of a short-term credit assessment
or, if there is no credit assessment, they are assigned a 20% risk weight in accordance with
CRR.
f) The cover pool meets at all times an over-collateralisation of at least 7% in excess of the
amount required to meet the claims attached to the CBs.
g) For CBs with a CQS 1 credit assessment which do not meet the minimum issue size for
Level 1B (EUR500m) but meet the requirements for Level 2A (EUR250m), a minimum
asset coverage requirement of 2% is applicable.
Level 2A assets – third-country covered bonds (Article 11)
Exposures in the form of CBs issued by credit institutions in third countries, which shall comply
with all of the following requirements:
a) CBs compliant with the national law of the third country and defined as debt securities
issued by credit institutions or subsidiaries. The CB must be guaranteed by the issuer, and
secured by a cover pool of assets. Bondholders must have a direct priority claim of recourse
in the event of the issuer’s default.
b) Issuer and CBs are subject to special public supervision by law and the supervisory and
regulatory arrangements must be at least equivalent to those applied in the EU.
c) CBs are backed by a pool of assets of one or more of the types described in CRR.**
d) Exposures to institutions in the cover pool meet the conditions of CRR.
e) Credit institutions investing in the CBs and the issuer comply with the transparency
requirement of CRR.
f) CBs with a credit assessment assigned at least CQS 1 by a nominated ECAI, an equivalent
CQS in the event of a short-term credit assessment or, if no assessment, a 10% risk weight
assigned in accordance with CRR.
**Loans secured by immovable property, the requirements in Articles 208 and 229(1) of Regulation (EU)
No 575/2013 must be met.

96 | 6 September 2016 www.danskeresearch.com
Co
vered B
on
ds R
egula
tory Fra
mew
ork a
nd
Trea
tmen
t
Covered Bonds Regulatory Framework and Treatment
g) Minimum asset coverage requirement of at least 7% is applicable. If benchmark issuance
(EUR500m or the equivalent amount in domestic currency) or higher, a minimum asset
coverage requirement of 2% (the same as for EU CBs).
Level 2B assets (Article 12)
Exposures in the form of high-quality CBs which shall comply with all of the following
requirements:
a) Bonds meeting UCITS or CRR requirements.
b) Credit institutions investing in the CBs and the issuer meet the transparency requirement
referred to in CRR, on at least a quarterly basis.
c) Issue size is at least EUR250m (or equivalent in domestic currency).
d) CBs are collateralised exclusively by the assets referred to in points (a), (d)(i) and (e) of
Article 129(1) of CRR (residential and public but no commercial assets).
e) The pool of underlying assets consists exclusively of exposures which qualify for a 35% or
lower risk weight under Article 125 of Regulation (EU) No. 575/2013 for credit risk.
f) The cover pool meets at all times an asset coverage requirement of at least 10% in excess
of the amount required to meet the claims attaching to the CBs.
g) The issuing credit institution needs to disclose publicly on a monthly basis that the cover
pool meets the 10% asset coverage requirement.
Caps and haircuts applicable to covered bonds
The holdings of CBs in the liquidity buffer are subject to caps on the overall holding and the
different level of CBs in particular. For instance, external credit assessment institution Level 1
rated CBs may solely fill 70% of the buffer, but then no further CBs (Level 2A or 2B) may be
held. The overall holding of CBs is then entirely comprised of Level 1 CBs. In another example,
if 40% Level 2A CBs are held, which is the maximum amount for Level 2A + 2B, then only
30% are available for Level 1. For Level 2B CBs the cap is 15% and so forth. Table 156 provides
an overview of haircuts and caps applied in the Delegated Act.
European Banking Recovery and Resolution Directive
In 2014 the European parliament set a common framework across all 28 EU countries on a
directive to define how banks are to be treated in a troubled scenario. CBs were excluded from
the European Banking Recovery and Resolution Directive (BRRD) bail-in tool. Therefore,
claims of CB holders will be exempted from the bail-in process. The exclusion of CBs has
recognised the instrument as a bankruptcy-remote financial instrument and clarified any impact
the BRRD will have. Further, the implementation of the new BRRD framework has a positive
impact on CBs as it makes banks more resilient and prepared for future crisis, benefiting the
credit ratings of banks (issuers) on a standalone basis and consequently their issued CBs.
However, there remains uncertainty on whether voluntary over-collateralisation will be subject
to bail-in or not.
Table 156. High-quality liquid assets
Level Haircut Cap
1(B) 7% 70%
Ma
x 70
%
Ma
x 40
%
2A 15% 40% 2B 30% 15%
Source: LCR Delegated Act

97 | 6 September 2016 www.danskeresearch.com
Co
veredB
on
ds R
egula
tory Fra
mew
ork a
nd
Trea
tmen
t
Disclosure This research report has been prepared by Danske Bank Markets, a division of Danske Bank A/S (‘Danske Bank’). The
authors of the research report are Lukas Platzer, Senior Analyst and Sverre Holbek, Senior Analyst.
Analyst certification
Each research analyst responsible for the content of this research report certifies that the views expressed in the research
report accurately reflect the research analyst’s personal view about the financial instruments and issuers covered by the
research report. Each responsible research analyst further certifies that no part of the compensation of the research analyst
was, is or will be, directly or indirectly, related to the specific recommendations expressed in the research report.
Regulation
Danske Bank is authorised and subject to regulation by the Danish Financial Supervisory Authority and is subject to the
rules and regulation of the relevant regulators in all other jurisdictions where it conducts business. Danske Bank is subject
to limited regulation by the Financial Conduct Authority and the Prudential Regulation Authority (UK). Details on the
extent of the regulation by the Financial Conduct Authority and the Prudential Regulation Authority are available from
Danske Bank on request.
The research reports of Danske Bank are prepared in accordance with the Danish Finance Society’s rules of ethics and the
recommendations of the Danish Securities Dealers Association.
Danske Bank is not registered as a Credit Rating Agency pursuant to the CRA Regulation (Regulation (EC) no. 1060/2009);
hence, Danske Bank does not comply with or seek to comply with the requirements applicable to credit rating agencies.
Any ratings are provided as part of an investment research product and do not equate with ratings produced by Credit Rating
Agencies.
Conflicts of interest
Danske Bank has established procedures to prevent conflicts of interest and to ensure the provision of high-quality research
based on research objectivity and independence. These procedures are documented in Danske Bank’s research policies.
Employees within Danske Bank’s Research Departments have been instructed that any request that might impair the
objectivity and independence of research shall be referred to Research Management and the Compliance Department.
Danske Bank’s Research Departments are organised independently from and do not report to other business areas within
Danske Bank.
Research analysts are remunerated in part based on the overall profitability of Danske Bank, which includes investment
banking revenues, but do not receive bonuses or other remuneration linked to specific corporate finance or debt capital
transactions.
Danske Bank is a market maker and may hold positions in the financial instruments mentioned in this research report.
Danske Bank, its affiliates and subsidiaries are engaged in commercial banking, securities underwriting, dealing, trading,
brokerage, investment management, investment banking, custody and other financial services activities, may be a lender to
the companies mentioned in this publication and have whatever rights are available to a creditor under applicable law and
the applicable loan and credit agreements. At any time, Danske Bank, its affiliates and subsidiaries may have credit or other
information regarding the companies mentioned in this publication that is not available to or may not be used by the
personnel responsible for the preparation of this report, which might affect the analysis and opinions expressed in this
research report.
See http://www-2.danskebank.com/Link/researchdisclaimer for further disclosures and information.
General disclaimer This research has been prepared by Danske Bank Markets (a division of Danske Bank A/S). It is provided for informational
purposes only. It does not constitute or form part of, and shall under no circumstances be considered as, an offer to sell or
a solicitation of an offer to purchase or sell any relevant financial instruments (i.e. financial instruments mentioned herein
or other financial instruments of any issuer mentioned herein and/or options, warrants, rights or other interests with respect
to any such financial instruments) (‘Relevant Financial Instruments’).
The research report has been prepared independently and solely on the basis of publicly available information that Danske
Bank considers to be reliable. While reasonable care has been taken to ensure that its contents are not untrue or misleading,
no representation is made as to its accuracy or completeness and Danske Bank, its affiliates and subsidiaries accept no
liability whatsoever for any direct or consequential loss, including without limitation any loss of profits, arising from
reliance on this research report.
The opinions expressed herein are the opinions of the research analysts responsible for the research report and reflect their
judgement as of the date hereof. These opinions are subject to change, and Danske Bank does not undertake to notify any
recipient of this research report of any such change nor of any other changes related to the information provided in this
research report.
This research report is not intended for, and may not be redistributed to, retail customers in the United Kingdom or the United
States.

98 | 6 September 2016 www.danskeresearch.com
Co
vered B
on
ds R
egula
tory Fra
mew
ork a
nd
Trea
tmen
t
This research report is protected by copyright and is intended solely for the designated addressee. It may not be reproduced
or distributed, in whole or in part, by any recipient for any purpose without Danske Bank’s prior written consent.
Disclaimer related to distribution in the United States This research report was created by Danske Bank A/S and is distributed in the United States by Danske Markets Inc., a
U.S. registered broker-dealer and subsidiary of Danske Bank A/S, pursuant to SEC Rule 15a-6 and related interpretations
issued by the U.S. Securities and Exchange Commission. The research report is intended for distribution in the United States
solely to ‘U.S. institutional investors’ as defined in SEC Rule 15a-6. Danske Markets Inc. accepts responsibility for this
research report in connection with distribution in the United States solely to ‘U.S. institutional investors’.
Danske Bank is not subject to U.S. rules with regard to the preparation of research reports and the independence of research
analysts. In addition, the research analysts of Danske Bank who have prepared this research report are not registered or
qualified as research analysts with the NYSE or FINRA but satisfy the applicable requirements of a non-U.S. jurisdiction.
Any U.S. investor recipient of this research report who wishes to purchase or sell any Relevant Financial Instrument may
do so only by contacting Danske Markets Inc. directly and should be aware that investing in non-U.S. financial instruments
may entail certain risks. Financial instruments of non-U.S. issuers may not be registered with the U.S. Securities and
Exchange Commission and may not be subject to the reporting and auditing standards of the U.S. Securities and Exchange
Commission.

N o r way
C h i e f A n a l y s t & H e a d of F r a n k J u l l u m+ 4 7 8 5 4 0 6 5 4 0f j u @ d a n s k e b a n k . n o
J o s te i n T v e d t+ 4 7 2 3 1 3 9 1 8 4j t v @ d a n s k e b a n k . c o m
F i N l a N d
C h i e f A n a l y s t & H e a d of P a s i P e t te r i K u o p p a m ä k i+ 3 5 8 1 0 5 4 6 7 7 1 5p a k u @ d a n s k e b a n k . c o m
H e n n a P ä i v i k k i M i k ko n e n + 3 5 8 1 0 5 4 6 6 6 1 9h m i @ d a n s k e b a n k . c o m
M i n n a E m i l i a K u u s i s to+ 3 5 8 1 0 5 4 6 7 9 5 5m k u u @ d a n s k e b a n k . c o m
i N t e r N at i o N a l M a c r o
C h i e f A n a l y s t & H e a d of A l l a n v o n M e h r e n + 4 5 4 5 1 2 8 0 5 5a l v o @ d a n s k e b a n k . d k
P e r n i l l e B o m h o l d t H e n n e b e r g+ 4 5 4 5 1 3 2 0 2 1p e r n i @ d a n s k e b a n k . d k
M i k a e l O l a i M i l h ø j+ 4 5 4 5 1 2 7 6 0 7m i l h @ d a n s k e b a n k . d k
F i x e d i N c o M e r e s e a r c h
C h i e f A n a l y s t & H e a d of A r n e L o h m a n n R a s m u s s e n + 4 5 4 5 1 2 8 5 3 2a r r @ d a n s k e b a n k . d k
J e n s P e te r S ø r e n s e n+ 4 5 4 5 1 2 8 5 1 7 j e n s s r @ d a n s k e b a n k . d k
C h r i s t i n a E . Fa l c h + 4 5 4 5 1 2 7 1 5 2c h f a @ d a n s k e b a n k . d k
J a n We b e r Ø s te r g a a r d+ 4 5 4 5 1 3 0 7 8 9j a s t @ d a n s k e b a n k . d k
A n d e r s M ø l l e r L u m h o l t z+ 4 5 4 5 1 2 8 4 9 8a n d j r g @ d a n s k e b a n k . d k
H a n s R o a g e r J e n s e n+ 4 5 4 5 1 3 0 7 8 9h r o a @ d a n s k e b a n k . d k
M a th i a s R ø n M o g e n s e n + 4 5 4 5 1 4 7 2 2 6m m o g @ d a n s k e b a n k . d k
F x & c o M M o d i t i e s s t r at e g y
G l o b a l H e a d of F I C C R e s e a r c hT h o m a s H a r r+ 4 5 4 5 1 3 6 7 3 1th h a r @ d a n s k e b a n k . d k
C h r i s t i n K y r m e Tu x e n+ 4 5 4 5 1 3 7 8 6 7tu x @ d a n s k e b a n k . d k
M o r te n T h r a n e H e l t+ 4 5 4 5 1 2 8 5 1 8m o h e l @ d a n s k e b a n k . d k
J e n s N æ r v i g P e d e r s e n + 4 5 4 5 1 2 8 0 6 1j e n p e @ d a n s k e b a n k . d k
K r i s tof f e r K j æ r L o m h o l t+ 4 5 4 5 1 2 8 5 2 9 k l o m @ d a n s k e b a n k . d k
d c M r e s e a r c h
C h i e f A n a l y s t & H e a d of T h o m a s M a r t i n H o v a r d+ 4 5 4 5 1 2 8 5 0 5 h o v a @ d a n s k e b a n k . d k
L o u i s L a n d e m a n+ 4 6 8 5 6 8 8 0 5 2 4l l a n @ d a n s k e b a n k . s e
J a ko b M a g n u s s e n + 4 5 4 5 1 2 8 5 0 3j a k j a @ d a n s k e b a n k . d k
M a d s R o s e n d a l+ 4 5 4 5 1 4 8 8 7 9m a d r o @ d a n s k e b a n k . d k
G a b r i e l B e r g i n+ 4 6 8 5 6 8 8 0 6 0 2g a b e @ d a n s k e b a n k . s e
B r i a n B ø r s t i n g+ 4 5 4 5 1 2 8 5 1 9b r b r @ d a n s k e b a n k . d k
L a r s H o l m+ 4 5 4 5 1 2 8 0 4 1l a h o @ d a n s k e b a n k . d k
B j ø r n K r i s t i a n R ø e d+ 4 7 8 5 4 0 7 0 7 2b r e d @ d a n s k e b a n k . co m
S v e r r e H o l b e k+ 4 5 4 5 1 4 8 8 8 2h o l b @ d a n s k e b a n k . d k
N i k l a s R i p a+ 4 5 4 5 1 2 8 0 4 7n i r i @ d a n s k e b a n k . d k
H e n r i k R e n è A n d r e s e n + 4 5 4 5 1 3 3 3 2 7h e n a @ d a n s k e b a n k . d k
S o n d r e D a l e S to r m y r + 4 7 8 5 4 0 7 0 7 0s o s t @ d a n s k e b a n k . co m
Ø y v i n d M o s s i g e + 4 7 8 5 4 0 5 4 9 1o m s s @ d a n s k e b a n k . co m
K n u t - I v a r B a k k e n + 4 7 8 5 4 0 7 0 7 4k n b @ d a n s k e b a n k . co m
L u k a s P l a t z e r+ 4 5 4 5 1 2 8 4 3 0l p l a @ d a n s k e b a n k . d k
K a tr i n e J e n s e n+ 4 5 4 5 1 2 8 0 5 6k a tr i @ d a n s k e b a n k . co m
H a s e e b S y e d+ 4 7 8 5 4 0 5 4 1 9h s y @ d a n s k e b a n k . co m
P e g a h A h m a r i n e j a d+ 4 6 8 5 6 8 8 0 5 9 3p a h m @ d a n s k e b a n k . co m
A n d e r s To r g r i m H o l te + 4 7 8 5 4 0 5 7 8 4a h o l t @ d a n s k e b a n k . co m
B e n d i k E n g e b r e ts e n+ 4 7 8 5 4 0 6 9 1 4b e e @ d a n s k e b a n k . co m
d e N M a r k
C h i e f E c o n o m i s t & H e a d of L a s O l s e n + 4 5 4 5 1 2 8 5 3 6l a s o @ d a n s k e b a n k . d k
L o u i s e A g g e r s tr ø m H a n s e n+ 4 5 4 5 1 2 8 5 3 1l o u h a n @ d a n s k e b a n k . d k
B j ø r n Ta n g a a S i l l e m a n n + 4 5 4 5 1 2 8 2 2 9b j s i @ d a n s k e b a n k . d k
s w e d e N
C h i e f A n a l y s t & H e a d of M i c h a e l B o s tr ö m+ 4 6 8 5 6 8 8 0 5 8 7m b o s @ d a n s k e b a n k . s e
R o g e r J o s e f s s o n+ 4 6 8 5 6 8 8 0 5 5 8 r j o s @ d a n s k e b a n k . s e
M i c h a e l G r a h n + 4 6 8 5 6 8 8 0 7 0 0m i k a @ d a n s k e b a n k . s e
C a r l M i l to n+ 4 6 8 5 6 8 8 0 5 9 8c a r m i @ d a n s k e b a n k . s e
M a r c u s S ö d e r b e r g+ 4 6 8 5 6 8 8 0 5 6 4m a r s d @ d a n s k e b a n k . s e
S te f a n M e l l i n+ 4 6 8 5 6 8 8 0 5 9 2m e l l @ d a n s k e b a n k . s e
S u s a n n e P e r n e b y+ 4 6 8 5 6 8 8 0 5 8 5s u p e @ d a n s k e b a n k . s e
Global Danske ReseaRch
e M e r g i N g M a r k e t s
C h i e f A n a l y s t & H e a d of J a ko b E k h o l d t C h r i s te n s e n+ 4 5 4 5 1 2 8 5 3 0j a k c @ d a n s k e b a n . d k
V l a d i m i r M i k l a s h e v s k y + 3 5 8 ( 0 ) 1 0 5 4 6 7 5 2 2v l m i @ d a n s k e b a n k . co m
R o k a s G r a j a u s k a s+ 3 7 0 5 2 1 5 6 2 3 1r g r a @ d a n s k e b a n k . l t
D a n s k e B a n k , D a n s k e R e s e a r c h , H o l m e n s K a n a l 2 - 1 2 , D K - 1 0 9 2 C o p e n h a g e n K . P h o n e + 4 5 4 5 1 2 0 0 0 0 w w w. d a n s k e r e s e a r c h . co m