The Nexus Between Firm's Environmental Performance and ...
180
HAL Id: tel-03216523 https://tel.archives-ouvertes.fr/tel-03216523 Submitted on 4 May 2021 HAL is a multi-disciplinary open access archive for the deposit and dissemination of sci- entific research documents, whether they are pub- lished or not. The documents may come from teaching and research institutions in France or abroad, or from public or private research centers. L’archive ouverte pluridisciplinaire HAL, est destinée au dépôt et à la diffusion de documents scientifiques de niveau recherche, publiés ou non, émanant des établissements d’enseignement et de recherche français ou étrangers, des laboratoires publics ou privés. The Nexus Between Firm’s Environmental Performance and Financial Resilience Muhammad Ullah To cite this version: Muhammad Ullah. The Nexus Between Firm’s Environmental Performance and Financial Re- silience. Business administration. Université Clermont Auvergne [2017-2020], 2020. English. NNT : 2020CLFAD012. tel-03216523
Transcript of The Nexus Between Firm's Environmental Performance and ...

HAL Id: tel-03216523https://tel.archives-ouvertes.fr/tel-03216523
Submitted on 4 May 2021
HAL is a multi-disciplinary open accessarchive for the deposit and dissemination of sci-entific research documents, whether they are pub-lished or not. The documents may come fromteaching and research institutions in France orabroad, or from public or private research centers.
L’archive ouverte pluridisciplinaire HAL, estdestinée au dépôt et à la diffusion de documentsscientifiques de niveau recherche, publiés ou non,émanant des établissements d’enseignement et derecherche français ou étrangers, des laboratoirespublics ou privés.
The Nexus Between Firm’s Environmental Performanceand Financial Resilience
Muhammad Ullah
To cite this version:Muhammad Ullah. The Nexus Between Firm’s Environmental Performance and Financial Re-silience. Business administration. Université Clermont Auvergne [2017-2020], 2020. English. �NNT :2020CLFAD012�. �tel-03216523�

UNIVERSITÉ CLERMONT AUVERGNE
École Universitaire de Management
École Doctorale des Sciences Économiques, Juridiques, Politiques et de Gestion
Clermont Recherche Management (CleRMa)
Sujet de la thèse :
The Nexus Between Firms’
Environmental Performance and Financial Resilience
Pour obtentir le titre de
DOCTEUR EN SCIENCES DE GESTION
Présentée par
Muhammad ULLAH
soutenue le 18 juin 2020
devant le jury composé de :
Directeur de thèse Sylvain MARSAT Professeur, Université Clermont Auvergne
Rapporteur Stéphanie SERVE Professeure, Université Paris-Est Créteil
Rapporteur Walid BEN AMAR Professeur, Université d’Ottawa
Suffragant Sophie SPRING Professeure, Université de Montpellier
Suffragant Guillaume PIJOURLET Maître de conférences, Université Clermont Auvergne

L’université n’entend donner aucune approbation ni improbation aux opinions émises dans
les thèses ; ces opinions doivent être considérées comme propres à leurs auteurs.

v
Acknowledgements
I would like to express my appreciations to all the people who made this thesis possible. First
of all, I am greatly indebted to my thesis supervisor, Professor Sylvain MARSAT. Not only his
kindness, availability, and continuous support made it possible, but his invaluable guidance,
and encouragement made it easy for me to achieve this research work. I would express my
sincere thanks to my teacher, Dr. Guillaume PIJOURLET, for his contribution, giving valuable
suggestions and corrections to this work. This research would not have been successful without
his support and assistance. I extend my deepest gratitude to the esteemed members of the jury,
Professor Stéphanie SERVE, Professor Walid BEN AMAR, and Professor Sophie SPRING,
for their precious time they paid to my research and for agreeing to participate in its evaluation.
I would also like to thank the director of the Chair "Value & CSR", Dr. Mathieu GOMES, for
his support and providing us the environmental data used in this research. My gratitude goes
to the CleRMa family, whether they are teachers, doctoral students or in administration. I thank
the researchers of the FIRE workshop for their remarks and suggestions during monthly
CleRMa seminars. The thoughts shared during these workshops greatly enriched my research.
I also thank Ms. Ntxhee LY for coordinating all my conference visits since the feedback I
received in those conferences have enriched my thoughts and improved the quality of my
research. I am also thankful to my friends whose support and assistance were invaluable
throughout in all these years, especially to Adeel, Badi-ud-Din, Khabeer, Fahim, Mustafa,
Sajjad, Syed Aale and Waqar. They were with me throughout the journey and shared all
happiness and misfortunes.
Most importantly, my thanks go particularly to my family. I would like to say special thanks
to my parents, who have been extremely patient and supportive throughout my entire academic

vi
journey. I am thankful for their unconditional love and sacrifices through my long years away
from home. To my wife, Naheed, my daughters, Rabia, Hijab and Saba-Noor, and my sons,
Khushal and Mashal, I owe a great deal for their understanding, sacrifices, unwavering support
and motivation to enable me to complete this thesis. I am also very indebted to my sisters,
brothers, uncles, and cousins who made me resilient to hard and troubled times.
Finally, I acknowledge and express my appreciations to the Higher Education Commission of
Pakistan for providing me the financial assistance for three years of research that enabled me
to accomplish this work.


viii
Abstract
This thesis comprises three empirical essays investigating the impact of environmental
performance (EP) of firms on their financial resilience. We capitalize from the vast literature
of EP on financial performance and contribute to uncover an unexplored aspect of financial
performance, i.e. financial resilience. Financial resilience can be defined as “both the ability of
a system to persist despite financially stressful events and the ability to regenerate and maintain
existing organization” (Gunderson and Pritchard, 2002, DesJardine et al., 2017). On the one
hand, based on shareholders’ expense view, high EP may be viewed as an overinvestment or
waste of financial resources and may therefore reduce a company’s financial resilience when
confronted to an adverse event. On the other hand, in line with the natural-resource-based and
environment-as-a-resource views, high EP companies may buffer the shock and recover faster
by benefitting from stakeholders’ attention through their reputation of being eco-friendly and
the competitive advantage of having valuable and inimitable resources.
The first chapter introduces the EP and organizational resilience and discusses their financial
implications from theoretical and empirical literatures. Bridging the literatures of both areas
from a financial viewpoint lead us to our general research question, to investigate “the nexus
between firms’ EP and their financial resilience”. Building on this, the chapter then introduces
the avenues of research that are undertaken in the following chapters.
In the second chapter, we investigate the relationship in the context of a global shock for the
worldwide economy, the subprime financial crisis of 2007. Using an international sample of
1,622 observations, we measure firm’s financial resilience by the time to recovery of their
market prices to the pre-crisis level. By performing survival analysis, we find that high EP is

ix
negatively related to the financial resilience of companies. This indicate that high EP seems to
be an organizational constraint that limits the ability of a company to be financially resilient to
general financial crisis. However, we also find that EP is not detrimental to resilience for its
specific product innovation dimension, nor for companies in less environmentally oriented
countries.
In the third chapter, we investigate the relationship in the context of regulatory requirements,
more precisely by the disruptions caused by the disclosure of verified emissions under the EU
ETS. Performing the survival analysis over a sample of 3,194 observations covered under the
EU ETS, we find that high EP is positively related to the financial resilience, measured by time
to recovery of firm’s market price to the day before the publication. In line with the natural
resource based view (Hart, 1995, Russo and Fouts, 1997) and the environment-as-a resources
framework (Flammer, 2013), this finding suggest that high EP is beneficial for company, and
improves the ability of companies to be financially resilient in the context of an environmental
regulative framework. However, we find that high EP is more beneficial if firm is in carbon-
intensive industry, the carbon prices are high.
Finally, the fourth chapter investigates the impact of EP on financial resilience to jolts caused
by company specific environmental controversies. We apply survival analysis and OLS
regression models to assess the impact of firms’ EP on their flexibility (time to recovery of
market value) and stability (severity of loss in market value) dimensions of resilience,
respectively. Using an international sample of 233 observations over the 2010-2016 period, we
find that prior EP significantly enhances the both dimensions of financial resilience of
companies. This finding indicates that stakeholders are more likely to consider the occurrence
of a negative environmental event from a high EP firm as an anomaly rather than a usual
behavior, since high EP firm benefits from good stakeholder relations. However, this

x
relationship is sensitive to different conditions and stands only for companies in
environmentally oriented countries, in most polluting industries and for two of the dimensions
of EP, i.e. emission reduction and product innovation.
Overall, if high EP seems detrimental to financial resilience in the context of general financial
disruptions, we find that EP is improving financial resilience in the specific context of
disruptions involving environmental engagements from companies, i.e. environmental
regulations and environmental controversies. The impact of EP on resilience is then dependent
to the context of the adverse event encountered by the firm.
Keywords: Financial Resilience, Environmental Performance, Survival Analysis, Firm Value,
Crisis Management, Financial Markets.
xi
Résumé
Cette thèse comprend trois essais empiriques traitant de l’impact de la performance
environnementale des entreprises sur leur résilience financière. Nous mobilisons la vaste
littérature concernant le lien entre la performance environnementale et la performance
financière et contribuons en analysant un aspect non traité de la performance financière, à
savoir la résilience financière. La résilience financière peut être définie comme “à la fois la
capacité d'un système à persister malgré des événements financièrement stressants et la
capacité de régénérer et de maintenir l'organisation existante” (Gunderson and Pritchard, 2002,
DesJardine et al., 2017). D’une part, du point de vue actionnarial, une performance
environnementale élevée peut être considérée comme un surinvestissement ou un gaspillage de
ressources financières et peut donc réduire la résilience financière d’une entreprise face à un
événement défavorable. D'un autre côté, conformément à la vision de l'environnement en tant
que ressource, les entreprises avec un performance environnementale élevée peuvent amortir
le choc et récupérer plus rapidement en bénéficiant de l'attention des parties prenantes, et cela
grâce à leur réputation d'être respectueuses de l'environnement et à l'avantage concurrentiel
d'avoir des ressources inimitables.
Le premier chapitre présente la performance environnementale et la résilience
organisationnelle, et traite de leurs implications financières à partir des littératures théoriques
et empiriques. Mobiliser la littérature des deux domaines nous amène à notre question de
recherche générale, qui cherche à investiguer le lien entre la performance environnementale
des entreprises et leur résilience financière. S'appuyant sur cela, le chapitre présente ensuite les
pistes de recherche qui sont conduites dans les chapitres suivants.

xii
Dans le deuxième chapitre, nous étudions la relation dans le contexte d'un choc mondial pour
l'économie, la crise financière des subprimes de 2007. En utilisant un échantillon international
de 1622 observations, nous mesurons la résilience financière des entreprises comme le temps
nécessaire que le cours de bourse de l’entreprise retrouve son prix de marché du niveau d'avant
la crise. En effectuant une analyse de survie, nous constatons qu'unee performance
environnementale élevée est négativement lié à la résilience financière des entreprises. Cela
indique qu'une performance environnementale élevée semble être une contrainte
organisationnelle qui limite la capacité d'une entreprise à être financièrement résiliente à la
crise financière générale. Cependant, nous constatons également que la performance
environnementale n'est pas préjudiciable à la résilience dans sa dimension spécifique
d'innovation de produit, ni pour les entreprises dont le siège sociale est localisé dans des pays
moins soucieux de l'environnement.
Dans le troisième chapitre, nous étudions la relation dans le contexte des exigences
réglementaires, plus précisément par les perturbations causées par la divulgation des émissions
vérifiées dans le cadre des ETS européens (EU ETS). En effectuant l'analyse de survie sur un
échantillon de 3194 observations couvertes par l'EU ETS, nous constatons qu'un EP élevé est
positivement lié à la résilience financière, mesuré par le temps nécessaire à la récupération du
prix du marché de l'entreprise jusqu'à la celui de la veille de la publication. Conformément à la
vision basée sur les ressources naturelles (Hart, 1995, Russo and Fouts, 1997) et au cadre de
l’environnement comme une ressource (Flammer, 2013), cette constatation suggère qu'une
performance environnementale élevée est bénéfique pour l'entreprise et améliore la capacité
des entreprises à être financièrement résilientes dans un cadre réglementaire environnemental.
Le quatrième chapitre examine l'impact de la performance environnementale sur la résilience
financière dans le contexte des controverses environnementales spécifiques aux entreprises.

xiii
Nous appliquons des modèles d'analyse de survie et de régression de moindres carrés pour
évaluer l'impact de la performance environnementale des entreprises sur leurs dimensions de
flexibilité (délai de récupération de la valeur de marché) et de stabilité (gravité de la perte de
valeur de marché) de la résilience. En utilisant un échantillon international de 233 observations
sur la période 2010-2016, nous constatons que de la performance environnementale améliore
considérablement les deux dimensions de la résilience financière des entreprises. Cette
constatation indique que les parties prenantes sont plus susceptibles de considérer la
survenance d'un événement environnemental négatif d'une entreprise à performance
environnementale élevée comme une anomalie plutôt qu'un comportement habituel, car elle
bénéficie de bonnes relations avec les parties prenantes. Cependant, cette relation est sensible
à différentes conditions et ne concerne que les entreprises des pays les plus impliqués dans la
dimension environnementale, les industries polluantes et pour deux des dimensions de la
performance environnementale, à savoir la réduction des émissions et l'innovation des produits.
Dans l'ensemble, si la performance environnementale élevée semble nuire à la résilience
financière dans le contexte de perturbation financière générale, nous constatons qu’elle
améliore la résilience financière dans le contexte des perturbations impliquant des engagements
environnementaux de la part des entreprises, à savoir les réglementations environnementales
et les controverses environnementales. L'impact du EP sur la résilience dépend alors du
contexte de l'événement indésirable rencontré par l'entreprise.
Mots clés : Résilience financière, Performance Environnementale, Analyse de Survie, Valeur
de l'Entreprise, Gestion de Crise, Marchés Financiers,

xiv
Table of contents
Acknowledgements .................................................................................................................. v
Abstract ................................................................................................................................. viii
Résumé ..................................................................................................................................... xi
Table of contents ................................................................................................................... xiv
List of Figures ....................................................................................................................... xvii
List of Tables ...................................................................................................................... xviii
Abbreviations ......................................................................................................................... xx
General introduction ............................................................................................................... 1
Chapter 1. EP and company’s financial resilience ......................................................... 12
1.1. Corporate environmental engagements ......................................................................... 12
1.1.1. The growing environmental pressure..................................................................... 12
1.1.2. Financial implications of environmental engagements for firms .......................... 15
1.1.3. The EP-FP link: evidence from empirical studies ................................................. 17
1.2. Organizational resilience overview ............................................................................... 19
1.2.1. Firms and turbulent environments ......................................................................... 19
1.2.2. The concept of resilience ....................................................................................... 20
1.2.3. Organizational resilience: main empirical studies ................................................. 22
1.2.3.1. Gittell et al. (2006) study of resilience: airplane companies after the
September 11th, 2001 attack ......................................................................................... 22
1.2.3.2. CSR and financial resilience: the study of Ortiz-de-Mandojana and Bansal
(2016) ........................................................................................................................... 23
1.2.3.3. CSR and financial resilience after the subprime crisis : DesJardine et al.
(2017) ........................................................................................................................... 24
1.3. The nexus between EP and resilience ........................................................................... 27
1.3.1. Bridging EP and resilience..................................................................................... 27
1.3.2. EP and financial resilience: theoretical framework ............................................... 27
1.3.3. Conclusion: avenues of research ............................................................................ 29
Chapter 2. Is there a trade-off between environmental performance and financial
resilience? International evidence from the subprime crisis ............................................. 34

xv
Abstract ................................................................................................................................ 34
2.1. Introduction ................................................................................................................... 35
2.2. Hypotheses .................................................................................................................... 38
2.3. Data and methodology .................................................................................................. 41
2.3.1. Variables and research sample ............................................................................... 41
2.3.2. Sample ................................................................................................................... 44
2.4. Results ........................................................................................................................... 46
2.4.1. Univariate tests ...................................................................................................... 46
2.4.2. Survival analysis estimations ................................................................................. 49
2.4.3. Sensitivity to environmental policies dimension and country level
environmental standards .................................................................................................. 54
2.5. Conclusion .................................................................................................................... 57
Chapter 3. Do environmental engagements improve financial resilience of firms
after emission disclosure?...................................................................................................... 62
Abstract ................................................................................................................................ 62
3.1. Introduction ................................................................................................................... 63
3.2. Literature and hypothesis development ........................................................................ 68
3.3. Variables and methodology .......................................................................................... 71
3.3.1. Variables ................................................................................................................ 71
3.3.2. Survival Analysis methodology ............................................................................. 76
3.3.3. Data analysis .......................................................................................................... 77
3.4. Results ........................................................................................................................... 82
3.4.1. Univariate tests ...................................................................................................... 82
3.4.2. Main results - survival analysis model .................................................................. 85
3.4.3. Additional tests ...................................................................................................... 92
3.5. Conclusion .................................................................................................................... 99
Chapter 4. Do environmentally responsible firms bounce back more quickly after
environmental controversies? International evidence ...................................................... 103
Abstract .............................................................................................................................. 103
4.1. Introduction ................................................................................................................. 104
4.2. Literature and Hypothesis ........................................................................................... 108
4.3. Data and methodology ................................................................................................ 112
4.3.1. Variables .............................................................................................................. 112
4.3.2. Sample ................................................................................................................. 114
4.4. Results ......................................................................................................................... 117

xvi
4.4.1. EP and resilience after a controversy ................................................................... 117
4.4.2. When does EP helps firms to be more resilient? ................................................. 123
4.5. Conclusion .................................................................................................................. 130
Appendix A. Examples of environmental controversies .................................................. 132
General conclusion ............................................................................................................... 134
References ............................................................................................................................. 147

xvii
List of Figures
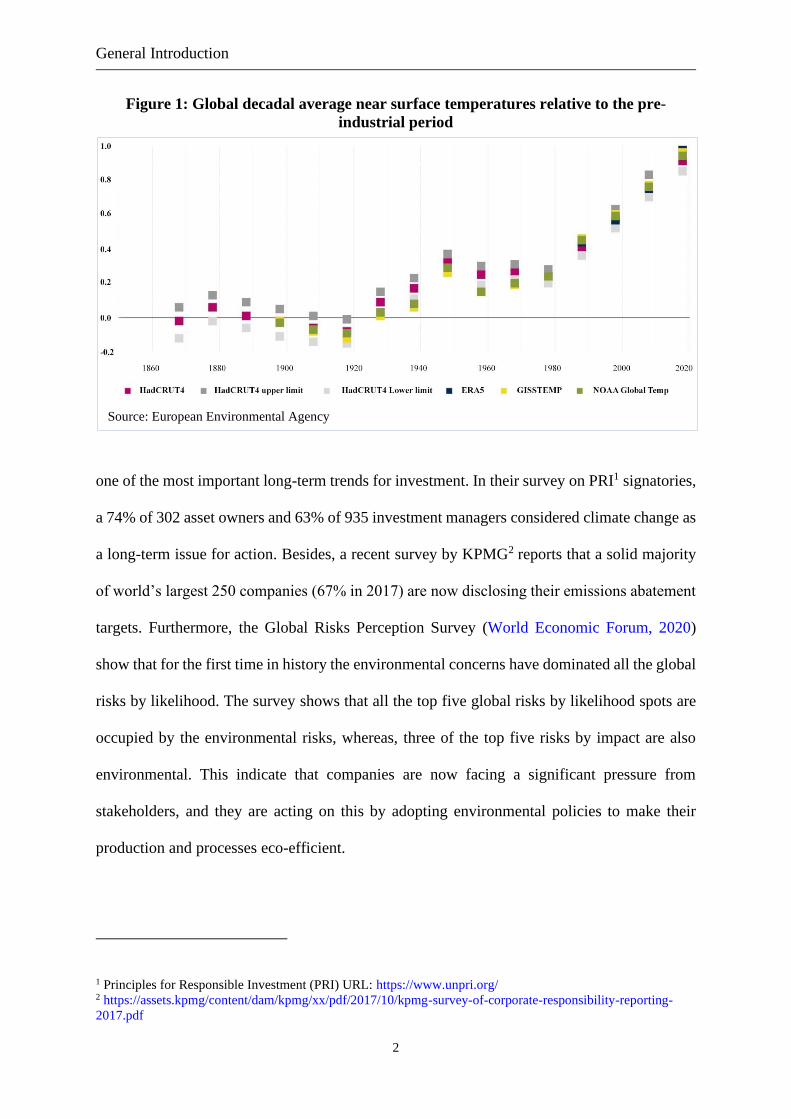
Figure 1: Global decadal average near surface temperatures relative to the pre-industrial
period ................................................................................................................... 2
Figure 1.1: Number of research publications related to climate risk ................................ 13
Figure 1.2: Climate change negotiations timeline ............................................................. 14
Figure 1.3: Annual number of business bankruptcy cases filed in the United States ....... 20
Figure 2.1: Kaplan-Meier survival estimates between high and low EP groups .............. 48
Figure 3.1: Kaplan-Meier survival estimates for high versus low CI groups ................... 84

xviii
List of Tables
Table 1.1: Empirical studies on financial resilience.......................................................... 26
Table 2.1: Summary of variables ...................................................................................... 44
Table 2.2: Sample construction ......................................................................................... 45
Table 2.3: Sample Description .......................................................................................... 45
Table 2.4: Summary Statistics ........................................................................................... 46
Table 2.5: Matched t-test of EP comparison between recovered and unrecovered firm’s
groups ................................................................................................................ 47
Table 2.6: Log-rank test for equality of Kaplan-Meier curves.......................................... 48
Table 2.7: Impact of environmental performance on financial resilience ......................... 50
Table 2.8: Impact of environmental performance on financial resilience - Robustness
to different time windows ................................................................................. 52
Table 2.9: Impact of environmental performance on financial resilience – Alternative
models ............................................................................................................... 53
Table 2.10: Impact of environmental performance on financial resilience – EP subsets . 55
Table 2.11: Impact of environmental performance on financial resilience – Split
according to country-level environmental standards ........................................ 58
Table 3.1: The date publications of verified emissions ..................................................... 73
Table 3.2: Summary of Variables ..................................................................................... 75
Table 3.3: Sample Construction ........................................................................................ 79
Table 3.4: Sample distribution by country, sector and year .............................................. 80
Table 3.5: Summary statistics and correlation matrix ....................................................... 82
Table 3.6: Two-sample t-test with equal variances for comparison of probability of
recovery between high versus low carbon intensity groups. ............................. 83
Table 3.7: Log-rank test for equality of survivor functions for high versus low CI groups
........................................................................................................................... 85
Table 3.8: Cox model - Impact of log-transformed carbon intensity on flexibility .......... 87
Table 3.9: Robustness check - Impact of log-transformed carbon intensity on flexibility
– 120 days window ............................................................................................ 89
Table 3.10: Robustness check: Excluding the country-level sample bias in the link
between carbon intensity and flexibility – 120 days window ........................... 90
Table 3.11: Sensitivity to other measures of carbon intensity – 120 days window .......... 93
Table 3.12: Sensitivity to the carbon-intensity profile of firm’s sector – 120 days
window .............................................................................................................. 96
Table 3.13: Link between allocation shortage and flexibility – 120 days window ........... 97

xix
Table 3.14: Impact of carbon intensity on flexibility in different phases of EU ETS –
120 days window ............................................................................................... 98
Table 4.1: Summary of Variables ................................................................................... 114
Table 4.2: Sample Construction ...................................................................................... 115
Table 4.3: Sample distribution by country, industry and year ........................................ 115
Table 4.4: Summary Statistics ......................................................................................... 116
Table 4.5: EP and Severity of Loss after an environmental controversy – Time window
of 15 days ........................................................................................................ 118
Table 4.6: EP and severity of loss after an environmental controversy - Robustness to
Different Time Windows ................................................................................ 119
Table 4.7: Recovery after an environmental controversy (Cox Proportional Hazard
Regression) ...................................................................................................... 121
Table 4.8: Recovery after an environmental controversy : Robustness to Different Time
Windows (Cox Proportional Hazard Regression) ........................................... 122
Table 4.9: Recovery after an environmental controversy: Robustness to Different
Models ............................................................................................................. 125
Table 4.10: Resilience in High and Low Environmentally Performant Countries ......... 126
Table 4.11: Resilience in High and Low polluting industries ......................................... 127
Table 4.12: Resilience after an environmental controversy – Sensitivity to EP
Dimensions ...................................................................................................... 129

xx
Abbreviations
CI Carbon Intensity
CSR Corporate Social Responsibility
EP Environmental Performance
EPI Environmental Performance Index scores
EU ETS European Union’s Emission Trading Scheme
EUTL European Union Transaction Log
FP Financial Performance
GHG Greenhouse Gases emissions

xxi
بې بې او داجي ته ډالۍ*
* Dedicated to my parents

1
General introduction
Over the last few decades, concerns about climate change are dramatically increased. These
concerns are driven by the fact that the average global temperature is increasing, the amount of
snow and ice is decreasing, and sea levels are rising, which has widespread impacts on human
and the overall ecosystem (IPCC, 2014). While the human-induced greenhouse gasses (GHG)
emissions are the main contributor to global warming, IPCC (2014) find that humans are
influencing the climate system with a growing rate. As depicted in figure 1, the global decadal
average temperature is continuously increasing since the industrial revolution era. It is clear
now that among human-induced GHG emissions, industrial emissions are the main contributor,
where they contributed the carbon emissions of about 78% to the total GHG emissions from
1970 to 2010 (IPCC, 2014). As these emissions are driven by an increase in energy usage,
mainly from fossil fuel, a growth in world population and economic activity will further worsen
the problem of climate change. Therefore, the impact on human wellbeing cannot be reduced
if the path of sustainable development is not adopted (OECD, 2016).
Having a major contribution to the global GHG emissions, companies have been encouraged
to implement environmentally friendly policies to address climate change and environmental
issues, mitigate the economic impact on the environment, and develop eco-efficiencies
(Linnenluecke et al., 2016, Banerjee et al., 2019). At an international level, institutions such
as the World Business Council for Sustainable Development or the Conferences of Parties
(COP) strongly support such practices (Bazillier et al., 2017). Environmental issues have thus
become a crucial issue for companies, and all the more because stakeholders seem to be more
and more sensitive to these elements (Flammer, 2013). An analysis conducted by PRI-Novethic
(PRI-Novethic, 2017) reveal that global investors are considering actions on climate change as
General Introduction
2
Figure 1: Global decadal average near surface temperatures relative to the pre-
industrial period
one of the most important long-term trends for investment. In their survey on PRI1 signatories,
a 74% of 302 asset owners and 63% of 935 investment managers considered climate change as
a long-term issue for action. Besides, a recent survey by KPMG2 reports that a solid majority
of world’s largest 250 companies (67% in 2017) are now disclosing their emissions abatement
targets. Furthermore, the Global Risks Perception Survey (World Economic Forum, 2020)
show that for the first time in history the environmental concerns have dominated all the global
risks by likelihood. The survey shows that all the top five global risks by likelihood spots are
occupied by the environmental risks, whereas, three of the top five risks by impact are also
environmental. This indicate that companies are now facing a significant pressure from
stakeholders, and they are acting on this by adopting environmental policies to make their
production and processes eco-efficient.
1 Principles for Responsible Investment (PRI) URL: https://www.unpri.org/ 2 https://assets.kpmg/content/dam/kpmg/xx/pdf/2017/10/kpmg-survey-of-corporate-responsibility-reporting-
2017.pdf
Source: European Environmental Agency

General Introduction
3
While companies are trying to address the environmental issues, they are simultaneously
confronting a turbulent and continuously evolving marketplace. Extreme events like natural
disasters, terrorist attacks, organizational controversies, and pandemic diseases (like the recent
COVID-19) are frequently disrupting supply chain and paralyzing the financial markets. While
unexpected events and sudden changes in the natural or financial environment are frequently
surprising them, companies are now facing more and more challenges to survive and compete.
Indeed, companies will then need to mobilize their resources in a way to create resilience in
organization. A resilient organization has “both the ability to persist despite disruptions and the
ability to regenerate and maintain existing organization” (Gunderson and Pritchard, 2002,
DesJardine et al., 2017). In a challenging and unexpected adverse environment, resilient
organizations have the ability to mitigate the shocks and to bounce back.
Despite capturing the success of an organization against disruptions, organizational resilience
remains unexplored in empirical academic literature. This work remain scarce may be because
organizational resilience is difficult to measure (DesJardine et al., 2017). Very few studies link
some organizational attributes to this organizational outcome, while organizational resilience
can be measured by the recovery of company’ market price to the level before a disruption.
Gittell et al. (2006) examined the recovery of US airline companies in the aftermath of 9/11
terrorist attacks and find that a viable business model and financial resources help companies
to recover faster from a crisis. While examining the role of CSR practices in recovery from the
global financial crisis of 2007, DesJardine et al. (2017) find that strategic CSR practices, that
establishes long-term adjustments in and builds interdependencies across organizational
structure, improve the financial resilience relative to tactical CSR practices. Moreover, Ortiz-
de-Mandojana and Bansal (2016) find a low rate of failure of firms with high CSR relative to
their matching peers in the industry.

General Introduction
4
Considering both the environmental and financial claims during a distress situation, it is
however not clear that the resources dedicated to address the environmental issues are
penalizing or helping companies. To consider the financial impact of high environmental
performance (henceforth EP) on company’s financial performance (henceforth FP), majority
of previous work show a positive impact while few studies show a negative or no impact at all,
therefore, remains inconclusive (Horváthová, 2010). According to the neoclassical economists’
shareholders’ expense view, for example Friedman (1970), “the social responsibility of
business is to increase its profits”. Then, spending money on social-responsibility activities
such as environmental protection may drain resources from the business that could be
mobilized in the core or other functions of the business to maximize profits, hence shareholders
wealth. It seems unrealistic for managers to achieve various goals simultaneously, i.e. financial
and social goals (Jensen, 2001), therefore, it may create the agency problem due to the
difficulties for shareholders to monitor them (Barnea and Rubin, 2010). Managers may then
pursue their own interests (Barnea and Rubin, 2010), entrench themselves (Jiraporn and
Chintrakarn, 2013, Cespa and Cestone, 2007, Surroca and Tribó, 2008, Chahine et al., 2019)
and use it to mitigate control mechanisms (Surroca and Tribó, 2008, Fabrizi et al., 2014).
On the contrary, the natural resource-based view (Hart, 1995, Russo and Fouts, 1997) sees EP
as a key resource for firms, suggesting that environmental engagements improve firm
reputation of being eco-friendly and can gain competitive advantage through the acquisition of
rare, valuable, imperfectly imitable and non-substitutable resources. As stakeholders seem
more and more sensitive to the environmental issues (Flammer, 2013), high EP may protect
company from the consequences of a bad environmental event and may consider it as an
anomaly (Bansal and Clelland, 2004). In this vein, high EP may then provide the insurance-
like benefits in case of negative events (Godfrey et al., 2009). Recent work has identified some
other benefits of EP, for instance, green firms may have easier access to finance (Banerjee et
General Introduction
5
al., 2019, Nandy and Lodh, 2012, Cheng et al., 2014) and a lower cost of capital (Sharfman
and Fernando, 2008, Heinkel et al., 2001, Gupta, 2018, Chava, 2014). Furthermore, high EP is
also associated with a protection against the consequences of stringent environmental
regulations, while carbon intensity is attributed to the latent environmental liability in the shape
of future compliance or emissions abatement cost (Clarkson et al., 2015, Chapple et al., 2013,
Clarkson et al., 2004).
Though the financial benefits of high EP are preoccupied with the insurance-like effect and
environment-as-a-resource framework, we extend this literature by considering an unexplored
aspect of financial performance, namely financial resilience. We follow the works of
DesJardine et al. (2017) that explored the collective contribution of CSR practices to financial
resilience. The authors, however, do not disentangle environmental practices from other CSR
practices. We thus examine the precise contribution of EP to companies’ financial resilience.
In this thesis, we aim to answer the following main research question:
Does EP contribute to financial resilience while a company is in distress?
Keeping in view prior theoretical arguments about the financial implications of EP, we propose
two contrasting views to explain the possible link between EP and financial resilience. The first
view stems from neoclassical economist’s shareholders’ expense view, suggesting that
discretionary efforts towards EP-improvement may reduce companies’ profits. This indicate
that managers involvement in environmental engagements may then create agency problem
because their only objective is to maximize shareholders’ wealth. In this sense, managers may
mobilize the resources devoted to EP-improvement in other functions of the business to
improve company profitability. Furthermore, a company may need more financial resources
during the time of a crisis, and therefore these resources could be used as a slack to enable
company to recover faster from the situation (Linnenluecke, 2017). Thus, based on these views,

General Introduction
6
investors may see the environmental expenditures as an overinvestment which might not be
available for the company to make necessary expenditures during the time of distress. Hence,
investors may not give value to a company with high EP, therefore, the market value of
company may experience a severe loss and not recover faster relative to their peers with low
EP.
Second, as environmental elements have become a crucial issue for companies, and
stakeholders seem to be more and more sensitive to these elements (Flammer, 2013), then high
EP seems the only option to address these issues and adapt to the demanding conditions. If we
consider the natural-resource-based reputation view (Hart, 1995, Russo and Fouts, 1997), then
high EP seems improving the financial resilience of company. This view suggest that high EP
improves the reputation of being eco-friendly among the stakeholders and can gain competitive
advantage through the acquisition of rare, valuable, imperfectly imitable and non-substitutable
resources. Therefore, exploiting these advantages a company may attract investors more and
improve company market valuation, which will help companies when facing a financial shock
and will recover faster as compare to non-reputed companies. Considering the latent
environmental liability related to the carbon intensity of company (Clarkson et al., 2015,
Chapple et al., 2013, Clarkson et al., 2004), an adverse event may bring investors’ attention to
the cost of future emissions abatement or compliance with regulations. Thus, investors may not
invest in companies with higher latent environmental liabilities, therefore, a carbon-intensive
company may experience more loss in market value relative to environmentally performant
companies.
As organizational resilience addresses an organization’s reaction to a disturbance, we consider
the financial outcomes of companies in the face of three different adverse events. Furthermore,
we consider these disruptions with an aim to capture organizational resilience in two kinds of
situations, i.e. (1) a situation triggered by a major financial shock, and (2) a situation linked to

General Introduction
7
an environmental jolt. To examine the relationship in the first context, we assess the financial
resilience of companies to the global financial crisis of 2007. Concerning the environmental
side, we assess company’s resilience to environmental-regulatory and company-specific
environmental jolts caused by environmental controversies. Based on these situations, we raise
the following three research questions to address the central point of this thesis:
Research question 1: Does EP contribute to resilience in a general financial distress?
Research question 2: Does EP contribute to resilience in an environmental regulatory
distress?
Research question 3: Does EP contribute to resilience in a company specific
environmental distress?
Specifically, this thesis comprises four chapters. In first chapter, we present a brief overview
of our general research question, examining both EP and organizational resilience. We analyze
their theoretical and empirical literatures and discuss the financial implications for companies.
We then bridge their literatures, which leads us to consider more in detail the precise link
between EP and organizational resilience from a financial viewpoint. Building on this chapter,
we then introduce the avenues of research that are undertaken in the following chapters.
Chapter 2 investigates the relationship between EP and financial resilience in the context of a
situation of general financial adverse event. The financial implications of EP are vastly
discussed in academic debate, but, to our knowledge, no work is dedicated to examining its
impact on financial resilience, an unexplored aspect of financial performance. We thus fill this
gap in this chapter. Specifically, we conduct this analysis by assessing the financial resilience
of companies to the global subprime financial crisis of 2007, and measure resilience by the
time to recovery of firm’s market price to their pre-crisis level. We used the environmental

General Introduction
8
dimension’s data from Thomson Reuters Asset4 dataset to measure the EP of companies.
Performing the survival analysis over an international sample of 1,622 observations, our
finding reveals a challenging result for the existing literature since EP significantly increases
the time to recovery. Hence, EP seems detrimental to the financial resilience in the context of
general financial crisis. We found this result highly robust by considering the inclusion of
different control variables, different time windows, and alternative survival models. Digging
deeper, we find that the results are sensitive to the dimensions of EP and the country-level
environmental standards. Precisely, we find that EP is not detrimental to resilience for its
specific product innovation dimension, nor for companies in less environmentally oriented
countries.
In chapter 3, we aim to investigate the impact of EP on financial resilience in the context of a
situation demanding environmental legal requirements. We specifically consider the
environmental regulatory framework by assessing the financial resilience to a disruption caused
by the publication of verified emissions under the EU ETS. We thus measure companies’
financial resilience by the time to recovery of their market price to the day before the
publication. Various studies are conducted in this context and found a negative impact of these
publication on companies’ market valuation. However, they do not the address the afterwards
recovery and the influence of EP therein. We thus tackle this issue in chapter 3 of this thesis.
Using a sample of 424 unique firm covered under the EU ETS with 3,194 observations from
47 countries, we perform survival analysis to analyze the relationship by considering the first
12 years’ publications over a period from 2006 to 2017. Using the carbon emissions data from
Trucost dataset as a measure of company’s carbon intensity, we found a negative and
significant link between carbon intensity and the rate of recovery of firm’s market price. In line
with the natural resource based view (Hart, 1995, Russo and Fouts, 1997) and the environment-
as-a resources framework (Flammer, 2013), this result indicate that EP is beneficial for
General Introduction
9
company, which significantly improves the financial resilience of companies in the context of
an environmental regulatory framework. Moreover, we find the results highly robust by taking
into consideration different regression models, measures of resilience and carbon intensity,
control variables, and mitigating sample biasness towards countries. Furthermore, we find that
high EP is more beneficial if firm is in carbon-intensive industry, in the phases of EU ETS
where the carbon prices are high.
Finally, chapter 4 investigates the relationship in the context of company specific
environmental jolts, a disruption concerning environmental engagements. More specifically,
we examine the relationship by measuring financial resilience to a disruption caused by
company specific environmental controversies. Various event studies highlighted the negative
impact of environmental controversies on company’s market valuation, but still they do not
address what happens next, i.e. recovery after distress. To address this issue, we specifically
consider the two dimensions of resilience, such as stability dimension, measured by the severity
of loss in market value of firm, and the flexibility dimension, measured by time to recovery of
market value. Using an international dataset of 233 observations over the 2010-2016 period,
we applied survival analysis and ordinary least square (OLS) regression model to assess the
impact of EP on flexibility and stability dimensions of resilience, respectively. Using the
environmental dimension’s data from Thomson Reuters Asset4 dataset as a measure of EP, we
find that prior EP significantly reduces both the time to recovery and severity of loss. In the
context of company specific environmental jolts that demands environmental engagements,
this finding is coherent with the natural resource based view and environment-as-a-resource
framework, suggesting that prior EP significantly increases both the dimensions of financial
resilience to the shock caused by environmental controversies. We find these results robust to
the inclusion of different control variables, time windows, models and measures of resilience.
However, we find this relationship significant only in environmentally oriented countries, in

General Introduction
10
most polluting industries and for two of the dimensions of EP, i.e. emission reduction and
product innovation.
Overall, we find that EP weakens the financial resilience of companies in the context of global
financial crisis of 2007, whereas, it improves financial resilience in the context of
environmental regulatory (i.e. EU ETS) shocks and environmental controversies. This indicate
that the conditions of a situation moderate the impact of EP on resilience. As the first case is
purely related to the financial performance of companies, EP seems detrimental. Besides, the
latter two disruptions are related to environment and are demanding environmental
engagements from the companies. In this context, EP proves to beneficial for companies and
enhances their financial resilience.

11

12
Chapter 1. EP and company’s financial resilience
In this chapter, we first provide a brief overview of corporate environmental engagements and
their financial implications from theoretical and empirical framework in section 1.1. We then
introduce the organizational resilience in section 1.2. Specifically, we review the importance
of organizational resilience in a turbulent environment as well as we present its historical
overview and empirical review from management studies. Section 1.3 then discusses the
possible link between environmental performance (EP) and organizational resilience from a
financial viewpoint. More precisely, we bridge the streams of literature of both environmental
performance and financial resilience of companies in this section and introduce the avenues of
research that are undertaken in the following chapters.
1.1. Corporate environmental engagements
1.1.1. The growing environmental pressure
Hardly a day passes without news reports mentioning about investors, regulators or businesses
warning or acting on climate risk. Studies show that not only human activities are affecting the
climate, but climate change is also endangering human and business survival. Growth in world
economy poses major challenges for future generations. According to the projections of OECD
(2016), the global economic output will quadruple by 2050 than today and thereby will need
more energy. They estimate an 80% increase in the consumption of energy, mostly from the
fossil fuels. This indicate that the economic development will massively increase the
greenhouse gases emissions (GHG) and will worsen the problem of climate change. Thus, the
impact on human wellbeing cannot be reduced if the path of sustainable development is not
adopted (OECD, 2016).

Chapter 1. EP and company’s financial resilience
13
Among the human activities, firms and industries are the main contributor to GHG and affect
the natural resources. This topic has gained dramatical attention from the beginning of the
century. As evidenced in figure 1.1, the research publications related to climate risk is
increasing with an increasing rate. Eventually, this increase in environmental awareness has
brought the proactive role of companies in sustainability into the fore (Linnenluecke et al.,
2016). The increase in attention towards environmental issues has raised demand for
environmental-friendly business practices (Gadenne et al., 2009).
Figure 1.1: Number of research publications related to climate risk
Source: Dimensions3
Many stakeholders are influencing companies to adopt an effective environmental policy. On
numerous occasions international organizations got together for mainstreaming the growing
understanding of the urgency of sustainability issues, for instance Rio Earth Summit in 1992,
3 The purpose of figure 1.1 is to show a trend related climate change. The number of research publications are
obtained from Dimensions website by using some related keywords, i.e. “climate change”, “climate risk”, “global
warming”, and “environmental performance”. URL: https://app.dimensions.ai/discover/publication
0
50,000
100,000
150,000
200,000
250,000
300,000
350,000
400,000
450,000
1971 1974 1977 1980 1983 1986 1989 1992 1995 1998 2001 2004 2007 2010 2013 2016 2019

Chapter 1. EP and company’s financial resilience
14
the Millennium Summit in 2000, the World Summit on Sustainable Development in
Johannesburg in 2002, Paris agreement in 2015 (COP 21). As depicted in figure 1.2, the
timeline show that international communities are making efforts to bring the world together to
reduce the GHG emissions and establish environmental policies at national and international
level. While 195 nations agreed to combat climate change, the historical Paris COP 21
agreement is a milestone among international efforts that specifically focuses on the low-
carbon economy and green investments to make a resilient and sustainable future.
Consequently, major sustainable-finance related regulations are adopted by countries, forcing
companies to implement socially and environmentally friendly policies. The PRI (2019)’s
white paper reveal that the number of sustainable-finance related policies has been increased
with a prominent rate in the world’s 50 largest economies and almost 97% of the policies are
developed in this century. Environmental issues have thus become a crucial issue for
companies, and all the more because stakeholders seem to be more and more sensitive to these
elements (Flammer, 2013).
Figure 1.2: Climate change negotiations timeline
Source: European Parliament

Chapter 1. EP and company’s financial resilience
15
1.1.2. Financial implications of environmental engagements for firms
Even though companies’ environmental responsibility has recently gained more attention, this
topic is not novel in academic debate. Their financial implications are discussed in numerous
theoretical and empirical studies (Horváthová, 2010) but empirical results remain inconclusive.
Some studies find a negative link (Jaggi and Freedman, 1992, Lioui and Sharma, 2012, Jacobs
et al., 2010, Stanwick and Stanwick, 1998, Galema et al., 2008, Marsat and Williams, 2013)
while others show a positive one (Russo and Fouts, 1997, Konar and Cohen, 2001, Clarkson et
al., 2011, Guenster et al., 2011, Jo et al., 2014, King and Lenox, 2001, Flammer, 2013). Some
competing rationales are offered supporting this contrasting relationship.
The negative financial implication of environmental engagements can be rooted in the
neoclassical economists’ view, stemming from the seminal paper of Friedman (1970).
Friedman (1970) states that “the social responsibility of business is to increase its profits”.
Then, spending money on social-responsibility activities such as environmental protection
drains resources from the business that could be mobilized in the core or other functions of the
business to maximize shareholders wealth. In this vein, managers must focus on enhancing the
core functions, processes and capabilities of the business. Jensen (2001) argue that it would be
impossible for managers to try to achieve various goals simultaneously. While achieving
several objectives at the same time, i.e. financial and social, it may be difficult for shareholders
to monitor them. Thus, managers may exploit this opportunity and may pursue their own
interests. This may create an agency conflict and deviate managers from their goal of
maximizing shareholders’ wealth (Barnea and Rubin, 2010). Spending money on social
activities like the environment may give mangers the opportunity to improve their own
reputation (Barnea and Rubin, 2010), to entrench themselves (Jiraporn and Chintrakarn, 2013,

Chapter 1. EP and company’s financial resilience
16
Cespa and Cestone, 2007, Surroca and Tribó, 2008, Chahine et al., 2019) and to mitigate
control mechanisms (Surroca and Tribó, 2008, Fabrizi et al., 2014).
The neoclassical economists’ view is challenged, and some scholars argue that environmental
policies may on the contrary strengthen the financial position of businesses. For instance, the
stakeholder theory (Freeman, 1984) pinpoints the importance of multiple stakeholders in
business strategies and argue that “business should take into account all of those groups and
individuals that can affect, or are affected by, the accomplishment of organizational purpose”.
They demonstrate that many groups have stake in modern businesses which are very crucial
for the success of the business. Securing the interest of multiple stakeholders builds long-term
relations which improves the financial performance of business. This approach is further
supported by the instrumental version of stakeholders theory (Jones, 1995, Donaldson and
Preston, 1995), suggesting that building good stakeholder relations can give firms a
competitive advantage. Thus, managers can enhance stakeholders’ trust in the firm and
cooperation by creating value not only for shareholders but for all stakeholders.
The natural resource based view (NRBV) (Hart, 1995, Russo and Fouts, 1997), an extension
of the resource-based view theory (Wernerfelt, 1984, Barney, 1991), sees environmental
engagements a key resource for firms. The NRBV postulate that a proactive environmental
policy enhances both specific environmental capacities and firm’s reputation among
stakeholders by investing in environmentally-friendly technologies and processes. The
environmental policy requires redesign of a firm’s production and service delivery processes,
which is difficult to imitate by competitors. Hence, environmental engagements improve firm
reputation of being eco-friendly and can gain competitive advantage through the acquisition of
rare, valuable, imperfectly imitable and non-substitutable resources. Environmental

Chapter 1. EP and company’s financial resilience
17
engagements can then be seen as a key resource that is a source of sustainable competitive
advantage (Hart, 1995).
1.1.3. The EP-FP link: evidence from empirical studies
An extensive empirical literature has documented the EP-FP relationship using different
measures of EP and FP by applying different types of methodologies including portfolio, event
study and regression analysis. Since the theoretical framework postulates a potential positive
as well as a negative EP-FP link, empirical studies have also yielded mixed results (Endrikat
et al., 2014, Horváthová, 2010). Even though some studies could not find a positive link, the
tendency towards a positive relation is higher (Albertini, 2013, Dixon-Fowler et al., 2013,
Endrikat et al., 2014, Endrikat, 2016). For instance, Cohen et al. (1997) and Graves and
Waddock (1999) did not find any significant link, whereas, Jaggi and Freedman (1992), Fisher-
Vanden and Thorburn (2011), Jacobs et al. (2010), and Lioui and Sharma (2012) found a
negative EP-FP link despite using different measures of EP and FP. In a meta-analytic study,
Horváthová (2010) investigated the findings of 37 studies with a total of 64 outcomes of
regression analyses and portfolio studies. She finds a variation in the link between EP and FP
(35 show positive, 10 negative and 19 outcomes show insignificant link). This inconsistency
in results may arise from a heterogeneity in empirical methods (Horváthová, 2010), small
sample size and evaluation of EP (Konar and Cohen, 2001), moderating factors in the models
i.e. firm size and geographic location (Cohen et al., 1997), or the industry profile of firm (King
and Lenox, 2001).
On the contrary, other meta-analytic studies have assembled the cumulative results of a
substantial body of empirical work apparently showing a positive EP-FP link (Albertini, 2013,
Dixon-Fowler et al., 2013, Endrikat et al., 2014, Endrikat, 2016). Apart from the financial
benefits of EP, researchers have recently attributed EP to some other organizational outcomes

Chapter 1. EP and company’s financial resilience
18
as well. For instance, some studies reveal that environmental performant firms have easier
access to finance (Banerjee et al., 2019, Nandy and Lodh, 2012, Cheng et al., 2014) with a
lower cost of capital (Sharfman and Fernando, 2008, Heinkel et al., 2001, Gupta, 2018, Chava,
2014). Moreover, in an empirical study Dögl and Holtbrügge (2014) find that environmental
engagements seem to improve the environmental reputation of firm and positively influences
employees’ commitment. A recent literature has highlighted the insurance-like benefits of EP
(Godfrey et al., 2009). Environmental activities may help firm to build long-term relationships
with external stakeholders and reduce the risks associated with these relationships (Ambec and
Lanoie, 2008).
Stakeholders seem highly concerned about the impact of firm on the natural environment
(Flammer, 2013). Therefore, various event studies found an immediate and negative market
reaction to the disclosure of bad environmental news (Hamilton, 1995, Capelle-Blancard and
Laguna, 2010, Flammer, 2013, Krüger, 2015, Endrikat, 2016, Capelle-Blancard and Petit,
2019). These event studies suggest that stakeholders penalize the irresponsible behavior of
firms, such as damaging the natural environment. Various studies have now focused on the
long-run benefits of firm’s social activities in improving firm value through decreasing the
risks associated with a negative news (Peloza, 2006). Thus, environmental engagements may
be considered as a cost in short run, however, this may benefit the firm in long run by mitigating
the risk of firm value loss amidst a negative event in the future.
Furthermore, some studies consider the carbon intensity of companies as a latent environmental
liability in the case of stringent environmental regulation and/or more sensitivity of
stakeholders to the impact of company’s operations on natural environment (Clarkson et al.,
2015, Chapple et al., 2013, Clarkson et al., 2004). For example, carbon-intensive firms may
bear the cost of investing in less carbon-intensive technologies and processes to comply with

Chapter 1. EP and company’s financial resilience
19
regulations, or in the case of an emission trading scheme (ETS), company may choose to buy
allowances in the open market. In this vein, Chapple et al. (2013) found a decrease from 7% to
10% of market capitalization in the valuation of carbon-intensive firms after the
announcements of a proposed environmental regulation (i.e. ETS) in Australia. Clarkson et al.
(2004) claim that stringent environmental regulations significantly enhance firms’ production
costs, whereas market use emissions data, i.e. toxic release inventory data, to assess the latent
environmental liabilities of a company.
1.2. Organizational resilience overview
1.2.1. Firms and turbulent environments
Nowadays, unexpected events and sudden changes in the natural or financial environment are
frequently surprising organizations. Extreme events like natural disasters, terrorist attacks,
organizational controversies, and pandemic diseases (like the recent COVID-19) are frequently
disrupting supply chain and paralyzing the financial markets. Companies are facing more
challenges to survive and compete in this turbulent and continuously evolving marketplace.
The figure 1.3 shows that a numerous number of US firms filed for bankruptcy while not facing
a systematic financial crisis. However, the number of bankruptcies were multiplied by 3
between 2006 and 2009, highlighting the impact of the subprime crisis. In such challenging
conditions some companies are more successful and effectively thrive through these
challenging circumstances, as shown by Gittell et al. (2006) for US Airline companies after the
Sept. 11th 2001 terrorist attack in the US. Resilience studies precisely analyze how companies
manage to survive and compete after such a shock, and the determinants that allow some
organizations to successfully adjust and thrive while others fail amidst these conditions
(Linnenluecke, 2017).

Chapter 1. EP and company’s financial resilience
20
Figure 1.3: Annual number of business bankruptcy cases filed in the United States
For Richtnér and Löfsten (2014), “companies’ success depends on resilience”. Moreover,
DesJardine et al. (2017) argue that resilience is crucial for company’s sustainability as it
improves their capacity to persist and adapt to environmental changes. Resilience is the
capacity of a system to return to a stable state after an exogenous shock (Bhamra et al., 2011).
Usually resilience is viewed as a desirable characteristic of an organization and its employees
that enable them to deal with adverse events (Linnenluecke, 2017). Thus, a resilient
organization may have the ability to thrive and continue its operations during a turbulent and
challenging environment. Resilient organization has the ability to cope easily with different
anomalies and continuously improving their capabilities and learnings (Vogus and Sutcliffe,
2007).
1.2.2. The concept of resilience
Being a multidisciplinary concept, resilience has been originally used in different fields of
studies. For instance, DesJardine et al. (2017) endorsed resilience to the field of ecology,
whereas, Richtnér and Löfsten (2014) attribute it to psychology. The term resilience initially
appeared in the article of Maxwell (1865) investigating the electromagnetic fields and then
used by Hulsen (1896) discussing the properties of bones in health sciences (Collins, 2015).
0
10,000
20,000
30,000
40,000
50,000
60,000
70,000
2000 2001 2002 2003 2004 2005 2006 2007 2008 2009 2010 2011 2012 2013 2014 2015 2016 2017 2018 2019
Num
ber
of
case
s fi
led
Number of business bankruptcy cases filed Sorce: US courts © Statista

Chapter 1. EP and company’s financial resilience
21
Later, the term resilience spread among other fields as well. For instance, Drabble et al. (1907)
used the term resilience in biological sciences for describing the resistance of cells to stretching.
In ecology, resilience is used to investigate the response of ecological systems to exogenous
disruptions (MacArthur, 1955, Berkes et al., 2000, Folke et al., 2002). In psychology, resilience
is attributed to human recovery from stress, for instance by Rutter (1987), Bolig and Weddle
(1988). In the field of engineering, resilience is referred to the capability of a structure’s
recovery from or to withstand a natural disaster (Pimm and Pimm, 1991, Hollnagel et al., 2006).
In economics, Reinhart and Rogoff (2014), Ambrosius (2017) employed the concept of
resilience to analyze the recovery of country’s economy from recessions. As resilience is
applicable in different disciplines, such as natural and social sciences, this concept can help to
deal with some important cross-disciplinary issues, such as sustainable development
(DesJardine et al., 2017).
Various conceptual studies have provided the framework of resilience in the field of business
and management. Its application in management studies, however, is still scarce (Vogus and
Sutcliffe, 2007, Linnenluecke, 2017). As resilience is a latent variable and cannot be observed
directly at organization level (DesJardine et al., 2017), empirical studies have inferred
resilience to different indicators to assess stability and/or flexibility in the financial outcomes
of an organization, such as a firm’s market price recovery from an environmental shock (Gittell
et al., 2006), change in sales growth after a shock (Ortiz-de-Mandojana and Bansal, 2016),
severity of market price loss and duration of market price recovery after a crisis (DesJardine et
al., 2017).
While measuring the financial resilience of companies, DesJardine et al. (2017) adopted a
definition developed by Gunderson and Pritchard (2002), stating that resilience is “both the
ability of a system to persist despite disruptions and the ability to regenerate and maintain
Chapter 1. EP and company’s financial resilience
22
existing organization”. In an empirical study, Ortiz-de-Mandojana and Bansal (2016) defined
resilience as “the ability of firms to sense and correct maladaptive tendencies and cope
positively with unexpected situations”. At organization level, Vogus and Sutcliffe (2007)
define resilience as “the maintenance of positive adjustment under challenging conditions such
that the organization emerges from those conditions strengthened and more resourceful”.
1.2.3. Organizational resilience: main empirical studies
Numerous conceptual studies have focused on organizational resilience framework, for
instance Klibi et al. (2010), Pettit et al. (2010), Ponomarov and Holcomb (2009), Sheffi and
Rice Jr (2005). However, very few empirical studies have considered this organizational
outcome. In the following subsections, we discuss some empirical studies, as summarized in
table 1.1, that documented the role of some organizational attributes in building financial
resilience.
1.2.3.1. Gittell et al. (2006) study of resilience: airplane companies after the
September 11th, 2001 attack
Gittell et al. (2006) investigate the response of ten US-based major airlines to 9/11 terrorist
attacks. The authors examined the impact of pre-crisis (i.e. September 10th) financial reserves,
such as debt-to-equity ratio and days of cash on hand, and business models, i.e. unit cost per
available seat mile, on post-crisis employees’ layoffs and market price recovery of airlines.
They measured quarterly performance recovery by taking the percentage of market price to the
pre-crisis level of each company over a period from December 10, 2001 through September
10, 2005, and layoffs by taking percentage of post-crisis employees laid off to pre-crisis level.
Their findings show that the airline industry experienced a severe decline in their market
valuation after the crisis, whereas, they observed a variation in the performance recovery of

Chapter 1. EP and company’s financial resilience
23
sample firms. In their sample, Southwest and Alaska Airlines were the fastest with an average
recovery of around 92% and 88% of their market price over the sample period of 4 years. At
the same time, United Airlines and US Airways were the slowest with an average recovery of
12% and 23% of their market prices, respectively. On average, the industry laid off around
16% of their employees after the event, while the US Airways and United Airlines were the
companies with highest level of layoffs i.e. 25% and 20%, respectively. This may be because
these companies had the lowest level of pre-crisis financial reserve (days of cash on hand)
relative to their peers. On the other hand, Southwest and Alaska Airlines did not lay off and
had the highest level of financial reserves relative to their peers.
Using Spearman’s rank order correlations, the authors find that low cost business models and
financial reserves are negatively related to layoffs, whereas, more layoffs show a negative
relationship with the performance recovery of companies. Through an in-depth analysis, they
assert that organization need to build up a viable business model that increases the level of
financial reserves, so that these resources can be utilized during crisis to retain their employees
and establish strong relationships with them in order to recover faster from an adverse situation.
1.2.3.2. CSR and financial resilience: the study of Ortiz-de-Mandojana and Bansal
(2016)
Ortiz-de-Mandojana and Bansal (2016) study the collective contribution of company’s social
and environmental practices (SEPs) to organizational resilience. Though, their study is based
on a long-term approach rather than focusing on a single environmental shock, one of their
method, i.e. comparing the failure rates of companies in the sample period, may be relevant to
organizational resilience. The authors applied a matched-pair analysis to compare the
performance of treated group, firms with high SEPs from KLD 400, with a control group. To
identify the candidates of the control group, they applied propensity score matching technique

Chapter 1. EP and company’s financial resilience
24
by considering firm’s total assets, net sales, return on assets, return on equity, and return on
sales.
By taking 121 pairs of matched companies over a period 1994-2008, the authors compared the
financial volatility, sales growth, and survival rates. Financial volatility for each year is
measured by taking the standard deviations of monthly market returns. The authors considered
the long-term growth by accumulating the growth in sales over the sample period. Survival is
measured by the survival rates through a survival model, i.e. Cox (1972), which considers if a
firm is failed or not in the sample period and its duration of survival. By applying matched-
pairs t-test and repeated ANOVA test, the authors observed a low financial volatility, higher
growth, and rates of survival of firms with high SEPs. Furthermore, they did not find a
significant evidence in support of a hypothesis that postulates that firms with high SEPs have
lower profitability over the short-term; lower profitability is measured by change in return over
assets between two consecutive years. The authors argue that high SEPs enable firms to cope
with shocks and keep them on their desired state, thus showing less volatility and high stability.
Furthermore, they argue that SEPs help companies to attract more customers that adds to their
growth.
1.2.3.3. CSR and financial resilience after the subprime crisis : DesJardine et al.
(2017)
DesJardine et al. (2017) also examined the contribution of social and environmental practices
to organizational resilience but in the aftermath of the subprime crisis of 2007. The authors
discriminate these CSR practices in two categories, labelled as strategical and tactical practices.
Strategic SEPs include practices that are embedded within an organization. They measure these
practices by “the sum of firm’s strengths from KLD database in categories of environment,
diversity, employee relations, human rights, product quality and safety, and corporate

Chapter 1. EP and company’s financial resilience
25
governance”. Besides, tactical SEPs represent philanthropic contributions of firm that do not
require a substantial adjustment in an organizational structure. The authors also took tactical
practices from KLD database, by taking the “sum of firm’s strengths in the community domain
that include charitable giving strength, innovative giving, non-U.S. charitable giving, support
for housing, support for education, volunteer programs, and other strengths”.
The authors considered the stability, measured by the severity of loss in firm value, and
flexibility, measured by the time to recovery of firm value, as the two financial dimensions of
organizational resilience. They employed the two-stage least squares and Cox PH models to
investigate the impact of SEPs on stability and flexibility of 963 U.S.-based firms. The authors
find that strategic SEPs improve both the stability and flexibility dimensions of resilience in
face of the subprime crisis. They also postulate that tactical SEPs improves the financial
flexibility of firm, although less important, but they could not find a significant evidence in
support of this hypothesis. The authors argue that tactical practices do not create
interdependencies among organizational system relative to strategic practices, and that,
therefore, strategic practices contribute more to organizational resilience that enable them to
cope with a financial shock.
Overall, we can notice that research on the impact of CSR practices on financial resilience are,
as far as we know, still scarce. Ortiz-de-Mandojana and Bansal (2016) and DesJardine et al.
(2017) have so far examined the collective contribution of social and environmental practices
as determinants of resilience. However, no attention has been precisely dedicated to the
environmental dimension’s contribution. Since there is a growing societal concern in
environmental issues (Flammer, 2013), we believe that studying the impact of environmental
performance on resilience is of particular interest.

Chapter 1. EP and company’s financial resilience
26
Table 1.1: Empirical studies on financial resilience
Research article Research question Main methodology Main results Rationale
Gittell et al. (2006)
The contribution of pre-9/11
viable business model and
financial resources to forgo
layoffs and encourage recovery
of airlines after the 9/11 attacks
Models: Univariate and Random effect regressions
Sample: US based 10 major airline companies
Variables:
Recovery: percentage of market price to its pre-crisis level
Layoffs: percentage of post-crisis employees laid off to pre-
crisis level
Business model: unit cost per available seat mile
Financial reserves: debt-to-equity ratio and days of cash on
hand
Both low cost business model
and financial reserves enabled
airlines to forgo layoffs and
recover more quickly.
A viable business model enriches the
level of financial reserves. These
resources can be utilized during a
crisis to retain their employees and
establish strong relationships with
them. That enables companies to
recover faster from an adverse
situation
Ortiz-de-Mandojana
and Bansal (2016)
The contribution of company’s
social and environmental
practices (SEPs) collectively to
organizational resilience
Model: matched-pair analysis (121 pairs) - comparing the
performance of treated group with a control group over a
period 1994-2008
Sample: Treated group - firms with high SEPs from KLD
400.
Control group selected through propensity score matching
technique based on some financial indicators of companies
Variables for comparison:
Financial volatility, sales growth, and survival rates (through
Cox Model) of companies
Firms with high SEPs show
low financial volatility, higher
sales growth and higher rates of
survival
The authors argue that high SEPs
build resources and capabilities that
enable them to cope with shocks and
keep them on their desired state, thus
companies with high SEPs show less
volatility and high stability.
Furthermore, SEPs help companies to
attract more customers that adds to
their growth
DesJardine et al.
(2017)
The contribution of strategic
versus tactical social and
environmental practices (SEPs)
to organizational resilience in
the aftermath of global
financial crisis of 2007
Models: 2SLS and survival analysis
Sample: 963 US-based firms
Variables
Stability dimension of resilience: Severity of loss in firm
value
Flexibility dimension of resilience: Time to recovery of firm
value to its pre-crisis level
Strategic SEPs: sum of “strengths in the domains of
environment, diversity, employee relations, human rights,
product quality and safety, and corporate governance” from
KLD database
Tactical SEPs: Sum of “strengths in the domain of community
development” from KLD database
Strategic SEPs improve both
the stability and flexibility
dimensions of resilience in face
of general environmental
disturbance
Strategic SEPs establish
interdependencies among the
organizational system and the broader
social and environmental systems in
which the organization is embedded,
that improves stability and flexibility
in the face general environmental
disturbance

Chapter 1. EP and company’s financial resilience
27
1.3. The nexus between EP and resilience
1.3.1. Bridging EP and resilience
Although the EP literature is vast but still seems inconclusive (Horváthová, 2010), and
organizational resilience literature is growing (Linnenluecke, 2017), no one to our knowledge
has bridged these streams of literature to analyze the precise link between EP and resilience.
The growing concerns about climate change have imposed a substantial pressure on companies
to adopt an effective environmentally-focused policy, because stakeholders seems more
sensitive to these elements (Flammer, 2013). Facing mounting pressure, environmental
obligations have thus become a key player in companies strategies (Rugman and Verbeke,
1998).
At the same time, companies are facing challenges to survive and compete in a turbulent and
continuously evolving marketplace. Besides the systematic financial crises, the effects of
climate change, such as extreme weather conditions, natural disasters and hurricanes, high
reaction to environmental controversies, are frequently disrupting supply chain and paralyzing
the financial markets. In reaction, environmental regulations and technological advancements
are also impairing the assets of some companies (Linnenluecke et al., 2016).
The importance of these issues for companies then leads us to bridge the literature of EP and
resilience together to answer the question whether corporate environmental policies are
moderating the financial consequences of an adverse situation.
1.3.2. EP and financial resilience: theoretical framework
If we consider the neo-classical economists view, for instance Friedman (1970), EP seems to
mitigate the capacity of companies to cope with adversities. This view suggests that
discretionary efforts towards EP-improvement may reduce companies’ profits, and thus

Chapter 1. EP and company’s financial resilience
28
diverting managers from their only goal of maximizing shareholders’ wealth. The financial
resources devoted to social or environmental activities could be mobilized in the core or other
activities of the business to improve company profitability. Furthermore, these resources could
be utilized as slack during the time of adversity to recover faster (Linnenluecke, 2017). For
instance, Gittell et al. (2006) observed a quick financial recovery from a crisis of firms with
sufficient financial resources that were utilized to retain their employees and established good
relations with them. Similarly, Buchanan et al. (2018) referred spending on social activities as
overinvestment, since they found more loss in the value of high-CSR firms during financial
crisis. This stream of literature argues that environmental expenditures deteriorates the
financial position of companies, therefore, firm may experience more difficulties to bounce
back to routine business due to lack of financial resource during a crisis.
On the contrary, other scholars have highlighted various benefits of EP that may help
companies to recover faster from an adverse situation. For instance, Ambec and Lanoie (2008)
argue that EP seems to improve companies relations with their external stakeholders. As
instrumental stakeholder theory (Jones, 1995, Donaldson and Preston, 1995) argue that good
relations with stakeholders is a source of competitive advantage, then environmentally-
performant company may attract stakeholders support (Lins et al., 2017). Exploiting this
advantage in a time of need may enable firms to recover faster from adverse situation. Besides,
the natural resource based view (Hart, 1995, Russo and Fouts, 1997) specifically attributes EP
to a source of reputation, therefore, investors may prefer environmentally reputed companies
relative to non-reputed companies facing a same kind of adversity. Moreover, EP may be a
source of skills and capacities that may help firm to adapt to demanding conditions. Thus,
environmentally performant company may not face severe loss in value if investors prefer to
invest in them and are more confident in their abilities to cope with the situation.

Chapter 1. EP and company’s financial resilience
29
1.3.3. Conclusion: avenues of research
Organizational resilience addresses the reaction and adaptability of an organization to an
adverse situation, but businesses are facing different kinds of exogenous and endogenous
adversities. In the following chapters, we conduct empirical analyses to investigate the
relationship through three different dimensions of adversity for observing the financial
resilience of companies. We specifically study the impact of a systematic financial crisis,
regulatory and company specific environmental disruptions. We focus on these situations with
an aim to capture the contribution of EP to resilience observed against a general financial crisis
as well as the adversity caused by new regulations, and company’s specific environmental jolts.
In chapter 2, we capitalize on DesJardine et al. (2017) to observe the resilience of companies
against the global financial crisis of 2007. This crisis originated in the USA due to the subprime
mortgages. The event spread around the world and caused a substantial decline in financial
market, and consequently in the market valuation of listed companies. While the crisis was
very severe which caused a decline of more than 54% in the S&P index until February 2009
(Bartram and Bodnar, 2009), some companies did not experience a severe loss and recovered
faster relative to their peers. Simultaneously, environmental awareness is dramatically higher,
and the proactive role of firms in sustainability has increasingly been brought to the fore. Firms
have been encouraged to implement environmentally friendly policies to address climate
change and environmental issues, mitigate the economic impact on the environment, and
develop eco-efficiencies (Linnenluecke et al., 2016, Banerjee et al., 2019). Therefore,
stakeholders seem more and more sensitive to the EP of companies (Flammer, 2013).
However, it is not clear whether the environmental claims and general financial turbulences
are imposing contradictory pressures on companies and, to our knowledge, no study has
investigated the precise link between EP and resilience in the context of a global financial

Chapter 1. EP and company’s financial resilience
30
crisis. Though, DesJardine et al. (2017) examined the collective contribution of CSR to
financial resilience in this context, their approach does not however specifically disentangle
EP from other CSR practices. We thus fill this gap by investigating a precise link between EP
and resilience in the context of a global financial crisis. As Laeven and Valencia (2018)
identified that a 72% of 151 banking crisis over a period of 1945-1971 occurred after 1990, the
frequency of financial crises is increased in recent decades. Therefore, the investigation of the
EP-resilience link may provide some useful insights to concerned parties to address the issues
related to companies’ environmental obligations as well as dealing with more frequent general
financial turbulences.
Besides, previous studies show that regulations may create constraints for companies and
negatively affect their profitability (Clarkson et al., 2015, Chapple et al., 2013, Manchiraju and
Rajgopal, 2017, Palmer et al., 1995). This scenario gives us the opportunity to investigate
whether EP mitigates the negative impact of a regulatory obligation and enable company to
recover faster. In chapter 3, we thus specifically focus on company’s resilience against a
financial shock triggered by the publication of verified emissions, a regulatory requirement
under the European Union’s Emission Trading Scheme (EU ETS). Various studies show that
the disclosure of this emissions information negatively affect the valuation of covered
companies, for instance Brouwers et al. (2016), Clarkson et al. (2015), Jong et al. (2014). The
findings of these studies show a decline in firm value after the disclosure of emissions data,
which seems relevant to the stability dimension of resilience; however, they do not address the
flexibility dimension, i.e. recovery from crisis. It is important to investigate this organizational
outcome in regulatory upheavals, because it is crucial for firm’s sustainability which captures
firm’s capacity to thrive and adapt to environmental changes (DesJardine et al., 2017, Ortiz-
de-Mandojana and Bansal, 2016).

Chapter 1. EP and company’s financial resilience
31
Investors seem like more sensitive to the long-term impact of the EU ETS (Jong et al., 2014)
because the EU ETS is demanding eco-efficiency from companies. Thus, it may bring
investors’ attention to the environmental policy of firms. While the EU ETS is increasing
demand for EP as well as causing an environmental disturbance after the publication of verified
emissions, one may wonder if these two mounting pressures are not contradictory for
companies. To our knowledge, no study is however dedicated to examining whether EP
moderates the adverse consequences of EU ETS, i.e. companies’ recovery from disturbance
triggered by the publication of verified emissions. We thus contribute to the literature by
examining a specific link between EP and firm’s financial flexibility against the shock triggered
by the publication of verified emissions under the EU ETS. This will help us to understand
whether carbon-efficient practices help companies to survive and compete in this challenging
environment. Since the ETS around the world is currently covering only 15% of the global
emissions and it is spreading to more and more countries (ICAP, 2018), the implications of this
study may also be important for companies based in other countries that have planned to
introduce the ETS in future. This will provide a guidance to concerned parties for managing
the risks associated with the ETS and preparing themselves in advance.
As companies are continuously under the media spotlight and the environmental impact of their
operations are attracting investors’ attention (Aouadi and Marsat, 2016), prior research show
that the release of company related negative news, for example environmental controversies,
negatively affects their market valuation (Capelle-Blancard and Petit, 2019, Krüger, 2015,
Flammer, 2013, Capelle-Blancard and Laguna, 2010, Hamilton, 1995, Endrikat, 2016).
Environmental controversies, as negative news stories related to the environmental impact of
the firm’s operations, are therefore of paramount importance for companies’ image and
reputation, that may involve important costs since investors appears increasingly sensitive to
environmental issues. Previous event studies have so far provided a negative indication in the
Chapter 1. EP and company’s financial resilience
32
market valuation of company after a controversy. However, they do not answer the question of
what happens next. We then wonder whether prior EP helps firm value to bounce back.
The importance of these issues for companies then leads us to ask whether EP is moderating
the adverse consequences of environmental controversies. In chapter 4, we thus examine the
link between EP and financial resilience against company specific environmental jolts.
Following DesJardine et al. (2017), we precisely investigate this relationship by disentangling
resilience into its two dimensions, i.e. financial stability and flexibility. As EP is attributed to
the so-called insurance-like effect in case of negative events (Godfrey et al., 2009), we
investigate whether EP also possess the resilience-like effect in this context.
Taking together, we thus test the relationship in three different dimensions of resilience amidst
two kinds of shocks. In the first essay, we test the relationship while company is facing general
financial turbulence, whereas, the second and third essay consider the environmental
dimension, through the claims of stakeholders in the form of environmental regulations and
reaction to environmental controversies.

33
34
Chapter 2. Is there a trade-off between environmental performance and
financial resilience? International evidence from the subprime crisis
Abstract
Companies now face mounting pressure to be environmentally active and involved, yet they
simultaneously have to cope with more and more frequent financial crises. Whether
environmental performance (EP) improves or mitigates the resilience of a firm when
confronted with a financial shock is then of particular importance, yet not explored to our
knowledge. On the one hand, EP may benefit companies and help them to recover more rapidly
from a financial shock as a result of higher stakeholder support; on the other, however, EP can
be viewed as a waste of financial resources, and may therefore reduce a firm’s financial
resilience. Using Thomson Reuters Asset4 environmental data as a proxy for firms’ EP, we
perform a survival analysis on an international dataset of 1,622 firms in the aftermath of the
subprime crisis. We find evidence that high pre-crisis EP significantly reduces the likelihood
of a firm’s market price recovery, suggesting that EP appears as an organizational constraint
that limits the ability of firms to be financially resilient. This challenging result is robust to
various time windows and survival models. EP is, however, not always detrimental since the
specific product innovation dimension of EP does not reduce a firm’s financial resilience.
Moreover, in less environmentally oriented countries, EP does not negatively influence a firm’s
financial resilience. In these two settings, we argue that the cost-benefit of EP on resilience
seems to be more balanced.
Keywords: Environmental Performance; Resilience; Subprime Crisis; Financial Markets;
Firm Value
JEL Classification: G01, M14, O16, Q51

Chapter 2. Trade-off between EP and financial resilience to global financial crisis
35
2.1. Introduction
In recent decades, companies have faced more and more frequent financial crises (Bordo et al.,
2001, Laeven and Valencia, 2018). Bordo et al. (2001) observed that crisis frequency doubled
in the 1973-1997 period compared to the 1945-1971 period. In addition, 72% of the 151
banking crises identified by Laeven and Valencia (2018) for the period 1970-2017 took place
after 1990. Recently, the global financial crisis triggered by US subprime mortgages led to a
substantial decline in all financial markets, and consequently in the market valuation of listed
companies. Indeed, the S&P 500 index fell by 54.1% between September 2007 and February
2009 (Bartram and Bodnar, 2009). Simultaneously, environmental awareness dramatically
increased, and the proactive role of firms in sustainability has increasingly been brought to the
fore. Firms have been encouraged to implement environmentally friendly policies to address
climate change and environmental issues and mitigate their economic impact on the
environment (Linnenluecke et al., 2016, Banerjee et al., 2019, Siegrist et al., 2020). At an
international level, institutions such as the World Business Council for Sustainable
Development or the Conferences of Parties (COP) strongly support such practices (Bazillier et
al., 2017). Environmental issues have thus become a crucial issue for companies, and all the
more because stakeholders seem to be more and more sensitive to these elements (Flammer,
2013).
Facing both environmental claims and financial turbulence, one can wonder if these two
mounting pressures are not contradictory for firms. More specifically, it is not clear to what
extent the environmental policies implemented by a firm penalize or help them during a
financial crisis. To our knowledge, no study has tackled this important issue so far. We thus
propose to fill this gap by studying the relationship between environmental performance (EP)
and a firm’s financial resilience in the specific context of the subprime crisis. The concept of

Chapter 2. Trade-off between EP and financial resilience to global financial crisis
36
resilience, originally issued from ecology, is now popular in the fields of crisis management
and organization studies (DesJardine et al., 2017, Linnenluecke, 2017). Resilience can be
defined as “the firm’s ability to sense and correct maladaptive tendencies and cope positively
with unexpected situations” (Ortiz-de-Mandojana and Bansal, 2016). Because it enables firms
to adapt to environmental changes and survive longer, resilience is a crucial and desirable
characteristic of a business. More resilient organizations are considered to have a sustainable
competitive advantage over peers (Teixeira and Werther, 2013). This aspect of financial
performance is all the more relevant in a context where financial and banking crises are
increasingly recurrent.
According to the resource-based view (RBV) theory (Wernerfelt, 1984, Barney, 1991),
environmental policies can lead to a higher stakeholder commitment from non-financial
stakeholders (customers, employees, communities, etc.) who are concerned about the
environment (Russo and Fouts, 1997, Hart, 1995). Hence, during a crisis period, this higher
level of support can be helpful in recovering from a crisis. However, in such a period, it is also
possible that shareholders are less likely to invest in environmentally friendly firms since
environmental policies can be linked with overinvestment concerns and agency problems
(Buchanan et al., 2018). Thus, it clearly appears that the relationship between EP and resilience
is theoretically ambiguous, and needs empirical investigation.
After adjustment for missing data, the relationship between EP and resilience is analyzed using
a sample of 1,622 firms from 30 different countries. Our survival analysis reveals a challenging
result for the existing literature since EP significantly increases time to recovery, hence
reducing a firm’s financial resilience. This result is robust even taking into consideration the
inclusion of various control variables and different time periods, and is not affected by
alternative survival models. The result proves to be sensitive to EP dimension and country

Chapter 2. Trade-off between EP and financial resilience to global financial crisis
37
environmental orientation. More precisely, the impact of EP on resilience is not significant for
the specific product innovation dimension, nor in less environmentally oriented countries. EP
in these conditions does not therefore impede a firm’s recovery from a financial shock.
Our contribution to the literature is threefold. First, this study aims to contribute to the literature
on the impact of environmental policies on firm value by studying the impact of EP on an
unexplored aspect of financial performance. Although the link between EP and financial
resilience is currently of particular importance for both managers and investors given the
increasing occurrence of financial crises, no study has previously tackled this relationship. In
a context where crises are becoming more frequent, it is indeed essential for firms to recover
as quickly as possible from a financial shock. If DesJardine et al. (2017) study the impact of
tactical and strategic corporate social responsibility (henceforth CSR) commitment on firms'
resilience, their approach does not however specifically disentangle EP from other CSR
policies. Second, even if the effect of EP on the value of firms has been widely discussed in
theoretical and empirical studies, the empirical results remain inconclusive. Most papers find
a positive impact (Guenster et al., 2011, Flammer, 2013) while other articles show a negative
one (Jacobs et al., 2010, Galema et al., 2008). These contradictory results may come from an
endogeneity problem that makes it difficult to assess the impact of EP on financial performance
(FP). We contribute to the literature by investigating the question from a new perspective.
Studying the effect of EP on firm value around the subprime crisis allows us to avoid the
potential endogeneity problem between environmental performance and financial performance
(Buchanan et al., 2018). Following Lins et al. (2013) and Buchanan et al. (2018), we argue that
the subprime crisis is an exogenous shock that has an impact on a firms’ market value, without
having an impact on environmental performance in the short run. Moreover, the subprime crisis
is a particularly appropriate context to see whether environmental policies are associated with

Chapter 2. Trade-off between EP and financial resilience to global financial crisis
38
higher costs and agency concerns since this crisis has exacerbated these problems (Buchanan
et al., 2018, Lins et al., 2013). Third, we find robust and challenging results for the EP-FP
literature in the context of financial crises. Whereas the majority of studies document a positive
financial impact of EP (Horváthová, 2010), we find evidence that the overall EP significantly
reduced financial resilience during the specific subprime crisis. However, we show that EP is
not always detrimental to financial resilience. In particular, firm involvement in product
innovation does not reduce firm resilience, nor the EP engagement in countries with low
environmental legislation. These results are stimulating and, we believe, of particular
importance for both corporate managers and portfolio managers.
The remainder of this paper is organized as follows. The second section presents the
hypotheses. The third section describes the data and method used. The fourth section is
dedicated to our empirical results. The last section concludes.
2.2. Hypotheses
The aim of this paper is to study whether the implementation of environmental policies help
firms during a crisis period. We thus propose to bring a new insight to the financial impact of
EP by examining the relationship between EP and financial resilience. Two different
perspectives shed light on how environmental performance may influence the way companies
suffer from a financial crisis. From one perspective, the RBV theory (Wernerfelt, 1984, Barney,
1991) argues that EP may have a positive impact on financial resilience. The main idea of this
theory is that firms may have competitive advantages by acquiring strategic resources that are
valuable, rare, inimitable and non-substitutable. Firms can implement profitable strategies by
mobilizing resources that enable them to exploit external opportunities or to mitigate threats
(Barney, 1995, Russo and Fouts, 1997). These resources can be tangible such as financial or
physical assets, intangible assets like such as reputation, human resources or organizational

Chapter 2. Trade-off between EP and financial resilience to global financial crisis
39
capabilities, and “personnel-based” such as corporate culture, employees’ skills and
involvement (Grant, 1991, Russo and Fouts, 1997).
Numerous papers have mobilized RBV theory to conceptualize the relationship between EP
and financial performance (Branco and Rodrigues, 2006). Applying the RBV theory to the
understanding of corporate environmental strategies, Hart (1995) developed a natural-resource-
based-view of the firm, which is an RBV theory extension including constraints relating to the
natural environment. This author suggests that firms implementing different environmental
strategies linked to pollution prevention, product stewardship and sustainable development can
acquire competitive advantages. For instance, firms setting up policies aiming at preventing
pollution can acquire competitive advantages by reducing pollution costs and by increasing
productivity thanks to the redesign of their production processes and the use of more efficient
technology (Russo and Fouts, 1997). In addition, firms may acquire new capabilities by taking
into account stakeholders’ claims in their product design and development processes (Hart,
1995). Such environmental policies can increase customers’ loyalty and employees’
commitment, and generate a higher reputation and strong support among customers,
employees, suppliers, communities and others stakeholders who are concerned about the
environment (Russo and Fouts, 1997). Environmental strategies thus involve a shift in
corporate culture and organizational capabilities (Branco and Rodrigues, 2006). These policies
help firms to develop better analytical skills and processes, and increase employees’
commitment that in turn enhances the firms’ ability to adapt to external changes, including
crises (Orlitzky et al., 2003, Russo and Fouts, 1997).
Capitalizing on the idea that CSR policies allow firms to strengthen stakeholders’ commitment,
Lins et al. (2017) found that CSR investments are more valuable during a period of crisis. When
the general level of trust in firms is low, stakeholders consider that high-CSR firms are more
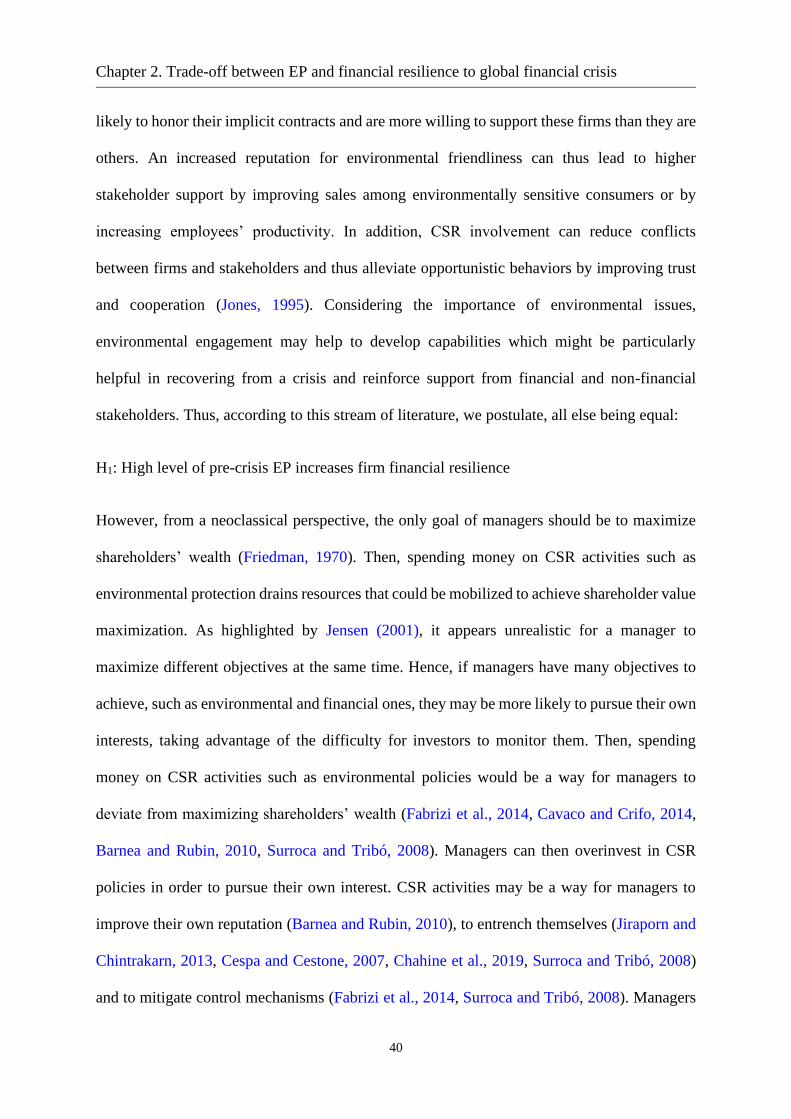
Chapter 2. Trade-off between EP and financial resilience to global financial crisis
40
likely to honor their implicit contracts and are more willing to support these firms than they are
others. An increased reputation for environmental friendliness can thus lead to higher
stakeholder support by improving sales among environmentally sensitive consumers or by
increasing employees’ productivity. In addition, CSR involvement can reduce conflicts
between firms and stakeholders and thus alleviate opportunistic behaviors by improving trust
and cooperation (Jones, 1995). Considering the importance of environmental issues,
environmental engagement may help to develop capabilities which might be particularly
helpful in recovering from a crisis and reinforce support from financial and non-financial
stakeholders. Thus, according to this stream of literature, we postulate, all else being equal:
H1: High level of pre-crisis EP increases firm financial resilience
However, from a neoclassical perspective, the only goal of managers should be to maximize
shareholders’ wealth (Friedman, 1970). Then, spending money on CSR activities such as
environmental protection drains resources that could be mobilized to achieve shareholder value
maximization. As highlighted by Jensen (2001), it appears unrealistic for a manager to
maximize different objectives at the same time. Hence, if managers have many objectives to
achieve, such as environmental and financial ones, they may be more likely to pursue their own
interests, taking advantage of the difficulty for investors to monitor them. Then, spending
money on CSR activities such as environmental policies would be a way for managers to
deviate from maximizing shareholders’ wealth (Fabrizi et al., 2014, Cavaco and Crifo, 2014,
Barnea and Rubin, 2010, Surroca and Tribó, 2008). Managers can then overinvest in CSR
policies in order to pursue their own interest. CSR activities may be a way for managers to
improve their own reputation (Barnea and Rubin, 2010), to entrench themselves (Jiraporn and
Chintrakarn, 2013, Cespa and Cestone, 2007, Chahine et al., 2019, Surroca and Tribó, 2008)
and to mitigate control mechanisms (Fabrizi et al., 2014, Surroca and Tribó, 2008). Managers

Chapter 2. Trade-off between EP and financial resilience to global financial crisis
41
can seek to increase their own power within firms by gaining stakeholders’ support thanks to
a high CSR involvement. Concerning more specifically environmental policies, their
implementation can also be explained by a warm-glow motivation instead of financial concern
(Barnea and Rubin, 2010).
Following this stream of research, environmental policies can be a way for managers to extract
private benefits, and not to increase shareholders’ wealth. Costs incurred by environmental
policies may detrimentally mobilize financial resources that could be used during the time of
crisis. Buchanan et al. (2018) explain that agency problems were higher during the subprime
crisis since “firm financial resources become more valuable and the expected return on
investment falls”. Thus, the subprime crisis has amplified overinvestment concerns, and thus
the costs induced by CSR policies (Buchanan et al., 2018). Consistent with this hypothesis,
they show that the value of high CSR firms has been more negatively impacted during the
subprime crisis. Hence, given these arguments, shareholders may be especially suspicious
about environmentally friendly firms during a period of financial crisis, and more reluctant to
invest in such companies. Therefore, according to this view, we can hypothesize:
H2: High level of pre-crisis EP reduces firm financial resilience
2.3. Data and methodology
2.3.1. Variables and research sample
We measure resilience by the duration of recovery, defined by Reinhart and Rogoff (2014) and
Ambrosius (2017) as the number of periods (years and quarters, respectively) it takes for a
country to recover to its pre-crisis period level of per capita GDP. As our study is concerned
with firms, therefore, we use firm’s market price to measure the duration of recovery.
DesJardine et al. (2017) measure duration of recovery by using monthly stock price recovery
Chapter 2. Trade-off between EP and financial resilience to global financial crisis
42
to its pre-crisis level. In order to have a finer measurement, we use the weekly prices with the
condition that the price does not fall again for at least four weeks, to assure full recovery. Thus,
we define recovery as the time needed for a firm’s weekly market price to recover to its pre-
crisis level, provided it remains above this threshold for at least four weeks. The pre-crisis level
is defined as the end of October 2007, because the world equity market reached its all-time
high market capitalization in this month and the recession started afterwards (Bartram and
Bodnar, 2009). Because the world equity market reached its lowest point in September 2009,
we restrict our baseline model until October 2011 to reduce the possibility of other events
impacting market price fluctuations. As a robustness check, we also analyze the relationship
using extended windows.
Table 2.1 describes our variables. EP is measured by the environmental dimension of Thomson
Reuters ESG - Asset4, one of the major ESG rating agencies. Asset4 analyses thousands of
publicly traded companies on the basis of three dimensions (i.e. environmental, social and
governance), on a scale from 0 (the lowest) to 100 (the highest) relative to peers in their
respective industries. As Asset4 data is issued annually, 2006 is considered as pre-crisis period.
We divide Asset4 environmental firm’s ratings by 100 to scale it between 0 to 1. Asset4
classifies firm’s EP into three main categories – emission reduction, product innovation, and
resource reduction. These reliable data are widely used in international studies, for instance by
Cheng et al. (2014), Eccles et al. (2014), Shaukat et al. (2015), Lys et al. (2015) or Gupta
(2018).
We include countries’ overall EP in our analysis as a control variable. It may negatively
influence firms’ financial resilience since stricter environmental regulation induces higher
costs for firms (Rennings and Rammer, 2011). However, regulations may also trigger
innovation and thus enhance firms’ competitiveness (Porter and Linde, 1995) and aptitude to

Chapter 2. Trade-off between EP and financial resilience to global financial crisis
43
change, which is likely to enhance firms’ skills to deal with crisis. To measure a country’s EP,
we rely on the environmental performance index (henceforth EPI), following Bazillier et al.
(2017) and Xiao et al. (2018). This index was developed by the Yale Center for Environmental
Law and Policy (YCELP), and the Center for International Earth Science Information Network
(CIESIN). EPI gauges the country’s overall EP linked to their policy targets. Countries are
rated from 0 to 100, on an average of two broad categories – Environmental Health and
Ecosystem Vitality objectives. We also divide EPI data by 100 to scale in the range from 0 to
1 for comparison purposes.
We also include some control variables that may also explain financial resilience. Our control
variables are firms’ intangible assets, profitability, size, leverage, operational performance,
innovation, capital intensity and momentum. Intangible assets are proxied by market to book
value ratio, denoted by MB. ROA measures the profitability of the firm. Firm size (SIZE) is
calculated as the natural log of the firm’s total assets. Leverage is the ratio between book value
of total debt and total assets, denoted by DA. Sales growth (SG) is measured by total sales
divided by sales in previous year. We also introduce RD in our analysis, calculated as research
and development (R&D) expenditures divided by total sales, and also a dummy variable
RDDUM (equal to 1 if the firm has disclosed its R&D expenditure, 0 otherwise). Capital
intensity, denoted by CAPEX, is calculated as capital expenditure divided by book value of
assets. We also introduce a variable denoted as MOMENTUM, representing the market price
change three years prior to the crisis period. Additionally, we control for industry and region
by introducing industry dummies using 2-digits GICS codes and region dummies. We define
five regions: East Asia and Pacific, Western Europe and North America, Latin America and
the Caribbean, Middle East and North Africa, Sub-Saharan Africa. To alleviate any concern
about outliers, financial variables are winsorized at the 1% and 99 % level.

Chapter 2. Trade-off between EP and financial resilience to global financial crisis
44
Table 2.1: Summary of variables
2.3.2. Sample
The construction of our sample is depicted in Table 2.2. From 5,154 firms in 66 countries, the
stock prices of 787 firms, necessary for calculating duration of recovery, are missing in
Thomson Reuters DataStream (from October 2007 to October 2016). EP ratings from Asset4
also reduce our sample significantly by 2,533 firms due to non-availability.
After balancing for unavailable observations of control variables, our sample is finally
restricted to 1,622 unique firms from 30 countries : 555 firms are located in the USA, followed
by Japan (312), UK (214) and Canada (86). The remaining countries included in the sample
are detailed in Table 2.3. We also observe that three main sectors represent approximately 50%
of the overall sample: financials, industrials and consumer discretionary.
Variables Description Data source
RECOVERY Duration of market price recovery (in weeks) to its
pre-crisis level.
Thomson Reuters
Datastream
EP Environmental score from Asset4 Dataset. Thomson Reuters-Asset4
EPI Environmental Performance Index Yale University
MB Market value of equity / Book value of equity. Worldscope
ROA Return on asset. Worldscope
SIZE Natural log of firm’s total assets. Worldscope
DA Book value of debts / Book value of assets. Worldscope
SG Sales growth (sales in current year divided by sales in
previous year).
Worldscope
RD R&D Expenditures / Sales. Worldscope
RDDUM R&D dummy, equals 1 if firms have R&D
expenditure and 0 otherwise.
Worldscope
CAPEX Capital expenditures / Book value of Assets. Worldscope
MOMENTUM Stock price momentum, three years’ market price
change before crisis.
Thomson Reuters
INDUSTRY Dummy for industry from the GICS 2-digits
classification
Worldscope

Chapter 2. Trade-off between EP and financial resilience to global financial crisis
45
Table 2.2: Sample construction
Firms in the Sample
5,154 Total number of firms in the sample.
-787 Firms stock prices not available on DataStream, necessary for calculating our
main variable of interest (i.e. Resilience)
-2,533 Firms Asset4 environmental ratings not available
-83 Environmental performance Index (EPI) score for each firm not available for
their respective countries.
-26 Firms Market to Book value (MB) observations not available
-13 Firms sales growth (SG) observations not available
-90 Firms momentum observations not available
1,622 Final Sample
Table 2.3: Sample Description
Country Obs. Sector Obs.
United States 555 Financials 287
Japan 312 Industrials 285
United Kingdom 214 Consumer Discretionary 265
Canada 86 Information Technology 161
Australia 66 Materials 158
France 61 Consumer Staples 143
Germany 46 Energy 134
Switzerland 38 Health Care 120
Sweden 37 Telecommunication
Service
35
Spain 31 Utilities 34
Italy 30 Total 1,622
Netherlands 25
Finland 20
Ireland 17
Belgium 13
Austria 12
Denmark 12
Norway 10
Portugal 10
Others 27
Total 1,622
Summary statistics for our variables are presented in Table 2.4. RECOVERY has a mean equal
to 176 weeks and a median equal to 210 weeks. Mean EP is 0.515, whereas mean EPI is 0.812.

Chapter 2. Trade-off between EP and financial resilience to global financial crisis
46
In exploring other characteristics in the sample, we note that MB and ROA have an average of
3.274 and 0.061, respectively. Moreover, firm size is on average $9.5 billion. Means of DA,
SG, RD, CAPEX and MOMENTUM are respectively 0.236, 1.147, 0.024, 0.052 and 1.453.
Table 2.4: Summary Statistics
VARIABLES N Mean Median S.D. p25 p75
RECOVERY 1,622 176 210 52 153 210
EP 1,622 0.515 0.474 0.320 0.170 0.868
EPI 1,622 0.812 0.814 0.031 0.785 0.829
MB 1,622 3.274 2.472 3.275 1.729 3.774
ROA 1,622 0.061 0.051 0.070 0.025 0.090
SIZE 1,622 9.155 8.934 1.526 8.059 10.079
DA 1,622 0.236 0.214 0.174 0.103 0.341
SG 1,622 1.147 1.097 0.260 1.032 1.194
RD 1,622 0.024 0.000 0.065 0.000 0.021
RDDUM 1,622 0.546 1.000 0.498 0.000 1.000
CAPEX 1,622 0.052 0.040 0.050 0.019 0.069
MOMENTUM 1,622 1.453 0.905 2.152 0.290 1.812
2.4. Results
2.4.1. Univariate tests
Using mean comparison matched t-tests, we compare EP of recovered and unrecovered firms
as exhibited in Table 2.5. During the sample period, 632 firms recovered, whereas 990 firms
(61%) failed to recover. The mean EP of recovered and unrecovered firms is 0.472 and 0.543,
respectively. The mean EP of recovered firms average is statistically significantly less than the
EP of unrecovered firms with a difference of 0.071, in accordance with H2.

Chapter 2. Trade-off between EP and financial resilience to global financial crisis
47
Table 2.5: Matched t-test of EP comparison between recovered and unrecovered firm’s
groups
Group Observations Mean Std. Err. Std. Dev.
Recovered Firms 632 0.472 0.012 0.312
Unrecovered Firms 990 0.543 0.010 0.322
Combined 1,622 0.515 0.008 0.320
Difference .071*** 0.016 61% of the firms didn’t recover during the sample period. On average, recovered firms’ EP is
significantly (p-value = 0.000) less than unrecovered firms.
Furthermore, we divide our sample into two sets based on EP: high EP group when a firm’s
EP is greater than its median and low EP group when EP is less than the median. We then
conduct Kaplan-Meier survival analysis to compare the probability of recovery of both sets.
The graph, presented in Figure 2.1, shows that, through the whole path, for the same amount
of time, high EP group firms have a higher probability to remain in the same state, which is the
state of non-recovery. Furthermore, as the time increases, the curves get more disconnected,
suggesting that EP negatively affects the recovery.
We then perform the log-rank test for both groups, to test statistical difference between both
Kaplan-Meier curves. The results, exhibited in Table 2.6, show that high and low EP groups
have significantly different Kaplan-Meier curves with a p-value less than 0.001.

Chapter 2. Trade-off between EP and financial resilience to global financial crisis
48
Figure 2.1: Kaplan-Meier survival estimates between high and low EP groups
This figure shows the Kaplan-Meier curves for both groups, which have been split according to the
median. The x-axis shows the analysis time, and the y-axis shows the probability to remain in the same
state of non-recovery. High probability shows less resiliency. The High EP group has a comparatively
high probability to remain unrecovered.
Table 2.6: Log-rank test for equality of Kaplan-Meier curves
Groups Events observed Events expected
Low EP group 360 296.93
High EP group 272 335.07
Total 632 632
chi2(1) = 25.43 Pr>chi2 = 0.000 This table shows statistical significance of the difference between Kaplan-Meier curves, indicate that
both curves are significantly different from each other.
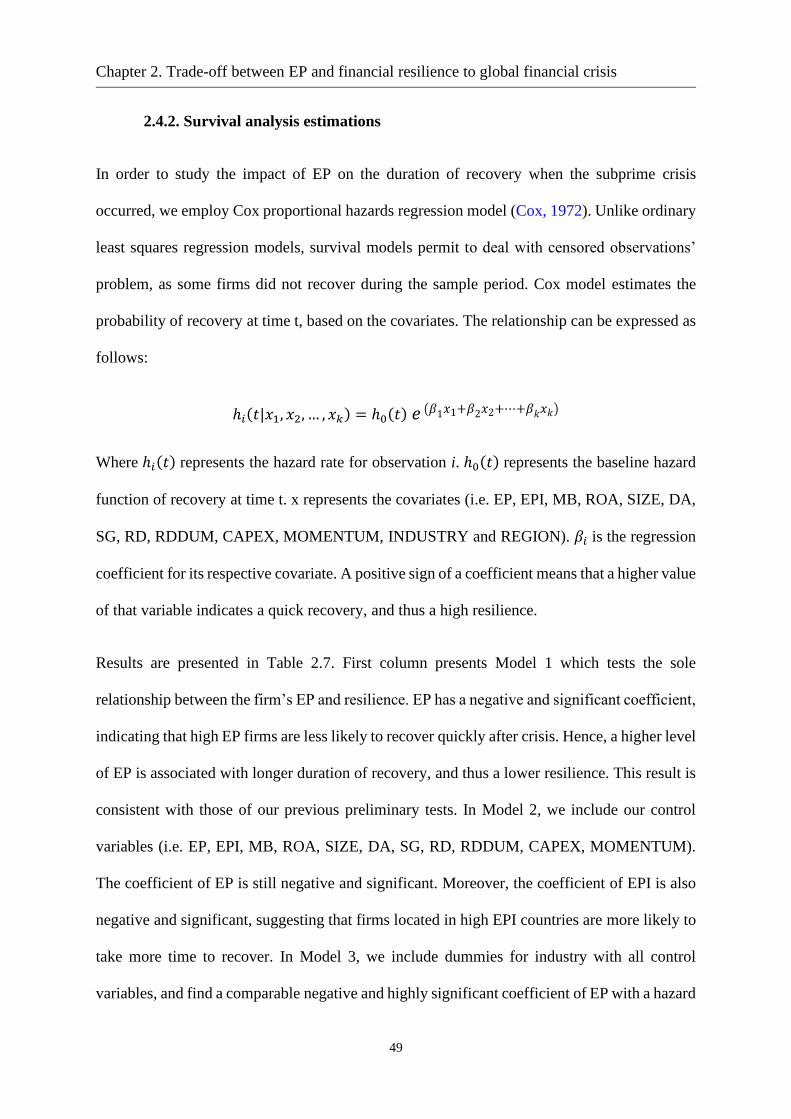
Chapter 2. Trade-off between EP and financial resilience to global financial crisis
49
2.4.2. Survival analysis estimations
In order to study the impact of EP on the duration of recovery when the subprime crisis
occurred, we employ Cox proportional hazards regression model (Cox, 1972). Unlike ordinary
least squares regression models, survival models permit to deal with censored observations’
problem, as some firms did not recover during the sample period. Cox model estimates the
probability of recovery at time t, based on the covariates. The relationship can be expressed as
follows:
ℎ𝑖(𝑡|𝑥1, 𝑥2, … , 𝑥𝑘) = ℎ0(𝑡) 𝑒 (𝛽1𝑥1+𝛽2𝑥2+⋯+𝛽𝑘𝑥𝑘)
Where ℎ𝑖(𝑡) represents the hazard rate for observation i. ℎ0(𝑡) represents the baseline hazard
function of recovery at time t. x represents the covariates (i.e. EP, EPI, MB, ROA, SIZE, DA,
SG, RD, RDDUM, CAPEX, MOMENTUM, INDUSTRY and REGION). 𝛽𝑖 is the regression
coefficient for its respective covariate. A positive sign of a coefficient means that a higher value
of that variable indicates a quick recovery, and thus a high resilience.
Results are presented in Table 2.7. First column presents Model 1 which tests the sole
relationship between the firm’s EP and resilience. EP has a negative and significant coefficient,
indicating that high EP firms are less likely to recover quickly after crisis. Hence, a higher level
of EP is associated with longer duration of recovery, and thus a lower resilience. This result is
consistent with those of our previous preliminary tests. In Model 2, we include our control
variables (i.e. EP, EPI, MB, ROA, SIZE, DA, SG, RD, RDDUM, CAPEX, MOMENTUM).
The coefficient of EP is still negative and significant. Moreover, the coefficient of EPI is also
negative and significant, suggesting that firms located in high EPI countries are more likely to
take more time to recover. In Model 3, we include dummies for industry with all control
variables, and find a comparable negative and highly significant coefficient of EP with a hazard
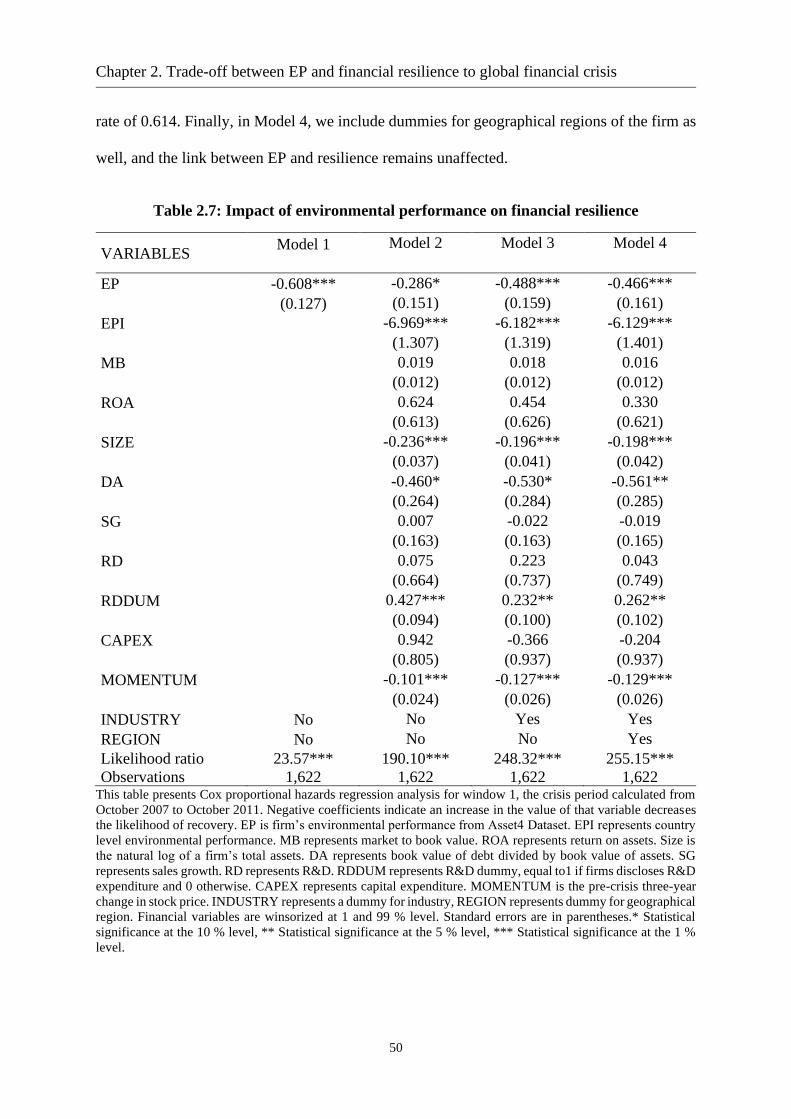
Chapter 2. Trade-off between EP and financial resilience to global financial crisis
50
rate of 0.614. Finally, in Model 4, we include dummies for geographical regions of the firm as
well, and the link between EP and resilience remains unaffected.
Table 2.7: Impact of environmental performance on financial resilience
VARIABLES Model 1
Model 2
Model 3
Model 4
EP -0.608*** -0.286* -0.488*** -0.466***
(0.127) (0.151) (0.159) (0.161)
EPI -6.969*** -6.182*** -6.129***
(1.307) (1.319) (1.401)
MB 0.019 0.018 0.016
(0.012) (0.012) (0.012)
ROA 0.624 0.454 0.330
(0.613) (0.626) (0.621)
SIZE -0.236*** -0.196*** -0.198***
(0.037) (0.041) (0.042)
DA -0.460* -0.530* -0.561**
(0.264) (0.284) (0.285)
SG 0.007 -0.022 -0.019
(0.163) (0.163) (0.165)
RD 0.075 0.223 0.043
(0.664) (0.737) (0.749)
RDDUM 0.427*** 0.232** 0.262**
(0.094) (0.100) (0.102)
CAPEX 0.942 -0.366 -0.204
(0.805) (0.937) (0.937)
MOMENTUM -0.101*** -0.127*** -0.129***
(0.024) (0.026) (0.026)
INDUSTRY No No Yes Yes
REGION No No No Yes
Likelihood ratio 23.57*** 190.10*** 248.32*** 255.15***
Observations 1,622 1,622 1,622 1,622 This table presents Cox proportional hazards regression analysis for window 1, the crisis period calculated from
October 2007 to October 2011. Negative coefficients indicate an increase in the value of that variable decreases
the likelihood of recovery. EP is firm’s environmental performance from Asset4 Dataset. EPI represents country
level environmental performance. MB represents market to book value. ROA represents return on assets. Size is
the natural log of a firm’s total assets. DA represents book value of debt divided by book value of assets. SG
represents sales growth. RD represents R&D. RDDUM represents R&D dummy, equal to1 if firms discloses R&D
expenditure and 0 otherwise. CAPEX represents capital expenditure. MOMENTUM is the pre-crisis three-year
change in stock price. INDUSTRY represents a dummy for industry, REGION represents dummy for geographical
region. Financial variables are winsorized at 1 and 99 % level. Standard errors are in parentheses.* Statistical
significance at the 10 % level, ** Statistical significance at the 5 % level, *** Statistical significance at the 1 %
level.

Chapter 2. Trade-off between EP and financial resilience to global financial crisis
51
As a robustness check, we analyze the relationship using alternative models. First, we estimate
the relationship using different windows by extending the crisis period to the October of 2012,
2013, 2014, 2015, and 2016 (Table 2.8). Coefficients of EP are still negative and significant
for all windows, consistent with the results of the previous baseline model. Alternative choices
of windows do not affect our findings. Second, we test the relationship using different models
(Exponential, Weibull and Gompertz). As evidenced in Table 2.9, the results are comparable
with than those obtained with the Cox model.
Overall, all else being equal, higher EP seems to reduce their ability to cope with the subprime
crisis’ shock. Extensive investment in environmental policies, therefore, appears to decrease
financial resilience after a systematic crisis. Our findings seem to be in line with the
neoclassical arguments stating that environmental engagements create agency problems (H2).
Investors may, especially during a financial crisis, react negatively to firm’s environmental
policies because they suspect environmental policies to be implemented by managers at the
expense of the firm’s adaptation to external financial troubles. In the vein of Friedman’s (1970)
argument, money invested in environmental policies cannot be made available in order to cope
with a financial shock.
Environmental constraints at the institutional level also prove to have a detrimental impact on
resilience. Indeed, we document a strong negative impact of EPI on financial resilience. This
additional result seems to be in line with the view that an increase in stringency of
environmental regulation reduce firms’ profit (Palmer et al., 1995). Overall, at the level of the
firm as well as the scale of the country, higher environmental performance leads companies to
recover less quickly after the subprime crisis. We find that both high EP at a national level and
at the firm level seem to act as a constraint for companies, reducing their capacity to adapt and
to recover from the subprime crisis.

Chapter 2. Trade-off between EP and financial resilience to global financial crisis
52
Table 2.8: Impact of environmental performance on financial resilience - Robustness to
different time windows
VARIABLES Oct. 2007-
Oct. 2012
Oct. 2007-
Oct. 2013
Oct. 2007-
Oct. 2014
Oct. 2007-
Oct. 2015
Oct. 2007-
Oct. 2016
EP -0.448*** -0.376*** -0.326** -0.253* -0.274**
(0.153) (0.137) (0.132) (0.131) (0.132)
EPI -6.175*** -5.581*** -5.044*** -5.552*** -5.408***
(1.338) (1.235) (1.215) (1.221) (1.143)
MB 0.021* 0.015 0.012 0.010 0.010
(0.012) (0.011) (0.010) (0.010) (0.010)
ROA 0.171 0.145 0.345 0.514 0.591
(0.591) (0.543) (0.525) (0.522) (0.527)
SIZE -0.152*** -0.114*** -0.114*** -0.116*** -0.112***
(0.039) (0.034) (0.032) (0.032) (0.032)
DA -0.702*** -0.681*** -0.571** -0.575*** -0.536**
(0.270) (0.236) (0.225) (0.221) (0.223)
SG -0.048 -0.235 -0.218 -0.288* -0.247*
(0.158) (0.153) (0.146) (0.148) (0.149)
RD 0.296 0.005 -0.140 -0.160 -0.197
(0.693) (0.673) (0.660) (0.658) (0.659)
RDDUM 0.242** 0.273*** 0.289*** 0.352*** 0.417***
(0.096) (0.087) (0.085) (0.085) (0.086)
CAPEX -0.022 0.331 0.176 0.177 0.154
(0.890) (0.800) (0.786) (0.790) (0.808)
MOMENTUM -0.133*** -0.131*** -0.142*** -0.148*** -0.192***
(0.026) (0.024) (0.024) (0.024) (0.026)
INDUSTRY Yes Yes Yes Yes Yes
REGION Yes Yes Yes Yes Yes
Likelihood ratio 267.18*** 278.78*** 284.05*** 298.92*** 336.13***
Recovered firms N 701 866 929 944 927
Observations 1,622 1,622 1,622 1,622 1,622
This table presents Cox proportional hazards regression analysis for crisis period restricted to October 2012,
2013, 2014, 2015, and 2016. Negative coefficients indicate that an increase in the value of that variable
decreases the likelihood of recovery. EP is a firm’s environmental performance from Asset4 Dataset. EPI
represents country level environmental performance. MB represents market to book value. ROA represents
return on assets. Size is the natural log of a firm’s total assets. DA represents book value of debt divided by
book value of assets. SG represents sales growth. RD represents R&D. RDDUM represents R&D dummy, and
equals 1 if firms discloses R&D expenditure and 0 otherwise. CAPEX represents capital expenditure.
MOMENTUM is the pre-crisis three-year change in stock price. INDUSTRY represents a dummy for Industry,
REGION represents a dummy for geographical region. Financial variables are winsorized at 1 and 99 % level.
Standard errors are in parentheses. * Statistical significance at the 10 % level ** Statistical significance at the
5 % level *** Statistical significance at the 1 % level.

Chapter 2. Trade-off between EP and financial resilience to global financial crisis
53
Table 2.9: Impact of environmental performance on financial resilience – Alternative
models
VARIABLES Exponential Model Weibull Model Gompertz Model
EP -0.417** -0.454*** -0.472***
(0.162) (0.162) (0.162)
EPI -5.567*** -5.967*** -6.173***
(1.375) (1.386) (1.393)
MB 0.014 0.016 0.016
(0.012) (0.012) (0.012)
ROA 0.275 0.324 0.380
(0.627) (0.622) (0.618)
SIZE -0.178*** -0.190*** -0.195***
(0.042) (0.042) (0.042)
DA -0.534* -0.557* -0.564**
(0.283) (0.284) (0.284)
SG -0.019 -0.019 -0.016
(0.167) (0.165) (0.164)
RD 0.158 0.152 0.083
(0.718) (0.753) (0.748)
RDDUM 0.229** 0.251** 0.269***
(0.101) (0.102) (0.102)
CAPEX -0.274 -0.236 -0.203
(0.944) (0.940) (0.937)
MOMENTUM -0.117*** -0.126*** -0.131***
(0.026) (0.026) (0.026)
Constant -0.010 -2.490* -0.417
(1.300) (1.336) (1.315)
Ln(p) 0.442***
(0.037)
γ 0.009***
(0.001)
INDUSTRY Yes Yes Yes
REGION Yes Yes Yes
Likelihood ratio 218.82*** 244.95*** 259.34***
Observations 1,622 1,622 1,622 Columns 1, 2 and 3 present Exponential, Weibull, Gompertz models, respectively, for the crisis period restricted to
October 2011. Negative coefficients indicate that an increase in the value of that variable decreases the likelihood of
recovery. EP is firm’s environmental performance from Asset4 Dataset. EPI represents country level environmental
performance. MB represents market to book value. ROA represents return on asset. Size is the natural log of a firm’s
total assets. DA represents book value of debt divided by book value of assets. SG represents sales growth. RD
represents R&D. RDDUM represents R&D dummy, and equals 1 if firms discloses R&D expenditure and 0 otherwise.
CAPEX represents capital expenditure. MOMENTUM is the pre-crisis three-year change in stock price. INDUSTRY
represents a dummy for Industry, REGION represents a dummy for geographical region. Financial variables are
winsorized at 1 and 99 % level. Standard errors are in parentheses. * Statistical significance at the 10 % level, **
Statistical significance at the 5 % level, *** Statistical significance at the 1 % level.

Chapter 2. Trade-off between EP and financial resilience to global financial crisis
54
2.4.3. Sensitivity to environmental policies dimension and country level
environmental standards
In order to gain a finer understanding of the impact of EP on resilience, we then explore whether
the effect is different depending on the different dimensions of environmental policy. Thus, we
rerun our baseline model by using the three subcomponents of Asset4 environmental score,
called “resource reduction”, “emission reduction” and “product innovation”. According to
Asset4, “resource reduction” refers to “a company's management commitment and
effectiveness toward achieving an efficient use of natural resources in the production process”,
whereas “emission reduction” is defined as “a company's management commitment and
effectiveness toward reducing environmental emission in the production and operational
processes” (Lys et al., 2015, Gupta, 2018). Finally, “product innovation” measures “a
company's management commitment and effectiveness toward supporting the research and
development of eco-efficient products or services”.

Chapter 2. Trade-off between EP and financial resilience to global financial crisis
55
Table 2.10: Impact of environmental performance on financial resilience – EP subsets
VARIABLES Resource Reduction Emissions Reduction Product Innovation
EP -0.536*** -0.329** -0.180
(0.154) (0.162) (0.159)
EPI -6.471*** -6.988*** -7.563***
(1.392) (1.384) (1.335)
MB 0.016 0.016 0.016
(0.012) (0.012) (0.012)
ROA 0.272 0.154 0.022
(0.628) (0.627) (0.626)
SIZE -0.191*** -0.215*** -0.239***
(0.041) (0.042) (0.039)
DA -0.565** -0.583** -0.581**
(0.286) (0.287) (0.290)
SG -0.063 -0.043 -0.037
(0.166) (0.167) (0.167)
RD -0.029 -0.051 -0.070
(0.750) (0.754) (0.759)
RDDUM 0.237** 0.218** 0.207**
(0.101) (0.101) (0.102)
CAPEX -0.166 -0.218 -0.312
(0.934) (0.945) (0.945)
MOMENTUM -0.129*** -0.129*** -0.128***
(0.027) (0.027) (0.027)
INDUSTRY Yes Yes Yes
REGION Yes Yes Yes
Likelihood ratio 259.92*** 251.86*** 248.97***
Observations 1,609 1,609 1,609 Columns 1, 2 and 3 present Cox proportional hazards regression using resource reduction, emission
reduction and product innovation as a proxy for EP from Asset4, respectively. Crisis period restricted to
October 2011. Negative coefficients indicate that an increase in the value of that variable decreases the
likelihood of recovery. EP is firm’s environmental performance from Asset4 Dataset. EPI represents
country level environmental performance. MB represents market to book value. ROA represents return on
asset. Size is the natural log of a firm’s total assets. DA represents book value of debt divided by book value
of assets. SG represents sales growth. RD represents R&D. RDDUM represents R&D dummy, and equals
1 if firms discloses R&D expenditure and 0 otherwise. CAPEX represents capital expenditure.
MOMENTUM is the pre-crisis three-year change in stock price. INDUSTRY represents a dummy for
Industry, REGION represents a dummy for geographical region. Financial variables are winsorized at 1
and 99 % level. Standard errors are in parentheses. * Statistical significance at the 10 % level, ** Statistical
significance at the 5 % level, *** Statistical significance at the 1 % level.
As reported in Table 2.10, we find that the coefficients of “resource reduction” and “emission
reduction” are in line with our baseline result, negative and significant. Indeed, according to
the neoclassical perspective, policies aimed at reducing pollution and the over-use of natural
resources may have decreasing marginal net benefits (Horváthová, 2010). However, our results
highlight that “product innovation” does not significantly decrease a firm’s financial resilience.
We argue that this sub-pillar may have an insignificant impact on resilience because it can be
Chapter 2. Trade-off between EP and financial resilience to global financial crisis
56
easily directly linked to an increase in sales, achieved thanks to the development of new
products (Lys et al., 2015). Indeed, as indicated by Horváthová (2010), the ongoing debate
concerning the impact of policies linked to “resource reduction” and “emission reduction” on
firms’ financial performance is still open since these policies are directly linked to additional
costs for firms and without a clear direct impact on the revenues of the firm. “Product
innovation” policies, however, are less controversial and might generate future distinctive
products and competitive advantages. Opportunities created in investing in this EP sub-pillar
may then counterbalance their costs and not affect significantly the firm’s financial resilience.
We also analyze whether the relationship between firm EP and financial performance is related
to country-level environmental standards. The level of national environmental standards
indicates how environmental issues are addressed in a given country and, as evidenced by Xiao
et al. (2018), moderates the financial benefits of firm-level EP. These authors show that in
countries with a low level of environmental standards, stakeholders’ expectations concerning
firms’ environmental policies are especially high since environmental issues are not well
addressed. In this context, an increase in firm-level EP can be a way to differentiate firms from
their competitors. Therefore, in these countries, environmental policies may create value for
shareholders and may be less likely to be considered as a mere financial constraint.
Conversely, in countries with high environmental standards, firms’ environmental policies are
more institutionalized and stakeholders’ environmental expectations toward firms are lower.
These policies may be more likely to be seen as a duty: the potential of differentiation is
reduced. With costs exceeding potential benefits, this may lead to a negative impact on
financial resilience. Since investors’ perception towards the potential benefits of environmental
policies relies on national-level environmental standards, the impact of EP on resilience should
be influenced by country-level EP.

Chapter 2. Trade-off between EP and financial resilience to global financial crisis
57
We split our sample into two subsets based on Bazillier et al. (2017)’s proxies to measure
country-level environmental standards, i.e. country’s participation in treaties (from World
Development Indicators) and EPI. As displayed in Table 2.11, in both cases our main finding
is significant only for firms belonging to high environmental standards countries. When
country-level environmental standards are high, we find that spending resources on EP are
impeding firms to recover more quickly. In these countries, EP may then appear as unnecessary
marginal expenses that are mitigating the ability of firms to adapt themselves to a financial
shock. In low environmental standards countries, however, the relationship is not statistically
significant. In line with the argument of Xiao et al. (2018), the expectations of stakeholders
might be higher in these countries with EP expenses being counterbalanced by stakeholder
support in the case of financial crises.
2.5. Conclusion
Society demands that firms become increasingly environmentally friendly. At the same time,
firms encounter more and more financial crises that they have to cope with. The aim of this
study is to assess whether EP is beneficial or not for firms attempting to recover from a financial
shock. Such an exogenous event is of particular interest to disentangle endogeneity issues
between environmental and financial performance. In the particular context of the subprime
crisis, we investigate whether high EP firms recover quickly from the crisis compared with low
EP firms. On one hand EP may trigger stakeholder support and help the firm to recover more
quickly, yet on the other, EP could be perceived as an additional cost that may negatively
impact on financial resilience.

Chapter 2. Trade-off between EP and financial resilience to global financial crisis
58
Table 2.11: Impact of environmental performance on financial resilience – Split
according to country-level environmental standards
VARIABLES Less
Treaties
More Treaties Low
EPI
High
EPI
EP -0.027 -0.949** -0.256 -0.698***
(-0.12) (-2.44) (-1.17) (-2.73)
EPI -6.749 -3.088 -7.162*** -4.658
(-1.17) (-1.06) (-2.75) (-0.82)
MB 0.000 0.0193 0.020 0.0173
(-0.02) (0.80) (1.23) (0.80)
ROA 1.886** -0.363 0.653 -0.246
(2.12) (-0.29) (0.80) (-0.23)
SIZE -0.201*** -0.153* -0.187*** -0.252***
(-3.30) (-1.85) (-3.21) (-3.74)
DA 0.243 -0.974 0.599 -1.337***
(0.58) (-1.57) (1.48) (-3.00)
SG -0.318 0.00899 -0.647** 0.532**
(-1.06) (0.04) (-2.55) (2.29)
RD 0.189 3.576 -0.340 2.905
(0.21) (1.37) (-0.37) (1.52)
RDDUM -0.025 0.313 0.102 0.498***
(-0.17) (1.55) (0.76) (2.95)
CAPEX 0.060 -0.813 -0.041 -0.513
(0.05) (-0.41) (-0.04) (-0.30)
MOMENTUM -0.136*** 0.000 -0.003 -0.137***
(-3.24) (0.07) (-0.47) (-3.33)
INDUSTRY Yes Yes Yes Yes
REGION Yes Yes Yes Yes
Likelihood ratio 106.90*** 100.24*** 133.26*** 117.31***
Observations 664 498 797 787 Columns 1 and 2 present Cox proportional hazards regression for a subsample of ‘less than median number
of treaties’ and ‘more than number of treaties’, respectively. Column 3 and 4 presents Cox proportional
hazards regression for subsample of less than median EPI score and higher than EPI score, respectively.
Crisis period restricted to October 2011. Negative coefficients indicate that an increase in the value of that
variable decreases the likelihood of recovery. EP is firm’s environmental performance from Asset4 Dataset.
EPI represents country level environmental performance. MB represents market to book value. ROA
represents return on asset. Size is the natural log of a firm’s total assets. DA represents book value of debt
divided by book value of assets. SG represents sales growth. RD represents R&D. RDDUM represents
R&D dummy, and equals 1 if firms discloses R&D expenditure and 0 otherwise. CAPEX represents capital
expenditure. MOMENTUM is the pre-crisis three-year change in stock price. INDUSTRY represents a
dummy for Industry, REGION represents a dummy for geographical region. Financial variables are
winsorized at 1 and 99 % level. Standard errors are in parentheses. * Statistical significance at the 10 %
level, ** Statistical significance at the 5 % level, *** Statistical significance at the 1 % level.
Using survival analysis with EP data from Thomson Reuters’s Asset4 on an international
sample of 1,622 observations, we find that higher pre-crisis EP proves to significantly reduce
a firm’s financial resilience. This relation, challenging for the EP-FP literature, is highly robust
to different models, control variables and time periods chosen. Moreover, we find that the

Chapter 2. Trade-off between EP and financial resilience to global financial crisis
59
impact of EP on resilience is only significant for the resource and emission reduction
dimensions. Interestingly, firms investing in the precise product innovation category have not
been negatively impacted on their financial resilience. We also show that the negative impact
of EP on resilience is not significant for firms located in countries with low environmental
standards. In such countries, since environmental issues have an important impact, firm-level
environmental policies seem less to be perceived as a mere financial cost.
This study has practical implications for both corporate managers and investors. Corporate
managers must be aware that environmental engagements could not help firms to cope with
future financial uncertainty, as evidenced in this context of the subprime crisis. In a sense, they
may have to choose between “doing good” and “doing well” concerning resource and emission
reductions. Besides, and interestingly, managers are not penalized in terms of financial
resilience when investing in product innovation, and in EP if their company is located in a
country with low environmental standards. In these two conditions, EP did not impede the firm
to financially recover from the subprime crisis. In addition, portfolio managers should be aware
that a firm’s environmental policy in resource and emission reductions might increase its
exposure to risk in case of a financial shock, especially in high environmental standard
countries.
This study calls for future research to better understand the impact of EP on financial resilience,
considering other contexts and recent exogenous shocks. Indeed, it is likely that consumers and
media sensitivity to environmental issues has increased since the subprime crisis (Flammer,
2013). It would be interesting to understand whether this growing environmental awareness is
likely to have altered the strength of negative effect of EP on financial resilience. Also, it might
be fruitful to assess whether EP allows companies to improve financial resilience to shocks of
different natures. If EP has a negative effect on financial resilience following a financial shock,

Chapter 2. Trade-off between EP and financial resilience to global financial crisis
60
EP may besides allow firms to hedge against environmental shocks such as natural disasters or
industrial accidents.

61

62
Chapter 3. Do environmental engagements improve financial resilience of
firms after emission disclosure?
Abstract
Though the financial benefits of environmental engagements are preoccupied with the
insurance-like effect and environment-as-a-resource framework, we extend this literature by
considering their resilience, and more precisely the flexibility effect measured by the time of
recovery. In the regulatory framework of the EU ETS, we argue that the disclosure of emissions
data points out the latent environmental liability of carbon-intensive firm in the form of future
compliance or emissions abatement costs. Market will adjust firm value for this liability. Thus,
carbon-intensive firm may experience a severe market price loss as compare to their peers, and
therefore may not recover easily. In line with the environment-as-a-resource view, carbon-
efficient firm may neutralize the shock and recover faster by attracting stakeholders’ attention
through their reputation of being eco-friendly and the competitive advantage of having valuable
and inimitable resources. By performing survival analysis on a sample of 3,194 observations
over first twelve publication events from 2006 to 2017, we find that carbon intensity (CI)
significantly downgrades the financial flexibility of firm against the shock caused by
publication of emissions data. This finding, complements the flexibility effect of environmental
engagements to the environment-as-a-resource concept, is robust through different time
windows, models, measures of flexibility and CI, and mitigation of sample bias towards
countries. However, we find that environmental engagements do not significantly demonstrates
the flexibility effect in less polluting industries, and when carbon prices are low and overall
allocation is high i.e. in first phase of the EU ETS.
Keywords: Crisis Management, Environmental Performance, Carbon Intensity, Emission
Trading Scheme (ETS), Financial Flexibility
JEL Classification: G01, M14, O16, Q51

Chapter 3: Do EP improve financial resilience of firms after emission disclosure
63
3.1. Introduction
The growing concerns about climate change has forced national and international institutions
to interfere and regulate industrial emissions and encourage them to implement an
environmental policy. To reduce the level of industrial emissions, the European Union
introduced the world’s largest emissions trading scheme (EU ETS), where they allocate a
certain level of emissions limited to a specific industry and then allocate to individual
installation either freely or via auction. Firms can therefore buy additional allowances in the
market if needed or sell their surplus.
However, research show that regulations create constraints for firm and negatively affect their
profitability (Clarkson et al., 2015, Chapple et al., 2013, Manchiraju and Rajgopal, 2017).
Various studies have particularly examined the financial implications of the EU ETS. For
instance, Brouwers et al. (2016), Clarkson et al. (2015), Jong et al. (2014) examined market
reaction to the publication of verified emissions, a regulatory requirement under the EU ETS,
and found a negative market reaction to the disclosure of firm’s carbon emissions. Similarly,
Clarkson et al. (2015) examine the value relevance of firm’s emissions under the EU ETS and
find that carbon intensity negatively affects firm value. These studies have so far addressed the
role of environmental activities of firm in their financial stability. However, no attention is paid
to the question of what happens next? For example, does firm value bounce back or not? Do
environmental activities play any role in firm survival and recovery from disruption? Do
environmental performant firms recover more quickly?
These questions are attributed to the flexibility dimension of organizational resilience
(DesJardine et al., 2017). As flexibility represents the adaptability of firm to environmental
changes (Ortiz-de-Mandojana and Bansal, 2016), it is important to study this aspect of
organizational outcome during regulatory upheavals. Flexibility is crucial for firm’s

Chapter 3: Do EP improve financial resilience of firms after emission disclosure
64
sustainability as it improves firm’s capacity to thrive and adapt to environmental changes
(DesJardine et al., 2017). Flexibility is extremely important for firm success in turbulent
environment like regulatory interruptions. We thus tackle this important issue to fill the gap by
examining firm’s flexibility in the context of EU ETS. Brouwers et al. (2016) and Jong et al.
(2014) found a negative market reaction to the publication of verified emissions in some cases.
It seems that market is sensitive to the carbon intensity of firms. We therefore study a specific
link between carbon intensity and firm’s financial flexibility against the shock triggered by the
publication of verified emissions under the EU ETS. This will help us to understand whether
carbon-efficient activities help companies to survive and compete in this challenging
environment.
Concerning flexibility, previous works have mainly focused on the role of environmental
activities in firm’s financial stability dimension of resilience. For instance, Clarkson et al.
(2015) argue that carbon-intensive firms possess a latent environmental liability, in the form
of future compliance or emissions abatement cost, and market adjust firm value for this
liability. Thus, firm value reduces when disclosure of verified emissions points out the carbon
intensity of firm. On the other hand, eco-friendly activities of firm achieve environmental
legitimacy by meeting stakeholders’ expectations and therefore attracts their support while
facing a shock (Bansal and Clelland, 2004). Furthermore, empirical studies show that
responsible activities like protecting the environment provide an insurance-like benefit against
legal or regulatory actions (Godfrey et al., 2009, Koh et al., 2014).
Even though, the insurance-like benefits of environmental activities are well documented in
the context of financial stability, less attention is paid to firm recovery from a shock, i.e.
flexibility dimension of resilience. Previous work show that environmental activities mitigates
the impact of exogenous shock, however, this does not explain the precise link with financial

Chapter 3: Do EP improve financial resilience of firms after emission disclosure
65
flexibility i.e. time to recovery. As the loss in firm value and time to recovery capture the
duality of both dimensions of resilience i.e. stability and flexibility (DesJardine et al., 2017),
we expect that environmental activities may also help firm to recover faster from a shock. Due
to the insurance-like benefits of environmental activities (Godfrey et al., 2009) firm will
experience less loss and therefore may easily recover. The Environmental Resource based view
(Hart, 1995, Russo and Fouts, 1997) and the environment-as-a-resource view (Flammer, 2013)
postulate that carbon-efficient firms possess the reputation of being eco-friendly and the
competitive advantage of having valuable and inimitable resources. Thus, firm may benefit
from this reputation and competitive advantage to attract stakeholders’ attention and neutralize
the effects of a shock and recover faster. We thus hypothesize that carbon efficiency improves
firm’s financial flexibility against the shock triggered by the disclosure of verified emissions.
Following DesJardine et al. (2017), we measure financial flexibility by duration of firm’s
market price recovery to the level before the shock. For measuring carbon intensity, we collect
emissions data from Trucost dataset which is scaled by firm’s revenues. We apply the Cox PH
model on a final sample of 3,194 observations from 47 countries having installations covered
under the EU ETS. We test the relationship by considering the first 12 years publications of
verified emission from 2006 to 2017. We conduct the analysis on different time windows (i.e.
from 30 to 180 trading days after the event) and found a negative and significant link between
carbon intensity and the rate of firm’s market price recovery. After running different regression
models, using different measures of flexibility and carbon intensity, including different control
variables, and mitigating sample biasness towards countries, we found our results highly
robust.
Our findings suggest that carbon efficiency is crucial for firm’s flexibility against regulatory
upheavals. This indicate that firm should adopt an effective environmental policy to thrive

Chapter 3: Do EP improve financial resilience of firms after emission disclosure
66
through a turbulent environment. To have a thorough understanding of this relationship we
then consider the role of carbon-intensity profile of firm’s sector. Where our results show that
carbon intensity of firm significantly downgrades their financial flexibility only if the firm
belongs to a carbon-intensive sector. Furthermore, we also test the impact of allowance
shortage on financial flexibility and found that allowance shortage also significantly decreases
the rate of firm’s market price recovery. This indicate that firm’s emissions beyond the
allocated level deteriorates the financial flexibility of firm. Finally, we conduct the analysis on
each phase of the EU ETS separately. We find that carbon intensity significantly increases the
duration of recovery only in second and third phases. While this link is not significant in the
first phase. Evidence show that carbon prices were very low in this phase (Brouwers et al.,
2016) and the overall allocation was reduced in later phases. This indicate that carbon intensity
significantly affects firm recovery when the carbon prices are high and the demand for
allowances are high.
In this study, we first make an important contribution to the literature by documenting the
Environmental Resource based view (Hart, 1995, Russo and Fouts, 1997) and the environment-
as-a-resource framework (Flammer, 2013) in the context of ETS disclosure in focusing on the
flexibility effect, measured as the time firm market prices needed to recover. We precisely
analyze the role of environmental engagements in building the financial flexibility against a
regulatory requirement of the publication of verified emissions. If the financial stability and
insurance-like benefits of environmental engagements are well addressed, to our knowledge,
no attention is paid to their flexibility effects and especially in the context of regulatory
upheavals. By applying a survival analysis methodology, our results prove that environmental
engagements enable firm to recover faster from the shock. Our findings reinforce the
advantages of environmental engagements highlighted by the environment-as-a-resource

Chapter 3: Do EP improve financial resilience of firms after emission disclosure
67
framework, such as reputation and acquisition of valuable and inimitable resources. Thus,
environmental performant firms may benefit from these advantages to neutralize the effects of
a shock, recover faster and adapt to a turbulent environment during regulatory upheavals. This
indicate that beside the stability and insurance-like effects, environmental engagements also
possess the effect of financial flexibility. Since the ETS around the world is currently covering
only 15% of the global emissions and it is spreading around the world (ICAP, 2018), thus it is
a timely proposition to managers for managing its risk through an effective environmental
policy.
Secondly, we contribute to the literature by documenting that survival analysis can be used to
substitute the conventional event study methodology. As event study methodology focuses on
a very short run assessment, our measure of flexibility in survival analysis allows us to check
the relationship in a comparatively long run. Survival analysis also allows to check the
relationship in different time windows simultaneously. As our findings show that the
relationship is strong and robust in longer time windows, this seems particularly important for
shareholders. Shareholders must know that market takes some time to fully incorporate its
reaction to the carbon efficiency of firms after disclosure of emissions data. Furthermore,
investors may outperform in a turbulent environment by investing in carbon-efficient firms.
The rest of the paper is organized as follows. The second section presents related literature and
hypothesis development. The third section describes the method used, variables and data
analysis. The fourth section is dedicated to our empirical results. The last section presents the
conclusion.

Chapter 3: Do EP improve financial resilience of firms after emission disclosure
68
3.2. Literature and hypothesis development
The purpose of EU ETS is to combat climate change by reducing the GHG emissions.
However, some authors argue that mandatory environmental regulation increases firm’s costs
(Clarkson et al., 2015, Chapple et al., 2013, Manchiraju and Rajgopal, 2017). Under the EU
ETS, authorities fix a maximum level of GHG emissions from the covered installations. Some
installations then receive a certain level of allowances setting a maximum level of emissions.
Beyond that level, firms can purchase allowances in the market or sell their surplus. Eventually,
the under-allocated firms have to bear an additional cost of purchasing the permits. Every year
authorities verify the emissions of each installation and publish it at the European Union
Transaction Log (EUTL) website4. Research, for instance Brouwers et al. (2016), show that
the publication of verified emissions negatively affect the share price of carbon-intensive and
under-allocated firms.
It seems that the publication of verified emissions brings some benefits as well as harms to
concerned firms. For instance, as different authorities scrutinize and verify actual emissions of
firm, their publication is trustworthy and increases transparency among firm stakeholders.
Firms can timely identify their surplus or allowances deficiencies and can also benefit from
selling their surplus allowances. Firm can minimize the risk of non-compliance through a
timely identification of deficiencies against the EU ETS. However, if firm’s operation is carbon
intensive compared to peers, this may negatively affect firm value. To comply with the EU
ETS, carbon-intensive firms will bear the cost of buying allowances in the market or will have
to invest in less carbon-intensive technologies and processes. In both cases, it seems that the
publication of verified emissions identifies some additional costs that firm will bear in future.
4 URL: https://ec.europa.eu/clima/ets/

Chapter 3: Do EP improve financial resilience of firms after emission disclosure
69
Chapple et al. (2013) and Clarkson et al. (2015) attribute this compliance and future cost
towards emission reduction to the latent liabilities of firm which negatively affects firm’s
financial stability.
Chapple et al. (2013) argue that firm’s carbon intensity is value relevant. By using an event
study methodology on the announcements of proposed Australian ETS implementation, they
find a significant impact of these announcements on firm value. Furthermore, using a valuation
model, they find a decrease from 7% to 10% of market capitalization in the market value of
carbon-intensive firms. They argue that this decrease in firm value may arise from the existence
of latent environmental liabilities, including emissions abatement costs or reduction in future
earnings. Similarly, Clarkson et al. (2004) claim that stringent environmental regulations
significantly enhances firm’s production costs. In their study, based on a sample of US pulp
and paper firms, they conclude that market uses firm’s emissions data, i.e. toxic release
inventory data, to assess the latent environmental liabilities of a firm. According to them, these
liabilities represent their obligatory future spending of polluting firms towards pollution
abatement, which is approximately equal to 16.6% of their market capitalization.
As EUTL discloses the compliance of firm with EU ETS by publishing the verified emissions
of covered installations every year, it may bring investors’ attention to the environmental policy
of firms. Investors seem like more sensitive to the long-term impact of the EU ETS (Jong et
al., 2014). We argue that investors may restrain from investing in firms having higher latent
environmental liabilities. As the system only covers a 45% of the EU GHG emissions
(European Commission, 2016), it still has a great potential to include and regulate the
installations of a more array of activities. This may increase investors’ concerns about firm
latent environmental liability and therefore may not give value to carbon-intensive firms due
to future regulative stringency. With more expected stringent regulations in future, firm will

Chapter 3: Do EP improve financial resilience of firms after emission disclosure
70
need more environmental capital expenditures to comply with regulations and thus will affect
firm’s financial stability. In this vein, Clarkson et al. (2015) used a valuation model and find
that carbon intensity reduces firm value specifically after the publication of verified emissions.
We thus anticipate that firm’s value may decrease after the publication of verified emissions,
hence negatively affect firm’s financial stability.
Showing a negative link with firm’s financial stability, we argue that the publication of verified
emissions may also make the carbon intensity relevant to firm financial flexibility. It appears
that a severe loss in firm value will make it difficult for firm to recover quickly, thus making
firm less flexible. DesJardine et al. (2017) argue that loss in firm value and their time to
recovery capture the duality of financial stability and flexibility. Indeed, firm value will recover
more quickly if they experience a smaller loss in their value. Thus, environmental activities
make firm financially stable against the shock triggered by the publication of verified emissions
by reducing the severity of loss in firm value. While experiencing a smaller loss, we anticipate
that carbon efficient firm may recover faster from the shock, thus making firm financially
flexible.
Besides the indirect impact on financial flexibility through stability, environmental
commitments seem to have a direct link with financial flexibility. Environmental activities may
help firm to build long-term relationships with external stakeholders (Ambec and Lanoie,
2008). Thus, environmental performant firm may exploit this advantage and positively attract
investors’ attention during environmental turbulence. Eventually, firm may neutralize the
negative effects of a shock and recover faster. This notion can be theoretically supported by
the instrumental version of stakeholder theory (Jones, 1995, Donaldson and Preston, 1995),
implying that building good relations with stakeholder leads to a competitive advantage for
firm. Furthermore, the Environmental Resource based view (Hart, 1995, Russo and Fouts,

Chapter 3: Do EP improve financial resilience of firms after emission disclosure
71
1997) specifically advocates the environmental engagements of firm. This view postulates that
environmental commitments improve firm reputation and develops other valuable and
inimitable resources for the firm, leading to a competitive advantage. We thus argue that the
reputation of being eco-friendly and the competitive advantage may help firm in recovery from
the shock triggered by disclosure of their emissions data.
Based on above arguments, we thus anticipate that environmental performance may reduce the
duration of firm recovery from the shock triggered by the disclosure of emissions data and will
show higher level of financial flexibility compare to their peers. Whereas, carbon-intensive
firm may experience a severe shock and may not recover quickly. We thus propose the
following hypothesis:
H: More carbon intensive firms are less flexible and take more time to recover from the event
of verified emissions disclosure
3.3. Variables and methodology
3.3.1. Variables
Flexibility and time frame
We examine here the link between the carbon intensity of firms and their financial flexibility
against the environmental shock triggered by the publication of verified emissions under the
EU ETS. As firm’s market price fully reflects new set of information in an efficient market,
therefore, we anticipate that firm market price will portray the indication of any potential costs,
i.e. latent environmental liabilities pointed out by the disclosure of emissions data, and the
green image of firm. We thus use firm’s market price to measure the financial flexibility of
firm. Furthermore, it is also important because it reflects not only the financial returns of firms
but also the premium for meeting their social responsibility (Baron, 2009). Similarly,

Chapter 3: Do EP improve financial resilience of firms after emission disclosure
72
DesJardine et al. (2017) also measured financial flexibility through firm’s market price in the
context of the subprime crisis. We thus measure flexibility by the number of trading days of
market price’s recovery to the day before the publication of verified emissions.
To measure the financial flexibility of firm, a time frame is required. There is, however, no
clear benchmark available in literature in the context of this study. DesJardine et al. (2017)
used the same approach but their study was based on firm resilience against the subprime crisis,
where firm market price takes more time to bounce back and observe resilience (stability and
flexibility). Therefore, they consider the shortest time window up to one year. However, the
intensity of shock triggered by the publication of verified emissions seems comparatively
smaller than the subprime crisis. Therefore, we measure the flexibility by using shorter time
windows starting from 10 days. However, based on the univariate analysis in the following
section we conclude that financial flexibility can be observed more prominently when the time
windows are longer than 30 days. Furthermore, Clarkson et al. (2015) and Chapple et al. (2013)
test the impact of carbon intensity on firm value (financial stability) calculated one and three
months after events, respectively. This indicate that a clear link may not be observed very close
to the event. However, we run our regression models on shorter as well as longer time windows
starting from 30 to 180 days.
We consider the first twelve publication events starting from 2005 to 2016. EUTL publishes
the verified emissions data of each period in the month of April in the succeeding year except
the emission report of 2005 which was published in May 2006. The exact dates of each
publication are presented in table 3.1. The market price of firm on the day before the
publication’s date is considered as a benchmark for measuring firm’s financial flexibility.
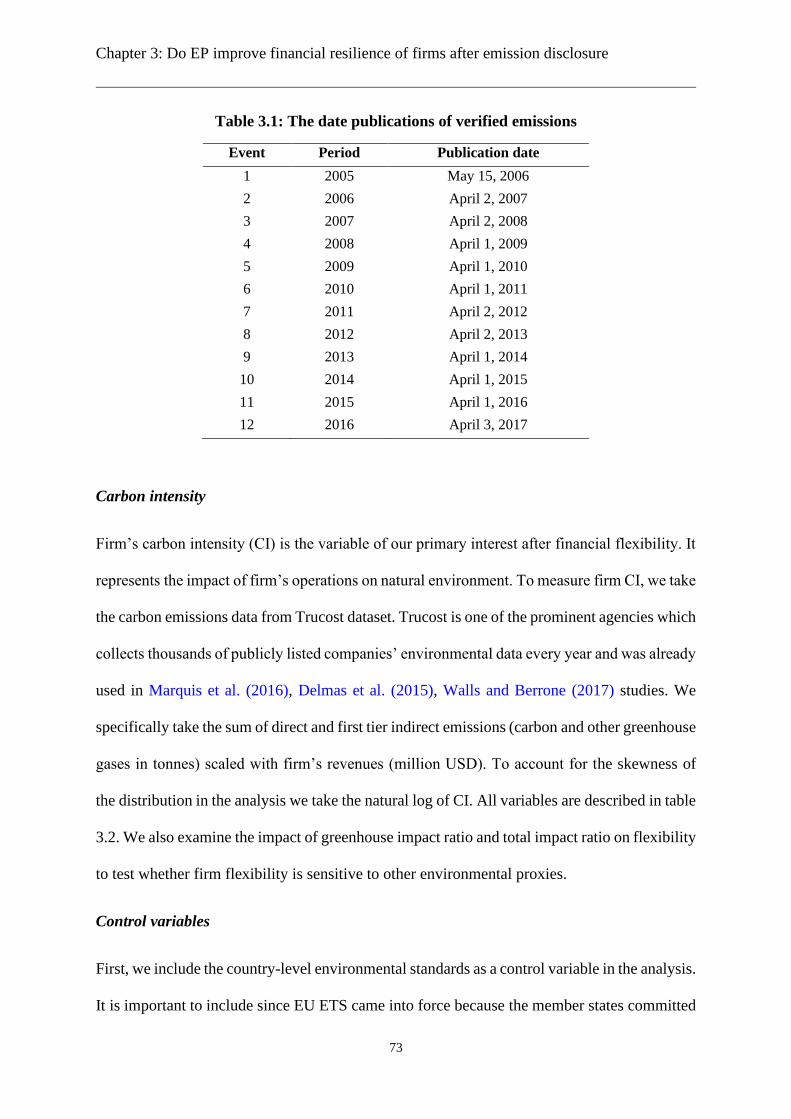
Chapter 3: Do EP improve financial resilience of firms after emission disclosure
73
Table 3.1: The date publications of verified emissions
Event Period Publication date
1 2005 May 15, 2006
2 2006 April 2, 2007
3 2007 April 2, 2008
4 2008 April 1, 2009
5 2009 April 1, 2010
6 2010 April 1, 2011
7 2011 April 2, 2012
8 2012 April 2, 2013
9 2013 April 1, 2014
10 2014 April 1, 2015
11 2015 April 1, 2016
12 2016 April 3, 2017
Carbon intensity
Firm’s carbon intensity (CI) is the variable of our primary interest after financial flexibility. It
represents the impact of firm’s operations on natural environment. To measure firm CI, we take
the carbon emissions data from Trucost dataset. Trucost is one of the prominent agencies which
collects thousands of publicly listed companies’ environmental data every year and was already
used in Marquis et al. (2016), Delmas et al. (2015), Walls and Berrone (2017) studies. We
specifically take the sum of direct and first tier indirect emissions (carbon and other greenhouse
gases in tonnes) scaled with firm’s revenues (million USD). To account for the skewness of
the distribution in the analysis we take the natural log of CI. All variables are described in table
3.2. We also examine the impact of greenhouse impact ratio and total impact ratio on flexibility
to test whether firm flexibility is sensitive to other environmental proxies.
Control variables
First, we include the country-level environmental standards as a control variable in the analysis.
It is important to include since EU ETS came into force because the member states committed

Chapter 3: Do EP improve financial resilience of firms after emission disclosure
74
to the Kyoto Protocol. Similarly, countries shape their environmental policy according to the
international treaties ratified by them e.g. according to the Rio Earth Summit in 1992, the
Millennium Summit in 2000, and the World Summit on Sustainable Development in
Johannesburg in 2002. Clarkson et al. (2015) argue that country-level environmental policy
negatively affects firm financial performance because mandatory environmental regulations
increase firm’s costs. Therefore, it is necessary to control its influence in the link between firm
carbon intensity and financial flexibility. Following Bazillier et al. (2017) we use the
Environmental Performance Index 5 (henceforth EPI) scores as a proxy for country-level
environmental standards. EPI rates countries from 0 (poor performance) to 100 (high
performance) based on their overall environmental targets. We divide EPI scores by 100 to
bring it in the range between 0 and 1.
While examining the relationship of firm’s social responsibility, including environmental as
well, with resilience (stability and flexibility), DesJardine et al. (2017) incorporated some
control variables in their analysis. Therefore, to have a robust analysis, we also include some
of their controls in the analysis i.e. book-to-market value, profitability, operational efficiency,
size, leverage, research and development expenditures, capital intensity. In addition, we also
incorporate a dummy for firm’s industry. Book-to-market value represents the book value of
assets scaled with market value of equity, denoted by BM. BM represents the intangible assets
of the firms i.e. goodwill and reputation, therefore, controlling for it will mitigate the concern
that firm’s financial flexibility is driven by market reputation of firm (DesJardine et al., 2017).
5 EPI is developed by Yale University, Yale Center for Environmental Law and Policy (YCELP), and Columbia
University, Center for International Earth Science Information Network (CIESIN), in collaboration with the
World Economic Forum and Joint Research Centre (JRC) of the European Commission (2006).

Chapter 3: Do EP improve financial resilience of firms after emission disclosure
75
Table 3.2: Summary of Variables
Variables Description Data source
Flexibility
dimension
of resilience
Duration of market price recovery in trading days to the level
before the publication of verified emissions.
Datastream
CI The carbon intensity of firms - the sum of direct and first tier
indirect emissions (tonnes) scaled with firm’s revenues (million
USD)
Trucost
EPI Country-level environmental standards measured by
Environmental Performance Index’s score.
Yale Center for
Environmental
Law and Policy
BM Book value of equity of firm divided by market value of equity. Worldscope
CF Funds from operations divided by net sales Worldscope
SG Sales Growth (sales minus previous year sales divided by previous
year sales).
Worldscope
SIZE Natural log of firm’s total assets (000). Worldscope
DA Book value of debts / Book value of assets. Worldscope
RD R&D Expenditures / Sales. Worldscope
RDDum A dummy – equals 1 if R&D data is available, otherwise zero.
CAPEX Capital Expenditures / Book value of Assets. Worldscope
INDUSTRY Dummy for industry from the GICS 2-digits classification Worldscope
It is important to control for firm’s operational efficiency. Operational efficient firms may
attract investors’ attention more, and therefore, may help firms market price to recover
comparatively quickly. Thus, we control for firm’s operational efficiency by using two proxies
i.e. sales growth (SG) and cash flows from operations (CF). SG is calculated by total sales
minus previous year sales and divided by previous year sales. CF is measured by total amount
of funds from operations divided by net sales. As Markman and Venzin (2014) find smaller
banks more resilient as compare to large bank against financial crisis, therefore, it seems that
large firms lose investors trust more when they are facing a shock. Thus, we also control to
reduce this concern in the context of recovery from the shock caused by the publication of
verified emissions. We measure firm’s size by taking the natural log of firm’s total assets,

Chapter 3: Do EP improve financial resilience of firms after emission disclosure
76
denoted by SIZE. We also consider the role of firm’s leverage in the analysis, which is
measured by firm’s total debts scaled with their total assets and is denoted by DA.
We also control for firm’s innovation capacity. Innovative firms may be less carbon intensive,
therefore, may have less impact of the publication of verified emissions and recover quickly.
Following Brancati et al. (2017), we measure firm’s innovation by the research and
development expenditure (RD). However, the data of RD is scarce, therefore, we replace the
missing value of RD by zero and then create a dummy, RDDUM, which is equal to 0 if RD
values are missing, otherwise 1. As Gittell et al. (2006) find a negative association between
firm’s capital intensity and financial performance of airlines after the September 2011 attack,
therefore, it may also play a role in the link between firm’s carbon intensity and flexibility in
the context of this study. Thus, we include it in the analysis by taking the capital expenditures
of firm divided by total assets, denoted by CAPEX. As different industries are scrutinized
differently for their impact on natural environment, therefore, we include a dummy for
industries (INDUSTRY) to control the fixed effect of industries by using GICS’s two digits
sector classification.
3.3.2. Survival Analysis methodology
We employ survival analysis methodology which best suits in the context of this study.
Previously, event study methodology was used to examine the impact of events on the financial
performance of firms, for instance Brouwers et al. (2016) and Jong et al. (2014) in the context
of EU ETS. However, it does not allow to study the flexibility side of resilience as well as the
role of other variables (e.g. carbon intensity as in this study) on the impact of an event on the
financial performance of firm. By taking financial flexibility as a measure of firm’s financial
performance, survival analysis enables us to examine precisely the time to recovery and the
impact of different variables (covariates) on financial performance of firm in the aftermath of

Chapter 3: Do EP improve financial resilience of firms after emission disclosure
77
an event. Survival analysis considers if a firm is recovered or not within a specified period as
well as the intensity of recovery (duration of recovery). By considering the unrecovered firms,
this model also takes into account the right censored observation in the analysis, which may
not be possible in standard OLS regression model. From the survival analysis methodology,
we specifically use the Cox proportional hazards regression model (Cox, 1972) as a baseline
model. Initially this model was used in medicine for examining the impact of a treatment on
patient’s health. However, its use is now growing in management studies, for instance utilized
by Ambrosius (2017), DesJardine et al. (2017), Ortiz-de-Mandojana and Bansal (2016), Ogane
(2015), and Roberts and Dowling (2002).
Cox model estimates the impact of different covariates on the recovery hazard rate after an
event. The relationship can be expressed in the following equation.
ℎ𝑖(𝑡|𝑥1, 𝑥2, … , 𝑥𝑘) = ℎ0(𝑡) 𝑒 (𝛽1𝑥1+𝛽2𝑥2+⋯+𝛽𝑘𝑥𝑘)
Where ℎ𝑖(𝑡) represents the hazard rate of recovery for observation ith. h0(t) is the baseline
hazard function of recovery at time t, however, Cox model leave it unpredicted. xi represents
the covariates (i.e. CI, EPI, SIZE, BM, RD, RDDum, CAPEX, DA, SG, CF and INDUSTRY).
𝛽 is the regression coefficient for its respective covariate. A positive sign of a coefficient
represents that increase in that variable will increase the probability of firm’s recovery, and
vice versa. As a robustness check, we also analyze this relationship by using other survival
models, i.e. the Weibull, Gompertz, and Exponential proportional hazard models in
combination with other regression models.
3.3.3. Data analysis
We conduct this study on the first twelve years of verified emissions publications starting from
2005 to 2016. This includes two completed phases and first four years of the third phase of the
Chapter 3: Do EP improve financial resilience of firms after emission disclosure
78
EU ETS. First phase covers the years from 2005 to 2007 and second phase includes the years
from 2008-2012. Third phase is comprised from 2013 to 2020, whereas, we could only include
until 2016 due to the unavailability of data. Thus, we collect all data from 2005-2016 except
the firm market prices. As, the EUTL publishes the verified emissions in succeeding years,
therefore, we collect firm’s market price data from 2006-2017. Firm’s market price is required
for measuring firm’s financial flexibility.
We include those firms in the analysis that has at least one installation covered under the EU
ETS. To collect other data of the firm, we needed an identifier of the firm, for instance ISIN or
RIC code. We thus first matched the names of companies from our list with the names of parent
companies of each installation available at the EUTL. We successfully found the names of 705
installations that are owned or operated by 424 unique firms. Secondly, we identify firm’s
inclusion in the EU ETS from Thomson Reuters Asset4 and CDP databases. These sources
show whether a firm is covered or not under the EU ETS in a specific year. Overall, we were
able to include 788 unique firms that has at least one installation covered under the system
during the analysis period, with 5,297 of total observations. We adjust our sample for the
missing values of necessary variables in the analysis. As depicted in table 3.3, our final sample
is then restricted to 3,194 observations.

Chapter 3: Do EP improve financial resilience of firms after emission disclosure
79
Table 3.3: Sample Construction
Description Observations
Total number of observations collected 5,297
Price data necessary for measuring flexibility is not available -359
Carbon intensity from Trucost is not available -1402
Observations of EPI is not available -13
Observation for calculating SIZE is not available -16
Observations of BM is not available -63
Observation of CAPEX is not available -61
Observations’ sector (GICS 2-digits) information is not available -189
Final Sample 3,194
Table 3.4 summarizes the distribution of sample across countries, sectors and the year of EU
ETS reporting. Our final sample includes firms from 47 countries. The USA6 is leading country
with 812 observations having installations covered under the EU ETS, followed by the UK
with 481 observations. Our sample includes observations from the EU ETS member states and
firms domiciled outside the member states, but their installations are situated within the
member states and covered by the system. In the sample materials sector has the large number
of observations i.e. 727, followed by industrials and consumer staples sectors with observations
of 646 and 374, respectively.
6 Though these firms are headquartered out of the EU ETS member states, their installations are in the member
states and covered by the system. However, we exclude the observations from the USA with some other countries
to make sure that our results are robust and are not biased towards a specific country.

Chapter 3: Do EP improve financial resilience of firms after emission disclosure
80
Table 3.4: Sample distribution by country, sector and year
Country Average EPI N Country Average EPI N
1 USA 70.46 812 25 Portugal 78.6 18
2 UK 77.85 481 26 Turkey 58.56 14
3 Germany 80.54 347 27 Hungary 71.98 13
4 France 72.79 282 28 Ireland 76.51 13
5 Italy 76.85 133 29 Taiwan 65.11 13
6 Japan 73.21 123 30 Morocco 53.5 11
7 Finland 77.21 93 31 Czech Republic 81.76 10
8 Spain 81.02 86 32 Philippines 46.96 10
9 Sweden 79.19 68 33 Thailand 56.18 10
10 Switzerland 87.75 64 34 Colombia 53.42 9
11 Austria 78.98 63 35 Malaysia 61.34 9
12 Denmark 77.77 54 36 Peru 47.42 9
13 Korea 64.8 52 37 Brazil 56.16 8
14 Netherlands 77.77 48 38 Indonesia 44.1 8
15 Belgium 68.05 42 39 Chile 72.14 7
16 Canada 75.61 37 40 Singapore 83.28 7
17 Greece 74.29 37 41 New Zealand 79.31 4
18 Norway 79.91 32 42 Russia 53.32 4
19 Mexico 56.25 30 43 UAE 72.02 4
20 Australia 80.75 27 44 China 43 3
21 India 45.01 26 45 Israel 69.9 3
22 Poland 70.87 23 46 Egypt 61.11 1
23 South Africa 54.55 23 47 Romania 48.59 1
24 Hong Kong 47.07 22
Sector Name Year
Communication Services 47 2005 135
Consumer Discretionary 300 2006 165
Consumer Staples 374 2007 204
Energy 265 2008 257
Financials 126 2009 269
Health Care 256 2010 287
Industrials 646 2011 349
Information Technology 108 2012 405
Materials 727 2013 419
Real Estate 24 2014 170
Utilities 321 2015 421
2016 113
Total 3,194 Total 3,194
This table includes the number of observations available for analysis distributed by country, GICS two-digits sector, and
year. EPI represents country’s Environmental Performance Index scores.

Chapter 3: Do EP improve financial resilience of firms after emission disclosure
81
Summary statistics and correlation matrix are presented in table 3.5. Financial data are
collected from Worldscope. To mitigate the impact of extreme values, financial data are
winsorized at1 and 99% level. On average, our sample firms’ carbon intensity is equal to 287.15
tonnes per million dollars of revenues. As some observations are censored due to non-recovery
within their prescribed time window, we do not include the flexibility variable in the table.
Their descriptive statistics will not portray actual values because of censored observations.
However, we present the statistics of the probability of recovery variable. Probability of
recovery is equal to 1 if a firm is recovered within a time window, and zero if not. The average
of this variable explains the ratio of recovered to total number of observations within a time
window. Though we run our tests on different time windows, we present statistics of the
probability of recovery captured only in 120 days’ time window. As shown in the table,
probability of recovery (Prob. Recov) has an average equal to .58. This indicate that within the
time window of 120 days only 58% of observations recovered. Whereas, probability of
recovery has a significantly negative correlation with the carbon intensity (Log CI) of firm.
Among control variables, probability of recovery has negative and significant correlation with
firm size and leverage (DA), whereas, positive and significant correlation with research and
development expenditures (RD).
Our sample include firms from 47 countries with an average EPI of .74 scores. On average,
firms’ size is equal to €14.8 billion. Book to market ratio has an average of .68. On average,
sample firms have invested 2% of their revenues in R&D and 5% of their assets in capital
expenditures. The average of debt to asset ratio is equal to .28. On average, sales growth is
equal to 4%, whereas, the average funds from operations ratio with net sale is equal to 15%.

Chapter 3: Do EP improve financial resilience of firms after emission disclosure
82
Table 3.5: Summary statistics and correlation matrix
Variable Mean Median S.D 1 2 3 4 5 6 7 8 9 10
1 Prob.
Recov
.58 1 .49 1
2 Sever. Loss 13.33 10.4 11.79 -0.64*** 1
3 Log CI 5.66 5.69 1.43 -0.07*** 0.12*** 1
4 EPI .74 .76 .09 -0.03 -0.06*** -0.12*** 1
5 SIZE 16.51 16.48 1.57 -0.04* -0.01 -0.29*** 0.03 1
6 BM .68 .56 .53 -0.00 0.16*** 0.12*** 0.07*** 0.08*** 1
7 CF .15 .12 .11 0.02 -0.10*** -0.04* -0.05** 0.08*** -0.19*** 1
8 DA .28 .27 .14 -0.05** 0.05** 0.10*** -0.07*** 0.07*** 0.02 -0.01 1
9 SG .04 .03 .17 -0.02 0.03 -0.03 -0.09*** -0.01 -0.16*** 0.11*** -0.03 1
10 RD .02 0 .04 0.04* -0.09*** -0.35*** 0.07*** 0.09*** -0.17*** 0.17*** -0.20*** 0.03 1
11 CAPEX .05 .04 .04 -0.02 0.05** 0.30*** -0.08*** -0.16*** -0.09*** 0.24*** -0.03 0.11*** -0.15***
Observations 3194
Prob. Recov represents the probability of recovery within an observation time window of 120 days, i.e. if a firm
is recovered (=1) or not (=0) within the observation time window. Sever. Loss represent the percentage of
maximum share price loss within the observation window of 120 days. Log CI represents the log-transformed
carbon intensity of firm. EPI measure country-level environmental performance index score. SIZE is the natural
log firm’s total assets. BM is book-to-market ratio. ROA measures return on assts. RD represents R&D
expenditures divided by firm’s revenues. CAPEX is ratio of capital expenditure with firm’s total assets. DA
represents debt to assets ratio. SG measures firm’s sales growth. CF represents the ratio of funds from operation
with firm’s revenues.
3.4. Results
3.4.1. Univariate tests
Before conducting the regression analysis, we perform some univariate tests to have a better
understanding of the relationship between carbon intensity and financial flexibility of firm. As
there is a substantial portion of observations that did not recover within the observation
windows, it gives us the opportunity to check whether carbon intensity of firm play any role in
the probability of firm’s recovery. For this purpose, we split our sample into two groups based
on the carbon intensity of firms, i.e. high CI group if firms carbon intensity is higher than
median, otherwise low CI groups. We conduct the two-sample t-test through different time
windows starting from 10 to 180 days. Here we find that, on average, low CI group has a higher
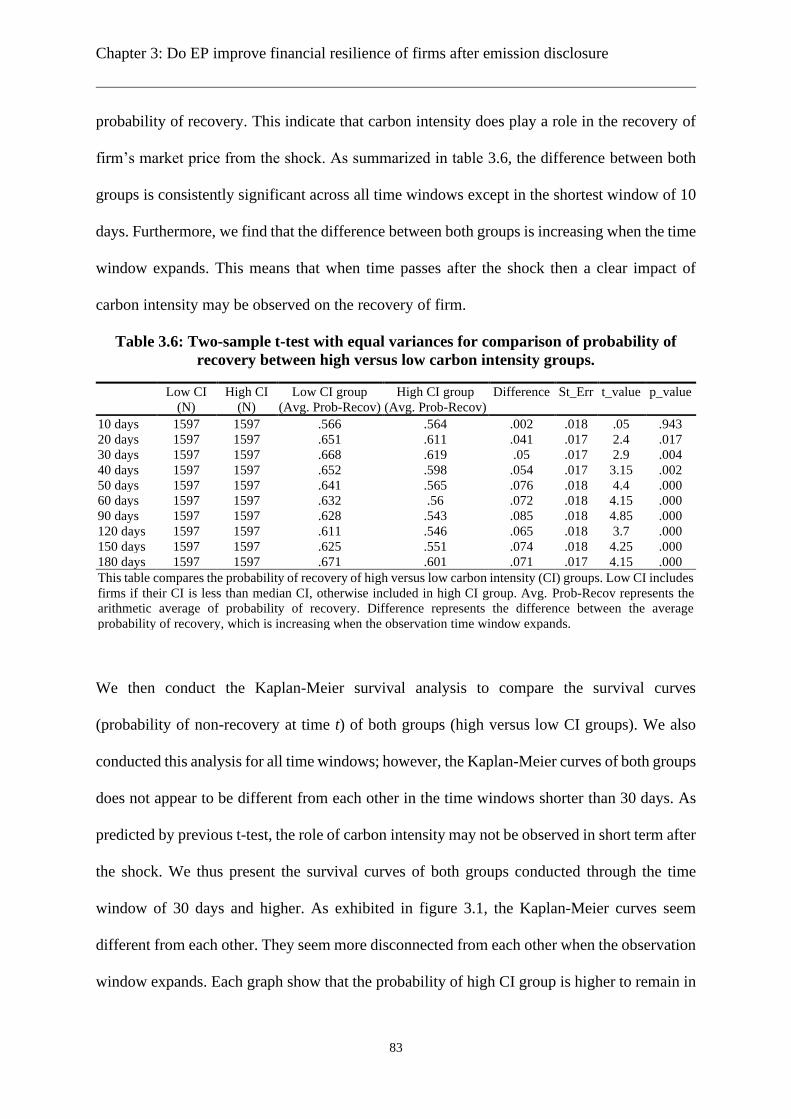
Chapter 3: Do EP improve financial resilience of firms after emission disclosure
83
probability of recovery. This indicate that carbon intensity does play a role in the recovery of
firm’s market price from the shock. As summarized in table 3.6, the difference between both
groups is consistently significant across all time windows except in the shortest window of 10
days. Furthermore, we find that the difference between both groups is increasing when the time
window expands. This means that when time passes after the shock then a clear impact of
carbon intensity may be observed on the recovery of firm.
Table 3.6: Two-sample t-test with equal variances for comparison of probability of
recovery between high versus low carbon intensity groups.
Low CI
(N)
High CI
(N)
Low CI group
(Avg. Prob-Recov)
High CI group
(Avg. Prob-Recov)
Difference St_Err t_value p_value
10 days 1597 1597 .566 .564 .002 .018 .05 .943
20 days 1597 1597 .651 .611 .041 .017 2.4 .017
30 days 1597 1597 .668 .619 .05 .017 2.9 .004
40 days 1597 1597 .652 .598 .054 .017 3.15 .002
50 days 1597 1597 .641 .565 .076 .018 4.4 .000
60 days 1597 1597 .632 .56 .072 .018 4.15 .000
90 days 1597 1597 .628 .543 .085 .018 4.85 .000
120 days 1597 1597 .611 .546 .065 .018 3.7 .000
150 days 1597 1597 .625 .551 .074 .018 4.25 .000
180 days 1597 1597 .671 .601 .071 .017 4.15 .000
This table compares the probability of recovery of high versus low carbon intensity (CI) groups. Low CI includes
firms if their CI is less than median CI, otherwise included in high CI group. Avg. Prob-Recov represents the
arithmetic average of probability of recovery. Difference represents the difference between the average
probability of recovery, which is increasing when the observation time window expands.
We then conduct the Kaplan-Meier survival analysis to compare the survival curves
(probability of non-recovery at time t) of both groups (high versus low CI groups). We also
conducted this analysis for all time windows; however, the Kaplan-Meier curves of both groups
does not appear to be different from each other in the time windows shorter than 30 days. As
predicted by previous t-test, the role of carbon intensity may not be observed in short term after
the shock. We thus present the survival curves of both groups conducted through the time
window of 30 days and higher. As exhibited in figure 3.1, the Kaplan-Meier curves seem
different from each other. They seem more disconnected from each other when the observation
window expands. Each graph show that the probability of high CI group is higher to remain in

Chapter 3: Do EP improve financial resilience of firms after emission disclosure
84
the same state of non-recovery than the low CI group. This indicates that low carbon-intensive
firms experience a quicker recovery as compared to carbon-intensive firms. This finding is in
line with the results of previous mean comparison matched t-test.
Figure 3.1: Kaplan-Meier survival estimates for high versus low CI groups
This figure shows the Kaplan-Meier curves for high and less CI groups. High CI group include firms if their CI
is higher than the median CI, otherwise include in less CI group. X-axis shows the analysis time, and y-axis shows
the probability to remain in same state of non-recovery. High probability shows less resiliency. High CI group
has comparatively high probability to remain in the same state of non-recovery.
Finally, we test the statistical significance of the difference of survival functions of both groups
by conducting the Log-rank test for equality of survivor functions. The results, presented in
table 3.7, show that the survival function of high and low CI groups is significantly different
from each other across all observation windows. This test suggests that if both groups had a
same survivor function, then high CI group would have experienced more recovery events.
However, they experienced less recovery event than the events expected. This test confirms
statistically the evidence exhibited by the Kaplan-Meier curves.
These preliminary univariate tests are so far supporting our hypothesis, showing that carbon
intensity of firms mitigates the financial flexibility of firm against the shock triggered by the

Chapter 3: Do EP improve financial resilience of firms after emission disclosure
85
publication of verified emission. Furthermore, we find that a significant role of carbon intensity
can be observed when time frame after the shock expands. A significant role of carbon intensity
may not be observed in a short run after the event.
Table 3.7: Log-rank test for equality of survivor functions for high versus low CI
groups
Less CI group _ High CI group _
Window Total
Events
Events
observed
Events
expected
Events
observed
Events
expected
Chi square p-value
30 days 2055 1067 1009.14 988 1045.86 6.89 .009
60 days 1903 1009 920.73 894 982.27 16.92 .000
90 days 1871 1003 896.36 868 974.64 24.86 .000
120 days 1847 975 891.22 872 955.78 15.45 .000
150 days 1878 998 901.56 880 976.44 20.1 .000
180 days 2031 1072 969.59 959 1061.41 20.94 .000
This table shows statistical significance of the difference of survivor functions. p-value is less than 0.01, clearly
indicating that both groups based on carbon intensity have significantly different survivor functions.
3.4.2. Main results - survival analysis model
Link between carbon intensity and firm’s financial flexibility
We are examining the role of firm’s carbon intensity in building the financial flexibility of firm
against the shock triggered by a regulatory requirement of the publication of verified emission.
We run the Cox PH model, as a baseline model, on different observational windows ranging
from 30 to 180 trading days. In the analysis, we include some control variables and dummies
for sectors. The results are summarized in table 3.8. Each column presents the results of Cox
model for each time window. The coefficients instead of hazard rates and the robust standard
errors in parentheses are presented for each variable. The coefficient of carbon intensity is
consistently negative and significant across all time windows, indicating that carbon intensity
reduces firm’s ability to cope with the shock triggered by the publication of verified emissions.
Hence, carbon intensity reduces the financial flexibility of firm in this setting. The coefficient
of carbon intensity is also decreasing until the time window of 150 days, suggesting that the
negative impact of carbon intensity on firm’s flexibility is increasing with the passage of time

Chapter 3: Do EP improve financial resilience of firms after emission disclosure
86
after the publication of verified emissions. The hazard rate can be obtained by exponentiating
the coefficients. For instance, the coefficient of CI in the time window of 120 days is equal to
-0.119, thus its hazard rate is equal to 0.89. In terms of hazard rates, it can be interpreted as a
one-unit increase in CI decreases the probability of recovery by (1 – 0.89) × 100 = 11%.
To mitigate the role of other events in the relationship, we also run this test on time windows
of 10 and 20 days and found the same significant and negative association of carbon intensity
with the likelihood of firm’s market price recovery. However, in line with the univariate tests,
the coefficient of carbon intensity is smaller in short term after the shock. This indicate that a
material impact of carbon intensity cannot be observed in a short period after the shock.
The results also reveal that the coefficient of EPI (country-level environmental standards) is
significantly positive in the first observation windows. However, its coefficient becomes
negative within expanded time windows of 90 and 120 days. Control variables does not show
consistently significant association with firm’s recovery across all time windows. Firm’s size
shows a negative and significant association with recovery in some windows. Indicating that
larger firms are more penalized by the publication of verified emissions and takes more time
to recover. In a 30 days’ time window, book-to-market (BM) show a positive link with
recovery, however, the link becomes negative in a time window of 120 days. Firm’s leverage
(DA) also show a negative and significant link with firm’s recovery in a time window of 120
days. Similarly, sales growth also shows a negative and significant association with firm’s
recovery in some time windows.
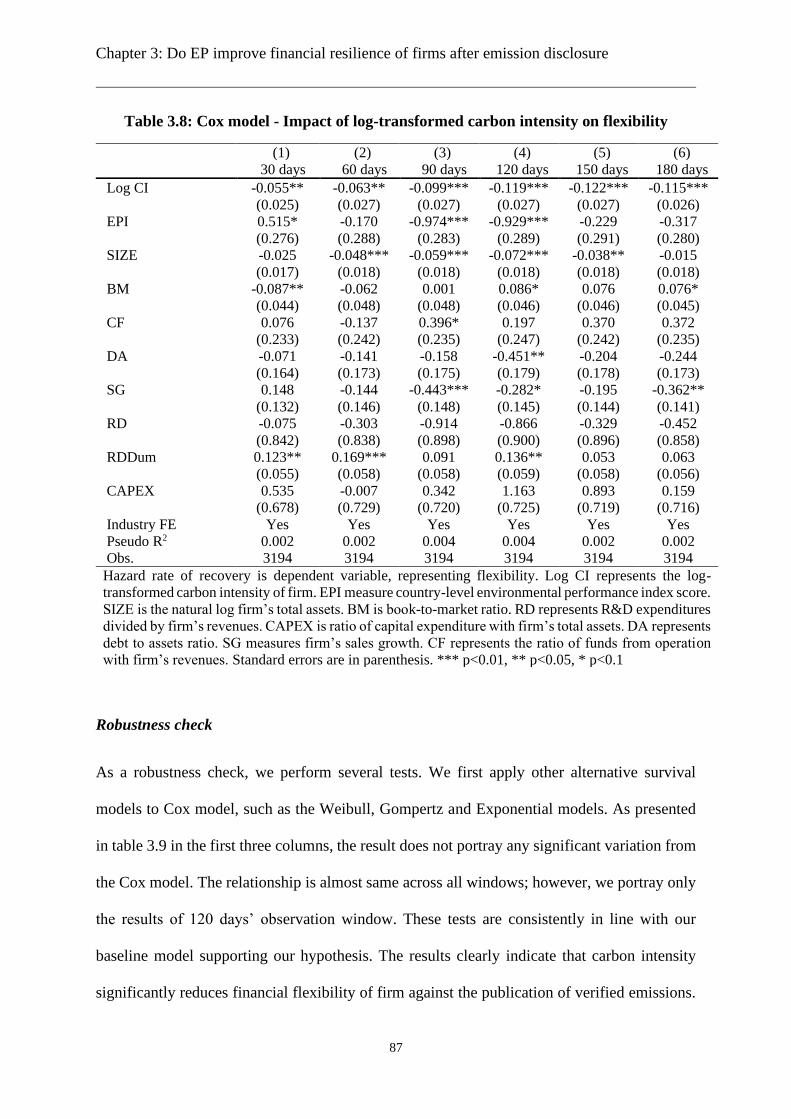
Chapter 3: Do EP improve financial resilience of firms after emission disclosure
87
Table 3.8: Cox model - Impact of log-transformed carbon intensity on flexibility
(1) (2) (3) (4) (5) (6)
30 days 60 days 90 days 120 days 150 days 180 days
Log CI -0.055** -0.063** -0.099*** -0.119*** -0.122*** -0.115***
(0.025) (0.027) (0.027) (0.027) (0.027) (0.026)
EPI 0.515* -0.170 -0.974*** -0.929*** -0.229 -0.317
(0.276) (0.288) (0.283) (0.289) (0.291) (0.280)
SIZE -0.025 -0.048*** -0.059*** -0.072*** -0.038** -0.015
(0.017) (0.018) (0.018) (0.018) (0.018) (0.018)
BM -0.087** -0.062 0.001 0.086* 0.076 0.076*
(0.044) (0.048) (0.048) (0.046) (0.046) (0.045)
CF 0.076 -0.137 0.396* 0.197 0.370 0.372
(0.233) (0.242) (0.235) (0.247) (0.242) (0.235)
DA -0.071 -0.141 -0.158 -0.451** -0.204 -0.244
(0.164) (0.173) (0.175) (0.179) (0.178) (0.173)
SG 0.148 -0.144 -0.443*** -0.282* -0.195 -0.362**
(0.132) (0.146) (0.148) (0.145) (0.144) (0.141)
RD -0.075 -0.303 -0.914 -0.866 -0.329 -0.452
(0.842) (0.838) (0.898) (0.900) (0.896) (0.858)
RDDum 0.123** 0.169*** 0.091 0.136** 0.053 0.063
(0.055) (0.058) (0.058) (0.059) (0.058) (0.056)
CAPEX 0.535 -0.007 0.342 1.163 0.893 0.159
(0.678) (0.729) (0.720) (0.725) (0.719) (0.716)
Industry FE Yes Yes Yes Yes Yes Yes
Pseudo R2 0.002 0.002 0.004 0.004 0.002 0.002
Obs. 3194 3194 3194 3194 3194 3194
Hazard rate of recovery is dependent variable, representing flexibility. Log CI represents the log-
transformed carbon intensity of firm. EPI measure country-level environmental performance index score.
SIZE is the natural log firm’s total assets. BM is book-to-market ratio. RD represents R&D expenditures
divided by firm’s revenues. CAPEX is ratio of capital expenditure with firm’s total assets. DA represents
debt to assets ratio. SG measures firm’s sales growth. CF represents the ratio of funds from operation
with firm’s revenues. Standard errors are in parenthesis. *** p<0.01, ** p<0.05, * p<0.1
Robustness check
As a robustness check, we perform several tests. We first apply other alternative survival
models to Cox model, such as the Weibull, Gompertz and Exponential models. As presented
in table 3.9 in the first three columns, the result does not portray any significant variation from
the Cox model. The relationship is almost same across all windows; however, we portray only
the results of 120 days’ observation window. These tests are consistently in line with our
baseline model supporting our hypothesis. The results clearly indicate that carbon intensity
significantly reduces financial flexibility of firm against the publication of verified emissions.

Chapter 3: Do EP improve financial resilience of firms after emission disclosure
88
As each firm repeatedly appears in the analysis for different years, therefore, a random effect
at firm level may affect the results. For instance, some firms may have learned from their
experience in the beginning of the EU ETS and may be able to manage the crisis easily. We
thus test the results for the existence of a random effect by making the groups of firm’s
observations. We specifically test for the existence of shared-frailty at firm level in our
analysis. Shared-frailty model tests for the existence of within-group correlation. By running
the shared-frailty Weibull model, we find that our results do not have the issue of shared frailty,
indicating that we can rely on our previous results obtained from standard survival-analysis
models.
Secondly, we use the probability of recovery variable as a dependent variable which is equal
to 1 if the firm is recovered within a specified time window, or zero otherwise. This variable
allows us to apply the Probit model. The results, as depicted in the fourth column of table 3.9,
are in line with our previous results. Log-transformed carbon intensity therefore decreases the
probability of firm’s market price recovery. Thirdly, following DesJardine et al. (2017)’s
measure of financial stability i.e. “severity of loss”, we use it to find whether the carbon
intensity of firms increases their severity of market price loss. As stated by DesJardine et al.
(2017), the severity of loss and time to recovery capture the duality of both financial stability
and flexibility. Thus, a smaller loss in firm market price will enable firm to recover faster from
the shock. Severity of loss represents the absolute change in firm market price between the
closing price before the publication of verified emission and the minimum value within their
prescribed observational window. As the severity of loss can be calculated for the censored
observations as well, therefore, we can use the conventional OLS model to examine the link
between carbon intensity and severity of loss. The results are presented in fifth column of table
3.9, clearly indicate that carbon intensity significantly increase the severity of firm’s market
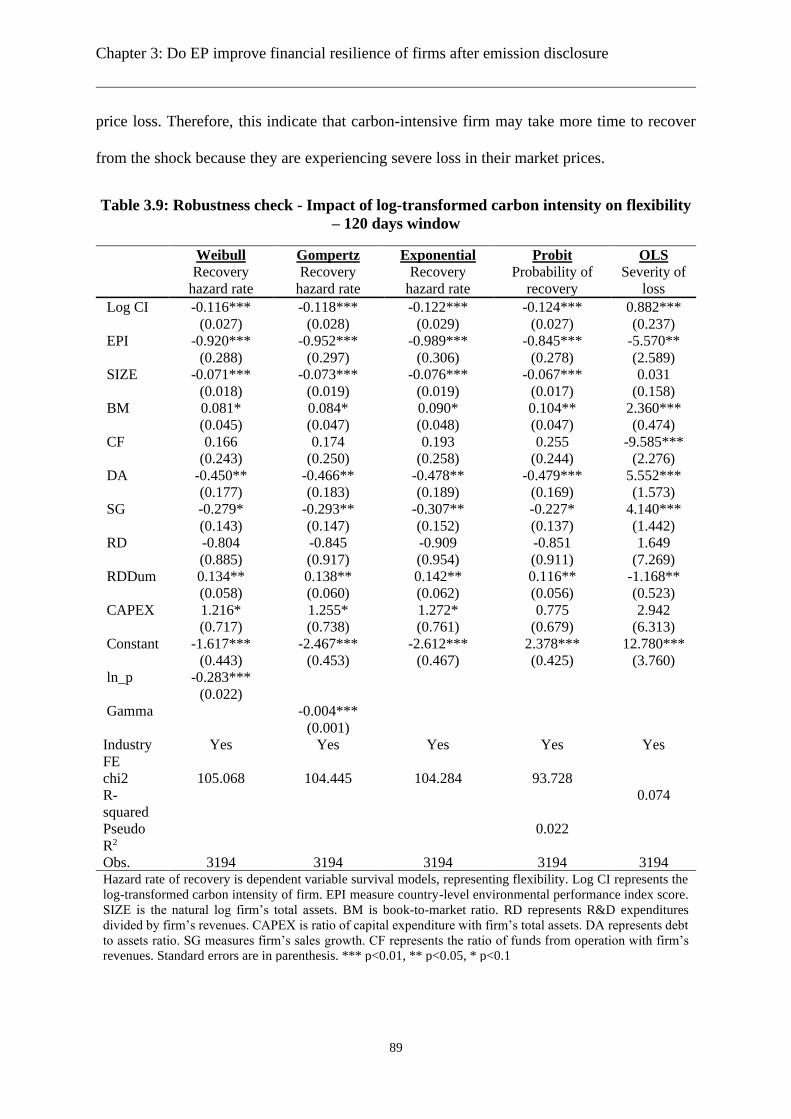
Chapter 3: Do EP improve financial resilience of firms after emission disclosure
89
price loss. Therefore, this indicate that carbon-intensive firm may take more time to recover
from the shock because they are experiencing severe loss in their market prices.
Table 3.9: Robustness check - Impact of log-transformed carbon intensity on flexibility
– 120 days window
Weibull Gompertz Exponential Probit OLS
Recovery
hazard rate
Recovery
hazard rate
Recovery
hazard rate
Probability of
recovery
Severity of
loss
Log CI -0.116*** -0.118*** -0.122*** -0.124*** 0.882***
(0.027) (0.028) (0.029) (0.027) (0.237)
EPI -0.920*** -0.952*** -0.989*** -0.845*** -5.570**
(0.288) (0.297) (0.306) (0.278) (2.589)
SIZE -0.071*** -0.073*** -0.076*** -0.067*** 0.031
(0.018) (0.019) (0.019) (0.017) (0.158)
BM 0.081* 0.084* 0.090* 0.104** 2.360***
(0.045) (0.047) (0.048) (0.047) (0.474)
CF 0.166 0.174 0.193 0.255 -9.585***
(0.243) (0.250) (0.258) (0.244) (2.276)
DA -0.450** -0.466** -0.478** -0.479*** 5.552***
(0.177) (0.183) (0.189) (0.169) (1.573)
SG -0.279* -0.293** -0.307** -0.227* 4.140***
(0.143) (0.147) (0.152) (0.137) (1.442)
RD -0.804 -0.845 -0.909 -0.851 1.649
(0.885) (0.917) (0.954) (0.911) (7.269)
RDDum 0.134** 0.138** 0.142** 0.116** -1.168**
(0.058) (0.060) (0.062) (0.056) (0.523)
CAPEX 1.216* 1.255* 1.272* 0.775 2.942
(0.717) (0.738) (0.761) (0.679) (6.313)
Constant -1.617*** -2.467*** -2.612*** 2.378*** 12.780***
(0.443) (0.453) (0.467) (0.425) (3.760)
ln_p -0.283***
(0.022)
Gamma -0.004***
(0.001)
Industry
FE
Yes Yes Yes Yes Yes
chi2 105.068 104.445 104.284 93.728
R-
squared
0.074
Pseudo
R2
0.022
Obs. 3194 3194 3194 3194 3194 Hazard rate of recovery is dependent variable survival models, representing flexibility. Log CI represents the
log-transformed carbon intensity of firm. EPI measure country-level environmental performance index score.
SIZE is the natural log firm’s total assets. BM is book-to-market ratio. RD represents R&D expenditures
divided by firm’s revenues. CAPEX is ratio of capital expenditure with firm’s total assets. DA represents debt
to assets ratio. SG measures firm’s sales growth. CF represents the ratio of funds from operation with firm’s
revenues. Standard errors are in parenthesis. *** p<0.01, ** p<0.05, * p<0.1

Chapter 3: Do EP improve financial resilience of firms after emission disclosure
90
Table 3.10: Robustness check: Excluding the country-level sample bias in the link
between carbon intensity and flexibility – 120 days window
Excluding observations from the USA and
other countries with observation less than 20
Observations from the USA and other
countries with observations less than 20
Cox Model OLS Model Probit Model Cox Model OLS
Model
Probit Model
Recovery
hazard rate
Severity of
loss
Probability of
recovery
Recovery
hazard rate
Severity of
loss
Probability of
recovery
Log CI -0.103*** 1.115*** -0.112*** -0.174*** 0.769* -0.176***
(0.033) (0.303) (0.032) (0.053) (0.404) (0.054)
EPI 0.276 -16.519*** 0.183 -2.763*** 4.803 -2.563***
(0.411) (3.660) (0.368) (0.510) (4.354) (0.518)
SIZE -0.071*** 0.095 -0.061*** -0.043 -0.284 -0.062
(0.022) (0.192) (0.021) (0.036) (0.322) (0.038)
BM 0.102** 1.696*** 0.114** 0.028 3.824*** 0.076
(0.051) (0.546) (0.053) (0.127) (1.049) (0.127)
CF 0.149 -10.170*** 0.214 0.140 -4.378 0.274
(0.301) (2.675) (0.294) (0.479) (4.469) (0.482)
DA -0.339 5.722*** -0.366* -0.758** 7.686*** -0.736**
(0.225) (2.067) (0.213) (0.326) (2.528) (0.302)
SG -0.328* 4.801*** -0.250 -0.116 2.814 -0.189
(0.176) (1.715) (0.164) (0.271) (2.702) (0.256)
RD -0.702 2.957 -1.176 -2.396 9.207 -1.272
(1.179) (9.536) (1.136) (1.460) (11.531) (1.594)
RDDum 0.091 -0.509 0.071 0.233** -2.683*** 0.190*
(0.071) (0.641) (0.068) (0.113) (0.914) (0.107)
CAPEX 1.650* -4.045 1.215 0.015 9.103 -0.112
(0.861) (7.455) (0.804) (1.472) (12.252) (1.400)
Constant 19.277*** 1.458*** 10.106 3.677***
(4.821) (0.515) (6.934) (0.875)
Industry FE Yes Yes Yes Yes Yes Yes
Pseudo R2 0.003 0.016 0.011 0.059
R2 0.10
Obs. 2193 2193 2193 1001 1001 1001
Country-level sample biasness is checked by running the tests on excluding the USA and other countries with
observations less than 20. Log CI represents the log-transformed carbon intensity of firm. EPI measure country-
level environmental performance index score. SIZE is the natural log firm’s total assets. BM is book-to-market
ratio. RD represents R&D expenditures divided by firm’s revenues. CAPEX is ratio of capital expenditure with
firm’s total assets. DA represents debt to assets ratio. SG measures firm’s sales growth. CF represents the ratio
of funds from operation with firm’s revenues. Standard errors are in parenthesis. *** p<0.01, ** p<0.05, *
p<0.1
Finally, to mitigate the biasness of sample towards a specific country, we run our regression
models by excluding some countries from the analysis. Since there is a substantial number of
observations belonging to the USA-based firms (25% i.e. 812 observations), this may drag the
explanatory power of the model. We thus exclude the observations representing companies
domiciled in the USA. Furthermore, we also exclude other countries that have observations

Chapter 3: Do EP improve financial resilience of firms after emission disclosure
91
less than 20 in the sample. By running the regressions again, as presented in the first three
columns of table 3.10, the relationship is still the same and are in line with the findings of our
baseline model. We also run separate tests on the sample that we excluded before (i.e.
observations from the USA and other countries having observations less than 20). As presented
in the last three columns of table 3.10, the coefficient of carbon intensity is still significant and
in line with our main findings. This indicate that our main findings are not biased towards a
specific country and are highly robust.
Overall, our results thus fully support our hypothesis and are highly robust. We find evidence
that carbon intensity decreases the financial flexibility of firm against the publication of
verified emissions. It appears that these publications point out the latent environmental liability
of carbon-intensive firm. While our results suggest that investors seem highly concerned about
the carbon intensity of firm under the circumstance of the EU ETS. Therefore, market penalizes
carbon-intensive firm and investors seem reluctant to invest in firms with high level of
emissions. Our findings appear to be coherent with the findings of Manchiraju and Rajgopal
(2017), Clarkson et al. (2015), Chapple et al. (2013), arguing that regulations create constraints
for firms. However, firm can outperform in this stringent environment by adopting an effective
carbon-efficient environmental policy. Furthermore, our findings support the notion of the
natural resource-based view (Hart, 1995, Russo and Fouts, 1997) considering environment as
a resource. It seems that environmental activities improve the reputation of firm among
stakeholders. Which then helps them in the time of financial turbulence and neutralizes the
negative effects of a shock, for instance the shock triggered by the disclosure of firm’s
emissions data.
Our finding is seemingly challenging the neoclassical economists view (Friedman, 1970),
according to which managers involvement in the interest of other than shareholders, like

Chapter 3: Do EP improve financial resilience of firms after emission disclosure
92
environmental engagements, may deviate them from their only goal of maximizing
shareholders wealth. However, our results suggest that environmental engagements may
increase firm’s financial flexibility and comply with the joint cause of protecting the
environment. Our findings extends the concept of insurance-like benefits of environmental
engagements (Flammer, 2013), stating that environmental commitments of firm help them to
reduce a negative market reaction to their eco-harmful events. Our findings show that
environmental engagements play a role beyond the insurance-like benefits and makes firm
financially flexible and resilient in general. Which is very crucial for firm’s success in a
turbulent environment (Richtnér and Löfsten, 2014).
3.4.3. Additional tests
Sensitivity to other environmental impact ratios
To have a thorough understanding of the role of firm’s environmental activities in building the
financial flexibility of firm against the publication of verified emission, we also test this link
by using other measures of environmental engagements of firm. As the EU ETS is related
firm’s GHG emissions, we specifically consider the GHG impact of firm in the analysis. We
also consider the “total impact ratio” of firm to check whether firm flexibility is sensitive to
overall environmental performance of firm. Total impact ratio includes firm’s total external
environmental costs scaled with firm revenue. This indicator aggregates firm’s environmental
impacts of natural resources used, amount of waste generated, GHG and pollutants (air, land
and water) generated. We present Cox model results as well as other models as a robustness
check. The relationship is almost the same across all time windows, therefore, we only present
the results of tests run on 120 days’ time window. As reported in table 3.11, both environmental
impact ratios show a negative association with firm recovery. This indicate that market not

Chapter 3: Do EP improve financial resilience of firms after emission disclosure
93
only consider the GHG efficiency relevant but also considers the overall environmental
performance of firm in the context of EU ETS.
Table 3.11: Sensitivity to other measures of carbon intensity – 120 days window
Cox
Model
OLS
Model
Probit
Model
Cox
Model
OLS
Model
Probit
Model
Recovery
hazard rate
Severity of
loss
Probability of
recovery
Recovery
hazard rate
Severity of
loss
Probability of
recovery
Log GHG Impact -0.174*** 2.293*** -0.176***
(0.041) (0.351) (0.039)
Log Total Impact -0.165*** 2.041*** -0.172***
(0.040) (0.344) (0.039)
EPI -1.178*** -0.436 -1.110*** -1.088*** -2.054 -1.029***
(0.304) (2.798) (0.299) (0.298) (2.738) (0.293)
SIZE -0.070*** 0.006 -0.065*** -0.075*** 0.068 -0.070***
(0.018) (0.158) (0.018) (0.018) (0.157) (0.018)
BM 0.084* 2.164*** 0.099** 0.083* 2.215*** 0.099**
(0.046) (0.466) (0.047) (0.046) (0.467) (0.047)
CF 0.137 -8.924*** 0.199 0.185 -9.512*** 0.243
(0.248) (2.279) (0.245) (0.247) (2.277) (0.244)
DA -0.499*** 6.146*** -0.526*** -0.481*** 5.871*** -0.509***
(0.180) (1.573) (0.170) (0.180) (1.573) (0.170)
SG -0.260* 3.892*** -0.202 -0.264* 3.964*** -0.207
(0.145) (1.428) (0.137) (0.145) (1.433) (0.137)
RD -0.711 2.627 -0.653 -0.690 1.807 -0.627
(0.898) (7.222) (0.905) (0.898) (7.211) (0.905)
RDDum 0.141** -1.195** 0.124** 0.162*** -1.441*** 0.145***
(0.059) (0.519) (0.056) (0.059) (0.519) (0.056)
CAPEX 1.101 0.599 0.685 1.036 1.949 0.622
(0.720) (6.247) (0.674) (0.718) (6.224) (0.672)
_cons 10.431*** 2.147*** 10.659*** 2.198***
(3.665) (0.408) (3.696) (0.413)
Industry FE Yes Yes Yes Yes Yes Yes
Pseudo R2 0.004 0.022 0.003 0.021
R2 0.083 0.08
Obs. 3194 3194 3194 3194 3194 3194
Hazard rate of recovery, probability of recover, severity of loss is dependent variable in Cox, Probit, OLS
models representing flexibility, respectively. Log GHG Impact and Log Total Impact are alternative measures
of firm’s carbon intensity, representing the environmental impact of firm. EPI measure country-level
environmental performance index score. SIZE is the natural log firm’s total assets. BM is book-to-market ratio.
RD represents R&D expenditures divided by firm’s revenues. CAPEX is ratio of capital expenditure with firm’s
total assets. DA represents debt to assets ratio. SG measures firm’s sales growth. CF represents the ratio of
funds from operation with firm’s revenues. Standard errors are in parenthesis. *** p<0.01, ** p<0.05, * p<0.1
Sensitivity the carbon intensity of firm’s sector
As different sectors are affecting the natural environment differently, therefore, carbon-
intensive sectors are receiving more scrutiny from stakeholders. We thus test whether carbon
intensity of firm in carbon-intensive sectors affect financial flexibility of firms differently. For

Chapter 3: Do EP improve financial resilience of firms after emission disclosure
94
this purpose, we split the sample into two groups based on the carbon-intensity profile of their
respective sectors. Carbon intensive sectors include energy, industrials, materials, and utilities
sectors, using GICS sector classifications. As expressed in table 3.12, the coefficient of carbon
intensity is significant only for the firms in the carbon-intensive sectors, showing a negative
link with firm’s rate of recovery. This indicate that carbon intensity of firm is receiving more
attention from the market in carbon-intensive sectors. Thus, environmental commitments are
highly important in the sectors that are more affecting the natural environment.
Role of allowance shortage in firm’s financial flexibility
Some firms receive a certain level of free emissions limit under the EU ETS, called allowance.
However, many firms emit beyond that level and eventually buy additional allowances in the
market. We test whether firm emissions beyond the allocated level affects their financial
flexibility. We thus create an indicator variable for this allowance shortage (AS), equal to 1 if
firm’s verified emission is higher than allocation and 0 otherwise. As presented in table 3.13,
our results show that the coefficient of allowance shortage is highly significant and negatively
affecting firm’s recovery.
Analysis across different phases of EU ETS
Finally, we test whether the link between carbon intensity and financial flexibility is changed
with the passage of time. For this purpose, we test the relationship for each phase of the EU
ETS separately. Results are expressed in table 3.14 for each phase separately. Here we find that
carbon intensity significantly reduces the rate of recovery of firm in second and third phases.
However, it does not show any significant association with flexibility in the introductory phase.
As there was over allocation in the first phase and eventually the carbon prices dropped close
to zero (Brouwers et al., 2016). Therefore, environmental performance may not have been
considered important in the first phase. However, a 6.5% reduction in overall allocation was

Chapter 3: Do EP improve financial resilience of firms after emission disclosure
95
evidenced in the second phase. This may have increased attention to the environmental policy
of firm. Therefore, carbon intensity negatively and significantly affects firm flexibility in the
later phases. Furthermore, the impact of CI on firm’s recovery is more severe in second phase
as compare to third phase. As the second phase was revised as compare to the first phase and
more array of industries were included in the system, this may have increased the concerns of
investors about the carbon intensity of firms in second phase. The CI-flexibility relationship is
weak in third phase may be because the carbon prices were substantially dropped nearly to €4
in the third phase7.
7 Source URL: https://ember-climate.org/2016/09/02/eu-carbon-price-falls-below-e4-2/

Chapter 3: Do EP improve financial resilience of firms after emission disclosure
96
Table 3.12: Sensitivity to the carbon-intensity profile of firm’s sector – 120 days window
High carbon intensive sectors Low carbon intensive sectors
Cox Model OLS Model Probit Model Cox Model OLS Model Probit Model
Recovery
hazard rate
Severity of
loss
Probability of
recovery
Recovery
hazard rate
Severity of
loss
Probability of
recovery
Log CI -0.150*** 0.874*** -0.157*** -0.039 0.502 -0.033
(0.034) (0.300) (0.033) (0.054) (0.452) (0.055)
EPI -0.854** -8.568** -0.700** -1.116** 0.155 -1.228**
(0.391) (3.502) (0.347) (0.446) (3.794) (0.479)
SIZE -0.058** 0.053 -0.048** -0.073** -0.167 -0.078**
(0.025) (0.211) (0.022) (0.031) (0.261) (0.032)
BM 0.110* 2.113*** 0.121** 0.088 2.684*** 0.117
(0.059) (0.598) (0.058) (0.075) (0.798) (0.085)
CF 0.165 -8.908*** 0.262 0.430 -11.218*** 0.470
(0.322) (2.794) (0.301) (0.420) (4.215) (0.447)
DA -0.560** 5.448** -0.575** -0.274 5.185** -0.242
(0.249) (2.231) (0.225) (0.273) (2.210) (0.268)
SG -0.043 3.621** -0.025 -0.666*** 4.719* -0.583**
(0.182) (1.762) (0.168) (0.243) (2.567) (0.238)
RD -0.184 -8.413 -0.509 -1.192 7.447 -0.917
(1.541) (12.276) (1.534) (1.118) (9.280) (1.159)
RDDum 0.104 -1.155* 0.072 0.111 -0.636 0.109
(0.074) (0.676) (0.069) (0.106) (0.868) (0.108)
CAPEX 1.058 4.123 0.474 1.282 -2.755 1.378
(0.981) (8.417) (0.840) (1.115) (8.938) (1.194)
Constant 14.662*** 2.210*** 11.913** 2.126***
(5.040) (0.533) (5.606) (0.755)
Industry FE Yes Yes Yes Yes Yes Yes
Pseudo R2 0.003 0.017 0.005 0.026
R2 0.05 0.09
Obs. 3194 3194 3194 3,194 3194 3194
Hazard rate of recovery, probability of recover, severity of loss is dependent variable in Cox, Probit, OLS
models representing flexibility, respectively. Log CI represents the log-transformed carbon intensity of firm.
CI_Sector is an indicator variable, equal to 1 if firm belong to carbon intensive sector. EPI measure country-
level environmental performance index score. SIZE is the natural log firm’s total assets. BM is book-to-market
ratio. RD represents R&D expenditures divided by firm’s revenues. CAPEX is ratio of capital expenditure with
firm’s total assets. DA represents debt to assets ratio. SG measures firm’s sales growth. CF represents the ratio
of funds from operation with firm’s revenues. Standard errors are in parenthesis. *** p<0.01, ** p<0.05, *
p<0.1

Chapter 3: Do EP improve financial resilience of firms after emission disclosure
97
Table 3.13: Link between allocation shortage and flexibility – 120 days window
Cox Model Weibull
Model
Gompertz
Model
Exponential
Model
OLS Model Probit Model
Recovery
hazard rate
Recovery
hazard rate
Recovery
hazard rate
Recovery
hazard rate
Severity of
loss
Probability of
recovery
Log CI -0.142*** -0.140*** -0.144*** -0.149*** 0.939*** -0.143***
(0.037) (0.036) (0.038) (0.039) (0.306) (0.037)
AS -0.279*** -0.279*** -0.289*** -0.300*** 1.867*** -0.249***
(0.067) (0.066) (0.068) (0.071) (0.593) (0.068)
EPI -1.236*** -1.232*** -1.273*** -1.329*** -2.846 -1.193***
(0.349) (0.349) (0.359) (0.371) (3.312) (0.356)
SIZE -0.087*** -0.086*** -0.088*** -0.090*** -0.131 -0.080***
(0.025) (0.025) (0.026) (0.027) (0.214) (0.024)
BM 0.105* 0.099* 0.102* 0.112* 2.153*** 0.137**
(0.057) (0.055) (0.057) (0.060) (0.621) (0.065)
CF 0.224 0.201 0.210 0.228 -9.658*** 0.282
(0.372) (0.369) (0.380) (0.393) (3.318) (0.366)
DA -0.402* -0.406* -0.424* -0.439* 6.317*** -0.433*
(0.234) (0.232) (0.240) (0.249) (2.083) (0.226)
SG -0.415** -0.412** -0.431** -0.453** 3.524* -0.355*
(0.202) (0.202) (0.208) (0.216) (1.894) (0.184)
RD -1.425 -1.401 -1.487 -1.575 7.685 -1.076
(1.168) (1.153) (1.194) (1.247) (9.733) (1.236)
RDDum 0.216*** 0.213*** 0.218*** 0.225*** -0.876 0.188**
(0.081) (0.081) (0.083) (0.086) (0.706) (0.079)
CAPEX 2.028** 2.055** 2.123** 2.199** -0.659 1.690*
(0.920) (0.909) (0.939) (0.977) (8.741) (0.927)
Constant -0.989* -1.814*** -1.958*** 13.537*** 2.889***
(0.584) (0.595) (0.617) (4.996) (0.568)
ln_p -0.287***
(0.028)
Gamma -0.005***
(0.001)
Industry
FE
Yes Yes Yes Yes Yes Yes
Pseudo
R2
0.007 0.039
Chi2 108.232 108.118 106.623 105.627 93.377
R-
squared
0.09
Obs. 1,753 1,753 1,753 1,753 1,753 1,753
Hazard rate of recovery, probability of recover, severity of loss is dependent variable in survival, Probit, OLS
models representing flexibility, respectively. Log CI represents the log-transformed carbon intensity of firm.
AS represents allowance shortage, equals 1 of verified emission is higher than allocated, otherwise 0. EPI
measure country-level environmental performance index score. SIZE is the natural log firm’s total assets. BM
is book-to-market ratio. RD represents R&D expenditures divided by firm’s revenues. CAPEX is ratio of capital
expenditure with firm’s total assets. DA represents debt to assets ratio. SG measures firm’s sales growth. CF
represents the ratio of funds from operation with firm’s revenues. Standard errors are in parenthesis. ***
p<0.01, ** p<0.05, * p<0.1

Chapter 3: Do EP improve financial resilience of firms after emission disclosure
98
Table 3.14: Impact of carbon intensity on flexibility in different phases of EU ETS – 120 days window
Phase 1 _ Phase 2 _ Phase 3 _
Cox Model OLS Model Probit Model Cox Model OLS Model Probit Model Cox Model OLS Model Probit Model
Recovery
hazard rate
Severity of
loss
Probability of
recovery
Recovery
hazard rate
Severity of
loss
Probability of
recovery
Recovery
hazard rate
Severity of
loss
Probability of
recovery
Log CI 0.084 0.285 0.070 -0.211*** 1.919*** -0.199*** -0.074* 0.507 -0.099**
(0.083) (0.686) (0.081) (0.042) (0.397) (0.043) (0.041) (0.320) (0.040)
EPI -0.806 6.701 -0.650 -0.273 4.824 0.011 -1.267*** -9.841*** -1.234***
(0.944) (8.786) (0.906) (0.490) (5.018) (0.489) (0.424) (3.305) (0.383)
SIZE -0.111* -0.355 -0.075 -0.112*** 0.277 -0.102*** -0.040 -0.042 -0.044*
(0.059) (0.389) (0.050) (0.027) (0.248) (0.028) (0.028) (0.232) (0.026)
BM 0.743** -1.336 0.450* -0.131* 4.195*** -0.069 0.140** 1.090* 0.150**
(0.298) (2.324) (0.259) (0.072) (0.801) (0.072) (0.070) (0.574) (0.070)
CF 0.593 -5.684 0.097 -0.279 -7.290* -0.105 0.446 -7.194** 0.500
(0.864) (6.061) (0.835) (0.350) (3.717) (0.376) (0.395) (3.124) (0.360)
DA 0.029 0.278 -0.235 -0.368 7.614*** -0.513* -0.641** 5.143** -0.529**
(0.565) (4.049) (0.515) (0.274) (2.632) (0.280) (0.279) (2.218) (0.246)
SG -0.739 2.471 -0.570 -0.517** 7.351*** -0.440** 0.281 -3.042 0.214
(0.487) (3.740) (0.407) (0.201) (2.230) (0.203) (0.262) (2.020) (0.244)
RD 1.871 -33.562* 2.867 -0.568 9.130 -1.196 -1.673 -1.254 -1.505
(2.862) (18.378) (2.823) (1.322) (12.088) (1.468) (1.441) (10.131) (1.370)
RDDum 0.335* -2.775* 0.270 0.144 -1.394 0.144 0.055 -1.278* 0.020
(0.187) (1.530) (0.168) (0.089) (0.848) (0.089) (0.092) (0.738) (0.085)
CAPEX -0.823 21.288 -0.794 2.489** -14.815 1.706 0.560 0.530 0.224
(2.065) (16.574) (1.947) (1.035) (10.074) (1.070) (1.269) (9.523) (1.059)
Constant 13.954 0.916 -5.052 2.975*** 20.127*** 2.153***
(11.124) (1.232) (6.485) (0.706) (5.188) (0.626)
Industry
FE
Yes Yes Yes Yes Yes Yes Yes Yes Yes
Pseudo R2 0.013 0.042 0.009 0.051 0.004 0.023
R-squared 0.12 0.14 0.06
Obs. 413 413 413 1366 1366 1366 1415 1415 1415
Hazard rate of recovery, probability of recover, severity of loss is dependent variable in Cox, Probit, OLS models representing flexibility, respectively. Log CI represents
the log-transformed carbon intensity of firm. AS represents allowance shortage, equals 1 of verified emission is higher than allocated, otherwise 0. EPI measure country-
level environmental performance index score. SIZE is the natural log firm’s total assets. BM is book-to-market ratio. RD represents R&D expenditures divided by firm’s
revenues. CAPEX is ratio of capital expenditure with firm’s total assets. DA represents debt to assets ratio. SG measures firm’s sales growth. CF represents the ratio of funds
from operation with firm’s revenues. Standard errors are in parenthesis. *** p<0.01, ** p<0.05, * p<0.1

Chapter 3: Do EP improve financial resilience of firms after emission disclosure
99
3.5. Conclusion
Do environmental engagements improve the financial flexibility of firm after carbon emission
disclosure? We investigate the impact of carbon intensity on financial flexibility of firms
against the shock triggered by a regulatory requirement of the publication of verified emission
under the EU ETS. Following Clarkson et al. (2015) we argue that these publications point out
the latent environmental liability of carbon-intensive firm in the form of additional costs of
future compliance or emissions abatement. Eventually, market will negatively adjust the
market value of carbon-intensive firm for this liability. Thus, carbon-intensive firm will bear a
severe loss in market prices and may also take more time to recover from the shock. On the
other hand, carbon-efficient firms may be more financially flexible because they may have less
environmental liabilities and therefore will not experience a severe loss in market value.
Furthermore, carbon-efficient firm may also benefit from their good relations with
stakeholders, based on the instrumental stakeholder theory (Jones, 1995, Donaldson and
Preston, 1995), and the reputation of being eco-friendly among stakeholders, the
Environmental Resource-based view (Hart, 1995, Russo and Fouts, 1997), to neutralize the
negative impact of the shock and recover faster. We thus hypothesize that carbon-intensive
firm are less financially flexible and will take more time for their market price to recover from
the shock triggered by the disclosure of firms’ emissions data.
We take firm’s carbon intensity data from Trucost dataset and measure the financial flexibility
by the duration of market price recovery to the level before the publication of verified
emissions. By applying the Cox model on a sample of 3,194 observations, we find that carbon
intensity significantly increases the duration of firm’s market price recovery, supporting our
hypothesis. We found this relationship highly robust by applying different regression models,
through different time windows, using different measures of flexibility, with the inclusion of

Chapter 3: Do EP improve financial resilience of firms after emission disclosure
100
different variables, and mitigating the sample bias towards a specific country. Our findings are
in line with the concept of insurance-like benefits of environmental activities (Godfrey et al.,
2009) and the environment-as-a resource framework (Flammer, 2013), that environmental
engagements of firms are crucial for firm to survive and thrive in a turbulent environment. We
contribute to the literature in expanding resilience in focusing on its flexibility dimension,
measured as the time to recover from the disclosure.
By using other measures of firm environmental activities, we found the same association. This
indicate that the role of environmental activities in building financial flexibility of firm is not
sensitive to other environmental measures. However, we find that this relationship is sensitive
to carbon-intensity profile of firm’s sector. Carbon-intensity is significantly weakening the
financial flexibility of firm associated with carbon-intensive sectors. Allocation shortage is also
negatively affecting firm’s flexibility. Moreover, the carbon intensity does not mitigate firm
financial flexibility in the beginning phase of the EU ETS, where the carbon prices were very
low, and the allocated level of emission were high. However, it does mitigate flexibility when
the overall allocations were reduced after the first phase. We argue that carbon intensity
deteriorates the flexibility of firm when firm receive more scrutiny for their impact on natural
environment, i.e. from a carbon-intensive sector, and when their emissions bring additional
costs to the firm, i.e. under-allocated firms or after the first phase of the system.
This study has some important practical implication for managers, investors and regulators. As
the findings show that carbon intensity deteriorates financial flexibility, thus besides the
insurance-like benefits, environmental engagements seems to provide a “flexibility effect” too.
This is particularly important for managers. They must know that environmental regulations
are affecting firm subject to the carbon intensity of firm. They can manage this risk through an
effective environmental policy to improve firm’s adaptability and flexibility against the

Chapter 3: Do EP improve financial resilience of firms after emission disclosure
101
turbulence caused by environmental regulations. Portfolio managers and investors must know
that carbon-intensive firms may experience more financial turbulences during regulatory
upheavals. They may outperform in a turbulent environment by investing in carbon-efficient
firms if they foresee stringency in environmental regulations. As the environmental regulations
are still developing and the ETS is spreading across the globe, the implications of this study
will become more and more crucial in future. Furthermore, as sustainability finance is gaining
more attention, responsible investment managers may use the environmental data of firms, to
assess firm’s financial flexibility as well as their role in sustainable development.
Limitations
This study has some limitations that may be addressed in future research. As compare to event
studies, our analysis time windows are long. Therefore, other events may also happen during
that time and may have affected firm performance. Though, we mitigate this issue by testing
the link in shorter time windows of 10 and 20 days and found a significant link. However, it is
important to mention that with an increase in the time window, the relationship between carbon
intensity and duration of firm’s market price recovery is becoming stronger and robust. This
indicate that if other events happened during the analysis time, it has increased the importance
of environmental policy of firm in their financial flexibility. However, we do not know if these
other events are related to the environmental impact of firm or not. Thus, future research may
address this issue by checking whether other events, that are not related to natural environment,
are affecting the role of firm’s environmental performance in their financial flexibility.

102

103
Chapter 4. Do environmentally responsible firms bounce back more
quickly after environmental controversies? International evidence
Abstract
Does environmental performance (EP) increases firm financial resilience against
environmental controversies (EC)? If the stability dimension has gained evidence through
insurance-like benefits effect, we expand preceding literature in considering the whole
spectrum of resilience, including the flexibility dimension measured by the time of recovery,
and in documenting the conditions of the relationship. In line with the environment-as-a-
resource framework, high EP firms should develop environmental skills, competitive
advantage and reputation that fosters stakeholder support. In the case of a controversy, we then
postulate that high EP firms should be more flexible, adapt themselves more easily and
therefore recover more quickly. By performing survival analysis on an international dataset of
233 observations over the 2010-2016 period, we find that prior EP significantly increases both
facets of firms’ financial resilience to the shock caused by environmental controversies. These
findings, in line with the environment-as-a-resource framework, are robust to the inclusion of
different time windows, models and measures of resilience. The relationship, however, is only
significant in environmentally oriented countries, in most polluting industries and for two of
the subcategories of EP, i.e. “emission reduction” and “product innovation”. We therefore
document that firm preparedness and flexibility to cope with environmental controversies rely
more precisely on the use of specific environmental skills developed throughout firm
environmental innovation as well as demanding conditions from both the country
environmental policy and industry scrutiny.
Keywords: Resilience; Environmental Controversies; Environmental Performance; Crisis
Management; Survival Analysis
JEL Classification: G12, M14, O16, Q51

Chapter 4. Do high EP firms bounce back more quickly after environmental controversies
104
4.1. Introduction
The growing concerns about climate change have dramatically increased the pressure on firms
to behave responsibly towards the environment (Flammer, 2013). Firms are more and more
pressured to improve their environmental performance (EP) by greening their operations as
part of their environmental policy, voluntarily or mandatory by law (Zhu and Sarkis, 2004). In
the same time, firms are particularly under the media spotlight and grab investors’ attention in
the cases of controversies (Aouadi and Marsat, 2016). Environmental controversies (henceforth
EC), as negative news stories related to the environmental impact of the firm’s operations, are
therefore of paramount importance for companies’ image and reputation. Moreover, these
adverse events can involve important costs since investors appears increasingly sensitive to
environmental issues. Recently, environmental controversies caused substantial losses in
firms’ share value due to negative investor attention. For instance, Cairn Energy lost almost
21% of its share value within 15 days after the protest from environmental group about its
Arctic exploration plans (The Guardian, published on July 18, 2011). Similarly, protests against
transferring water from a lake to a reservoir caused almost 19% drop in share value within 15
days to Newmont Mining Corp as part of its Conga gold project (Reuters, published on May
30, 2013).
The importance of this issue for companies then leads us to ask whether corporate
environmental policies are moderating the adverse consequences of environmental
controversies. Recently, researchers have focused more precisely on organizational resilience,
which refers to the capacity of a firm to adapt to exogenous shocks such as terrorist attacks,
natural disasters, or financial crises (DesJardine et al., 2017, Ortiz-de-Mandojana and Bansal,
2016, Linnenluecke, 2017, Vogus and Sutcliffe, 2007). We follow DesJardine et al. (2017) in
adopting the definition developed by Gunderson and Pritchard (2002), according to which

Chapter 4. Do high EP firms bounce back more quickly after environmental controversies
105
organizational resilience is “both the ability of a system to persist despite disruptions and the
ability to regenerate and maintain existing organization.” In other words, resilience entails two
dimensions in facing an adverse event, both stability and flexibility (DesJardine et al., 2017,
Ortiz-de-Mandojana and Bansal, 2016).
Concerning the stability aspect of resilience, previous works have underlined that a high EP
appears to enable firms to gain stakeholders legitimacy by meeting their expectations, and thus
enhances the stability of the firm by reducing the risk of a negative investors’ reaction (Bansal
and Clelland, 2004). A strong environmental commitment can provide the so-called insurance-
like benefits in case of negative events (Godfrey et al., 2009). When an eco-friendly firm is
confronted with a negative environmental event, its reputation should indeed be less affected
compared to other firms. Since eco-friendly firms benefits from good stakeholder relations,
stakeholders are more likely to consider the occurrence of a negative environmental event as
an anomaly rather than a usual behavior (Flammer, 2013). Market reaction is thus less negative,
the possible effects induced by such events (boycott, fines, etc.) being expected to be less
important. The firms’ moral capital thus act as an insurance against reputation losses (Flammer,
2013, Shiu and Yang, 2017, Godfrey et al., 2009). Empirical studies find that a strong CSR
commitment mitigates negative investor reactions to legal or regulatory actions (Godfrey et al.,
2009), and has a higher impact on market value for firms with higher litigation risks (Koh et
al., 2014). In this vein, Flammer (2013) shows that market reactions to the announcement of
eco-harmful behavior is less negative for eco-friendly firms.
If these insurance-like benefits of environmental performance (Godfrey et al., 2009) are
interesting and now well documented, little is known to our knowledge about the way firms
bounce back in the following days after the event. As a matter of fact, the mitigation of the
impact of a controversy does not fully explain the time for a company to recover. The bouncing

Chapter 4. Do high EP firms bounce back more quickly after environmental controversies
106
back dimension thus adds to our understanding of the flexibility dimension of resilience. In the
vein of Vogus and Sutcliffe (2007) and DesJardine et al. (2017), we believe that studying more
precisely firm recovery after such an event is of particular interest and may shed the light on
the conditions needed to better adapt to adverse events. In this study, we then contribute to this
literature by assessing whether a high environmental commitment can also improve
organizational flexibility. We assert that firms’ environmental policies lead to the acquisition
of specific resources that allows firm to be more responsive to the stakeholders’ environmental
expectations, enabling them to react more quickly in the event of environmental controversies.
For instance, according to the natural resource-based view, the implementation of
environmental policies improve employees’ skills by increasing the complexity of the
production process (Russo and Fouts, 1997). Additionally, pollution prevention policies foster
a higher interdependency between different firms’ departments.
In short, environmental activities allows firms to develop skills that will be useful in dealing
with and adapting to potential environmental problems in the future. A high EP also increase
the environmental reputation of firms and allows them to gain a stronger support from their
stakeholders, leading to a greater propensity on their part to support the company in the event
of controversies. In line with the “environment-as-a-resource” framework (Flammer, 2013),
we postulate that environmental performance generates competitive resources and skills, as
well as environmental reputation and stronger stakeholder support, that help firms to adapt
towards environmental adverse events. We then hypothesize that EP not only helps firms to
minimize its stock price short term loss, as in preceding studies (Flammer, 2013), but also helps
firms to recover more quickly from the environmental controversy jolt.
Insofar as organizational resilience is not a directly observable variable, we draw inspiration
from the previous literature by measuring the impact of our explanatory variable on resilience

Chapter 4. Do high EP firms bounce back more quickly after environmental controversies
107
through another organizational outcome (DesJardine et al., 2017, Gittell et al., 2006, Ortiz-de-
Mandojana and Bansal, 2016). More precisely, we investigate the impact of EP on resilience
by assessing the time to recovery of a firm’s market price to the level before the environmental
controversy (DesJardine et al., 2017). EP, on the other hand, is measured by the environmental
scores from Thomson Reuters Asset4 and financial variables are drawn from Worldscope. The
sample obtained from merging these databases includes 233 controversies over the 2010-2016
period and we perform both OLS regressions concerning the stability dimension, severity of
loss, and a survival analysis that is best fitted to measure flexibility, as the time of recovery
after a jolt (DesJardine et al., 2017).
Our findings suggest that the firms with high degree of EP are, all else equal, significantly more
resilient against the financial shock caused by environmental controversies. High EP firm not
only experience a lower severity of loss, but also a shorter time and a higher probability to
recover. These results, in line with the environment-as-a-resource framework, are robust to
different time windows and models of resilience. We then try to better understand the
conditions for this main result. By taking environmental performance index scores (EPI) as a
measure of country-level environmental standards, we also show that the link between EP and
resilience is only significant in countries with more stringent environmental standards, where
environmental reputation and stakeholder support are stronger. Besides, the relationship
depends on firm industry. For low polluting industries, EP does not help firm to be more
resilient, whereas it is in the case for high polluting industries. Furthermore, we find that the
two subcategories of EP, i.e. emission reduction and product innovation, have the same effect,
which is positive and significant. The resource reduction category, however, does not show
any significant association with resilience. All in all, these results pinpoint that EP enhances
firm resilience when firms have developed specific environmental skill for flexibility,
throughout innovation and the pressure of states and stakeholders.

Chapter 4. Do high EP firms bounce back more quickly after environmental controversies
108
In this study, we first contribute to the literature in analyzing more precisely the flexibility side
of firm resilience when facing a controversy. If numerous studies tackle the insurance-like
effect of EP and then the stability dimension of resilience, no one to our knowledge, analyses
the way a company recovers and adapts itself in the following days after the controversy. We
try to fill this gap and to extend preceding literature in using a survival analysis methodology.
To the first time to our knowledge, we show that besides the insurance-like effect, EP proves
to help firms to recover more quickly from the shock as well. These results confirms that the
“environment-as-a-resource” framework (Flammer, 2013) also fosters resilience through
higher skills, competitive resources and reputation. From a managerial perspective, investing
in EP cumulates the two interesting facets of resilience. The insurance-like effect, mitigating
the severity of loss, is then interestingly complemented by a flexibility effect, since the
recovery takes less time. Besides, we also contribute to the literature in this field in
documenting when EP more precisely helps firm to face adverse events. We argue that EP
helps firms to recover if they are more prepared for adaptability. Firms in high environmental
standards countries and in high polluting industries are more prone to develop these specific
skills, as well as when they focus on environmental innovation.
The remainder of the paper is organized as follows. The second section presents the hypotheses.
The third section describes data and the method used. The fourth section is dedicated to
empirical results. The last section concludes.
4.2. Literature and Hypothesis
Given growing environmental concerns from a variety of stakeholders, companies and
researchers have become increasingly concerned about understanding the impact of
environmental policies on financial performance. The neo-classical perspective has long been
preponderant, and academics tended to view environmental policies only as a source of
Chapter 4. Do high EP firms bounce back more quickly after environmental controversies
109
additional costs, penalizing the firms’ competitiveness and going against the profit
maximization objective (Palmer et al., 1995). Firms’ environmental commitment is thus
considered as being contrary to the maximization of shareholders’ wealth, which is seen as the
only social responsibility that a company should have (Friedman, 1970, Jensen, 2001). This
theoretical perspective, however, was increasingly questioned, and arguments to demonstrate
the existence of financial benefits for firms to set up environmental policies have strengthened.
As pointed out by Endrikat (2016), the stakeholder theory (Freeman, 1984) and the natural
resource-based view (Hart, 1995, Russo and Fouts, 1997) form the theoretical basis for
postulating a positive relationship between EP and financial performance. Indeed, the
instrumental version of stakeholder theory (Jones, 1995, Donaldson and Preston, 1995)
suggests that building good stakeholder relations can give firms a competitive advantage. For
its part, the natural resource-based view (Hart, 1995, Russo and Fouts, 1997), as an extension
of the resource-based view theory (Wernerfelt, 1984, Barney, 1991), postulates that firms can
gain competitive advantage through the acquisition of rare, valuable, imperfectly imitable and
non-substitutable resources. The natural resource-based view argues that a firm can develop
such resources by addressing environmental issues.
An extensive empirical literature has sought to address the question of the impact of EP on
financial performance. The various meta-analyses conducted on this topic seems to show a
positive relationship (Albertini, 2013, Dixon-Fowler et al., 2013, Endrikat et al., 2014,
Endrikat, 2016). Beyond the impact on financial performance, many benefits to the
implementation of environmental policies have been recently highlighted. For instance, green
firms appear to have easier access to finance (Banerjee et al., 2019, Nandy and Lodh, 2012,
Cheng et al., 2014) and a lower cost of capital (Sharfman and Fernando, 2008, Heinkel et al.,
2001, Gupta, 2018, Chava, 2014). Several event studies also show that the market reacts
immediately and negatively to the release of environmental bad news (Hamilton, 1995,

Chapter 4. Do high EP firms bounce back more quickly after environmental controversies
110
Capelle-Blancard and Laguna, 2010, Flammer, 2013, Krüger, 2015, Endrikat, 2016, Capelle-
Blancard and Petit, 2019), suggesting that investors penalize environmentally irresponsible
behavior. Many academics have sought to move beyond this short-term view to look at the
ability of CSR to increase the value of companies by reducing the risks in the event of a
negative event (Peloza, 2006). EP is then understood as a short-term cost, which can limit the
loss of value due to a negative event affecting the company in the future.
A recent literature tend to show that a high EP provides insurance-like benefits (Flammer,
2013). Indeed, high environmental performance may enable companies to improve their
external stakeholder relationships, and thus to reduce the risk associated with these
relationships (Ambec and Lanoie, 2008). In particular, it may reduce the potential costs
associated with fines and litigation. A high environmental performance also enables companies
to be one step ahead of future environmental regulations, and limit the potential consequences
of poorly anticipating changes that may impact a company's competitiveness. Additionally,
eco-friendly companies are less likely to suffer boycotts from consumers or environmental
NGOs. The green reputation of a high EP seems to offer a protection against reputation losses
and mitigates the potential costs of an environmental controversy. Thus, a high environmental
performance allows firms to improve the stability of the company by complying with the
pressures and expectations of the various stakeholders regarding environmental issues. This EP
outcomes can then be related to organizational resilience, defined as “both the ability of a
system to persist despite disruptions and the ability to regenerate and maintain existing
organization.” (Gunderson and Pritchard, 2002). Organizational resilience is then composed of
two complementary sides: stability and flexibility.
If previous literature seems to demonstrate that EP provides more stability in case of bad
environmental events (Flammer, 2013), to the best of our knowledge, no study has been carried
Chapter 4. Do high EP firms bounce back more quickly after environmental controversies
111
out on the precise impact of EP on organizational adaptability and flexibility in the face of
these events. We hypothesize that a high level of environmental performance makes it easier
to adapt to a controversy in this field. A strong environmental commitment implies that policies
are already in place to cope with environmental externalities. For example, the use of more
environmentally friendly technologies will make production processes more complex, which
will help to increase the skills of employees (Russo and Fouts, 1997). In addition, policies
aiming to prevent pollution require greater employee involvement and coordination between
different departments (Russo and Fouts, 1997). These policies also involve strengthening
relationships with suppliers (Branco and Rodrigues, 2006), which make easier to adapt to the
occurrence of unanticipated events (Ortiz-de-Mandojana and Bansal, 2016). We also argue that
eco-friendly policies aim to address environmental problems, which are complex and urgent in
nature. Thus, confronting these problems allows companies to develop certain organizational
skills that will be useful to them when they find themselves having to deal with a complex
problem again (Orlitzky et al., 2003, Russo and Fouts, 1997, Ortiz-de-Mandojana and Bansal,
2016). Meanwhile, a strong EP allows firms to build a good reputation and gain stronger
support from their stakeholders. In case of environmental controversies, stakeholders will then
be more likely to see this event as an anomaly, and will be more inclined to support the
company, which will lead to greater resilience. These arguments, in line with the environment-
as-a-resource framework (Flammer, 2013), lead us to postulate that in the event of an
environmental controversy, eco-friendly firms have a greater capacity to adapt quickly to the
situation and to deal with it, insofar as these firms benefit from greater support from all of their
stakeholders and that they have capabilites that allow them to be more flexible and to face the
event. As a result, their stock prices as measure of resilience should be less impacted and take
less time to recover to their pre-controversy levels. We therefore postulate:
H1: The higher a firm’s EP, the higher the resilience after an environmental controversy.
Chapter 4. Do high EP firms bounce back more quickly after environmental controversies
112
4.3. Data and methodology
4.3.1. Variables
Following DesJardine et al. (2017), we measure resilience in its two main dimensions. Stability
is proxied through the severity of loss. Severity of loss is computed as the absolute percentage
change in firm market price between the closing price before disclosure of EC and the lowest
market price within the observation window. The adaptation dimension is proxied as the time
to recovery of the daily market price to its previous level after disclosure of EC for an
observation window of 15 trading days. As a robustness check, the analysis is also conducted
on 5, 10, 20, 25, and 30 days’ observational windows.
EC is a controversial news story disclosing the negative impact of a firm’s activities on
environment. We thus manually extract the exact date of each EC from Thomson Reuters’
Asset4 ESG database for each controversy. A firm’s EP is measured by the environmental
dimension score from the Thomson Reuters’ Asset4 ESG dataset. Asset4 is one of the
prominent ESG rating agencies. Every year, Asset4 analyzes thousands of publicly traded firms
based on the three dimensions of CSR i.e. Environmental, Social, and Governance. Asset4 rates
firms from 100 (superior EP) to 0 (poor EP) relative to the peers in their respective industry.
However, in order to normalize the data in the range between 1 and 0, these ratings are divided
by 100. EP is proxied from this dataset in various studies, for instance Cheng et al. (2014),
Eccles et al. (2014) or Shaukat et al. (2015). As Asset4 issues these ratings on an annual basis,
prior year ratings are considered for each controversy to determine its impact on severity of
loss and time to recover after controversy.
It is noteworthy that every country faces pressure from local and international communities to
cope with the problem of climate change. International treaties, such as the agreements of the

Chapter 4. Do high EP firms bounce back more quickly after environmental controversies
113
Rio Earth Summit in 1992, the Millennium Summit in 2000, the World Summit on Sustainable
Development in Johannesburg in 2002, the Paris COP 21, shape a country’s regulations and
governance systems to comply with their environmental policy. Therefore, firms may
customize their environmental policies according to their country-level environmental
standards. We thus include in our analysis the overall EP of a country. A country’s EP is
proxied by the environmental performance index8 (henceforth EPI), also used by Bazillier et
al. (2017) as a proxy for country-level environmental standards. EPI gauges each country in
two broad categories (Environmental Health and Ecosystem Vitality objectives) based on
environmental performance linked to policy targets from 0 to 100.
We also control for other variables likely to have an impact on time to recover after an EC.
Therefore, we include in our models the market to book value ratio (MB), return on assets ratio
(ROA), cash flows from operating activities scaled by net sales (CF), firm size (SIZE)
measured by natural log of a firm’s total assets, leverage (DA) calculated by dividing the total
debts of the firm by its total assets, sales growth (SG) measured by net sales divided by the
previous year’s net sales, research & development expenditure divided by net sales (RD),
capital expenditure (CAPEX) divided by total assets, and stock price momentum
(MOMENTUM). MOMENTUM represents a change in market price in the last three years
before the controversy. A dummy for RD is also included, denoted by RDDUM. RDDUM is
equal to 1 if firms have RD expenditure available in the database, 0 otherwise. These variables
are summarized in table 4.1. Besides these control variables, dummies for industries and
regions are also included. GICS classification (2-digits) is used for each industry.
8 EPI is developed by Yale University, Yale Center for Environmental Law and Policy (YCELP), and Columbia
University, Center for International Earth Science Information Network (CIESIN), in collaboration with the
World Economic Forum and Joint Research Centre (JRC) of the European Commission (2006).
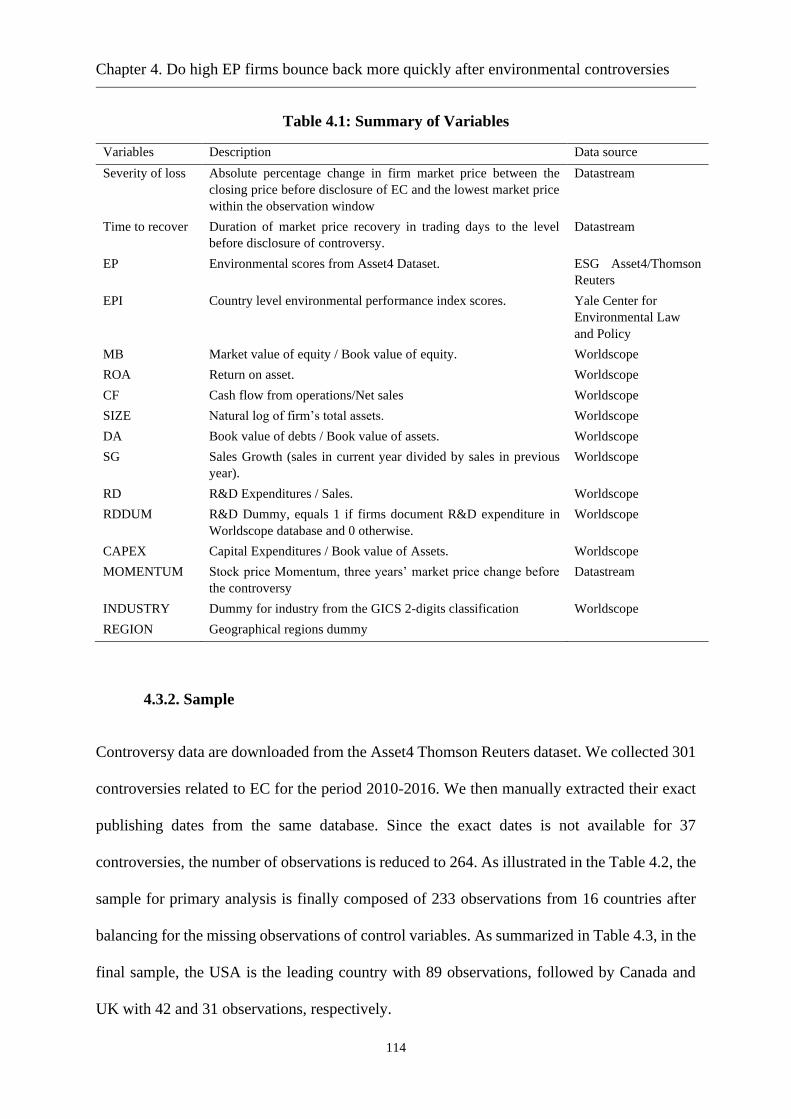
Chapter 4. Do high EP firms bounce back more quickly after environmental controversies
114
Table 4.1: Summary of Variables
Variables Description Data source
Severity of loss Absolute percentage change in firm market price between the
closing price before disclosure of EC and the lowest market price
within the observation window
Datastream
Time to recover Duration of market price recovery in trading days to the level
before disclosure of controversy.
Datastream
EP Environmental scores from Asset4 Dataset. ESG Asset4/Thomson
Reuters
EPI Country level environmental performance index scores. Yale Center for
Environmental Law
and Policy
MB Market value of equity / Book value of equity. Worldscope
ROA Return on asset. Worldscope
CF Cash flow from operations/Net sales Worldscope
SIZE Natural log of firm’s total assets. Worldscope
DA Book value of debts / Book value of assets. Worldscope
SG Sales Growth (sales in current year divided by sales in previous
year).
Worldscope
RD R&D Expenditures / Sales. Worldscope
RDDUM R&D Dummy, equals 1 if firms document R&D expenditure in
Worldscope database and 0 otherwise.
Worldscope
CAPEX Capital Expenditures / Book value of Assets. Worldscope
MOMENTUM Stock price Momentum, three years’ market price change before
the controversy
Datastream
INDUSTRY Dummy for industry from the GICS 2-digits classification Worldscope
REGION Geographical regions dummy
4.3.2. Sample
Controversy data are downloaded from the Asset4 Thomson Reuters dataset. We collected 301
controversies related to EC for the period 2010-2016. We then manually extracted their exact
publishing dates from the same database. Since the exact dates is not available for 37
controversies, the number of observations is reduced to 264. As illustrated in the Table 4.2, the
sample for primary analysis is finally composed of 233 observations from 16 countries after
balancing for the missing observations of control variables. As summarized in Table 4.3, in the
final sample, the USA is the leading country with 89 observations, followed by Canada and
UK with 42 and 31 observations, respectively.
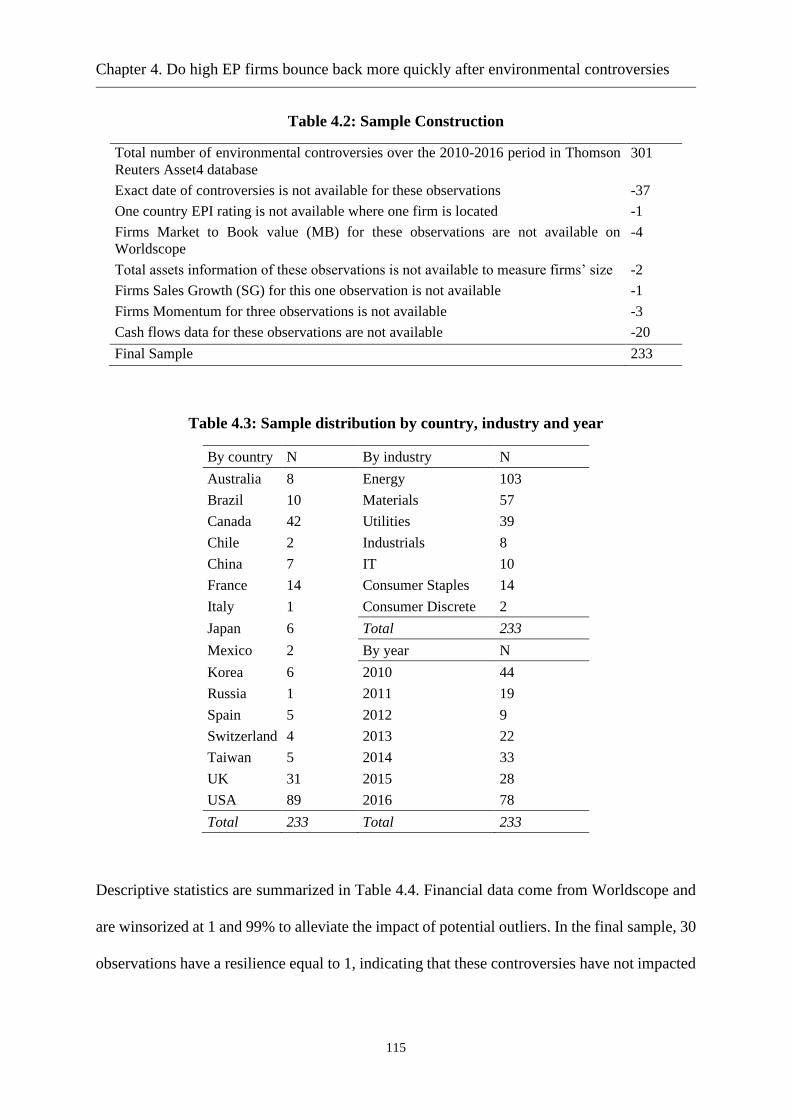
Chapter 4. Do high EP firms bounce back more quickly after environmental controversies
115
Table 4.2: Sample Construction
Total number of environmental controversies over the 2010-2016 period in Thomson
Reuters Asset4 database
301
Exact date of controversies is not available for these observations -37
One country EPI rating is not available where one firm is located -1
Firms Market to Book value (MB) for these observations are not available on
Worldscope
-4
Total assets information of these observations is not available to measure firms’ size -2
Firms Sales Growth (SG) for this one observation is not available -1
Firms Momentum for three observations is not available -3
Cash flows data for these observations are not available -20
Final Sample 233
Table 4.3: Sample distribution by country, industry and year
By country N By industry N
Australia 8 Energy 103
Brazil 10 Materials 57
Canada 42 Utilities 39
Chile 2 Industrials 8
China 7 IT 10
France 14 Consumer Staples 14
Italy 1 Consumer Discrete 2
Japan 6 Total 233
Mexico 2 By year N
Korea 6 2010 44
Russia 1 2011 19
Spain 5 2012 9
Switzerland 4 2013 22
Taiwan 5 2014 33
UK 31 2015 28
USA 89 2016 78
Total 233 Total 233
Descriptive statistics are summarized in Table 4.4. Financial data come from Worldscope and
are winsorized at 1 and 99% to alleviate the impact of potential outliers. In the final sample, 30
observations have a resilience equal to 1, indicating that these controversies have not impacted

Chapter 4. Do high EP firms bounce back more quickly after environmental controversies
116
firm market price negatively 9 . The maximum value of resilience (i.e. 16 working days)
indicates that firm market prices did not recover within the observation window of 15 working
days. Therefore, these observations are censored due to non-recovery; however, the survival
analysis considers the censored observations in the analysis as well. The observations that are
censored (not recovered within 15 days) are equal to 39% (91 observations) of the total sample.
Median resilience is equal to 5 days indicating that at this point the probability of recovery is
equal to 50%. Average resilience is equal to 6.72 days. However, it does not portray the actual
average of recovery because it also reflects the impact of censored values here.
Table 4.4: Summary Statistics
N Mean Median Min P25 P75 Max Skewness Kurtosis
Severity of loss 233 5.02 3.64 0 1.18 6.7 23.15 1.43 4.86
Time to recovery 233 6.72 5 1 1 13 16 0.6 1.77
EP 233 0.77 0.87 0.1 0.71 0.91 0.95 -1.68 4.89
EPI 233 0.7 0.68 0.43 0.68 0.73 0.89 -1.06 5.49
MB 233 1.96 1.53 0.34 1.01 2.27 12.19 3.49 18.41
ROA 233 2.91 3.23 -16.63 0.9 6.53 17.85 -0.95 5.03
CF 233 22.38 18.63 -8.7 13.06 31.04 56.26 0.71 3.04
SIZE 233 17.75 17.81 14.03 16.9 18.91 19.78 -0.47 2.57
DA 233 28.65 25.87 0 18.33 38.48 59 0.33 2.28
SG 233 0.91 0.91 0.49 0.76 1 1.44 0.34 3.05
RD 233 0.46 0 0 0 0.35 10.55 5.85 41.99
RDDUM 233 0.47 0 0 0 1 1 0.11 1.01
CAPEX 233 8.97 8.3 1.32 5.28 11.5 28.46 1.28 5.59
MOMENTUM 233 -0.09 0.06 -2.61 -0.21 0.22 1 -1.98 7.85
Summary statistics of the sample. Resilience is the number of days of market price recovery calculated
within a window of 15 trading days. EP is the environmental performance of firm from Asset4. EPI is
country’s overall environmental performance. MB is the market-to-book value ratio. ROA is firm
profits divided by book value of assets. CF represents cash flows from operation scaled by net sales.
SIZE is the natural of firms’ total assets. DA represents leverage measured as total debts of firms
divided by total assets. SG is the sales growth measured as total sales divided previous year sales. RD
is the research & development expenditure divided by net sales. RDDUM represents dummy for RD
(equals to 1 if firm has RD expenditure, otherwise 0). CAPEX is the capital expenditures divided by
last year total assets. MOMENTUM is previous three years market price change. Financial variables
are winsorized at 1 and 99 % level.
9 Excluding these observations does not affect our results.

Chapter 4. Do high EP firms bounce back more quickly after environmental controversies
117
The EP of firms varies from 0.1 to 0.95 with an average and median of 0.77 and 0.87,
respectively. The environmental performance of countries (EPI) in the sample varies from 0.43
to 0.89. The sample includes a variety of observations based on their MB (mean 1.96), ranges
from 0.34 to 12.19. The average profitability (ROA) of firms is equal to 3.29. On average,
cashflows from operations scaled with net sales is equal to 22.38 percent. The sample includes
firms of different sizes. The total assets of firms (mean $51.14 billion) vary from $1.24 billion
to $389.35 billion. Leverage (DA) and sales in the current year divided by sales in the previous
year (SG) have means equal to 28.65 and 0.91, respectively. Almost 47% of firms have R&D
expenditures in the dataset, with the average RD 0.46% of net sales. The capital expenditures
divided by the last year’s total assets has average and median of 8.97 and 8.3, respectively.
Market price change in the last three years (MOMENTUM) varies from -2.61 to 1.00 with an
average of -0.09.
4.4. Results
4.4.1. EP and resilience after a controversy
We first test whether a high EP allows firms to improve their stability using the severity of loss
as a proxy for the stability dimension of resilience, following DesJardine et al. (2017). In table
4.5, we display three specifications of the OLS regression, model 1 in the first column include
main control variables, model 2 included dummies for industries and model 3 also includes
dummies for geographical regions. We clearly find a negative association between EP and
severity of loss, since an increase in EP decreases the severity of firm’s market price loss. While
considering time windows as reported in table 4.6, if the effect is always significant, it seems
to be more pronounced between 10 and 25 days, and less for very short term (5 days). Overall,
this result adds evidence that a strong environmental commitment mitigates negative investor’s
reactions to EC. A high EP ensures firms’ stability to cope with such negative events,
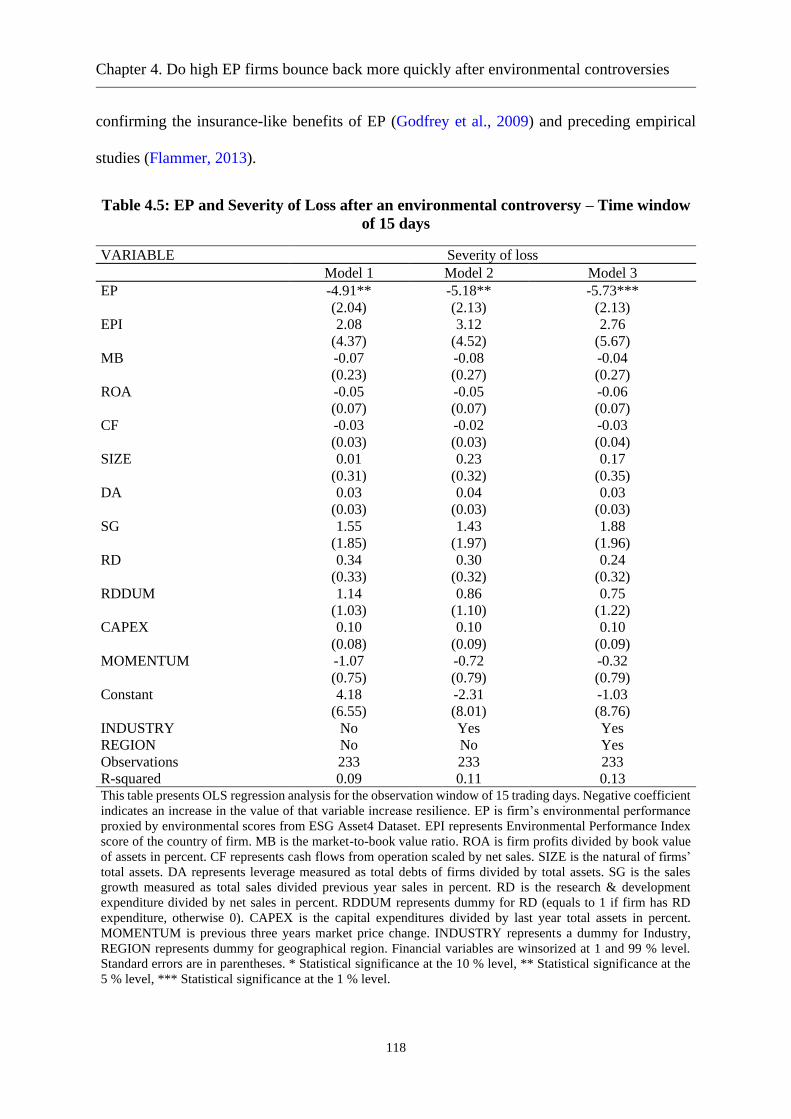
Chapter 4. Do high EP firms bounce back more quickly after environmental controversies
118
confirming the insurance-like benefits of EP (Godfrey et al., 2009) and preceding empirical
studies (Flammer, 2013).
Table 4.5: EP and Severity of Loss after an environmental controversy – Time window
of 15 days
VARIABLE Severity of loss
Model 1 Model 2 Model 3
EP -4.91** -5.18** -5.73***
(2.04) (2.13) (2.13)
EPI 2.08 3.12 2.76
(4.37) (4.52) (5.67)
MB -0.07 -0.08 -0.04
(0.23) (0.27) (0.27)
ROA -0.05 -0.05 -0.06
(0.07) (0.07) (0.07)
CF -0.03 -0.02 -0.03
(0.03) (0.03) (0.04)
SIZE 0.01 0.23 0.17
(0.31) (0.32) (0.35)
DA 0.03 0.04 0.03
(0.03) (0.03) (0.03)
SG 1.55 1.43 1.88
(1.85) (1.97) (1.96)
RD 0.34 0.30 0.24
(0.33) (0.32) (0.32)
RDDUM 1.14 0.86 0.75
(1.03) (1.10) (1.22)
CAPEX 0.10 0.10 0.10
(0.08) (0.09) (0.09)
MOMENTUM -1.07 -0.72 -0.32
(0.75) (0.79) (0.79)
Constant 4.18 -2.31 -1.03
(6.55) (8.01) (8.76)
INDUSTRY No Yes Yes
REGION No No Yes
Observations 233 233 233
R-squared 0.09 0.11 0.13 This table presents OLS regression analysis for the observation window of 15 trading days. Negative coefficient
indicates an increase in the value of that variable increase resilience. EP is firm’s environmental performance
proxied by environmental scores from ESG Asset4 Dataset. EPI represents Environmental Performance Index
score of the country of firm. MB is the market-to-book value ratio. ROA is firm profits divided by book value
of assets in percent. CF represents cash flows from operation scaled by net sales. SIZE is the natural of firms’
total assets. DA represents leverage measured as total debts of firms divided by total assets. SG is the sales
growth measured as total sales divided previous year sales in percent. RD is the research & development
expenditure divided by net sales in percent. RDDUM represents dummy for RD (equals to 1 if firm has RD
expenditure, otherwise 0). CAPEX is the capital expenditures divided by last year total assets in percent.
MOMENTUM is previous three years market price change. INDUSTRY represents a dummy for Industry,
REGION represents dummy for geographical region. Financial variables are winsorized at 1 and 99 % level.
Standard errors are in parentheses. * Statistical significance at the 10 % level, ** Statistical significance at the
5 % level, *** Statistical significance at the 1 % level.
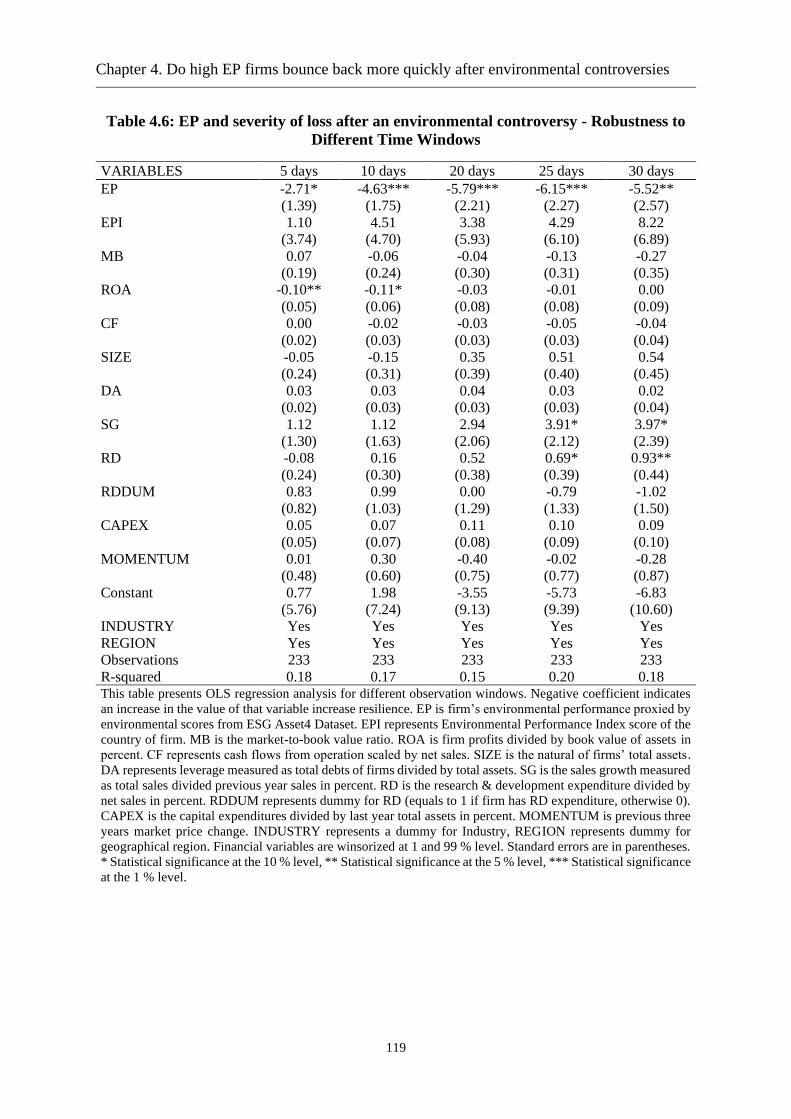
Chapter 4. Do high EP firms bounce back more quickly after environmental controversies
119
Table 4.6: EP and severity of loss after an environmental controversy - Robustness to
Different Time Windows
VARIABLES 5 days 10 days 20 days 25 days 30 days
EP -2.71* -4.63*** -5.79*** -6.15*** -5.52**
(1.39) (1.75) (2.21) (2.27) (2.57)
EPI 1.10 4.51 3.38 4.29 8.22
(3.74) (4.70) (5.93) (6.10) (6.89)
MB 0.07 -0.06 -0.04 -0.13 -0.27
(0.19) (0.24) (0.30) (0.31) (0.35)
ROA -0.10** -0.11* -0.03 -0.01 0.00
(0.05) (0.06) (0.08) (0.08) (0.09)
CF 0.00 -0.02 -0.03 -0.05 -0.04
(0.02) (0.03) (0.03) (0.03) (0.04)
SIZE -0.05 -0.15 0.35 0.51 0.54
(0.24) (0.31) (0.39) (0.40) (0.45)
DA 0.03 0.03 0.04 0.03 0.02
(0.02) (0.03) (0.03) (0.03) (0.04)
SG 1.12 1.12 2.94 3.91* 3.97*
(1.30) (1.63) (2.06) (2.12) (2.39)
RD -0.08 0.16 0.52 0.69* 0.93**
(0.24) (0.30) (0.38) (0.39) (0.44)
RDDUM 0.83 0.99 0.00 -0.79 -1.02
(0.82) (1.03) (1.29) (1.33) (1.50)
CAPEX 0.05 0.07 0.11 0.10 0.09
(0.05) (0.07) (0.08) (0.09) (0.10)
MOMENTUM 0.01 0.30 -0.40 -0.02 -0.28
(0.48) (0.60) (0.75) (0.77) (0.87)
Constant 0.77 1.98 -3.55 -5.73 -6.83
(5.76) (7.24) (9.13) (9.39) (10.60)
INDUSTRY Yes Yes Yes Yes Yes
REGION Yes Yes Yes Yes Yes
Observations 233 233 233 233 233
R-squared 0.18 0.17 0.15 0.20 0.18 This table presents OLS regression analysis for different observation windows. Negative coefficient indicates
an increase in the value of that variable increase resilience. EP is firm’s environmental performance proxied by
environmental scores from ESG Asset4 Dataset. EPI represents Environmental Performance Index score of the
country of firm. MB is the market-to-book value ratio. ROA is firm profits divided by book value of assets in
percent. CF represents cash flows from operation scaled by net sales. SIZE is the natural of firms’ total assets.
DA represents leverage measured as total debts of firms divided by total assets. SG is the sales growth measured
as total sales divided previous year sales in percent. RD is the research & development expenditure divided by
net sales in percent. RDDUM represents dummy for RD (equals to 1 if firm has RD expenditure, otherwise 0).
CAPEX is the capital expenditures divided by last year total assets in percent. MOMENTUM is previous three
years market price change. INDUSTRY represents a dummy for Industry, REGION represents dummy for
geographical region. Financial variables are winsorized at 1 and 99 % level. Standard errors are in parentheses.
* Statistical significance at the 10 % level, ** Statistical significance at the 5 % level, *** Statistical significance
at the 1 % level.

Chapter 4. Do high EP firms bounce back more quickly after environmental controversies
120
Concerning the impact of EP on the flexibility dimension of organizational resilience, we use
the Cox proportional hazard model to assess the relationship between EP and time to recover
after the impact of EC on a firm’s market price. The Cox model predicts the impact of
covariates on the probability of recovery at time t. The relationship can be expressed as :
ℎ𝑖(𝑡|𝑋𝑗) = ℎ0(𝑡) 𝑒 (𝑋𝑗𝛽𝑗
)
Where ℎ𝑖(𝑡) represents the hazard rate of recovery for observation ith and covariate jth. X
represents the list of covariates i.e. EP, EPI, MB, ROA, CF, SIZE, DA, SG, RD, RDDUM,
CAPEX, MOMENTUM, INDUSTRY and REGION. ℎ0(𝑡) is the baseline hazard function,
which the Cox model leaves non-estimated. 𝛽 represents the regression coefficient of its
covariate. A positive sign of 𝛽 indicate a positive link with resilience. We run the model over
different windows between 5 and 30 days to ensure that our results are not sensitive to time
windows.
In the results, as presented in Table 4.7, coefficients are reported rather than hazard rates as
well as standard errors in parentheses for each variable for a time window of 15 days. Model 1
in the first column include main control variables. The coefficient of EP appears to be posititive
and highly significant. In model 2, dummies for industries are included, whereas dummies for
geographical regions are additionally included in model 3. The model 3 includes all the control
variables and dummies and is our baseline model for explanation purposes. A positive sign of
coefficients indicates that a higher value of that variable increases the likelihood of market
price recovery from the shock of EC. Since EP has a positive and significant coefficient, we
find that EP have a negative impact on time for stock market prices to recover after an
environmental controversy. Exponentiation of the coefficient gives the hazard rate of e1.62 =
5.05. In terms of hazard rate, it can be interpreted as a one-unit increase in EP enhances the
probability of recovery by (5.05 - 1) = 4.05 times.

Chapter 4. Do high EP firms bounce back more quickly after environmental controversies
121
Table 4.7: Recovery after an environmental controversy (Cox Proportional Hazard
Regression)
VARIABLES Model 1 Model 2 Model 3
EP 1.49*** 1.66*** 1.62***
(0.51) (0.56) (0.56)
EPI -0.74 -0.76 0.00
(1.09) (1.12) (1.67)
MB -0.18** -0.19** -0.19**
(0.08) (0.09) (0.09)
ROA -0.02 -0.02 -0.02
(0.02) (0.02) (0.02)
CF 0.01* 0.01* 0.01
(0.01) (0.01) (0.01)
SIZE -0.16** -0.17** -0.18**
(0.08) (0.08) (0.09)
DA 0.01 0.01 0.01
(0.01) (0.01) (0.01)
SG -0.47 -0.42 -0.38
(0.50) (0.54) (0.54)
RD -0.22 -0.22 -0.26
(0.16) (0.17) (0.18)
RDDUM 0.21 0.21 0.44
(0.27) (0.28) (0.36)
CAPEX -0.02 -0.01 -0.01
(0.02) (0.02) (0.02)
MOMENTUM 0.09 0.06 0.08
(0.16) (0.17) (0.19)
INDUSTRY No Yes Yes
REGION No No Yes
Pseudo R-squared 0.02 0.02 0.02
Observations 233 233 233 This table presents Cox PH regression analysis for the observation window of 15 trading days. Positive
coefficient indicates an increase in the value of that variable increase resilience. EP is firm’s environmental
performance proxied by environmental scores from ESG Asset4 Dataset. EPI represents Environmental
Performance Index score of the country of firm. MB is the market-to-book value ratio. ROA is firm profits
divided by book value of assets in percent. CF represents cash flows from operation scaled by net sales. SIZE
is the natural of firms’ total assets. DA represents leverage measured as total debts of firms divided by total
assets. SG is the sales growth measured as total sales divided previous year sales in percent. RD is the research
& development expenditure divided by net sales in percent. RDDUM represents dummy for RD (equals to 1 if
firm has RD expenditure, otherwise 0). CAPEX is the capital expenditures divided by last year total assets in
percent. MOMENTUM is previous three years market price change. INDUSTRY represents a dummy for
Industry, REGION represents dummy for geographical region. Financial variables are winsorized at 1 and 99
% level. Standard errors are in parentheses. * Statistical significance at the 10 % level, ** Statistical significance
at the 5 % level, *** Statistical significance at the 1 % level.

Chapter 4. Do high EP firms bounce back more quickly after environmental controversies
122
Table 4.8: Recovery after an environmental controversy : Robustness to Different Time
Windows (Cox Proportional Hazard Regression)
VARIABLES 5 days 10 days 20 days 25 days 30 days
EP 1.10 1.40*** 1.06* 1.42*** 0.88*
(0.71) (0.54) (0.54) (0.53) (0.53)
EPI -0.63 -0.67 -0.33 -1.16 -0.61
(1.42) (1.73) (1.57) (1.74) (1.56)
MB -0.17* -0.24*** -0.10 -0.03 -0.03
(0.10) (0.08) (0.08) (0.08) (0.07)
ROA 0.02 -0.00 -0.02 -0.04** -0.01
(0.02) (0.02) (0.02) (0.02) (0.02)
CF 0.00 0.01 0.02** 0.02*** 0.02**
(0.01) (0.01) (0.01) (0.01) (0.01)
SIZE -0.05 -0.16* -0.07 -0.13 -0.08
(0.11) (0.09) (0.09) (0.08) (0.09)
DA -0.00 0.00 0.01 0.01 0.01
(0.01) (0.01) (0.01) (0.01) (0.01)
SG 0.30 0.14 -0.60 -0.83 -0.54
(0.56) (0.52) (0.55) (0.57) (0.56)
RD -0.36 -0.25 -0.10 -0.21 -0.18
(0.25) (0.18) (0.16) (0.20) (0.19)
RDDUM 0.33 0.10 0.12 0.32 0.05
(0.34) (0.35) (0.33) (0.37) (0.37)
CAPEX -0.01 0.01 -0.00 0.00 0.01
(0.03) (0.02) (0.02) (0.02) (0.02)
MOMENTUM -0.23 -0.07 0.00 0.07 0.10
(0.19) (0.15) (0.19) (0.20) (0.22)
INDUSTRY Yes Yes Yes Yes Yes
REGION Yes Yes Yes Yes Yes
Pseudo R-squared 0.01 0.01 0.01 48 18
Observations 233 233 233 233 233 This table presents Cox PH regression analysis for different windows of observation. Positive coefficient
indicates an increase in the value of that variable increase resilience. EP is firm’s environmental performance
proxied by environmental scores from Asset4 Dataset. EPI represents Environmental Performance Index score
of the country of firm. MB is the market-to-book value ratio. ROA is firm profits divided by book value of assets
in percent. CF represents cash flows from operation scaled by net sales. SIZE is the natural of firms’ total assets.
DA represents leverage measured as total debts of firms divided by total assets. SG is the sales growth measured
as total sales divided previous year sales in percent. RD is the research & development expenditure divided by
net sales in percent. RDDUM represents dummy for RD (equals to 1 if firm has RD expenditure, otherwise 0).
CAPEX is the capital expenditures divided by last year total assets in percent. MOMENTUM is previous three
years market price change. INDUSTRY represents a dummy for Industry, REGION represents dummy for
geographical region. Financial variables are winsorized at 1 and 99 % level. Standard errors are in parentheses.
* Statistical significance at the 10 % level, ** Statistical significance at the 5 % level, *** Statistical significance
at the 1 % level

Chapter 4. Do high EP firms bounce back more quickly after environmental controversies
123
As a robustness check, we tested the link through short and extended observational windows
of 5, 10, 20, 25 and 30 days. As depicted in table 4.8, the results show that the relationship is
significant for all observational windows except of 5 days window. Secondly, we reran the
baseline model using alternative survival models i.e. Weibull, Gompertz and Exponential. The
results, as presented in Table 4.9, still show a consistently significant and positive relationship
between EP and resilience. Thirdly, we assess firm recovery state instead of time to recovery.
Recovery state equals to 1 if firm market price recovers within the observational window and
zero otherwise. These tests suggest that choice of observational windows (except for the shorter
one, i.e. 5 days window) and regression model as well as measurement of resilience do not
affect the link between EP and resilience.
Overall, our results provide significant evidence in support of our hypothesis. EP clearly
enhances resilience when facing a controversy, mitigating both the severity of loss and the time
to recovery. Beyond the insurance-like effect, we therefore find evidence supporting the
environment-as-a-resource framework, and more precisely the flexibility effect of
environmental performance. Environmentally friendly companies enjoy greater support from
all their stakeholders, a better reputation, and they develop organizational skills that enable
them to not only mitigate the shock, but also demonstrate greater flexibility in managing these
controversies, in overcoming more quickly these environmental controversies.
4.4.2. When does EP helps firms to be more resilient?
In order to have a deeper understanding of the relationship, we further analyze the sensitivity
of this main result according to country environmental policy, polluting industries and
environmental performance subsets. To examine the role of the environmental standards of a
country in the relationship between a firm’s EP and resilience, we split the sample into two
groups based on the stringency of the countries’ environmental standards. Following Bazillier

Chapter 4. Do high EP firms bounce back more quickly after environmental controversies
124
et al. (2017), we use EPI to measure the environmental standard stringency of countries. The
high environmental standards’ group (high EPI) means that the EPI of the country is greater
than the median EPI. We then performed the Cox and OLS models using time to recovery and
the severity of loss as a measure of resilience, respectively. As shown in table 4.10, the results
indicate that the relationship is only significant in countries where environmental standards are
strong. These results support that the link between EP and resilience is strong in countries
where national environmental performance is high. From a theoretical perspective, institutions
promoting CSR policies and thus environmental commitment enable stakeholders' expectations
to be seen as more legitimate, and increases stakeholders’ power (van der Laan Smith et al.,
2005, Dhaliwal et al., 2014, Belasri et al., 2020). Thus, managing stakeholders’ environmental
expectations is therefore all the more crucial in these countries, and the negative investor
reaction to an EC seem to be more likely to be high than in other countries. Benefits of strong
environmental performance appear therefore logically also be higher in these countries. Indeed,
in a country where sensitivity to ecological issues is high, the increase in reputation and
legitimacy induced by a strong environmental performance should be higher (Bansal and
Clelland, 2004), and firms may therefore develop more specific skills.
Besides, we also checked the sensitivity of the results to level of pollution of the industry. We
expect results to be more significant when environment is a material issue for the sector, since
companies are more used to deal with these adverse events. Besides, the greater scrutiny of
these firms on environmental issues lead them to be more transparent on these issues towards
the stakeholders and to further develop specific environmental skills. In line with these
intuitions, we find that the relationship stands only for industries in which pollution is a
material issue, as shown in table 4.11.

Chapter 4. Do high EP firms bounce back more quickly after environmental controversies
125
Table 4.9: Recovery after an environmental controversy: Robustness to Different
Models
VARIABLES Weibull Gompertz Exponential Probit
Time to recovery Time to recovery Time to recovery Recovery (Yes/No)
EP 1.76*** 1.71*** 1.76*** 1.90***
(0.58) (0.58) (0.58) (0.60)
EPI -0.00 -0.02 -0.00 -0.41
(1.67) (1.67) (1.67) (1.53)
MB -0.20** -0.20** -0.20** -0.21**
(0.10) (0.10) (0.10) (0.09)
ROA -0.03 -0.02 -0.03 -0.04
(0.02) (0.02) (0.02) (0.02)
CF 0.01 0.01 0.01 0.02*
(0.01) (0.01) (0.01) (0.01)
SIZE -0.20** -0.19** -0.20** -0.25**
(0.09) (0.09) (0.09) (0.11)
DA 0.01 0.01 0.01 0.01
(0.01) (0.01) (0.01) (0.01)
SG -0.39 -0.39 -0.39 -0.31
(0.56) (0.55) (0.56) (0.54)
RD -0.29 -0.28 -0.29 -0.27
(0.19) (0.18) (0.19) (0.17)
RDDUM 0.47 0.46 0.47 0.58
(0.36) (0.35) (0.35) (0.36)
CAPEX -0.02 -0.01 -0.02 -0.03
(0.02) (0.02) (0.02) (0.02)
MOMENTUM 0.09 0.09 0.09 0.17
(0.20) (0.20) (0.20) (0.20)
Constant -12.21 -12.91 -12.20 -1.00
(446.32) (661.96) (443.99) (177.95)
INDUSTRY Yes Yes Yes Yes
REGION Yes Yes Yes Yes
Ln(P) 0.00
(0.07)
Gamma -0.02
(0.02)
Wald Chi-
Square
36 34 36
Pseudo R-Square 0.13
Observations 233 233 233 233
This table presents Probit, OLS and different survival model i.e. Weibull, Gompertz and Exponential analysis for
a window of observation window of 15 days. In Probit model resilience is proxied by firms’ market price recovery,
equals 1 if recovered and zero otherwise. In survival models, resilience is proxied by time to recovery of firms’
market price. In OLS resilience is the percentage loss of firm’s market price. EP is firm’s environmental
performance proxied by environmental scores from Asset4 Dataset. EPI represents Environmental Performance
Index score of the country of firm. MB is the market-to-book value ratio. ROA is firm profits divided by book
value of assets in percent. CF represents cash flows from operation scaled by net sales. SIZE is the natural of firms’
total assets. DA represents leverage measured as total debts of firms divided by total assets. SG is the sales growth
measured as total sales divided previous year sales in percent. RD is the research & development expenditure
divided by net sales in percent. RDDUM represents dummy for RD (equals to 1 if firm has RD expenditure,
otherwise 0). CAPEX is the capital expenditures divided by last year total assets in percent. MOMENTUM is
previous three years market price change. INDUSTRY represents a dummy for Industry, REGION represents
dummy for geographical region. Financial variables are winsorized at 1 and 99 % level. Standard errors are in
parentheses. * Statistical significance at the 10 % level ** Statistical significance at the 5 % level *** Statistical
significance at the 1 % level.
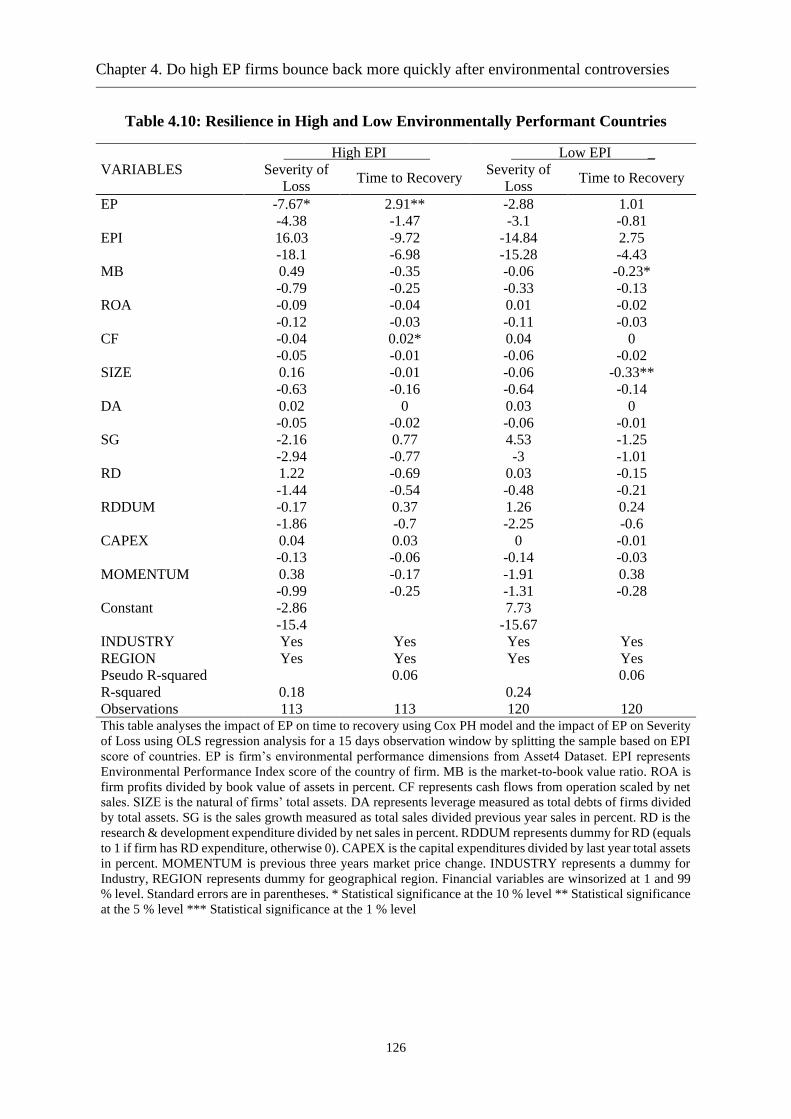
Chapter 4. Do high EP firms bounce back more quickly after environmental controversies
126
Table 4.10: Resilience in High and Low Environmentally Performant Countries
High EPI Low EPI _
VARIABLES Severity of
Loss Time to Recovery
Severity of
Loss Time to Recovery
EP -7.67* 2.91** -2.88 1.01
-4.38 -1.47 -3.1 -0.81
EPI 16.03 -9.72 -14.84 2.75
-18.1 -6.98 -15.28 -4.43
MB 0.49 -0.35 -0.06 -0.23*
-0.79 -0.25 -0.33 -0.13
ROA -0.09 -0.04 0.01 -0.02
-0.12 -0.03 -0.11 -0.03
CF -0.04 0.02* 0.04 0
-0.05 -0.01 -0.06 -0.02
SIZE 0.16 -0.01 -0.06 -0.33**
-0.63 -0.16 -0.64 -0.14
DA 0.02 0 0.03 0
-0.05 -0.02 -0.06 -0.01
SG -2.16 0.77 4.53 -1.25
-2.94 -0.77 -3 -1.01
RD 1.22 -0.69 0.03 -0.15
-1.44 -0.54 -0.48 -0.21
RDDUM -0.17 0.37 1.26 0.24
-1.86 -0.7 -2.25 -0.6
CAPEX 0.04 0.03 0 -0.01
-0.13 -0.06 -0.14 -0.03
MOMENTUM 0.38 -0.17 -1.91 0.38
-0.99 -0.25 -1.31 -0.28
Constant -2.86 7.73
-15.4 -15.67
INDUSTRY Yes Yes Yes Yes
REGION Yes Yes Yes Yes
Pseudo R-squared 0.06 0.06
R-squared 0.18 0.24
Observations 113 113 120 120 This table analyses the impact of EP on time to recovery using Cox PH model and the impact of EP on Severity
of Loss using OLS regression analysis for a 15 days observation window by splitting the sample based on EPI
score of countries. EP is firm’s environmental performance dimensions from Asset4 Dataset. EPI represents
Environmental Performance Index score of the country of firm. MB is the market-to-book value ratio. ROA is
firm profits divided by book value of assets in percent. CF represents cash flows from operation scaled by net
sales. SIZE is the natural of firms’ total assets. DA represents leverage measured as total debts of firms divided
by total assets. SG is the sales growth measured as total sales divided previous year sales in percent. RD is the
research & development expenditure divided by net sales in percent. RDDUM represents dummy for RD (equals
to 1 if firm has RD expenditure, otherwise 0). CAPEX is the capital expenditures divided by last year total assets
in percent. MOMENTUM is previous three years market price change. INDUSTRY represents a dummy for
Industry, REGION represents dummy for geographical region. Financial variables are winsorized at 1 and 99
% level. Standard errors are in parentheses. * Statistical significance at the 10 % level ** Statistical significance
at the 5 % level *** Statistical significance at the 1 % level

Chapter 4. Do high EP firms bounce back more quickly after environmental controversies
127
Table 4.11: Resilience in High and Low polluting industries
High Polluting Sectors Low Polluting Sectors _
VARIABLES Severity of
Loss Time to Recovery
Severity of
Loss Time to Recovery
EP -8.42*** 1.57** -1.21 1.56
(2.69) (0.73) (3.83) (1.26)
EPI 0.85 -0.18 9.31 2.28
(6.25) (1.95) (18.15) (5.41)
MB -0.03 -0.16 0.32 -0.21
(0.39) (0.14) (0.47) (0.16)
ROA -0.07 -0.02 -0.09 -0.09
(0.08) (0.02) (0.25) (0.08)
CF -0.07** 0.01* 0.20* 0.01
(0.03) (0.01) (0.11) (0.04)
SIZE 0.16 -0.15 0.15 -0.23
(0.47) (0.12) (0.68) (0.17)
DA -0.00 0.01 0.12* -0.01
(0.04) (0.01) (0.06) (0.02)
SG 3.16 -0.65 -10.11* 2.41*
(2.11) (0.65) (5.16) (1.46)
RD 0.43 -0.28 0.35 -0.03
(0.42) (0.19) (0.85) (0.62)
RDDUM 0.14 0.48 -2.41 1.38
(1.45) (0.45) (2.73) (0.95)
CAPEX 0.18** -0.04 -0.30 0.07
(0.09) (0.03) (0.18) (0.08)
MOMENTUM -0.15 0.09 -0.22 -0.39
(0.80) (0.21) (1.67) (0.52)
Constant 4.76 7.35
(8.92) (18.47)
INDUSTRY Yes Yes Yes Yes
REGION Yes Yes Yes Yes
Pseudo R-squared 0.05 0.05
R-squared 0.20 0.33
Observations 160 160 73 73 This table analyses the impact of EP on time to recovery using Cox PH model and the impact of EP on Severity
of Loss using OLS regression analysis for a 15 days observation window by splitting the sample based on EPI
score of countries. EP is firm’s environmental performance dimensions from Asset4 Dataset. EPI represents
Environmental Performance Index score of the country of firm. MB is the market-to-book value ratio. ROA is
firm profits divided by book value of assets in percent. CF represents cash flows from operation scaled by net
sales. SIZE is the natural of firms’ total assets. DA represents leverage measured as total debts of firms divided
by total assets. SG is the sales growth measured as total sales divided previous year sales in percent. RD is the
research & development expenditure divided by net sales in percent. RDDUM represents dummy for RD (equals
to 1 if firm has RD expenditure, otherwise 0). CAPEX is the capital expenditures divided by last year total assets
in percent. MOMENTUM is previous three years market price change. INDUSTRY represents a dummy for
Industry, REGION represents dummy for geographical region. Financial variables are winsorized at 1 and 99
% level. Standard errors are in parentheses. * Statistical significance at the 10 % level ** Statistical significance
at the 5 % level *** Statistical significance at the 1 % level
Chapter 4. Do high EP firms bounce back more quickly after environmental controversies
128
Finally, we wonder if our results are robust to the different dimensions of EP in table 4.12. In
disentangling the three different sub pillars of the Thomson-Reuters Asset4 dataset, we find
that product innovation is the most dimension fostering resilience. According to Asset4 “the
product innovation category measures a company's management commitment and
effectiveness toward supporting the research and development of eco-efficient products or
services”. As a matter of fact, environmental innovation is an important driver to acquire
specific skills to adapt towards an environmental controversy. The emission dimension, as “a
company's management commitment and effectiveness toward reducing environmental
emission in the production and operational processes” is also significantly related to financial
resilience. The resource reduction subset, however, proves to have no significant link. We
wonder if the efficient use of natural resources might be more related to cost reduction than to
innovation and flexibility.
Overall, we find that environmental performance increases financial resilience in facing a
controversy only when firms are more prepared for external challenging conditions. In
countries with high environmental settings and in high polluting sectors, companies are facing
demanding conditions and high expectations from stakeholders. They therefore seem to
develop specific environmental skills that help them to mitigate the adverse environmental
events and to bounce back more quickly afterwards. The role of outside pressure may also
foster the innovation process (Porter and Van der Linde, 1995) which is documented to be
linked with resilience insofar as it helps organizations to adjust to turbulences (Linnenluecke,
2017). We therefore argue that EP only helps firms when firms are more prepared to future
environmental challenges, i.e. in more stringent country environmental settings, in more
polluting sectors and mainly when they innovate in the environmental dimension, which is in
line with the arguments of the Porter hypothesis (Porter and Van der Linde, 1995).

Chapter 4. Do high EP firms bounce back more quickly after environmental controversies
129
Table 4.12: Resilience after an environmental controversy – Sensitivity to EP
Dimensions
OLS Model _ Cox PH Model _
VARIABLES Severity of
Loss
Severity of
Loss
Severity of
Loss
Time to
Recovery
Time to
Recovery
Time to
Recovery
Resource Reduction -1.74 0.48
-2.21 -0.52
Emission Reduction -4.77** 1.08**
-2.33 -0.53
Product Innovation -4.06*** 1.32***
-1.44 -0.42
EPI 0.79 2.1 3.38 0.51 0.26 -0.23
-5.62 -5.56 -5.75 -1.62 -1.6 -1.78
MB -0.11 -0.02 -0.14 -0.16** -0.19** -0.14*
-0.27 -0.28 -0.26 -0.08 -0.08 -0.08
ROA -0.09 -0.07 -0.05 -0.01 -0.02 -0.02
-0.07 -0.07 -0.07 -0.02 -0.02 -0.02
CF -0.01 -0.02 -0.04 0.01 0.01 0.01**
-0.04 -0.03 -0.04 -0.01 -0.01 -0.01
SIZE -0.1 0 0.09 -0.11 -0.13 -0.17*
-0.34 -0.35 -0.35 -0.09 -0.08 -0.09
DA 0.04 0.04 0.04 0.01 0.01 0
-0.03 -0.03 -0.03 -0.01 -0.01 -0.01
SG 2.73 2.08 1.97 -0.58 -0.43 -0.38
-2.01 -2 -1.97 -0.52 -0.53 -0.54
RD 0.31 0.21 0.25 -0.23 -0.26 -0.18
-0.32 -0.33 -0.31 -0.17 -0.18 -0.16
RDDUM 0.59 0.72 0.86 0.44 0.47 0.27
-1.28 -1.23 -1.25 -0.36 -0.36 -0.36
CAPEX 0.1 0.09 0.09 -0.02 -0.01 -0.01
-0.09 -0.09 -0.09 -0.02 -0.02 -0.02
MOMENTUM -0.24 -0.49 -0.09 0.05 0.1 -0.02
-0.8 -0.81 -0.79 -0.19 -0.19 -0.2
Constant 2.55 1.22 -1.11
-8.46 -8.43 -8.84
INDUSTRY Yes Yes Yes Yes Yes Yes
REGION Yes Yes Yes Yes Yes Yes
Observations 233 233 233 233 233 233
R-squared 0.1 0.12 0.13
Pseudo R-squared 0.02 0.02 0.02 This table presents OLS and Cox PH regression analysis on the observation window of 15 trading days. Negative
(positive) coefficient under OLS (Cox PH) model indicates an increase in the value of that variable increase
resilience. EP is firm’s environmental performance’s subcategories i.e. resource reduction, emission reduction
and product innovation from Asset4 Dataset. EPI represents Environmental Performance Index score of the
country of firm. MB is the market-to-book value ratio. ROA is firm profits divided by book value of assets in
percent. CF represents cash flows from operation scaled by net sales. SIZE is the natural of firms’ total assets.
DA represents leverage measured as total debts of firms divided by total assets. SG is the sales growth measured
as total sales divided previous year sales in percent. RD is the research & development expenditure divided by
net sales in percent. RDDUM represents dummy for RD (equals to 1 if firm has RD expenditure, otherwise 0).
CAPEX is the capital expenditures divided by last year total assets in percent. MOMENTUM is previous three
years market price change. INDUSTRY represents a dummy for Industry, REGION represents dummy for
geographical region. Financial variables are winsorized at 1 and 99 % level. Standard errors are in parentheses.
* Statistical significance at the 10 % level ** Statistical significance at the 5 % level *** Statistical significance
at the 1 % level

Chapter 4. Do high EP firms bounce back more quickly after environmental controversies
130
4.5. Conclusion
Are environmentally performant firms more resilient towards environmental controversies?
Whereas preceding literature is documenting an insurance-like effect on the stability
dimension, the flexibility issues remains to our knowledge, unexplored. In this study, we
therefore analyze the impact of firms’ EP on their financial resilience by considering for the
first time both stability and flexibility aspect of resilience. We contribute to the literature in
both investigating the flexibility dimension and in documenting the conditions needed for EP
to increase firm resilience against an environmental adverse event.
We apply both OLS and survival models by using EP data from the Thomson Reuters’ Asset4
on a sample of 233 observations from 16 countries over the 2010-2016 period. Our results
clearly find evidence that EP increases firm financial resilience from the shock caused by
environmental controversy in its two dimensions, both mitigating the severity of loss and
enhancing firm market price recovery. All else equal, environmentally performant firm are less
affected by the controversy and bounce back more quickly. These results, in line with the
environment-as-a resource framework (Flammer, 2013), are robust to different measures of
variables, time windows, and models used. Moreover, we investigate more precisely when this
relationship is significant. We find more that this link is only significant for firms located in
high environmentally oriented countries, for the more polluting sectors, and concerning the
specific production innovation and emission reduction dimension. We argue that these are
facing more demanding conditions and have developed more environmental skills to deal with
the threat of an environmental controversy.
The findings have practical implications for corporate managers, investors, and regulators. For
managers and investors, we find evidence that environmental engagements not only provides
an “insurance-like effect” (Godfrey et al., 2009), but also a “flexibility effect”, which enable

Chapter 4. Do high EP firms bounce back more quickly after environmental controversies
131
firms to cope with future uncertainty like financial shock specifically caused by environmental
controversies. This effect, however, proves to be sensitive to the capacity of the firm to be
flexible, which is fostered by outside pressure of country and stakeholder, as well as the
innovation dimension of EP that enhances adaptability. For regulators, then, more stringent
environmental settings may, in line with the Porter hypothesis (Porter and Van der Linde,
1995), help firms to be more prepared to environmental jolts.

Chapter 4. Do high EP firms bounce back more quickly after environmental controversies
132
Appendix A. Examples of environmental controversies
Table 4.A: Some examples of controversies News Story Source 1 Concerning firm: Cairn Energy
Greenpeace target Cairn Energy in 'polar bear' protest
Environmental campaigners step up pressure on energy firm over its oil spill
response strategy and Arctic exploration plans
Greenpeace activists dressed as polar bears occupied the Edinburgh offices of
Cairn Energy on Monday as the environmental group stepped up the pressure on
the company over its Arctic exploration plans.
Last month the organisation's international head, Kumi Naidoo, was arrested after
boarding a 52,000-tonne Cairn rig 75 miles off the west coast of Greenland.
But on Monday Greenpeace switched its tactics from commando to panto in the
Scottish capital as more than 60 campaigners, including dozens in polar bear suits,
entered Cairn's offices near Edinburgh Castle.
Greenpeace said the invasion was the latest step in a campaign to make the firm
publish its oil spill strategy. Cairn announced in June that it had begun drilling two
wells off Nuuk, the capital of Greenland. Both drilling operation are in water
deeper than 900 metres, situated 100 miles and 185 miles from Nuuk…
The Guardian (July 18, 2011)
https://www.theguardian.com/bu
siness/2011/jul/18/greenpeace-
cairn-energy-polar-bear
2 Concerning firm: Newmont
Foes of Newmont's $5 billion Peru mine in standoff with police
LIMA (Reuters) - Hundreds of protesters were locked in a standoff with police in
northern Peru on Wednesday as they vowed to stop Newmont Mining from
transferring water from a lake to a reservoir as part of its $5 billion Conga gold
project.
Residents and local officials said it was the second straight day of tensions near
the proposed mine that would be Peru’s most expensive ever.
On Tuesday, a minor clash between protesters and police marked an end to a
stretch of relative calm since August, when the government of President Ollanta
Humala said it would stop trying to overcome local opposition to the mine.
The new round of protests came after a top official for the Conga project - Chief
Executive Roque Benavides of Newmont’s partner Buenaventura - told Reuters
last week that water from Perol would be transferred to a new reservoir later this
year…
Reuters (May 30, 2013)
https://www.reuters.com/article/u
s-peru-mining-conga/foes-of-
newmonts-5-billion-peru-mine-
in-standoff-with-police-
idUSBRE94S1EI20130529
3 Concerning firm: ANGLO AMERICAN
Protest at Anglo's Alaskan quest
Top jewellers are refusing to use gold from a proposed mine because it threatens
a major fishing ground
Fifty jewellers with billions of pounds in sales and stores around the world have
pledged to boycott Anglo American's planned Pebble project in Alaska, saying
they will not use gold from the proposed mine as it threatens Bristol Bay, the
world's most important fishing ground for wild sockeye salmon.
Anything from 10 million to more than 30 million sockeye – the third most
abundant species of Pacific salmon – are caught each year during the span of a
few weeks of intensive fishing, according to the National Oceanic Atmospheric
Administration in the United States.
Earthworks, a non-profit group campaigning against the Pebble mine, says that if
it goes ahead, the project – a partnership between Anglo and Canada's Northern
Dynasty Minerals – "would destroy salmon spawning habitat in a designated
fishery reserve and jeopardise the commercial fishing industry and the livelihoods
of the Alaska native communities in the region"…
Independent (Nov 3, 2010)
https://www.independent.co.uk/n
ews/business/analysis-and-
features/protest-at-anglos-
alaskan-quest-
2123518.html?utm_source=twitt
erfeed&utm_med

133

134
General conclusion
Due to its major role in achieving the sustainable development goals (SDGs)10 (IPCC, 2018),
environmental commitments of companies are nowadays a pressing issue, and their financial
consequences are well discussed in academic literature. While some studies show a negative
EP-FP link (Jaggi and Freedman, 1992, Lioui and Sharma, 2012, Jacobs et al., 2010, Stanwick
and Stanwick, 1998, Galema et al., 2008, Marsat and Williams, 2013), others do not find a
significant link (Cohen et al., 1997, Waddock and Graves, 1997), whereas more document a
positive EP-FP link (Albertini, 2013, Dixon-Fowler et al., 2013, Endrikat et al., 2014, Endrikat,
2016). In addition, some studies refer high EP to insurance-like benefits (Godfrey et al., 2009),
easy access to finance (Banerjee et al., 2019, Nandy and Lodh, 2012, Cheng et al., 2014) with
a lower cost of capital (Sharfman and Fernando, 2008, Heinkel et al., 2001, Gupta, 2018,
Chava, 2014). Several event studies suggest that investors penalize environmentally
irresponsible behavior (Hamilton, 1995, Capelle-Blancard and Laguna, 2010, Flammer, 2013,
Krüger, 2015, Endrikat, 2016, Capelle-Blancard and Petit, 2019), which may draws attention
to the latent environmental liabilities of companies (Clarkson et al., 2015, Chapple et al., 2013,
Clarkson et al., 2004).
While facing challenges to survive and compete in a turbulent and continuously evolving
marketplace, some companies show more resilience against various disruptions. Besides the
voluminous literature on EP-FP relationship, the link between EP and organizational resilience
is to our knowledge surprisingly not precisely addressed in the academic debate. More
10 “The Sustainable Development Goals (SDGs), also known as the Global Goals, were adopted by all United
Nations Member States in 2015 as a universal call to action to end poverty, protect the planet and ensure that all
people enjoy peace and prosperity by 2030”. Source: https://www.undp.org/content/undp/en/home/sustainable-
development-goals.html

General conclusion
135
specifically, it is not clear whether EP of companies is a determinant of resilience against an
adverse situation. As resilience is “both the ability of a system to persist despite disruptions
and the ability to regenerate and maintain existing organization” (Gunderson and Pritchard,
2002, DesJardine et al., 2017), this aspect of organizational outcome is more relevant to
examine the role of EP in the context of a turbulent and challenging environment.
Considering the mounting pressure of environmental engagements and the importance of
resilience in organization’s success, this thesis thus aims to enrich and bridge their literatures.
More precisely, we extend the literature by studying the specific contribution of EP to financial
resilience, for the first time to our knowledge. Facing both the environmental claims and
financial turbulences, we try to answer if these two mounting pressures are not contradictory
for firms. We also contribute to the literature in documenting how the relationship between EP
and organizational resilience is context dependent. For this purpose, we focused on three types
of adverse events, namely general financial crisis, regulatory disruptions, and company specific
environmental controversies. Specifically, we raise the following three questions in this thesis:
1. Does EP contribute to resilience in a general financial distress?
2. Does EP contribute to resilience in an environmental regulatory distress?
3. Does EP contribute to resilience in a company specific environmental distress?
We first measure the financial resilience against the global financial crisis of 2007 as a general
financial distress. Second, we consider the disruptions caused by the publication of verified
emissions, a regulatory requirement under the EU ETS, to measure the financial resilience of
companies in the context of a regulatory distress. Finally, we measure the financial resilience
against the disruptions caused by environmental controversies to consider the company specific
environmental distress. Hence, the above three questions investigate the EP-resilience
relationship in two kinds of situations. In the first question, the situation is particularly related

General conclusion
136
to financial engagements, whereas, the situation in second and third questions consider the
conditions of environmental engagements, through the claims of stakeholders in the form of
environmental regulations and reaction to environmental controversies.
Research findings
In the first chapter, we introduce firm’s EP and organizational resilience and discuss their
financial implications from theoretical and empirical literatures. Considering the turbulent
environment, we bridge the literatures of both areas from a financial viewpoint and propose
two contrasting views to explain the possible link between EP and financial resilience. On one
hand, based on shareholders’ expense view (Friedman, 1970), high EP may be viewed as an
overinvestment or waste of financial resources and may therefore reduce a company’s financial
resilience when confronted to an adverse event. On the other hand, based on Natural Resource
Based view (Hart, 1995, Russo and Fouts, 1997) and the environment-as-a-resource view
(Flammer, 2013), high EP companies may minimize the consequences of a shock and recover
faster by benefitting from stakeholders’ attention through their reputation of being eco-friendly
and the competitive advantage of having valuable and inimitable resources. Building on this
chapter, we introduce the avenues of research that are undertaken in the following chapters.
To answer the above questions, we categorically examined each question in three different
empirical essays (presented in chapter 2, 3, and 4, respectively). Using an international dataset
of 1,622 observations in our first essay, we applied the survival analysis, Cox PH Model, along
with EP score from Thomson Reuters Asset4 database. We find evidence that high pre-crisis
EP significantly reduces the likelihood of a firm’s market price recovery after the global
financial crisis of 2007, suggesting that EP appears to be an organizational constraint that limits
the ability of firms to be financially resilient. Specifically, we find that one unit increase in EP
reduces the probability of recovery by 38.6%. However, we find that this relationship subject

General conclusion
137
to certain conditions. EP does not seem mitigating the financial resilience for companies
located in less environmentally oriented countries. Moreover, the product innovation
dimension of EP does not reduce the financial resilience, while the other two dimensions, i.e.
emissions and resource reduction, proved to be detrimental to resilience. This essay is the first
attempt to investigate the precise role of EP in financial resilience, which somehow challenges
the findings of DesJardine et al. (2017). Though DesJardine et al. (2017) found a positive
contribution of CSR to resilience in the same context of global financial crisis, they however
do not disentangle EP from other CSR practices.
In second essay, we find that EP significantly enhances the financial resilience in a regulatory
framework of the EU ETS. By performing survival analysis on a sample of 3,194 observations
over first twelve publication events from 2006 to 2017, we find that carbon intensity
significantly mitigates the financial flexibility of companies covered under the EU ETS against
the shock caused by publication of emissions data. This indicate the EP prepares companies to
cope with a regulatory disruption that demands eco-efficiency. This finding complements the
flexibility (resilience) effect of EP to the environment-as-a-resource framework (Flammer,
2013) and its insurance-like effect (Godfrey et al., 2009). This relationship is however
dependent on the carbon-intensity profile of industry since the relationship is only significant
in most polluting industries. Moreover, we find that this relationship significant in the second
and third phases of the EU ETS, where carbon prices were high relative to the first phase and
the overall allocation of emissions limit was reduced. To our knowledge, we made a first
attempt to examine the EP-resilience link in the context of a regulatory framework.
Finally, the third essay show that EP significantly enhances the financial resilience against
company specific environmental jolts. In this essay we used an international sample of 233
observations over the 2010-2016 period, along with environmental scores from Thomson

General conclusion
138
Reuters Asset4 database as a measure of companies’ EP. By performing survival analysis, we
find that prior EP significantly improves the both facets of firms’ financial resilience, i.e.
stability and flexibility, to the shock caused by environmental controversies. These findings
seem in line with the environment-as-a-resource framework, suggesting that high EP enable
companies to be more flexible, adapt easily to an adverse situation and therefore recover more
quickly. However, we find that the relationship is only significant in environmentally oriented
countries, in high polluting industries and for two of the subcategories of EP, i.e. “emission
reduction” and “product innovation”. To our knowledge, this essay is first attempt to
investigate the role of EP in building financial resilience to companies’ specific environmental
jolts. We therefore document that firm preparedness and flexibility to cope with environmental
controversies rely more precisely on the use of specific environmental skills developed
throughout firm environmental innovation as well as demanding conditions from both the
country environmental policy and industry scrutiny.
Altogether, we thus test the relationship in three different dimensions of resilience amidst two
kinds of shocks, i.e. financial versus environmental jolts. While the EP-resilience relationship
is negative in case of general financial distress and positive in case of environmental
demanding jolts, this indicate that the relationship is also dependent on the conditions of an
adverse situation. As the environmental-demanding jolts highlight the environmental claims,
through the claims of stakeholders in the form of environmental regulations and reaction to
environmental controversies, our findings show that high EP may benefit in these cases and
enable company to neutralize the negative consequences of the environmental-demanding jolts.
On the other hand, as general financial distress is not particularly related to the environmental
claims of stakeholders, therefore, investors may be more concerned about the financial health
of companies. Investors may see high EP as a waste of resources that could be mobilized in the

General conclusion
139
core or other functions of business to bring back company to routine business during a general
financial crisis.
Contributions
Overall, we contribute to the literature at several stages. Firstly, we, for the first time to our
knowledge, enrich and bridge the literatures of EP and organizational resilience. Previous
research overwhelmingly determined EP from the perspective of cost, the neoclassical
economists view (Friedman, 1970), and the environment-as-a-resource framework (Flammer,
2013). Considering the importance of resilience in a turbulent environment, the contribution of
EP to organizational resilience is however scarcely addressed in literature. If DesJardine et al.
(2017) study the impact of tactical versus strategic CSR commitments on firms' resilience, their
approach does not however specifically disentangle EP from other CSR policies. Building upon
the previous literature of EP, we theoretically demonstrate that EP could be a determinant of
organizational resilience. We show that market may use the prior information related to
company’s EP (cost or reputation of being eco-friendliness) to respond to an adverse event.
Secondly, as organizational resilience embeds company’s reaction to a disruption, we
contribute to the literature by studying company’s reaction to different adverse events and
include the role of EP therein. This is not new since various studies examined the role of EP in
an adverse situation (Jong et al., 2014, Brouwers et al., 2016, Hamilton, 1995, Capelle-
Blancard and Laguna, 2010, Flammer, 2013, Krüger, 2015, Endrikat, 2016, Capelle-Blancard
and Petit, 2019) in the short term, however, they do not address the question of what happens
next. Such as, did company recover back and does EP play any role in the recovery after an
adverse event? We specifically observe companies’ resilience to adverse situations caused by
general financial crisis, regulatory, and environmental controversies. Considering more
frequent occurrence of financial crisis and regulatory interruptions, and high reaction to

General conclusion
140
environmental controversies then lead us to contribute to the literature on the impact of
environmental policies on firm value by studying the impact of EP on an unexplored aspect of
financial performance (financial resilience).
Thirdly, since we find a negative EP-resilience relationship in the context of general financial
crisis, as presented in chapter 2, this finding offers a challenging result for the EP-FP literature
from a new perspective. As high level of financial resources enable company to recover faster
from a crisis (Gittell et al., 2006), our findings are in line with neoclassical economists view
(Friedman, 1970) that resources invested in high EP may not be mobilized in other functions
of the business to cope with a financial shock. Furthermore, these findings confirm the
assertions of Buchanan et al. (2018), stating that shareholders may be more likely to invest less
in environmentally performant firms since high EP can be associated with overinvestment
concerns and agency problems. However, we find that EP is not always mitigating to financial
resilience, since our results show that firm involvement in product innovation dimension of EP
does not reduce firm resilience. Furthermore, we also find that EP is not detrimental for
companies in countries with low environmental legislation. Hence, these findings seem
particularly important for both corporate and portfolio managers.
Fourthly, we find a positive impact of EP on financial resilience in the context of regulatory
and company specific environmental jolts. This contribution documents the benefits of EP
highlighted by the Environmental Resource based view (Hart, 1995, Russo and Fouts, 1997)
and the environment-as-a-resource framework (Flammer, 2013) in the context of adverse
events in focusing on the resilience effect. More precisely, we assessed the impact of EP on the
financial flexibility, measured by the time to recovery, to adverse events caused by the
disclosure of verified emissions, a regulatory requirement under the EU ETS, and
environmental controversy. Applying a survival analysis methodology, our results confirm the

General conclusion
141
advantages of environmental engagements highlighted by the environment-as-a-resource
framework, such as reputation and acquisition of valuable and inimitable resources. This
indicate that beside the financial stability and insurance-like effects (Godfrey et al., 2009), high
EP also possess the effect of financial flexibility. Besides, we also contribute to the literature
by documenting that different kinds of environmental involvement do not play the same role.
More precisely, only those dimensions of EP improve resilience that attracts more attention,
i.e. emission reduction, or induces innovation, i.e. product innovation. Furthermore, our
findings show that high EP is more beneficial if the company is in high polluting industry, in
environmentally oriented country.
Finally, we contribute to the literature by documenting that the situation moderates the EP-FP
relationship. More specifically, our findings show that EP-resilience relationship is negative in
the context of a general financial distress, indicating that EP could be detrimental if the situation
demands particularly financial engagements. This relationship, however, is positive in the
context of environmental regulations and environmental controversies. As both of these latter
situations demand environmental engagements from the companies, to comply with
environmental regulations and reduce irresponsible behavior, high EP seems benefiting the
company. Indeed, if a company is well prepared and fulfils the demanding conditions in
advance relative to their peers, then they may have an advantage to adapt to new situation.
Previous studies identified various reason for the inconsistency in EP-FP relationship, for
example heterogeneity in empirical methods (Horváthová, 2010), small sample size and
evaluation of EP (Konar and Cohen, 2001), moderating factors in the models i.e. firm size and
geographic location (Cohen et al., 1997), or the industry profile of firm (King and Lenox,
2001). We thus extend this literature by considering the moderating impact of the demanding
conditions of a situation.

General conclusion
142
Practical implications
The findings of this thesis have some important practical implications for corporate managers,
investors and regulators.
Firstly, as the findings show that high EP could be detrimental to FP (particularly resilience)
in the context of general financial shock, corporate managers seem to have a trade-off between
“doing good” and “doing well” in the context of a general financial shock. However, they must
know that only two of the subcategories of EP, i.e. resource reduction and emissions reduction,
pose this dilemma. Besides, and interestingly, managers may invest wisely in product
innovation, which does not seem reducing the capacity of company to cope with general
financial shock. Furthermore, they must also know the environmental conditions of company’s
country because EP may not be detrimental to resilience if their company is in a country with
low environmental standards. On the contrary, as EP seems beneficial in the context of a shock
demanding environmental engagements, then “doing good” may also be considered as “doing
well”. In this context, the relationship is however only significant in environmentally oriented
countries, in high polluting industries and for two of the subcategories of EP, i.e. “emission
reduction” and “product innovation”. Thus, these elements must be considered while adopting
environmental policy to prepare organization for future uncertainties.
Secondly, our findings indicate that investors may see the high EP as a waste of resources or
overinvestment in the context of a general financial shock, but they must know that EP is
however beneficial for companies in relatively more frequent upheavals that are related to
environmental issues. As passive investors adopt buy-and-hold strategy, they should consider
the environmental policy of a company as a part of their buying due-diligence process. If they
invest in a company with high EP, it may cost during a general financial crisis but seems
beneficial in a long run. As our findings confirms the moderating role of the demanding

General conclusion
143
conditions of situations, therefore, investors must know that these conditions may have been
changed with the passage of time that may affect the EP-resilience relationship in future general
financial crises. As pinpointed by the World Economic Forum (2020) report, the concerns
about environmental issues are very high nowadays and the environmental events are occurring
more frequent now that cause severe losses to firms and the overall economy. Thus, in this
environmental turbulent landscape, investment in high EP firm seems a best choice for
investors in long run. Many countries have now adopted the sustainable and responsible
investment (SRI) focused regulations (see the PRI webpage11) that directly impose some
obligations on investors and asset management companies. For example, the article 173 of new
French law (LTECV 201512) imposes an obligation on investors and asset managers to report
or explain how they integrate the ESG-Climate factors into their investment processes and
decisions (FIR, 2016). To comply with CSR-oriented regulations, investors may now prefer to
invest in high EP companies to prove their legitimacy while companies are facing general
financial shocks.
Finally, our findings highlight the importance of environmental policies implemented by
regulators. In line with the Porter hypothesis (Porter and Van der Linde, 1995), these policies
help companies to be more prepared to environmental jolts. However, we find that stringent
regulations have placed companies in a challenging position during a general financial crisis.
Considering the moderating role of demanding conditions of a situation, regulators may
improve the conditions through CSR-oriented policies to encourage companies as well as
investors to adopt environmentally oriented strategies. Likewise, they will be able to protect
11 Responsible investment regulation map: https://www.unpri.org/sustainable-markets/regulation-map 12 Loi sur la transition énergétique et pour la croissance verte (LTECV), Law No. 2015-992 of 17 août 2015. It
can be accessed at:
https://www.legifrance.gouv.fr/affichTexte.do?cidTexte=JORFTEXT000031044385&categorieLien=id

General conclusion
144
the natural environment and at the same time will improve the ability of companies to cope
with environmental disruptions. As our findings show that high EP is not beneficial against
environmental jolts in less environmentally oriented countries, this brings the responsibility of
regulators in these countries into the fore. Environmental NGOs may also play an important
role by increasing awareness, imposing more pressure on investors to adopt SRI strategies, and
rewarding companies for their environmental friendliness.
Limitations and directions for future research
If our results are robust in the context of our settings, there are still some limitations that open
various opportunities for future research. Firstly, to measure the EP of companies in the context
of general financial and environmental controversies’ shocks, our analysis relies on the
environmental scores provided by Thomson Reuters Asset4. While previous studies show
concerns about the disagreement among different rating agencies, for example Chatterji et al.
(2016), it would be interesting to use alternative measures of EP from other agencies to make
sure that the EP-resilience relationship does not provide different outcome. To some extent we
address this issue by using carbon emissions data from Trucost dataset in the second essay, yet
it seems necessary to use alternative measures in the same essay. Furthermore, Thomson
Reuters Asset4 consider more than 60 environmental indicators to calculate environmental
scores, therefore, we encourage future researchers to further disentangle this measure to have
a thorough understanding of the EP-resilience relationship. We considered the three
subcategories of EP (i.e. emissions reduction, resource reduction, and product innovation) and
found different results for some subcategories. However, these categories still have a great
potential to be disentangled more to examine more precise relationship.
Secondly, future research may identify different measure of organizational resilience. We
assessed organizational resilience by the reaction of market prices to a disruption, which seems

General conclusion
145
relevant but may not directly represent organizational resilience (DesJardine et al., 2017).
Future researchers may focus on the rate of failures of companies in the aftermath of an adverse
event, or other quantitative or qualitative techniques to test resilience. Besides, as we apply
survival analysis to assess the impact of EP on the flexibility dimension of financial resilience,
measured by the time to recovery of company’s market price, this method restricts us to observe
recovery in a specified time window. Though this method allows us to assess the relationship
in a longer run relative to event study methodology, but still this method does not allow us to
disentangle the impact of other events that may have happened in the observation window.
Therefore, future researchers may come up with a new approach to identify numerous
disturbances in a time window. Controlling for this issue will allow us to further expand the
time windows and assess the relationship if a company is facing numerous disturbances.
Thirdly, as our findings show the significance of the demanding conditions of adverse events,
future researchers may also consider other range of disturbances to further the EP-resilience
relationship in the demanding conditions of other disturbances. For instance, companies’
reaction to disruptions caused by natural disasters, pandemic diseases interruptions,
regulations, may provide good avenues for assessing organizational resilience. As we assessed
the impact of EP on financial resilience to environmental controversies and found a positive
relationship, future researches may consider the other two dimensions related controversies of
ESG framework (i.e. social and governance) to see whether EP is protecting companies from
controversies that are not specifically related to environment.

146
147
References
ALBERTINI, E. 2013. Does environmental management improve financial performance? A
meta-analytical review. Organization Environment, 26, 431-457.
AMBEC, S. & LANOIE, P. 2008. Does it pay to be green? A systematic overview. Academy
of Management Perspectives, 22, 45-62.
AMBROSIUS, C. 2017. What explains the speed of recovery from banking crises? Journal of
International Money and Finance, 70, 257-287.
AOUADI, A. & MARSAT, S. 2016. Do ESG Controversies Matter for Firm Value? Evidence
from International Data. Journal of Business Ethics, 1027-1047.
BANERJEE, R., GUPTA, K. & MUDALIGE, P. 2019. Do environmentally sustainable
practices lead to financially less constrained firms? International evidence.
International Review of Financial Analysis.
BANSAL, P. & CLELLAND, I. 2004. Talking trash: Legitimacy, impression management,
and unsystematic risk in the context of the natural environment. Academy of
Management Journal, 47, 93-103.
BARNEA, A. & RUBIN, A. 2010. Corporate Social Responsibility as a Conflict Between
Shareholders. Journal of Business Ethics, 97:71–86.
BARNEY, J. 1991. Firm resources and sustained competitive advantage. Journal of
management, 17, 99-120.
BARNEY, J. B. 1995. Looking inside for competitive advantage. Academy of Management
Perspectives, 9, 49-61.
BARON, D. P. 2009. A positive theory of moral management, social pressure, and corporate
social performance. Journal of Economics & Management Strategy, 18, 7-43.
BARTRAM, S. M. & BODNAR, G. M. 2009. No place to hide: The global crisis in equity
markets in 2008/2009. Journal of international Money and Finance, 28, 1246-1292.
BAZILLIER, R., HATTE, S. & VAUDAY, J. 2017. Are environmentally responsible firms
less vulnerable when investing abroad? The role of reputation. Journal of Comparative
Economics, 45, 520-543.
BELASRI, S., GOMES, M. & PIJOURLET, G. 2020. Corporate social responsibility and bank
efficiency. Journal of Multinational Financial Management, 100612.

References
148
BERKES, F., FOLKE, C. & COLDING, J. 2000. Linking social and ecological systems:
management practices and social mechanisms for building resilience, Cambridge
University Press.
BHAMRA, R., DANI, S. & BURNARD, K. 2011. Resilience: the concept, a literature review
and future directions. International Journal of Production Research, 49, 5375-5393.
BOLIG, R. & WEDDLE, K. D. 1988. Resiliency and hospitalization of children. Children's
Health Care, 16, 255-260.
BORDO, M., EICHENGREEN, B., KLINGEBIEL, D. & MARTINEZ‐PERIA, M. S. J. E. P.
2001. Is the crisis problem growing more severe? 16, 52-82.
BRANCATI, R., MARROCU, E., ROMAGNOLI, M. & USAI, S. 2017. Innovation activities
and learning processes in the crisis. Evidence from Italian export in manufacturing and
services. Industrial and Corporate Change, 1–24.
BRANCO, M. C. & RODRIGUES, L. L. 2006. Corporate Social Responsibility and Resource-
Based Perspectives. Journal of Business Ethics, 69, 111-132.
BROUWERS, R., SCHOUBBEN, F., VAN HULLE, C. & VAN UYTBERGEN, S. 2016. The
initial impact of EU ETS verification events on stock prices. Energy Policy, 94, 138-
149.
BUCHANAN, B., CAO, C. X. & CHEN, C. 2018. Corporate social responsibility, firm value,
and influential institutional ownership. Journal of Corporate Finance, 52, 73-95.
CAPELLE-BLANCARD, G. & LAGUNA, M.-A. 2010. How does the stock market respond
to chemical disasters? Journal of Environmental Economics and Management, 59, 192-
205.
CAPELLE-BLANCARD, G. & PETIT, A. 2019. Every Little Helps? ESG News and Stock
Market Reaction. Journal of Business Ethics, 157, 543-565.
CAVACO, S. & CRIFO, P. 2014. CSR and financial performance: complementarity between
environmental, social and business behaviours. Applied Economics, 46, 3323-3338.
CESPA, G. & CESTONE, G. 2007. Corporate social responsibility and managerial
entrenchment. Journal of Economics & Management Strategy, 16, 741-771.
CHAHINE, S., FANG, Y., HASAN, I. & MAZBOUDI, M. 2019. Entrenchment through
corporate social responsibility: Evidence from CEO network centrality. International
Review of Financial Analysis, 66.

References
149
CHAPPLE, L., CLARKSON, P. M. & GOLD, D. L. 2013. The cost of carbon: Capital market
effects of the proposed emission trading scheme (ETS). Abacus, 49, 1-33.
CHATTERJI, A. K., DURAND, R., LEVINE, D. I. & TOUBOUL, S. 2016. Do ratings of firms
converge? Implications for managers, investors and strategy researchers. Strategic
Management Journal, 37, 1597-1614.
CHAVA, S. 2014. Environmental externalities and cost of capital. Management Science, 60,
2223-2247.
CHENG, B., IOANNOU, I. & SERAFEIM, G. 2014. Corporate social responsibility and access
to finance. Strategic Management Journal, 35, 1-23.
CLARKSON, P. M., LI, Y., PINNUCK, M. & RICHARDSON, G. D. 2015. The Valuation
Relevance of Greenhouse Gas Emissions under the European Union Carbon Emissions
Trading Scheme. European Accounting Review, 24, 551-580.
CLARKSON, P. M., LI, Y. & RICHARDSON, G. D. 2004. The market valuation of
environmental capital expenditures by pulp and paper companies. The accounting
review, 79, 329-353.
CLARKSON, P. M., LI, Y., RICHARDSON, G. D. & VASVARI, F. P. 2011. Does it really
pay to be green? Determinants and consequences of proactive environmental strategies.
Journal of Accounting and Public Policy, 30, 122-144.
COHEN, M. A., FENN, S. A. & KONAR, S. 1997. Environmental and financial performance:
are they related? Washington, DC: Investor Responsibility Research Center,
Environmental Information Service.
COLLINS, S. 2015. Strategising for Resilience. Doctor of Philosophy, Victoria University of
Wellington.
COX, D. R. 1972. Models and life-tables regression. JR Stat. Soc. Ser. B, 34, 187-220.
DELMAS, M. A., NAIRN-BIRCH, N. & LIM, J. 2015. Dynamics of Environmental and
Financial Performance:The Case of Greenhouse Gas Emissions. Organization &
Environment, 28, 374-393.
DESJARDINE, M., BANSAL, P. & YANG, Y. 2017. Bouncing Back: Building Resilience
Through Social and Environmental Practices in the Context of the 2008 Global
Financial Crisis. Journal of Management, 45, 1434-1460.
DHALIWAL, D., LI, O. Z., TSANG, A. & YANG, Y. G. 2014. Corporate social responsibility
disclosure and the cost of equity capital: The roles of stakeholder orientation and
financial transparency. Journal of Accounting and Public Policy, 33, 328-355.

References
150
DIXON-FOWLER, H. R., SLATER, D. J., JOHNSON, J. L., ELLSTRAND, A. E. & ROMI,
A. M. 2013. Beyond “does it pay to be green?” A meta-analysis of moderators of the
CEP–CFP relationship. Journal of business ethics, 112, 353-366.
DÖGL, C. & HOLTBRÜGGE, D. 2014. Corporate environmental responsibility, employer
reputation and employee commitment: An empirical study in developed and emerging
economies. The International Journal of Human Resource Management, 25, 1739-
1762.
DONALDSON, T. & PRESTON, L. E. 1995. The Stakeholder Theory of the Corporation:
Concepts, Evidence, and Implications. Academy of Management Review, 20, 65-91.
DRABBLE, E., DRABBLE, H. & SCOTT, D. G. 1907. On the size of the cells of Pleurococcus
and Saccharomyces in solutions of a neutral salt. Biochemical Journal, 2, 221.
ECCLES, R. G., IOANNOU, I. & SERAFEIM, G. 2014. The Impact of Corporate
Sustainability on Organizational Processes and Performance. Management Science, 60,
2835-2857.
ENDRIKAT, J. 2016. Market reactions to corporate environmental performance related events:
A meta-analytic consolidation of the empirical evidence. Journal of Business Ethics,
138, 535-548.
ENDRIKAT, J., GUENTHER, E. & HOPPE, H. 2014. Making sense of conflicting empirical
findings: A meta-analytic review of the relationship between corporate environmental
and financial performance. European Management Journal, 32, 735-751.
EUROPEAN COMMISSION. 2016. The EU emissions trading system (EU ETS). Available:
https://publications.europa.eu/en/publication-detail/-/publication/f084c6de-9c57-
11e6-868c-01aa75ed71a1.
FABRIZI, M., MALLIN, C. & MICHELON, G. 2014. The role of CEO’s personal incentives
in driving corporate social responsibility. Journal of Business Ethics, 124, 311-326.
FIR. 2016. Article 173-VI: Understanding the French regulation on investor climate reporting.
Available: https://www.frenchsif.org/isr-esg/wp-
content/uploads/Understanding_article173-French_SIF_Handbook.pdf.
FISHER-VANDEN, K. & THORBURN, K. S. 2011. Voluntary corporate environmental
initiatives and shareholder wealth. Journal of Environmental Economics and
management, 62, 430-445.
FLAMMER, C. 2013. Corporate Social Responsibility and Shareholder Reaction: The
Environmental Awareness of Investors. Academy of Management Journal, 56, 758-
781.
References
151
FOLKE, C., CARPENTER, S., ELMQVIST, T., GUNDERSON, L., HOLLING, C. S. &
WALKER, B. 2002. Resilience and sustainable development: building adaptive
capacity in a world of transformations. AMBIO: A journal of the human environment,
31, 437-440.
FREEMAN, E. R. 1984. Strategic Management: A stakeholder approach. Boston: Pitman, 46.
FRIEDMAN, M. 1970. The social responsibility of business is to increase its profits. The New
York Times.
GADENNE, D. L., KENNEDY, J. & MCKEIVER, C. 2009. An empirical study of
environmental awareness and practices in SMEs. Journal of Business Ethics, 84, 45-
63.
GALEMA, R., PLANTINGA, A. & SCHOLTENS, B. 2008. The stocks at stake: Return and
risk in socially responsible investment. Journal of Banking & Finance, 32, 2646-2654.
GITTELL, J. H., CAMERON, K., LIM, S. & RIVAS, V. 2006. Relationships, layoffs, and
organizational resilience: Airline industry responses to September 11. The Journal of
Applied Behavioral Science, 42, 300-329.
GODFREY, P. C., MERRILL, C. B. & HANSEN, J. M. 2009. The relationship between
corporate social responsibility and shareholder value: An empirical test of the risk
management hypothesis. Strategic management journal, 30, 425-445.
GRANT, R. M. 1991. The resource-based theory of competitive advantage: implications for
strategy formulation. California management review, 33, 114-135.
GRAVES, S. B. & WADDOCK, S. A. 1999. A look at the financial-social performance nexus
when quality of management is held constant. International Journal of Value-Based
Management, 12, 87-99.
GUENSTER, N., BAUER, R., DERWALL, J. & KOEDIJK, K. 2011. The Economic Value of
Corporate Eco-Efficiency. European Financial Management, 17, 679-704.
GUNDERSON, L. & PRITCHARD, L. 2002. Resilience of large-scale resource systems,
Washington DC, Island Press.
GUPTA, K. 2018. Environmental sustainability and implied cost of equity: international
evidence. Journal of Business Ethics, 147, 343-365.
HAMILTON, J. T. 1995. Pollution as news: Media and stock market reactions to the toxics
release inventory data. Journal of environmental economics and management, 28, 98-
113.

References
152
HART, S. L. 1995. A natural-resource-based view of the firm. Academy of management review,
20, 986-1014.
HEINKEL, R., KRAUS, A. & ZECHNER, J. 2001. The Effect of Green Investment on
Corporate Behavior. The Journal of Financial and Quantitative Analysis, 36, 431-449.
HOLLNAGEL, E., WOODS, D. D. & LEVESON, N. 2006. Resilience engineering: Concepts
and precepts, Ashgate Publishing, Ltd.
HORVÁTHOVÁ, E. 2010. Does environmental performance affect financial performance? A
meta-analysis. Ecological Economics, 70, 52-59.
HULSEN, K. 1896. Specific gravity, resilience and strength of bone, bull. Biol. Lab. St.
Petersburg, 1, 7-35.
ICAP. 2018. Emissions Trading Worldwide: Status Report 2018. Berlin: ICAP. Available:
https://icapcarbonaction.com/en/icap-status-report-2018.
IPCC. 2014. Climate Change 2014: Synthesis Report. Contribution of Working Groups I, II
and III to the Fifth Assessment Report of the Intergovernmental Panel on Climate
Change [Core Writing Team, R.K. Pachauri and L.A. Meyer (eds.)]. IPCC, Geneva,
Switzerland, 151 pp. Available: https://www.ipcc.ch/report/ar5/syr/.
IPCC. 2018. Global Warming of 1.5°C.An IPCC Special Report on the impacts of global
warming of 1.5°C above pre-industrial levels and related global greenhouse gas
emission pathways, in the context of strengthening the global response to the threat of
climate change, sustainable development, and efforts to eradicate poverty [Masson-
Delmotte, V., P. Zhai, H.-O. Pörtner, D. Roberts, J. Skea, P.R. Shukla, A. Pirani, W.
Moufouma-Okia, C. Péan, R. Pidcock, S. Connors, J.B.R. Matthews, Y. Chen, X. Zhou,
M.I. Gomis, E. Lonnoy, T. Maycock, M. Tignor, and T. Waterfield (eds.)]. In Press.
Available:
https://www.ipcc.ch/site/assets/uploads/sites/2/2019/06/SR15_Full_Report_High_Res
.pdf.
JACOBS, B. W., SINGHAL, V. R. & SUBRAMANIAN, R. 2010. An empirical investigation
of environmental performance and the market value of the firm. Journal of Operations
Management, 28, 430-441.
JAGGI, B. & FREEDMAN, M. 1992. An examination of the impact of pollution performance
on economic and market performance: pulp and paper firms. Journal of business
finance & accounting, 19, 697-713.
JENSEN, M. 2001. Value maximisation, stakeholder theory, and the corporate objective
function. European financial management, 7, 297-317.
References
153
JIRAPORN, P. & CHINTRAKARN, P. 2013. How do powerful CEOs view corporate social
responsibility (CSR)? An empirical note. Economics Letters, 119, 344-347.
JO, H., KIM, H. & PARK, K. 2014. Corporate Environmental Responsibility and Firm
Performance in the Financial Services Sector. Journal of Business Ethics, 131, 257-
284.
JONES, T. M. 1995. Instrumental stakeholder theory: A synthesis of ethics and economics.
Academy of management review, 20, 404-437.
JONG, T., COUWENBERG, O. & WOERDMAN, E. 2014. Does EU emissions trading bite?
An event study. Energy Policy, 69, 510-519.
KING, A. A. & LENOX, M. J. 2001. Lean and green? An empirical examination of the
relationship between lean production and environmental performance. Production and
operations management, 10, 244-256.
KLIBI, W., MARTEL, A. & GUITOUNI, A. 2010. The design of robust value-creating supply
chain networks: a critical review. European Journal of Operational Research, 203,
283-293.
KOH, P. S., QIAN, C. & WANG, H. 2014. Firm litigation risk and the insurance value of
corporate social performance. Strategic Management Journal, 35, 1464-1482.
KONAR, S. & COHEN, M. A. 2001. Does the market value environmental performance? The
Review of Economics and Statistics, 83(2), 281–289.
KRÜGER, P. 2015. Corporate goodness and shareholder wealth. Journal of Financial
Economics, 115, 304-329.
LAEVEN, M. L. & VALENCIA, M. F. 2018. Systemic banking crises revisited, International
Monetary Fund.
LINNENLUECKE, M. K. 2017. Resilience in business and management research: A review
of influential publications and a research agenda. International Journal of Management
Reviews, 19, 4-30.
LINNENLUECKE, M. K., SMITH, T. & MCKNIGHT, B. 2016. Environmental finance: A
research agenda for interdisciplinary finance research. Economic Modelling, 59, 124-
130.
LINS, K. V., SERVAES, H. & TAMAYO, A. N. E. 2017. Social Capital, Trust, and Firm
Performance: The Value of Corporate Social Responsibility during the Financial Crisis.
The Journal of Finance, 72, 1785-1824.

References
154
LINS, K. V., VOLPIN, P. & WAGNER, H. F. 2013. Does family control matter? International
evidence from the 2008–2009 financial crisis. The Review of Financial Studies, 26,
2583-2619.
LIOUI, A. & SHARMA, Z. 2012. Environmental corporate social responsibility and financial
performance: Disentangling direct and indirect effects. Ecological Economics, 78, 100-
111.
LYS, T., NAUGHTON, J. P. & WANG, C. 2015. Signaling through corporate accountability
reporting. Journal of Accounting and Economics, 60, 56-72.
MACARTHUR, R. 1955. Fluctuations of animal populations and a measure of community
stability. ecology, 36, 533-536.
MANCHIRAJU, H. & RAJGOPAL, S. 2017. Does Corporate Social Responsibility (CSR)
Create Shareholder Value? Evidence from the Indian Companies Act 2013. Journal of
Accounting Research, 55, 1257-1300.
MARKMAN, G. M. & VENZIN, M. 2014. Resilience: Lessons from banks that have braved
the economic crisis—And from those that have not. International Business Review, 23,
1096-1107.
MARQUIS, C., TOFFEL, M. W. & ZHOU, Y. 2016. Scrutiny, norms, and selective disclosure:
A global study of greenwashing. Organization Science, 27, 483-504.
MARSAT, S. & WILLIAMS, B. 2013. CSR and market valuation: International evidence.
Bankers, Markets & Investors, 123, 29-42.
MAXWELL, J. C. 1865. VIII. A dynamical theory of the electromagnetic field. Philosophical
transactions of the Royal Society of London, 459-512.
NANDY, M. & LODH, S. 2012. Do banks value the eco-friendliness of firms in their corporate
lending decision? Some empirical evidence. International Review of Financial
Analysis, 25, 83-93.
OECD. 2016. Better Policies for Sustainable Development 2016. Available: https://www.oecd-
ilibrary.org/content/publication/9789264256996-en.
OGANE, Y. 2015. Banking relationship numbers and new business bankruptcies. Small
Business Economics, 46, 169-185.
ORLITZKY, M., SCHMIDT, F. L. & RYNES, S. L. 2003. Corporate social and financial
performance: A meta-analysis. Organization studies, 24, 403-441.

References
155
ORTIZ-DE-MANDOJANA, N. & BANSAL, P. 2016. The long-term benefits of
organizational resilience through sustainable business practices. Strategic Management
Journal, 37, 1615-1631.
PALMER, K., OATES, W. E. & PORTNEY, P. R. 1995. Tightening environmental standards:
the benefit-cost or the no-cost paradigm? Journal of economic perspectives, 9, 119-132.
PELOZA, J. 2006. Using Corporate Social Responsibility as Insurance for Financial
Performance. California Management Review, 48, 52-72.
PETTIT, T. J., FIKSEL, J. & CROXTON, K. L. 2010. Ensuring supply chain resilience:
development of a conceptual framework. Journal of business logistics, 31, 1-21.
PIMM, S. L. & PIMM, S. 1991. The balance of nature?: ecological issues in the conservation
of species and communities, University of Chicago Press.
PONOMAROV, S. Y. & HOLCOMB, M. C. 2009. Understanding the concept of supply chain
resilience. The international journal of logistics management.
PORTER, M. E. & LINDE, C. V. D. 1995. Toward a New Conception of the Environment-
Competitiveness Relationship. The Journal of Economic Perspectives, 9, 97-118.
PORTER, M. E. & VAN DER LINDE, C. 1995. Toward a new conception of the environment-
competitiveness relationship. Journal of economic perspectives, 9, 97-118.
PRI-NOVETHIC. 2017. Investor action on climate change - A PRI-Novethic assessment of
global investor practices - September 2017. Available:
https://www.novethic.com/fileadmin/user_upload/tx_ausynovethicetudes/pdf_complet
s/Investors_action_on_climate_change_EN.pdf [Accessed February 5th, 2020].
PRI. 2019. Taking stock: Sustainable finance policy engagement and policy influence.
Available: https://www.unpri.org/sustainable-markets/regulation-map [Accessed
March 20, 2020].
REINHART, C. M. & ROGOFF, K. S. 2014. Recovery from Financial Crises: Evidence from
100 Episodes. American Economic Review, 104, 50-55.
RENNINGS, K. & RAMMER, C. 2011. The impact of regulation-driven environmental
innovation on innovation success and firm performance. Industry and Innovation, 18,
255-283.
RICHTNÉR, A. & LÖFSTEN, H. 2014. Managing in turbulence: how the capacity for
resilience influences creativity. R&d Management, 44, 137-151.

References
156
ROBERTS, P. W. & DOWLING, G. R. 2002. Corporate reputation and sustained superior
financial performance. Strategic Management Journal, 23, 1077-1093.
RUGMAN, A. M. & VERBEKE, A. 1998. Corporate strategy and international environmental
policy. Journal of International Business Studies, 29, 819-833.
RUSSO, M. V. & FOUTS, P. A. 1997. A resource-based perspective on corporate
environmental performance and profitability. Academy of management Journal, 40,
534-559.
RUTTER, M. 1987. Psychosocial resilience and protective mechanisms. American journal of
orthopsychiatry, 57, 316-331.
SHARFMAN, M. P. & FERNANDO, C. S. 2008. Environmental risk management and the
cost of capital. Strategic Management Journal, 29, 569-592.
SHAUKAT, A., QIU, Y. & TROJANOWSKI, G. 2015. Board attributes, corporate social
responsibility strategy, and corporate environmental and social performance. Journal
of Business Ethics, 135, 569-585.
SHEFFI, Y. & RICE JR, J. B. 2005. A supply chain view of the resilient enterprise. MIT Sloan
management review, 47, 41.
SHIU, Y. M. & YANG, S. L. 2017. Does engagement in corporate social responsibility provide
strategic insurance‐like effects? Strategic Management Journal, 38, 455-470.
SIEGRIST, M., BOWMAN, G., MERVINE, E. & SOUTHAM, C. 2020. Embedding
environment and sustainability into corporate financial decision‐making. Accounting &
Finance, 60, 129-147.
STANWICK, P. A. & STANWICK, S. D. 1998. The relationship between corporate social
performance, and organizational size, financial performance, and environmental
performance: An empirical examination. Journal of business ethics, 17, 195-204.
SURROCA, J. & TRIBÓ, J. A. 2008. Managerial entrenchment and corporate social
performance. Journal of Business Finance & Accounting, 35, 748-789.
TEIXEIRA, E. D. O. & WERTHER, W. B. 2013. Resilience: Continuous renewal of
competitive advantages. Business Horizons, 56, 333-342.
VAN DER LAAN SMITH, J., ADHIKARI, A. & TONDKAR, R. H. 2005. Exploring
differences in social disclosures internationally: A stakeholder perspective. Journal of
Accounting and Public Policy, 24, 123-151.

References
157
VOGUS, T. J. & SUTCLIFFE, K. M. Organizational resilience: towards a theory and research
agenda. 2007 IEEE International Conference on Systems, Man and Cybernetics, 2007.
IEEE, 3418-3422.
WADDOCK, S. A. & GRAVES, S. B. 1997. The corporate social performance-financial
performance link. Strategic management journal, 303-319.
WALLS, J. L. & BERRONE, P. 2017. The power of one to make a difference: How informal
and formal CEO power affect environmental sustainability. Journal of Business Ethics,
145, 293-308.
WERNERFELT, B. 1984. A resource‐based view of the firm. Strategic Management Journal,
5, 171-180.
WORLD ECONOMIC FORUM. 2020. The Global Risks Report 2020, 15th Edition.
Available: http://www3.weforum.org/docs/WEF_Global_Risk_Report_2020.pdf
[Accessed April 15, 2020].
XIAO, C., WANG, Q., VAN DER VAART, T. & VAN DONK, D. P. 2018. When Does
Corporate Sustainability Performance Pay off? The Impact of Country-Level
Sustainability Performance. Ecological Economics, 146, 325-333.
ZHU, Q. & SARKIS, J. 2004. Relationships between operational practices and performance
among early adopters of green supply chain management practices in Chinese
manufacturing enterprises. Journal of Operations Management, 22, 265-289.