Oracle Real Application Clusters on Extended Distance Clusters
International Workshop on Visual Analytics (2012)K. Matkovic and G. Santucci (Editors)
The News Auditor: Visual Exploration of Clusters of Stories
Michael Behrisch, Miloš Krstajic, Tobias Schreck, Daniel A. Keim
Data Analysis and Visualization Group, University of Konstanz, Germany
AbstractIn recent years, the quantity of content generated by news agencies and blogs is constantly growing, making itdifficult for readers to process and understand this overwhelming amount of data. Online news aggregators presentclusters of similar stories in a simple, list-based manner, where the most important article is shown first, whileall the other similar articles appear below as hyperlinked headlines. This layout makes the user unaware of thecontent differences between articles, thus making it very difficult to get a comprehensive picture. Understandingwhat was changed, how, when and by whom, would lead to new insights about the content distribution over theinternet and help in dealing with the news overload problem. We present a visual analytics tool that allows theuser to compare the articles that belong to the same story and understand the differences at three levels of detail.Story matrix provides an overview of a document cluster, where the user can identify articles of interest basedon their overall similarity and reorder them by different criteria. Structural view shows document thumbnailswith highlighted paragraphs of the text that were copied, modified or repositioned by different sources. Finally,Document level view presents two articles side by side to provide full-text comparison. To evaluate our tool, wepresent two user scenarios applied on a real world data set.
Categories and Subject Descriptors (according to ACM CCS): D.2.2 [Software Engineering]: Design Tools andTechniques—User interfaces H.3.3 [Information Storage and Retrieval]: Information Search and Retrieval DesignTools and Techniques—Information filtering
1. Introduction
Websites of newspapers, magazines, radio and televisionbroadcasters publish stories, which are often provided bymajor news agencies, such as Associated Press, Reuters,AFP, etc. These news stories and feature articles can be pre-pared by agencies in a way that requires little modification,but very often the clients edit the text before delivering itto the reader. Alternative information flow is created by in-dependent and local media, who publish news stories thatare later picked by other media providers and redistributedthrough their channels.
News aggregators, such as Google News, Yahoo News, orEurope Media Monitor provide the end users with the lat-est and the most important story clusters, where news arti-cles are grouped by their similarity. The aggregators presentthe user a simple list, where the first (and the most impor-tant) article is usually presented with a title, short summaryand a photo, while the other articles are represented as hy-perlinked headlines. Navigating through a story cluster be-comes a daunting task, since it gets very hard to understand
the differences across different sources and find new infor-mation without reading every article. A similar problem ex-ists when important breaking events happen, when imme-diate response by news providers is required. These devel-oping stories are continuously updated as soon as the newinformation becomes available and the reader needs a fastand effective solution to differentiate the new from the old.
In this paper, we present a visual analytics tool that helpsthe reader in exploration of a news story cluster. Our workpresents a proof of concept that identifies what is different insimilar news items, combining existing automated methodsfor measuring text similarity and interactive document visu-alization. The architecture of the tool allows easy integrationof more sophisticated natural language processing methods,which would help the reader in understanding how the con-tent is different.
Section 2 describes related work in the visual analysis ofnews data. Section 3 outlines the problem and the challengesof automatically analyzing and representing online text data.In Section 4, we present our proposed system, while Section
c© The Eurographics Association 2012.
M. Behrisch, M. Krstajic, T. Schreck, D. A. Keim / News Auditor: Visual Exploration of Clusters of Stories
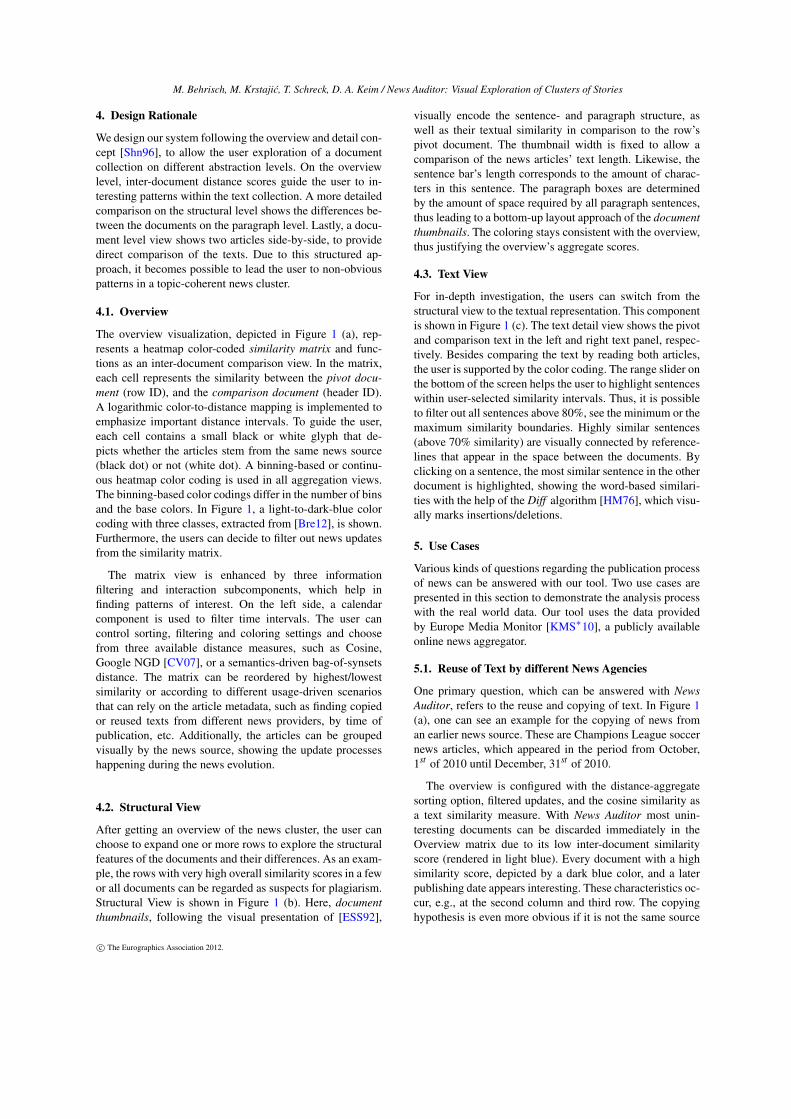
Figure 1: News Auditor: The user explores a news story cluster by identifying interesting patterns in the similarity matrixOverview (a); The Structural View (b) provides a visual comparison of differences between selected articles on the paragraphlevel; The Document View (c) shows direct changes between two articles on the word and sentence level.
5 demonstrates an application on a real world news data setin two different scenarios. Finally, we describe future workin Section 6.
2. Related Work
In recent years, visualization of text data has been gain-ing increased interest by researchers, who are developingtechniques for efficient display of document collections, aswell as single documents. For example, the visual analyticstool VISRA [OSSK10] combines readability feature selec-tion with document visualization techniques based on Liter-ature Fingerprinting [KO07], TileBars [Hea95] and Seesoft[ESS92] to evaluate the readability of the input text. In thedomain of news analysis, several tools exist that deal withsummarization and visualization of news content. Newsmap[Wes12] is a well-known treemap visualization of data gath-ered by Google News. Other popular news aggregators in-clude Yahoo! News and Europe Media Monitor [EMM12].The TextMap website, based on Lydia [LKS05], is an entitysearch engine, which provides information about people andplaces extracted from the news sources. These systems havelimited visualization capabilities that would allow the user tounderstand the content differences among different sourcesthat provide news reports on the same real world event. Inthe area of knowledge discovery and data mining, ongoingresearch efforts exist that deal with meme-tracking [LBK09]and refining causality [SFDBC11]. In this field, the maingoal is to find out how the information propagates throughnetworks and how network processes cause a specific behav-
ior in the network, by analyzing appearance of short phrasesin document nodes. Researchers working on web indexingand crawling have developed methods for identifying nearduplicates [MJS07], i.e. redundant web documents that dif-fer only in a small portion.
3. Problem Description
The goal of our work is to help the user to understand thecontent of a large document corpus, while understanding themain themes and the various differences among individualnews articles. In a real-world scenario, news clusters cancontain hundreds of related news articles, but only rarelymore than 100 documents per cluster can be retrieved with-out taking topic shifts or -drifts into account. In this docu-ment corpus user should be able to:
• identify interesting articles in the story cluster• understand what are the differences between news articles• understand who changed the content.
Given a cluster of news stories, we assume that the doc-uments are related and can appear in one of two scenarios:a) the documents are news reports from multiple sources onthe same event; b) the documents are updates from a singlenews source on an ongoing event. In order to help the user toget a better insight from a cluster of news articles, we needto combine automated methods for efficient computation ofdocument similarity and visualization techniques that wouldshow the changes at different levels of detail. The algorith-mic and visualization challenges and our design decisionsare described in the next Section.
c© The Eurographics Association 2012.
M. Behrisch, M. Krstajic, T. Schreck, D. A. Keim / News Auditor: Visual Exploration of Clusters of Stories
4. Design Rationale
We design our system following the overview and detail con-cept [Shn96], to allow the user exploration of a documentcollection on different abstraction levels. On the overviewlevel, inter-document distance scores guide the user to in-teresting patterns within the text collection. A more detailedcomparison on the structural level shows the differences be-tween the documents on the paragraph level. Lastly, a docu-ment level view shows two articles side-by-side, to providedirect comparison of the texts. Due to this structured ap-proach, it becomes possible to lead the user to non-obviouspatterns in a topic-coherent news cluster.
4.1. Overview
The overview visualization, depicted in Figure 1 (a), rep-resents a heatmap color-coded similarity matrix and func-tions as an inter-document comparison view. In the matrix,each cell represents the similarity between the pivot docu-ment (row ID), and the comparison document (header ID).A logarithmic color-to-distance mapping is implemented toemphasize important distance intervals. To guide the user,each cell contains a small black or white glyph that de-picts whether the articles stem from the same news source(black dot) or not (white dot). A binning-based or continu-ous heatmap color coding is used in all aggregation views.The binning-based color codings differ in the number of binsand the base colors. In Figure 1, a light-to-dark-blue colorcoding with three classes, extracted from [Bre12], is shown.Furthermore, the users can decide to filter out news updatesfrom the similarity matrix.
The matrix view is enhanced by three informationfiltering and interaction subcomponents, which help infinding patterns of interest. On the left side, a calendarcomponent is used to filter time intervals. The user cancontrol sorting, filtering and coloring settings and choosefrom three available distance measures, such as Cosine,Google NGD [CV07], or a semantics-driven bag-of-synsetsdistance. The matrix can be reordered by highest/lowestsimilarity or according to different usage-driven scenariosthat can rely on the article metadata, such as finding copiedor reused texts from different news providers, by time ofpublication, etc. Additionally, the articles can be groupedvisually by the news source, showing the update processeshappening during the news evolution.
4.2. Structural View
After getting an overview of the news cluster, the user canchoose to expand one or more rows to explore the structuralfeatures of the documents and their differences. As an exam-ple, the rows with very high overall similarity scores in a fewor all documents can be regarded as suspects for plagiarism.Structural View is shown in Figure 1 (b). Here, documentthumbnails, following the visual presentation of [ESS92],
visually encode the sentence- and paragraph structure, aswell as their textual similarity in comparison to the row’spivot document. The thumbnail width is fixed to allow acomparison of the news articles’ text length. Likewise, thesentence bar’s length corresponds to the amount of charac-ters in this sentence. The paragraph boxes are determinedby the amount of space required by all paragraph sentences,thus leading to a bottom-up layout approach of the documentthumbnails. The coloring stays consistent with the overview,thus justifying the overview’s aggregate scores.
4.3. Text View
For in-depth investigation, the users can switch from thestructural view to the textual representation. This componentis shown in Figure 1 (c). The text detail view shows the pivotand comparison text in the left and right text panel, respec-tively. Besides comparing the text by reading both articles,the user is supported by the color coding. The range slider onthe bottom of the screen helps the user to highlight sentenceswithin user-selected similarity intervals. Thus, it is possibleto filter out all sentences above 80%, see the minimum or themaximum similarity boundaries. Highly similar sentences(above 70% similarity) are visually connected by reference-lines that appear in the space between the documents. Byclicking on a sentence, the most similar sentence in the otherdocument is highlighted, showing the word-based similari-ties with the help of the Diff algorithm [HM76], which visu-ally marks insertions/deletions.
5. Use Cases
Various kinds of questions regarding the publication processof news can be answered with our tool. Two use cases arepresented in this section to demonstrate the analysis processwith the real world data. Our tool uses the data providedby Europe Media Monitor [KMS∗10], a publicly availableonline news aggregator.
5.1. Reuse of Text by different News Agencies
One primary question, which can be answered with NewsAuditor, refers to the reuse and copying of text. In Figure 1(a), one can see an example for the copying of news froman earlier news source. These are Champions League soccernews articles, which appeared in the period from October,1st of 2010 until December, 31st of 2010.
The overview is configured with the distance-aggregatesorting option, filtered updates, and the cosine similarity asa text similarity measure. With News Auditor most unin-teresting documents can be discarded immediately in theOverview matrix due to its low inter-document similarityscore (rendered in light blue). Every document with a highsimilarity score, depicted by a dark blue color, and a laterpublishing date appears interesting. These characteristics oc-cur, e.g., at the second column and third row. The copyinghypothesis is even more obvious if it is not the same source
c© The Eurographics Association 2012.
M. Behrisch, M. Krstajic, T. Schreck, D. A. Keim / News Auditor: Visual Exploration of Clusters of Stories
that published the article. In Figure 1, the initial article waspublished on October, 14th of 2010 from the Turkish DailyNews agency and modified on October, 16th of 2010 fromthe Malta Independent Press.
The structural comparison in Figure 1 (b) shows that mostsentences are in high similarity classes. The structure ap-pears to be stable, yet the length has changed marginally.In fact, the textual investigation, shown in Figure 1 (c), re-veals that 21 of 31 sentences are in the similarity intervalof 90% to 100% with insignificant changes, such as in-serting/deletion of hyphens, quotation marks, or punctua-tions. Eight sentences have minor modifications, such as plu-ral/singular changes, with a similarity score between 80%and 89%, two sentences are in the 70% to 79% range withword (-suffix, -prefix) exchanges or additions, and only onesentence is in remaining range of 0% to 69%, which has beendeleted in the latter news text.
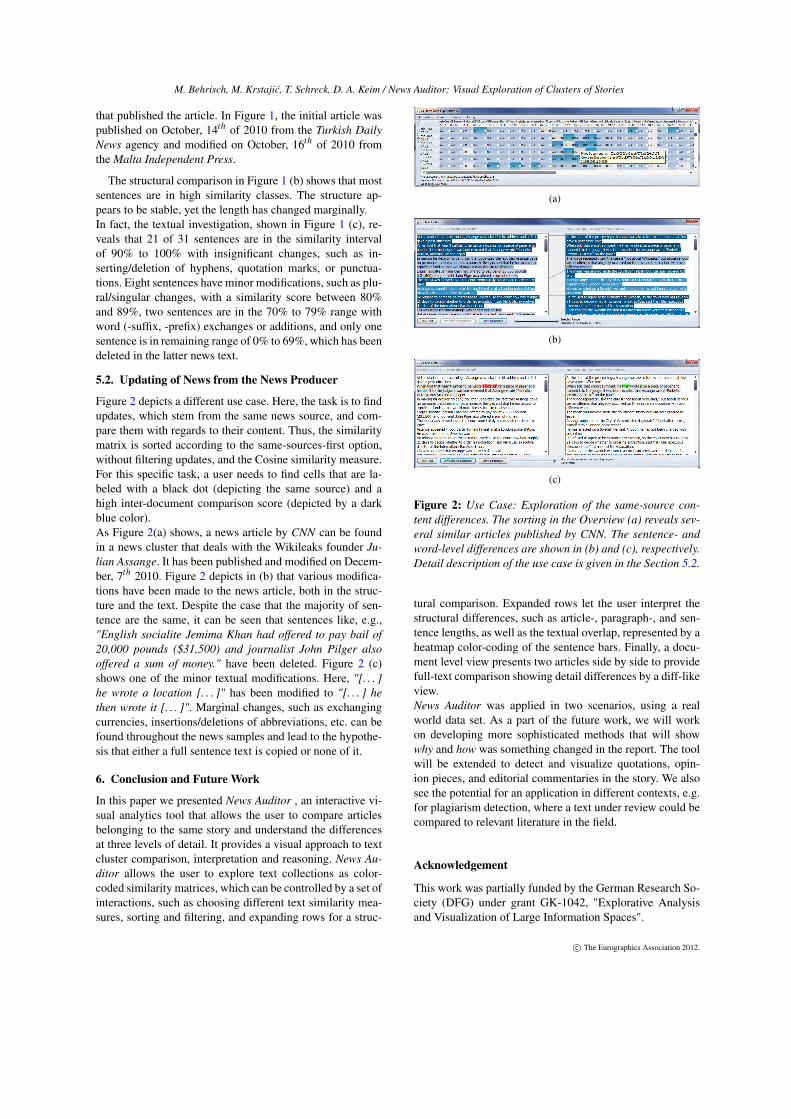
5.2. Updating of News from the News Producer
Figure 2 depicts a different use case. Here, the task is to findupdates, which stem from the same news source, and com-pare them with regards to their content. Thus, the similaritymatrix is sorted according to the same-sources-first option,without filtering updates, and the Cosine similarity measure.For this specific task, a user needs to find cells that are la-beled with a black dot (depicting the same source) and ahigh inter-document comparison score (depicted by a darkblue color).As Figure 2(a) shows, a news article by CNN can be foundin a news cluster that deals with the Wikileaks founder Ju-lian Assange. It has been published and modified on Decem-ber, 7th 2010. Figure 2 depicts in (b) that various modifica-tions have been made to the news article, both in the struc-ture and the text. Despite the case that the majority of sen-tence are the same, it can be seen that sentences like, e.g.,"English socialite Jemima Khan had offered to pay bail of20,000 pounds ($31,500) and journalist John Pilger alsooffered a sum of money." have been deleted. Figure 2 (c)shows one of the minor textual modifications. Here, "[. . . ]he wrote a location [. . . ]" has been modified to "[. . . ] hethen wrote it [. . . ]". Marginal changes, such as exchangingcurrencies, insertions/deletions of abbreviations, etc. can befound throughout the news samples and lead to the hypothe-sis that either a full sentence text is copied or none of it.
6. Conclusion and Future Work
In this paper we presented News Auditor , an interactive vi-sual analytics tool that allows the user to compare articlesbelonging to the same story and understand the differencesat three levels of detail. It provides a visual approach to textcluster comparison, interpretation and reasoning. News Au-ditor allows the user to explore text collections as color-coded similarity matrices, which can be controlled by a set ofinteractions, such as choosing different text similarity mea-sures, sorting and filtering, and expanding rows for a struc-
(a)
(b)
(c)
Figure 2: Use Case: Exploration of the same-source con-tent differences. The sorting in the Overview (a) reveals sev-eral similar articles published by CNN. The sentence- andword-level differences are shown in (b) and (c), respectively.Detail description of the use case is given in the Section 5.2.
tural comparison. Expanded rows let the user interpret thestructural differences, such as article-, paragraph-, and sen-tence lengths, as well as the textual overlap, represented by aheatmap color-coding of the sentence bars. Finally, a docu-ment level view presents two articles side by side to providefull-text comparison showing detail differences by a diff-likeview.News Auditor was applied in two scenarios, using a realworld data set. As a part of the future work, we will workon developing more sophisticated methods that will showwhy and how was something changed in the report. The toolwill be extended to detect and visualize quotations, opin-ion pieces, and editorial commentaries in the story. We alsosee the potential for an application in different contexts, e.g.for plagiarism detection, where a text under review could becompared to relevant literature in the field.
Acknowledgement
This work was partially funded by the German Research So-ciety (DFG) under grant GK-1042, "Explorative Analysisand Visualization of Large Information Spaces".
c© The Eurographics Association 2012.
M. Behrisch, M. Krstajic, T. Schreck, D. A. Keim / News Auditor: Visual Exploration of Clusters of Stories
References[Bre12] BREWER C.: Heatmap coloring options - color brewer.http://colorbrewer2.org/, 2012. Online; accessed 25-Feb-2012. 3
[CV07] CILIBRASI R. L., VITANYI P. M. B.: The google simi-larity distance. IEEE Trans. on Knowl. and Data Eng. 19 (March2007), 370–383. 3
[EMM12] EMM: Europe media monitor. http://emm.newsbrief.eu/, 2012. Online; accessed 25-Feb-2012. 2
[ESS92] EICK S. G., STEFFEN J. L., SUMNER JR. E. E.:Seesoft-a tool for visualizing line oriented software statistics.IEEE Trans. Softw. Eng. 18 (November 1992), 957–968. 2, 3
[Hea95] HEARST M. A.: Tilebars: visualization of term distribu-tion information in full text information access. In Proceedingsof the SIGCHI conference on Human factors in computing sys-tems (1995), CHI ’95, ACM Press/Addison-Wesley PublishingCo., pp. 59–66. 2
[HM76] HUNT J. W., MCILROY M. D.: An Algorithm for Differ-ential File Comparison. Tech. Rep. 41, Bell Laboratories Com-puting Science, July 1976. 3
[KMS∗10] KRSTAJIC M., MANSMANN F., STOFFEL A.,ATKINSON M., KEIM D.: Processing online news streams forlarge-scale semantic analysis. In DESWEB: 1st InternationalWorkshop on Data Engineering meets the Semantic Web (2010).3
[KO07] KEIM D. A., OELKE D.: Literature fingerprinting: A newmethod for visual literary analysis. In IEEE Symposium on VisualAnalytics Science and Technology (VAST) (2007), n/a, pp. 115–122. peer-reviewed (full). 2
[LBK09] LESKOVEC J., BACKSTROM L., KLEINBERG J.:Meme-tracking and the dynamics of the news cycle. In KDD’09: Proceedings of the 15th ACM SIGKDD international con-ference on Knowledge discovery and data mining (2009), ACM,pp. 497–506. 2
[LKS05] LLOYD L., KECHAGIAS D., SKIENA S.: Lydia: A sys-tem for large-scale news analysis. In String Processing andInformation Retrieval: 12th International Conference, SPIRE2005, Buenos Aires, Argentina, November 2-4, 2005: Proceed-ings (2005), pp. 161–166. 2
[MJS07] MANKU G. S., JAIN A., SARMA A. D.: Detecting near-duplicates for web crawling. In WWW ’07: Proceedings of the16th international conference on World Wide Web (New York,NY, USA, 2007), ACM, pp. 141–150. 2
[OSSK10] OELKE D., SPRETKE D., STOFFEL A., KEIM D. A.:Visual Readability Analysis: How to make your writings easierto read. In Proceedings of IEEE Conference on Visual AnalyticsScience and Technology (VAST ’10) (2010), pp. 123 – 130. 2
[SFDBC11] SNOWSILL T. M., FYSON N., DE BIE T., CRIS-TIANINI N.: Refining causality: who copied from whom? InProceedings of the 17th ACM SIGKDD international conferenceon Knowledge discovery and data mining (New York, NY, USA,2011), KDD ’11, ACM, pp. 466–474. 2
[Shn96] SHNEIDERMAN B.: The eyes have it: A task by data typetaxonomy for information visualizations. In Visual Languages,1996. Proceedings., IEEE Symposium on (1996), IEEE, pp. 336–343. 3
[Wes12] WESKAMP M.: Newsmap. http://newsmap.jp/,2012. Online; accessed 25-February-2012. 2
c© The Eurographics Association 2012.