The New Zealand Medical Workforce in 2018 · 2020-01-10 · The New Zealand Medical Workforce in...
58
The New Zealand Medical Workforce in 2018
Transcript of The New Zealand Medical Workforce in 2018 · 2020-01-10 · The New Zealand Medical Workforce in...

The New Zealand Medical Workforce in 2018 1
The New Zealand Medical Workforce in 2018
The New Zealand Medical Workforce in 2018 2
Contents
Foreword ................................................................................................................................... 3 Introduction and acknowledgements ....................................................................................... 4 Key findings ............................................................................................................................... 4 Facts at a glance ........................................................................................................................ 4 Ethnicity ..................................................................................................................................... 5 Gender ..................................................................................................................................... 10 Changes in the medical workforce .......................................................................................... 13 Work type ................................................................................................................................ 18 Workloads................................................................................................................................ 21 Geographic distribution ........................................................................................................... 26 International medical graduates ............................................................................................. 35 Retention — how long do our doctors stay ............................................................................ 37 Data sources used in this publication ...................................................................................... 42 Representativeness of the survey data ................................................................................... 42 Survey method ........................................................................................................................ 44 Explanation of terms used ....................................................................................................... 48 More information .................................................................................................................... 50 Appendix 1 – Changes in the medical workforce by work role ............................................... 51 Appendix 2 – Work type .......................................................................................................... 52 Appendix 3 – Age ..................................................................................................................... 53 Appendix 4 – Ethnicity by work type ....................................................................................... 54 Appendix 5 – Retention of New Zealand graduates ................................................................ 56 Appendix 6 – List of tables and figures .................................................................................... 57

The New Zealand Medical Workforce in 2018 3
Foreword Tenā koutou, Council is pleased to present the 2018 Workforce Survey. The survey is an important annual event for Council, and is informed by data collected through the annual practising certificate (APC) application process. The survey provides a snapshot of the current medical workforce and gives insights into the changing demographics of the profession, and the trends around where and how much doctors are working. To doctors - thank you for participating and for the work you do in service of New Zealanders. To other readers, we trust the workforce survey will be of interest and use to you. Noho ora mai Dr Curtis Walker Chairperson Medical Council of New Zealand

The New Zealand Medical Workforce in 2018 4
Introduction and acknowledgements This report presents the results of the Medical Council of New Zealand workforce survey for 2018. It contains information about changes in the medical workforce including retention rates for doctors. Andrew Cullen, Council’s Senior Information Systems Analyst prepared the report with support from other Council staff and Bill Grant of AllGo Analytics. We would like to thank all the doctors who responded to the survey and provided the valuable data on the type and amount of work they are doing.
Key findings Māori doctors are still under-represented in the medical workforce, but positive changes at graduate level continue The proportion of Māori doctors is 3.5 percent, well below the proportion of Māori in the New Zealand population. However, in 2018 almost 16 percent of Otago’s graduates and 14 percent of Auckland’s graduates were Māori. The proportion of female doctors increased 45.8 percent of doctors in the active workforce were female, up one percentage point from 2017. Women remain on track to outnumber men by 2025. The number of practising doctors increased: The total number of doctors, based on registration data, increased by 4.2 percent in 2018 from 15,819 to 16,292. This represents doctors on the register with a current practising certificate. The fastest growing specialties were urgent care, emergency medicine, and ophthalmology The number of doctors registered in a vocational scope of urgent care increased by almost 10 percent in 2018. Emergency medicine increased by 6.6 percent and ophthalmology increased by 6.4 percent.
Facts at a glance 2013 2014 2015 2016 2017 2018
Size of the workforce1 14,283 14,533 14,737 15,212 15,819 16,292
Doctors per 100,000 population2 317.7 317.6 318.1 321.3 327.9 333.5
Proportion of IMGs3 (%) 41.9 42.0 40.4 40.4 40.0 40.1
Proportion of females (%) 41.7 42.4 43.5 43.9 44.8 45.1
Average age of workforce 45.5 45.7 45.2 45.5 45.9 46.1
Average weekly workload (hours) 43.7 43.6 44.4 44.7 44.2 43.8
Average proportion of new IMGs retained after 1 year4 54.5 55.4 56.9 57.7 58.4 -
1 Figures are based on registration data. See Table 4 for more information.
2 Figures are based on the size of the workforce as measured by registration data (see Table 4) and Statistics New Zealand’s estimated residential population as at 31 March of the particular survey period.
3 IMG: international medical graduate (see page 48 for definition).
4 See ‘Retention’ on page 37 for more information and ‘Survey method’ on page 42 for information on how this figure was calculated.

The New Zealand Medical Workforce in 2018 5
Ethnicity
Changes in ethnicity of the workforce over time
The proportion of doctors who identify as Māori is 3.5 percent. This is down from 2017 when it was 3.6 percent, but an increase from 2010 when it was 3.0 percent. The proportion of Pasifika doctors is 1.8 percent. Again, this is down from 2017, but up from 2010 when it was 1.3 percent. The proportion of NZ European/Pākehā doctors is 51.0 percent, up from 50.2 percent. The proportion of doctors identifying as other European was also up slightly but remains about 20 percent as it has since 2010. Table 1: Proportion of doctors by ethnic group (%)
Ethnicity 2000 2005 2010 2015 2018
Māori 2.3 2.6 3.0 3.4 3.5
Pacific Island (Pasifika) 1.1 1.5 1.3 2.0 1.8
Chinese 4.5 5.4 5.3 5.9 5.8
Indian 4.5 5.1 5.9 6.0 5.5
Other non-European 7.6 10.8 9.9 11.9 10.6
Other European1 - 15.4 19.7 20.5 19.5
NZ European/Pākehā 76.5 57.5 53.3 51.4 51.0
Not answered 3.2 1.5 1.5 2.4 2.3
Refused2 0.2 0.2 0.2 - -
Total3 100.0 100.0 100.0 100.0 100.0 1 In 2000, other European and NZ European/ Pākehā were combined in one category.
2 From 2016, not answered is no longer an available option. The ethnicity question can only be answered or refused.
3 Individual categories may not add up to total due to rounding.
Proportion of doctors by ethnicity in the workforce compared with the New Zealand population
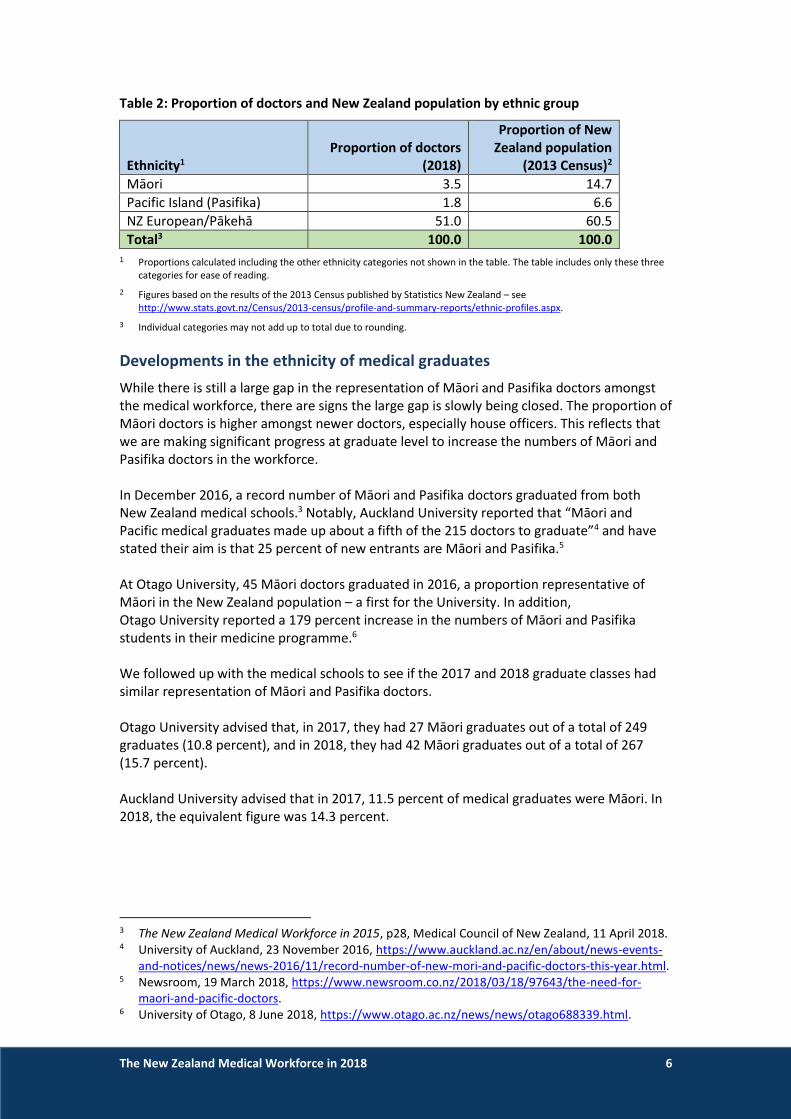
Māori and Pasifika are noticeably under-represented compared to their proportion of the population, even allowing for differences in method.1 Māori make up 14.7 percent of the population, but only 3.5 percent of doctors. Almost 7 percent of New Zealanders identify as Pasifika compared to less than 2 percent of doctors. What would a representative workforce look like? If the number of doctors reflected the makeup of the New Zealand population, there would be 2,410 Māori doctors and 1,082 Pasifika doctors. The results of the survey suggest there are currently about 573 Māori doctors and 295 Pasifika doctors2. This is a significant gap, but it is closing. We talk more about the developments in this area in the next section.
1 We are using a prioritised count to assign a doctor to one ethnic group (see the survey method section on page 46), whereas Statistics New Zealand counts a person once for every ethnic group they identify with. Because of the way the Census results were published, it was not possible to find an equivalent figure for each group.
2 Applying the percentages for each group in Table 2 to the number of registered doctors with a current practising certificate as at 31 March 2018 - 16,389.
The New Zealand Medical Workforce in 2018 6
Table 2: Proportion of doctors and New Zealand population by ethnic group
Ethnicity1 Proportion of doctors
(2018)
Proportion of New Zealand population
(2013 Census)2
Māori 3.5 14.7
Pacific Island (Pasifika) 1.8 6.6
NZ European/Pākehā 51.0 60.5
Total3 100.0 100.0 1 Proportions calculated including the other ethnicity categories not shown in the table. The table includes only these three
categories for ease of reading.
2 Figures based on the results of the 2013 Census published by Statistics New Zealand – see http://www.stats.govt.nz/Census/2013-census/profile-and-summary-reports/ethnic-profiles.aspx.
3 Individual categories may not add up to total due to rounding.
Developments in the ethnicity of medical graduates
While there is still a large gap in the representation of Māori and Pasifika doctors amongst the medical workforce, there are signs the large gap is slowly being closed. The proportion of Māori doctors is higher amongst newer doctors, especially house officers. This reflects that we are making significant progress at graduate level to increase the numbers of Māori and Pasifika doctors in the workforce. In December 2016, a record number of Māori and Pasifika doctors graduated from both New Zealand medical schools.3 Notably, Auckland University reported that “Māori and Pacific medical graduates made up about a fifth of the 215 doctors to graduate”4 and have stated their aim is that 25 percent of new entrants are Māori and Pasifika.5 At Otago University, 45 Māori doctors graduated in 2016, a proportion representative of Māori in the New Zealand population – a first for the University. In addition, Otago University reported a 179 percent increase in the numbers of Māori and Pasifika students in their medicine programme.6 We followed up with the medical schools to see if the 2017 and 2018 graduate classes had similar representation of Māori and Pasifika doctors. Otago University advised that, in 2017, they had 27 Māori graduates out of a total of 249 graduates (10.8 percent), and in 2018, they had 42 Māori graduates out of a total of 267 (15.7 percent). Auckland University advised that in 2017, 11.5 percent of medical graduates were Māori. In 2018, the equivalent figure was 14.3 percent.
3 The New Zealand Medical Workforce in 2015, p28, Medical Council of New Zealand, 11 April 2018. 4 University of Auckland, 23 November 2016, https://www.auckland.ac.nz/en/about/news-events-
and-notices/news/news-2016/11/record-number-of-new-mori-and-pacific-doctors-this-year.html. 5 Newsroom, 19 March 2018, https://www.newsroom.co.nz/2018/03/18/97643/the-need-for-
maori-and-pacific-doctors. 6 University of Otago, 8 June 2018, https://www.otago.ac.nz/news/news/otago688339.html.

The New Zealand Medical Workforce in 2018 7
Ethnicity by age
Māori, Pasifika, and Chinese all have average ages lower than the overall figure. Chinese doctors have the lowest average age for females – 36 years. Māori are the youngest group amongst males – 40 years. Both females and males identifying as NZ European/Pākehā had an average age higher than the overall figure, with male doctors the only group to have an average age greater than 50 (51 years).
Table 3: Average age of doctors by ethnicity and gender
Average age
Ethnicity Female Male Overall
Māori 38 40 39
Pacific Island (Pasifika) 38 44 41
Chinese 36 41 39
Indian 44 46 45
Other non-European 41 44 43
Other European 42 47 44
NZ European/Pākehā 44 51 48
All doctors 40 44 42
Ethnicity by age group Māori and Pasifika doctors are more likely to be aged under 35 years compared with NZ European/Pākehā doctors and the overall workforce. Forty-one percent of Māori doctors are aged 34 and under, compared with 24.7 percent of the overall workforce. Figure 1: Ethnicity by age group (selected groups)

The New Zealand Medical Workforce in 2018 8
Doctors identifying as other European are more likely to be 45 or over – 63 percent. They are relatively less likely to be aged under 35 – only 19.5 percent. This group is the second largest group behind NZ European/Pākehā. This increased number of older doctors may reflect IMGs7 who come to New Zealand after already working as doctors for several years.
Ethnicity by work role
The proportion of Māori and Pasifika doctors reporting their work role as house officers and registrars is higher than that for NZ European/Pākehā (44.5 percent for Māori, 39.7 percent for Pasifika and 20.9 percent for NZ European/Pākehā). This reflects their greater representation amongst younger doctors.
Specialists Conversely, the proportion of doctors reporting as specialists and medical officers (MOSS) is highest amongst NZ European/Pākehā doctors (44.6 percent), compared to only 29.5 percent for Māori and 28.1 percent for Pasifika. The proportion of doctors reporting as general practitioners was a lot more consistent across ethnicities. Pasifika doctors were most likely to be a GP with 30.1 percent reporting this, followed by NZ European/Pākehā doctors (29.0 percent). Māori doctors were least likely to work as a GP with only 23.5 percent reporting this work role. Figure 2: Proportion of ethnic groups by work role at main work site
7 IMG: international medical graduate (see page 34 for definition).

The New Zealand Medical Workforce in 2018 9
Māori working in general practice Māori doctors made up just under three percent of doctors working as GPs (based on work role). Some GPs may still be in training and reporting their work role as registrar. Expanding the criteria to include doctors who reported working in general practice in any work role, the percentage of Māori doctors is slightly higher – 3.4 percent. In either case, the level of representation is less than in the workforce as a whole. We reported in the 2017 publication that the Royal New Zealand College of GPs (RNZCGP) is working to improve the representation of Māori doctors amongst GPs. The goals the RNZCGP are aspiring to achieve by 2021 are to increase the number of: - Māori GPEP1 registrars to 22 percent of the annual intake, - Māori GPs in Taranaki, Whanganui and Hauora Tairāwhiti to add 50 percent more GPs,
and - Māori GP teachers, medical educators and examiners.8
Proportional representation at graduate level may not be enough One challenge to general practice and other specialties increasing the representation of Māori doctors amongst their numbers is that the pool of available Māori doctors graduating from medical schools is limited. As we reported earlier, representation of Māori doctors amongst medical graduates is still slightly behind compared with representation of Māori in the New Zealand population. There are about 190 fully funded general practice training (GPEP1) places. To achieve their goal of 22 percent Māori representation, the RNZCGP would need to increase the number of Māori registrars to about 42. New Zealand registered 476 new graduates in 2018. About 15 percent of these were Māori, so approximately 71 doctors. Therefore, the RNZCGP would need 60 percent of new Māori graduates to achieve their goal. This would leave the other specialties competing for the remaining graduates, all of which are likely have similar goals to increase their Māori representation. More Māori doctors at graduate level are needed for specialties like general practice to improve Māori representation. This may mean New Zealand needs to aim for Māori representation amongst medical students that is greater than Māori representation in the New Zealand population.
8 New Zealand Doctor, TIME TO KŌRERO. Te reo! Give it a go, 12 September 2018, https://www.nzdoctor.co.nz/article/print-archive/time-korero-te-reo-give-it-go.

The New Zealand Medical Workforce in 2018 10
Gender
Vocational trainees
Female doctors make up the majority of doctors in vocational training – 55.9 percent. Female doctors are most highly represented in obstetrics & gynaecology (84.1 percent), paediatrics (75 percent), pathology (70.2 percent). They are also highly represented in general practice and rural hospital medicine (both about 65 percent). Male doctors are most highly represented in orthopaedic surgery (90 percent), diagnostic radiology (67 percent), and general surgery (64 percent). Figure 3 shows the proportion of trainees in each vocational training area by gender, focusing on those areas with more than 20 trainees. Figure 3: Vocational training area by gender (areas with more than 20 trainees)
The New Zealand Medical Workforce in 2018 11
Work role
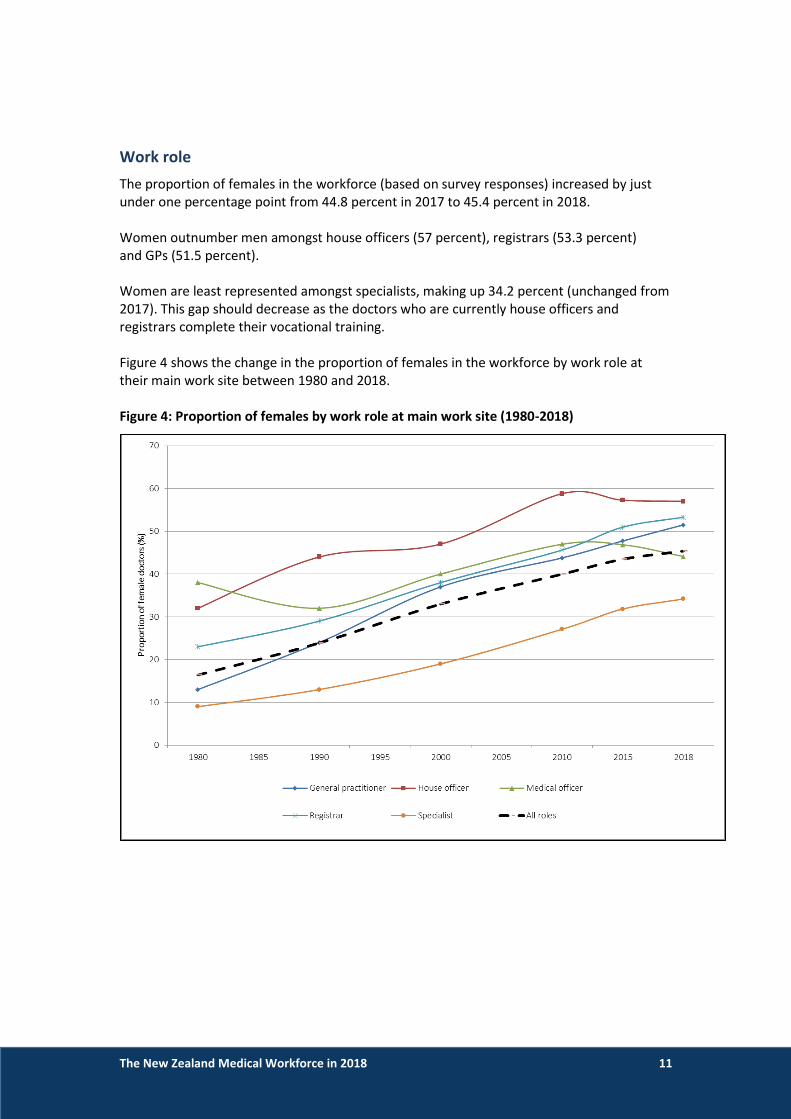
The proportion of females in the workforce (based on survey responses) increased by just under one percentage point from 44.8 percent in 2017 to 45.4 percent in 2018. Women outnumber men amongst house officers (57 percent), registrars (53.3 percent) and GPs (51.5 percent). Women are least represented amongst specialists, making up 34.2 percent (unchanged from 2017). This gap should decrease as the doctors who are currently house officers and registrars complete their vocational training. Figure 4 shows the change in the proportion of females in the workforce by work role at their main work site between 1980 and 2018. Figure 4: Proportion of females by work role at main work site (1980-2018)

The New Zealand Medical Workforce in 2018 12
Work types
Women are most highly represented in the areas of obstetrics and gynaecology (64.6 percent), paediatrics (59.5 percent), public health medicine (57.9 percent) and general practice (52.5 percent). Women are least represented in orthopaedic surgery (10.9 percent), otolaryngology head and neck surgery (23.3 percent), general surgery (25.8 percent) and ophthalmology (31.4 percent). Looking at all the surgical work types together, women make up 19.5 percent of doctors. Female doctors have long been under-represented amongst surgical work types, but this is slowly improving. In 2005, women made up 9.2 percent of doctors working in surgery. This increased slightly to 11.8 percent in 2010 and 18.0 percent in 2015. Figure 5 shows the distribution by gender for work types with a total of 100 or more doctors. Figure 5: Proportion of doctors by work type and gender
The New Zealand Medical Workforce in 2018 13
Changes in the medical workforce
Size of the workforce
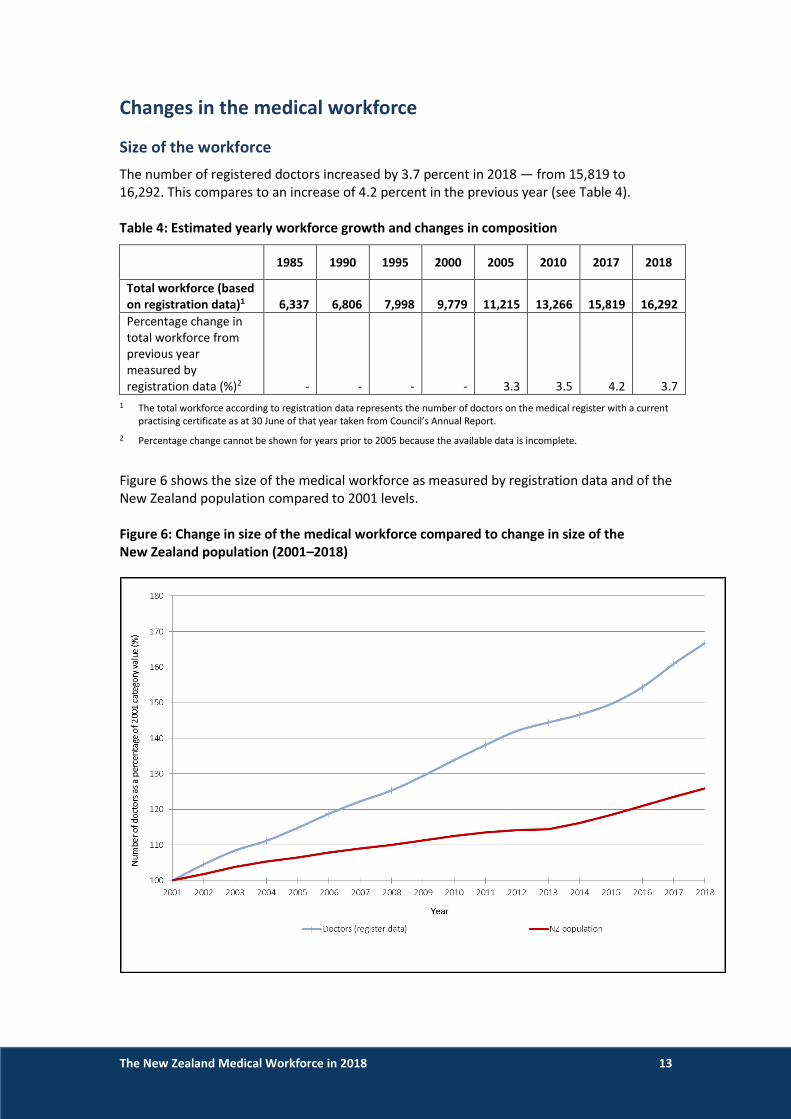
The number of registered doctors increased by 3.7 percent in 2018 — from 15,819 to 16,292. This compares to an increase of 4.2 percent in the previous year (see Table 4). Table 4: Estimated yearly workforce growth and changes in composition
1985 1990 1995 2000 2005 2010 2017 2018
Total workforce (based on registration data)1
6,337
6,806
7,998
9,779
11,215
13,266 15,819 16,292
Percentage change in total workforce from previous year measured by registration data (%)2 - - - - 3.3
3.5 4.2 3.7
1 The total workforce according to registration data represents the number of doctors on the medical register with a current practising certificate as at 30 June of that year taken from Council’s Annual Report.
2 Percentage change cannot be shown for years prior to 2005 because the available data is incomplete.
Figure 6 shows the size of the medical workforce as measured by registration data and of the New Zealand population compared to 2001 levels. Figure 6: Change in size of the medical workforce compared to change in size of the New Zealand population (2001–2018)

The New Zealand Medical Workforce in 2018 14
Age distribution of the workforce
The average age of the workforce is higher than it used to be. However, the overall distribution of doctors is now a lot more evenly spread. Figure 4 compares the age distribution of the active workforce9 based on survey data from 1980 to 2017. We’ve focused on selected series (1980, 1990, 2000, 2010, and 2018) to make it easier to see the changes over time. In 2018, the largest group of doctors were those aged 55–59 (12.8 percent); however, those aged 25-29 and 30-34 were not too far behind (11.8 and 11.4 percent respectively). This reflects the increased numbers of graduates being produced by New Zealand’s medical schools in recent years (see Table 23 on page 56). Figure 7: Age distribution of the active workforce (1980–2018)
9 Active doctors are those who responded to the workforce survey and reported working 4 or more hours per week.

The New Zealand Medical Workforce in 2018 15
Gender distribution of the workforce
The proportion of women in the workforce is continuing to increase. In 2018, 45.8 percent of the active workforce were female. This compares with 44.8 percent in 2016 and 43.9 percent in 2016. Figure 8 compares the proportion of females in the active workforce at 5-yearly intervals going back to 1980. This shows that the proportion of females was just 16.4 percent in 1980 but has been increasing steadily since that time. A rough projection of the current trend suggests that women will outnumber men by 2025. Figure 8: Proportion of active doctors by gender (1980–2018) showing projected trend forward to 2025.

The New Zealand Medical Workforce in 2018 16
Distribution by age and gender
There are more young female doctors than young male doctors. The largest groups of female doctors are those aged between 25 and 34. The largest group of male doctors is those aged 55–59. This reflects that women outnumber men amongst medical school graduates. See Figure 4 on page 11. Figure 9 shows the distribution of doctors by age and gender using a population pyramid. Figure 9: Distribution of active doctors by age and gender
The New Zealand Medical Workforce in 2018 17
Changes by work role
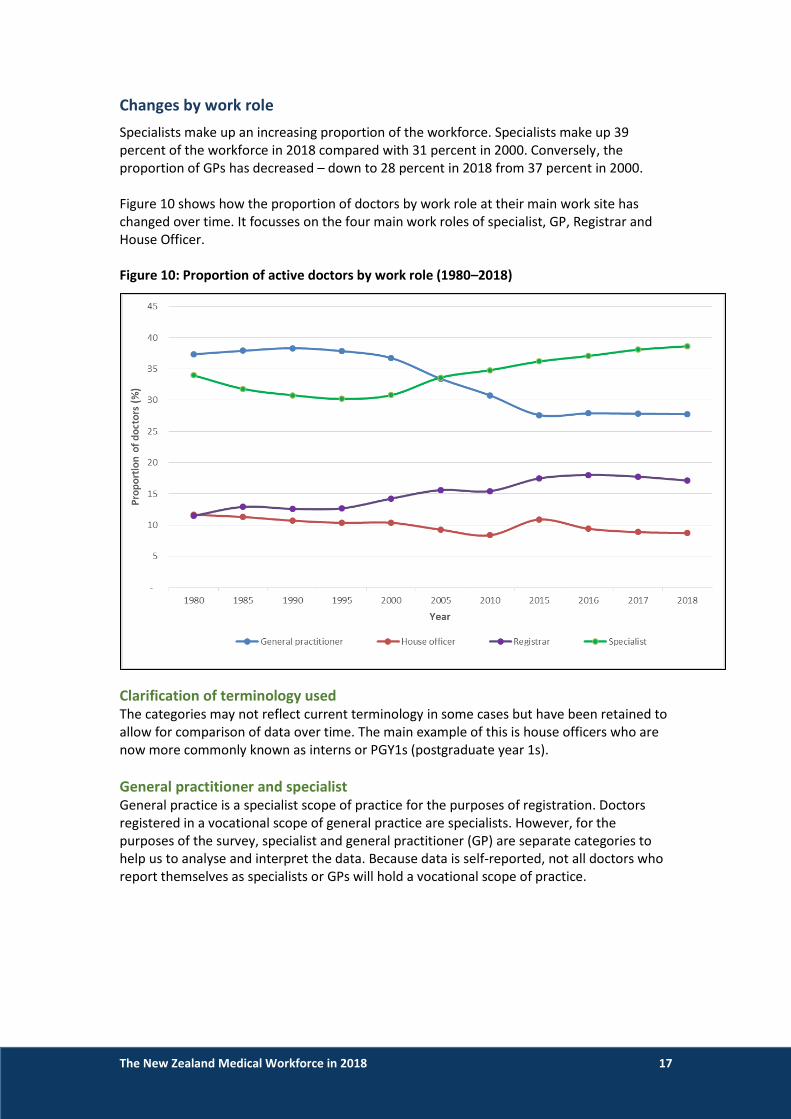
Specialists make up an increasing proportion of the workforce. Specialists make up 39 percent of the workforce in 2018 compared with 31 percent in 2000. Conversely, the proportion of GPs has decreased – down to 28 percent in 2018 from 37 percent in 2000. Figure 10 shows how the proportion of doctors by work role at their main work site has changed over time. It focusses on the four main work roles of specialist, GP, Registrar and House Officer. Figure 10: Proportion of active doctors by work role (1980–2018)
Clarification of terminology used The categories may not reflect current terminology in some cases but have been retained to allow for comparison of data over time. The main example of this is house officers who are now more commonly known as interns or PGY1s (postgraduate year 1s).
General practitioner and specialist General practice is a specialist scope of practice for the purposes of registration. Doctors registered in a vocational scope of general practice are specialists. However, for the purposes of the survey, specialist and general practitioner (GP) are separate categories to help us to analyse and interpret the data. Because data is self-reported, not all doctors who report themselves as specialists or GPs will hold a vocational scope of practice.

The New Zealand Medical Workforce in 2018 18
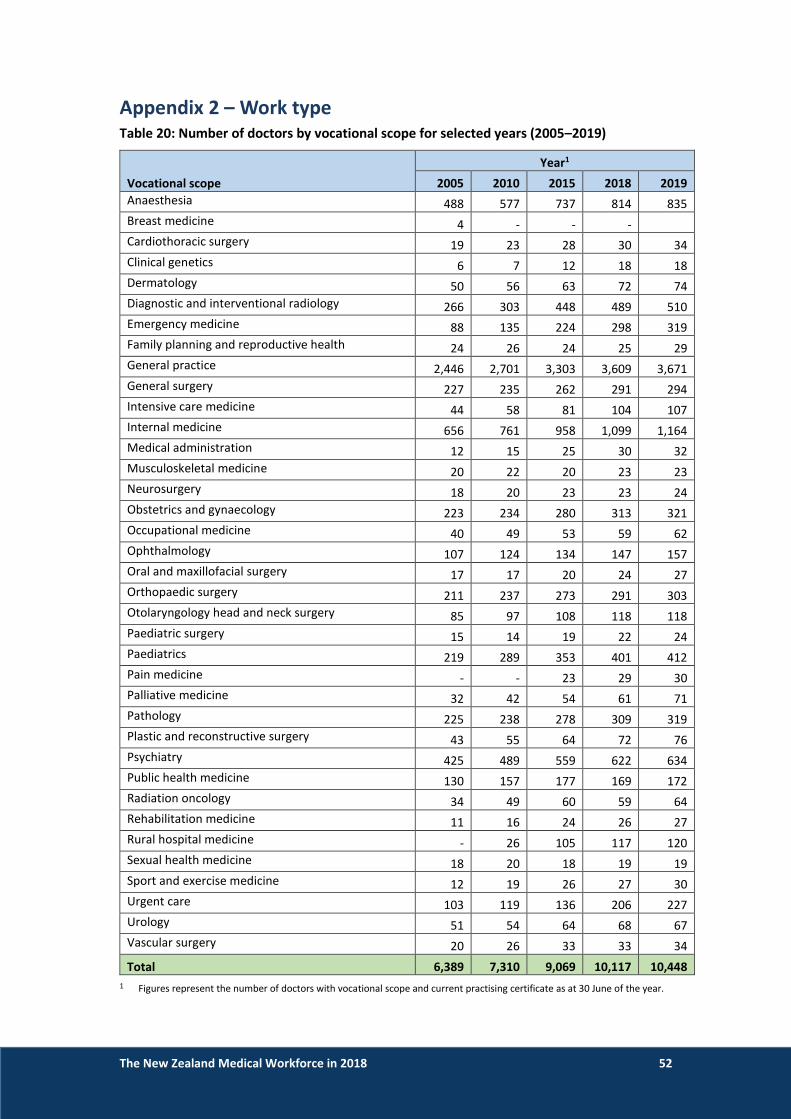
Work type The vocational scopes of urgent care, emergency medicine and ophthalmology increased the most between 2018 and 2019. Urgent care increased by 9.3 percent, with emergency medicine and ophthalmology increasing by 6.6 percent and 6.4 percent. General practice, the largest vocational scope with 3,671 doctors in 2019, increased by 1.7 percent. Internal medicine, the second largest with 1,164 doctors, increased by 5.6 percent. Urology was the only scope to decrease – down 1.5 percent. Sexual health medicine, otolaryngology head and neck surgery, musculoskeletal medicine, and clinical genetics did not change between 2018 and 2019. Table 5 show the changes in the number of doctors registered in vocational scopes. Only scopes with more than 100 doctors in 2019 are shown. The full list including all vocational scopes can be found in Table 20 on page 52. Table 5: Number of doctors by vocational scope for selected years (2005–2019)
Vocational scope
Year1 Percent change
2018–2019 2005 2010 2015 2018 2019
General practice 2,446 2,701 3,303 3,609 3,671 +1.7
Internal medicine 656 761 958 1,099 1,164 +5.6
Anaesthesia 488 577 737 814 835 +2.5
Psychiatry 425 489 559 622 634 +1.9
Diagnostic and interventional radiology 266 303 448 489 510 +4.1
Paediatrics 219 289 353 401 412 +2.7
Pathology 225 238 278 309 319 +3.1
Obstetrics and gynaecology 223 234 280 313 321 +2.5
General surgery 227 235 262 291 294 +1.0
Orthopaedic surgery 211 237 273 291 303 +4.0
Emergency medicine 88 135 224 298 319 +6.6
Public health medicine 130 157 177 169 172 +1.7
Urgent care 103 119 136 206 227 +9.3
Ophthalmology 107 124 134 147 157 +6.4
Otolaryngology head and neck surgery 85 97 108 118 118 0.0
Intensive care medicine 44 58 81 104 107 +2.8
Rural hospital medicine - 26 105 117 120 +2.5
Total 6,389 7,310 9,069 10,117 +3.6
1 Figures represent the number of doctors with vocational scope and current practising certificate as at 30 June of the year.
The New Zealand Medical Workforce in 2018 19
Work type and age
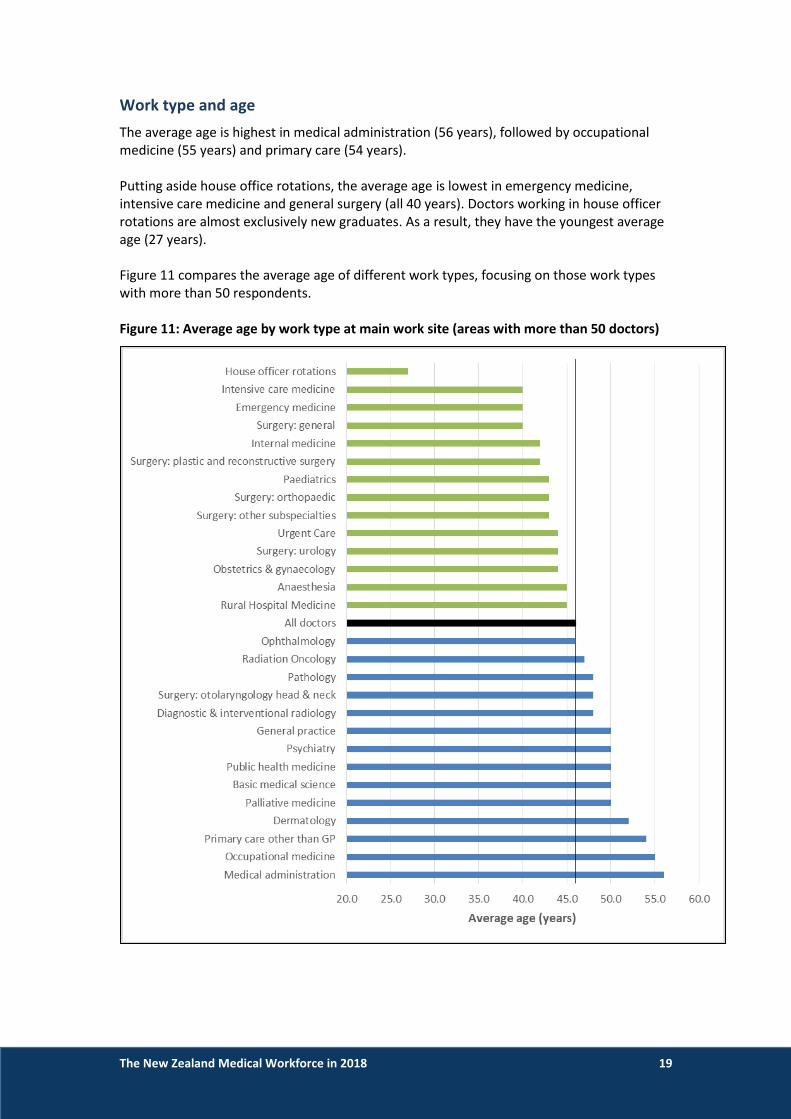
The average age is highest in medical administration (56 years), followed by occupational medicine (55 years) and primary care (54 years). Putting aside house office rotations, the average age is lowest in emergency medicine, intensive care medicine and general surgery (all 40 years). Doctors working in house officer rotations are almost exclusively new graduates. As a result, they have the youngest average age (27 years). Figure 11 compares the average age of different work types, focusing on those work types with more than 50 respondents. Figure 11: Average age by work type at main work site (areas with more than 50 doctors)

The New Zealand Medical Workforce in 2018 20
A note on internal medicine Respondents to the survey who reported working in internal medicine have an average age of 42 years. One possible explanation for this is doctors reporting a work role of house officer and a work type of internal medicine. If the work type of house officer is excluded, the average age for doctors working in internal medicine is 44 years. If we look only at doctors who reported working as a specialist, the average age is 51 years.
Age and vocational scopes Looking at vocational scopes with 100 or more doctors, otolaryngology head & neck surgery and psychiatry have the highest average age – 54 years. General practice was next highest with an average age of 53 years. The youngest vocational scope is emergency medicine with an average age of 46 years. The next youngest are anaesthesia and diagnostic and interventional medicine, both with an average age of 49 years. The average age of all doctors with a vocational scope is 52 years in 2019, up from 48 years in 2005. Table 6 shows that the average age of doctors on the register with a current practising certificate and a vocational scope of practice between 2005 and 2019, focusing on scopes with 100 or more doctors. Table 21 on page 53 shows the same analysis but for all scopes. Table 6: Average age of doctors on the register with a vocational scope (2005–2019)
Vocational scope
Year
2005 2010 2015 2018 2019
Anaesthesia 46 48 49 49 49
Diagnostic and interventional radiology 48 49 49 49 49
Emergency medicine 41 43 45 45 46
General practice 49 51 53 53 53
General surgery 49 51 51 51 52
Intensive care medicine 46 48 49 50 50
Internal medicine 50 51 50 51 51
Obstetrics and gynaecology 49 51 52 52 52
Ophthalmology 49 50 51 51 51
Orthopaedic surgery 49 50 52 52 52
Otolaryngology head and neck surgery 49 51 53 53 54
Paediatrics 47 48 49 50 50
Pathology 49 50 51 51 51
Psychiatry 48 50 52 53 54
Public health medicine 47 49 51 52 52
Rural hospital medicine 47 49 50 51
Urgent care 45 48 51 51 52
All doctors with vocational scope 48 50 51 52 52

The New Zealand Medical Workforce in 2018 21
Workloads
Hours worked by work type
Doctors in general surgery work the most hours (55.8 hours per week) followed by house officer rotations (56.4 hours), orthopaedic surgery (55.1 hours) and intensive care medicine (54.3 hours). Doctors in primary care (34.2 hours), urgent care (35.6 hours), and general practice (35.9 hours) worked the least hours. This reflects the number of doctors working part-time in these specialties. 72 percent of doctors in general practice reported working less than 40 hours per week compared with 13 percent for general surgery. Figure 12 shows the average hours worked by work type, looking only at those work types with 50 or more respondents. Figure 12: Average hours worked by work type (areas with more than 50 respondents)

The New Zealand Medical Workforce in 2018 22
Hours worked by work role
The average number of hours doctors reported working is decreasing – from 47.1 hours in 2000 to 44.2 hours in 2018. House officers and registrars work the most hours, with GPs and specialists working the least hours. Hours reported by house officers and registrars decreased between 2000 and 2010 but has increased in recent years. House officers are the only group reporting more hours than they did in 2000. We have no information on why hours reported by house officers are increasing. Given the improvements in employment conditions for new doctors, it is surprising. One possibility is that some house officers are trying to report multiple rotations rather than their typical or most recent working week. However, even looking at just the main work site, house officers reported working 55.1 hours per week – more than the workforce average. Average hours worked by specialists and GPs continues to decrease, with GPs down to 36.2 hours (from 42.2 in 2000) and specialists down to 44.3 hours (from 48.2 in 2000). This again reflects doctors working part-time. GPs and specialists are more likely to work part-time compared with house officers and registrars. 72.2 percent of GPs and 40.1 percent of specialists work less than 40 hours per week compared to only 8 percent of house officers and 24 percent of registrars. Table 7 shows the changes over time in the average number of hours worked each week, by work role, at the doctor’s main work site. Table 7: Average hours worked by work role (2000–2018)
Work role
Year
2000 2005 2010 2015 2018
General practitioner 42.2 39.8 37.8 37.1 36.2
House officer 55.7 54.6 52.1 53.7 57.1
Registrar 55.0 53.1 51.6 51.4 52.4
Specialist 48.2 46.6 45.2 45.0 44.3
All doctors 47.1 45.5 43.9 44.4 44.2

The New Zealand Medical Workforce in 2018 23
Hours worked by age and gender
Doctors aged in their 20s work the most hours per week, and women and men work a similar number of hours. After the age of 30, men work more hours per week than women, with the difference peaking in the 45-49 year age group where men work 46.5 hours compared with 36.2 for women. Overall, women reported working 40.9 hours per week compared with 46.2 hours for men. Table 8: Average of total hours worked, by age and gender
Gender
Age group All ages, average
hours ≤24 25–29 30–34 35–39 40–44 45–49 50–54 55–59 60–64 65–69 70+
Female 56.7 54.6 45.4 37.7 37.0 36.2 36.4 37.0 36.4 37.0 30.8 40.9
Male 57.4 54.9 52.1 47.0 45.9 46.5 46.3 45.6 44.4 38.2 31.2 46.2
All doctors 57.0 54.7 48.3 42.0 41.3 41.5 41.8 42.4 41.9 37.9 31.1 43.8
The average number of hours worked by both women and men is decreasing. The decrease is more pronounced for men than women. Women worked 40.9 hours per week in 2018 compared with 41.2 hours in 2015. Men worked 46.2 hours per week in 2018 compared with 46.8 hours in 2015 and 48.3 hours in 2005. Table 9: Average hours worked, by gender and year (2005–2018)
Gender
Year
2005 2010 2015 2016 2017 2018
Female 40.6 39.8 41.2 41.8 41.1 40.9
Male 48.3 46.6 46.8 47.0 46.7 46.2
All doctors 45.5 43.9 44.4 44.7 44.2 43.8
Gender and part-time work Women are much more likely to work part-time than men. Almost 41 percent of females reported working fewer than 40 hours compared with 19 percent of males. The most common reasons given by females for working part-time were personal preference (1,114 respondents), part-time work (516 respondents) and family commitments (482 respondents). Family commitments were also often mentioned by doctors who chose to report “other” as the reason. Some examples of these comments are:
- “Working part time as have a 1 year old child and another on the way. Family needs come first”.
- “My reasons for working less than 40 hours are complex - partly personal preference, partly difficulty getting work that fits in with family requirements”.
- “I find that this is my maximum capacity to maintain reasonable health and to be able to be available as a parent”.
- “To spend more time with 4 year old daughter and also because my spouse is a doctor who works very long hours. It is pertinent to have at least one parent around for my child”.

The New Zealand Medical Workforce in 2018 24
The most common reasons given by males for working part-time were personal preference (796 respondents), part-time work (134 respondents), and that they were retired or semi-retired. Only 44 male doctors reported family commitments as a reason for part-time work.
Paperwork and other non-clinical work Paperwork and other non-clinical work on top of clinical work was another common reason given for working less than 40 hours per week. Some examples of these comments are:
- “Actual clinical/paid-for hours of work per week is approximately 26 but I spend at least 36 hours per week physically at work due to paperwork (plus extra hours at home spent on paperwork not including CPD)”.
- “Significant additional hours spent on paperwork etc. so that total is much more than 40!”
- “Only paid for 32 [hours]. Do additional unpaid paperwork anywhere from 1-3 hours a day. So work four days of week, usually about 40 hours, but paid for 32”.
- “Although 30 hours is the paid amount, I work a lot more in overtime trying to deal with the increasing complexity of paperwork in general practice. Over the years I have reduced my hours so that I can practise at a good standard and not burn out”.
Hours on call by work role
Most doctors did not report being on-call – almost 68 percent of doctors reported no on-call hours. Specialists reported the most on-call hours. Just under 55 percent of specialists were on-call with 35 percent reporting 10 or more hours. House officers reported the least on-call hours – 96 percent indicating no on-call hours. Similarly, less than 15 percent of registrars reported on-call hours. For house officers and registrars, the lower number of on-call hours reflects the higher number of hours they work on average. Where doctors are on-call and are required to work, we ask them to record these hours in their hours worked rather than their on-call hours. Table 10 shows on-call hours by workforce role, grouped by on-call hours. Hours on call measures the additional hours when doctors were on call but were not required to work. If no on-call hours are reported, the doctor was either not on call or chose not to provide details of their on-call hours. Table 10: Doctors’ on-call hours, grouped in each work role (%)
On-call hours, grouped
General practitioner2
House officer Registrar
Medical officer Specialist
No on-call hours 75.7 96.2 85.8 74.5 45.2
1–4 6.9 0.7 1.3 2.2 7.0
5–9 4.1 1.2 3.5 4.7 11.9
10–19 5.2 0.9 5.8 8.4 19.0
20–49 5.2 0.8 3.2 8.4 14.0
50 and over 2.9 0.2 0.4 1.9 2.8
Total1 100.0 100.0 100.0 100.0 100.0
1 Individual categories may not add up to total due to rounding.
2 GP includes those doctors who reported a work role of primary care.
The New Zealand Medical Workforce in 2018 25
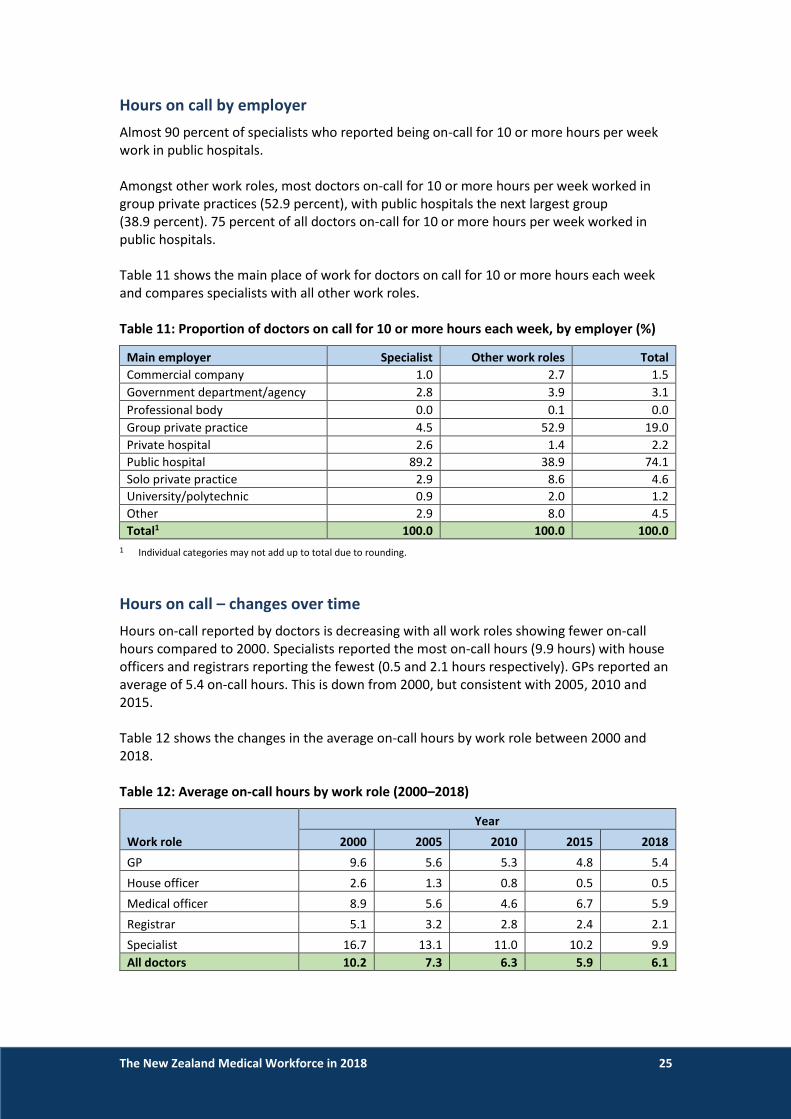
Hours on call by employer
Almost 90 percent of specialists who reported being on-call for 10 or more hours per week work in public hospitals. Amongst other work roles, most doctors on-call for 10 or more hours per week worked in group private practices (52.9 percent), with public hospitals the next largest group (38.9 percent). 75 percent of all doctors on-call for 10 or more hours per week worked in public hospitals. Table 11 shows the main place of work for doctors on call for 10 or more hours each week and compares specialists with all other work roles. Table 11: Proportion of doctors on call for 10 or more hours each week, by employer (%)
Main employer Specialist Other work roles Total
Commercial company 1.0 2.7 1.5
Government department/agency 2.8 3.9 3.1
Professional body 0.0 0.1 0.0
Group private practice 4.5 52.9 19.0
Private hospital 2.6 1.4 2.2
Public hospital 89.2 38.9 74.1
Solo private practice 2.9 8.6 4.6
University/polytechnic 0.9 2.0 1.2
Other 2.9 8.0 4.5
Total1 100.0 100.0 100.0
1 Individual categories may not add up to total due to rounding.
Hours on call – changes over time
Hours on-call reported by doctors is decreasing with all work roles showing fewer on-call hours compared to 2000. Specialists reported the most on-call hours (9.9 hours) with house officers and registrars reporting the fewest (0.5 and 2.1 hours respectively). GPs reported an average of 5.4 on-call hours. This is down from 2000, but consistent with 2005, 2010 and 2015. Table 12 shows the changes in the average on-call hours by work role between 2000 and 2018. Table 12: Average on-call hours by work role (2000–2018)
Work role
Year
2000 2005 2010 2015 2018
GP 9.6 5.6 5.3 4.8 5.4
House officer 2.6 1.3 0.8 0.5 0.5
Medical officer 8.9 5.6 4.6 6.7 5.9
Registrar 5.1 3.2 2.8 2.4 2.1
Specialist 16.7 13.1 11.0 10.2 9.9
All doctors 10.2 7.3 6.3 5.9 6.1

The New Zealand Medical Workforce in 2018 26
Geographic distribution
Important information about geographic data
We recommend you use caution in interpreting and relying on figures in this section. Although we take care in producing this data, several limitations mean that this data will not always be completely accurate. To allow data to be presented in geographic regions, we allocate every doctor who responds to the survey to their nearest territorial local authority (TLA) and district health board (DHB). Doctors often work in more than one location, and in allocating each doctor to a single TLA and DHB, we cannot fully represent every location in which the doctor is working. The results tend to favour larger DHBs where neighbouring geographic regions are closely related — for example, in the wider Auckland and Wellington regions. Doctors might work across the entire region throughout the year but will only be represented in these figures against one DHB. This tends to be the largest DHB in the region — Auckland DHB in the Auckland region and Capital & Coast in the Wellington region.
Effect of reduced response rate
We are unable to present geographic data as headcounts as we have done in the past because of the reduced response rates in 2017 and 2018. Instead, figures are presented as proportions of the total. We apologise that we are unable to provide the data as presented previously and appreciate this will make the data less useful for some stakeholders. We are looking at ways to source and present headcount data in future reports, potentially based on non-register data collected from doctors.
The New Zealand Medical Workforce in 2018 27
District health boards
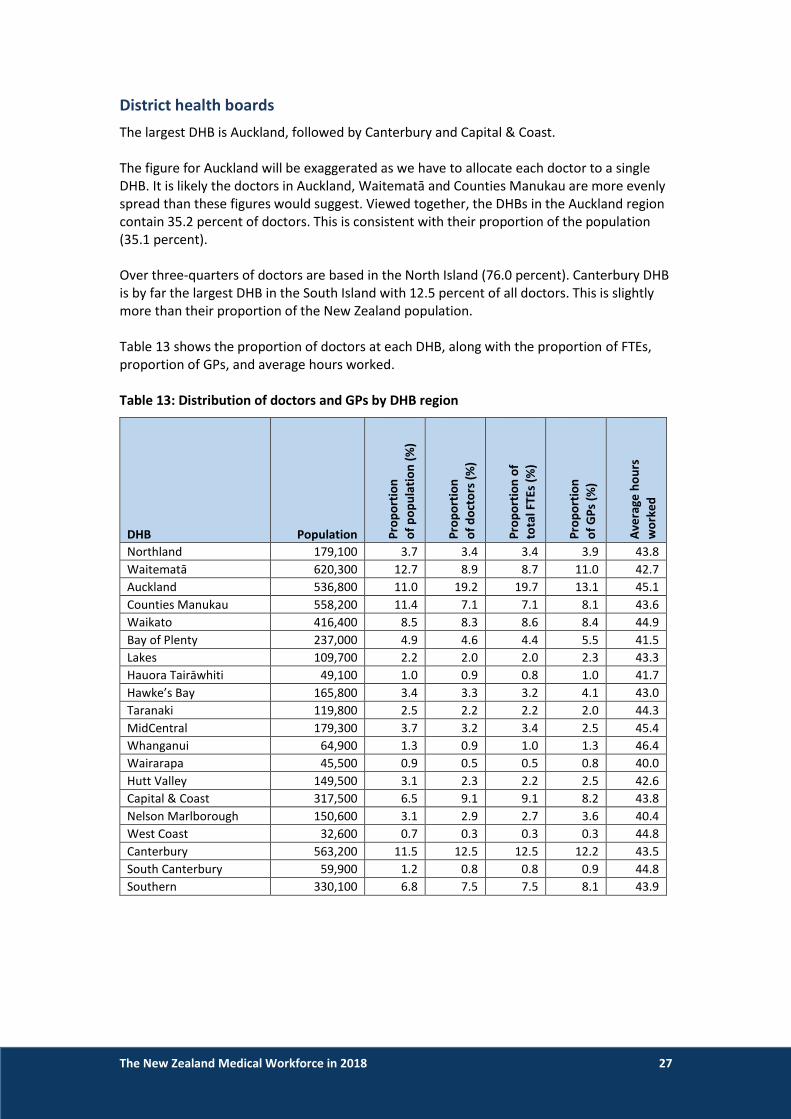
The largest DHB is Auckland, followed by Canterbury and Capital & Coast. The figure for Auckland will be exaggerated as we have to allocate each doctor to a single DHB. It is likely the doctors in Auckland, Waitematā and Counties Manukau are more evenly spread than these figures would suggest. Viewed together, the DHBs in the Auckland region contain 35.2 percent of doctors. This is consistent with their proportion of the population (35.1 percent). Over three-quarters of doctors are based in the North Island (76.0 percent). Canterbury DHB is by far the largest DHB in the South Island with 12.5 percent of all doctors. This is slightly more than their proportion of the New Zealand population. Table 13 shows the proportion of doctors at each DHB, along with the proportion of FTEs, proportion of GPs, and average hours worked. Table 13: Distribution of doctors and GPs by DHB region
DHB Population Pro
po
rtio
n
of
po
pu
lati
on
(%
)
Pro
po
rtio
n
of
do
cto
rs (
%)
Pro
po
rtio
n o
f
to
tal F
TEs
(%)
Pro
po
rtio
n
of
GP
s (%
)
Ave
rage
ho
urs
wo
rke
d
Northland 179,100 3.7 3.4 3.4 3.9 43.8
Waitematā 620,300 12.7 8.9 8.7 11.0 42.7
Auckland 536,800 11.0 19.2 19.7 13.1 45.1
Counties Manukau 558,200 11.4 7.1 7.1 8.1 43.6
Waikato 416,400 8.5 8.3 8.6 8.4 44.9
Bay of Plenty 237,000 4.9 4.6 4.4 5.5 41.5
Lakes 109,700 2.2 2.0 2.0 2.3 43.3
Hauora Tairāwhiti 49,100 1.0 0.9 0.8 1.0 41.7
Hawke’s Bay 165,800 3.4 3.3 3.2 4.1 43.0
Taranaki 119,800 2.5 2.2 2.2 2.0 44.3
MidCentral 179,300 3.7 3.2 3.4 2.5 45.4
Whanganui 64,900 1.3 0.9 1.0 1.3 46.4
Wairarapa 45,500 0.9 0.5 0.5 0.8 40.0
Hutt Valley 149,500 3.1 2.3 2.2 2.5 42.6
Capital & Coast 317,500 6.5 9.1 9.1 8.2 43.8
Nelson Marlborough 150,600 3.1 2.9 2.7 3.6 40.4
West Coast 32,600 0.7 0.3 0.3 0.3 44.8
Canterbury 563,200 11.5 12.5 12.5 12.2 43.5
South Canterbury 59,900 1.2 0.8 0.8 0.9 44.8
Southern 330,100 6.8 7.5 7.5 8.1 43.9

The New Zealand Medical Workforce in 2018 28
Distribution of GPs The two largest DHBs in terms of numbers of GPs are Auckland and Canterbury (13.1 and 12.2 percent respectively). Auckland is relatively over-represented compared to the proportion of the population (1.6 percentage points). However, the wider Auckland region including Waitematā and Counties Manukau is relatively underrepresented, with 35 percent of the population but only 32.1 percent of GPs. Waitematā is underrepresented by 1.7 percentage points and Counties Manukau by 3.4 percentage points. Capital and Coast (1.7 percentage points) and Southern (1.4 percentage points) also have a proportion of GPs greater than their proportion of the population. Most other areas have GP numbers that are consistent with their proportion of the population (+/- 1 percentage point).
Hours worked Doctors reported working the most hours in Whanganui (46.3 hours) followed by MidCentral (45.4 hours) and Auckland (45.1 hours). Doctors reported working the least hours in Wairarapa (40.0 hours), Nelson-Marlborough (40.4 hours) and Bay of Plenty (41.5 hours).
Hours worked by GPs GPs outside of the major centres tended to report working more hours. GPs on the West Coast reported working an average of 45.8 hours per week, followed by South Canterbury (43.2 hours) and Whanganui (41.2 hours). GPs in the Bay of Plenty reported working the fewest hours (33.4 hours). Hauora Tairāwhiti was next lowest with 33.6 hours followed by Nelson-Marlborough (33.7 hours). GPs in the larger DHBs tended to work fewer hours. GPs in Auckland, Capital and Coast, Canterbury, Waitematā and Waikato worked about 35 hours per week. We highlighted earlier in the report that lower average hours are often linked with part-time work. This would suggest GPs in larger DHB area are more likely to work part-time compared with their colleagues in more rural areas.
The New Zealand Medical Workforce in 2018 29
Gender Women are more highly represented in larger centres. While Hawke’s Bay has the highest proportion of female doctors (48.2 percent), the other large DHBs are not far behind. Most of the larger DHBs have about 47 percent female doctors, led by Capital and Coast with 47.9 percent. Whanganui has the lowest proportion of female doctors – 32.7 percent compared to 45.4 for the workforce as a whole. South Canterbury (32.7 percent) was next followed by West Coast (35.7 hours).
International medical graduates IMGs are more highly represented outside of the larger centres. West Coast has the highest percentage of IMGs – almost 65 percent (64.3 percent), followed by Whanganui (57.9 percent), Wairarapa (54.4 percent), and South Canterbury (52.0 percent). The DHBs with the lowest percentages of IMGs are Auckland (31.8 percent), Capital & Coast (34.4 percent), Hutt Valley (35.7 percent) and Canterbury (35.8 percent). This may reflect that main urban areas are easier to staff and so rely less on recruiting doctors from overseas. In addition, New Zealand graduates in their first two years of practice must work in training centres and cannot work in rural areas. This will also contribute to the lower proportions of IMGs in the main urban areas.
Age Doctors tend to be older on average outside of the main centres. However, this trend is not as significant as it is with gender and country of qualification. Doctors are oldest in Wairarapa (52 years), South Canterbury (50 years), and Whanganui (49 years) compared to the overall average age of 46 years. Doctors are youngest in Hawke’s Bay and Taranaki (both 44 years). Most other areas are about the same as the overall average (+/- one year).

The New Zealand Medical Workforce in 2018 30
Table 14 shows the percentage of female doctors, percentage of IMGs and average age for each DHB. Table 14: DHBs by percentage female, percentage IMG and average age
DHB Population Pe
rce
nta
ge
fe
mal
e (
%)
Pe
rce
nta
ge
IMG
s (%
)
Ave
rage
age
Northland 179,100 47.7 52.6 46
Waitematā 620,300 47.2 39.7 47
Auckland 536,800 47.2 31.8 46
Counties Manukau 558,200 45.6 38.7 46
Waikato 416,400 39.7 48.7 45
Bay of Plenty 237,000 45.9 48.5 45
Lakes 109,700 47.2 51.2 45
Hauora Tairāwhiti 49,100 45.0 43.1 46
Hawke’s Bay 165,800 48.2 44.3 44
Taranaki 119,800 41.5 49.5 44
MidCentral 179,300 40.2 41.4 45
Whanganui 64,900 32.5 57.9 49
Wairarapa 45,500 39.7 54.4 52
Hutt Valley 149,500 41.7 35.7 46
Capital & Coast 317,500 47.9 34.4 45
Nelson Marlborough 150,600 45.5 40.0 46
West Coast 32,600 35.7 64.3 46
Canterbury 563,200 47.6 35.8 45
South Canterbury 59,900 32.7 52.0 50
Southern 330,100 43.8 43.5 47

The New Zealand Medical Workforce in 2018 31
Urban/rural
Distribution of doctors Urban areas have a higher concentration of doctors compared with rural areas. Almost three-quarters of doctors are in main urban areas compared with 62 percent of the population. One-quarter of people live in rural areas, but these areas only make up 11.9 percent of doctors.
Distribution of GPs GPs are more likely to work in urban areas than rural areas. Almost 65 percent of GPs work in main urban areas compared with 62 percent of the population. Conversely, just under 21 percent of GPs work in rural areas compared to 24.2 percent of the population.
Hours worked and on call The average number of hours worked per week is slightly lower in rural areas, but the number of on-call hours is higher. Doctors in rural areas work an average of 41.2 hours per week and are on call for a further 8.6 hours per week. This compares with 44.2 hours worked and 5.6 hours on call for doctors in main urban areas. The average hours worked per week by GPs is higher in rural areas than in urban areas – 35.6 hours per week in rural areas compared with 33.2 hours per week in main urban areas. Table 15 shows a summary of workforce statistics by population density of area. Please see the method section of the report on page 46 for information on how we calculated population density. Table 15: Summary of workforce statistics by population density of area (all doctors)
Workforce measure
Population density
Main urban 100+ people per km2
Secondary urban 21–99 people per km2
Rural 0–20 people per km2
Proportion of doctors (%)1 74.6 13.5 11.9
Proportion of GPs (%)2 64.8 14.3 20.9
Population3 3,033,380 671,200 1,180,010
Proportion of population (%) 62.1 13.7 24.2
Average hours worked 44.2 43.9 41.2
Average hours worked by GPs 33.2 33.8 35.6
Average on-call hours 5.6 6.8 8.2
Average age 45.8 46.1 48.3
Proportion of female doctors (%) 45.7 45.2 43.9
Proportion of IMGs (%) 37.2 44.3 53.3
1 Represents all active doctors who responded to the survey.
2 Represents active doctors who reported working in general practice at one or more of their work sites.
3 Population figures are based on Statistics New Zealand’s estimated residential population as at 30 June of the particular survey period, in this case, 30 June 2018.

The New Zealand Medical Workforce in 2018 32
Age distribution Doctors working in rural areas tend to be older than those working in urban areas. The average age is 48.3 years in rural areas compared with 45.8 years in main urban areas. One reason for this is likely to be that most house officers, who tend to be much younger, will work in training centres in urban areas. You can see this when the figures are broken down by age group although the difference is not as dramatic as you would expect. In main urban areas, 25.3 percent of doctors are aged 35 or under compared with 19.9 percent of doctors in rural areas. Figure 13: Proportion of doctors by age group (main urban and rural)
Age distribution of GPs, registrars and specialists Specialists in rural areas also tend to be older – 53.9 years versus 51.2 years in main urban areas. However, GPs in rural areas are actually slightly younger on average – 51.2 years in rural areas compared with 51.9 years in urban areas. Table 16: Average age by work role and population density group
Workforce measure
Population density
Main urban 100+ people per km2
Secondary urban 21–99 people per km2
Rural 0–20 people per km2
Average age (GPs)1 51.9 51.8 51.2
Average age (registrars)1 32.8 33.1 32.2
Average age (specialists)1 51.2 51.9 53.9
1 Based on work role at main employer.

The New Zealand Medical Workforce in 2018 33
Gender There is a slightly higher proportion of female doctors in urban areas compared with rural areas – 45.7 percent of doctors in main urban areas are female compared with 43.9 percent of doctors in rural areas. Figure 14: Proportion of doctors by gender and population density of area
International medical graduates There is a higher proportion of international medical graduates (IMGs) in rural areas compared with urban areas – 53.3 percent of doctors in rural areas are IMGs compared to 37 percent in main urban areas. This may reflect that rural areas are sometimes harder to staff and so positions in these areas are more likely to be filled by doctors from outside New Zealand. Figure 15: Proportion of IMGs by population density of area

The New Zealand Medical Workforce in 2018 34
Combined Auckland region The Auckland “Super City” represents over a third of New Zealand’s population (34.6 percent) and has 35.5 percent of all doctors and 31.9 percent of all GPs. Doctors in Auckland work slightly more hours but are on call for less hours on average compared to the workforce as a whole. GPs in Auckland work about the same number of hours per week as the national average. The proportion of female doctors in Auckland is slightly higher, while the proportion of IMGs is significantly lower. Table 17: Summary of workforce statistics – Auckland City
Workforce measure Auckland City New Zealand
Proportion of doctors (%)1 35.2 -
Proportion of GPs (%)2 32.2 -
Population3 1,695,900 4,884,590
Proportion of population (%) 34.7 -
Average hours worked 44.2 43.8
Average hours worked by GPs 33.8 33.8
Average on call hours 5.2 6.1
Average age 46.6 46.1
Proportion of female doctors (%) 46.9 45.4
Proportion of IMGs (%) 35.2 40.0
1 Represents all active doctors who responded to the survey.
2 Represents active doctors who reported working in general practice at one or more of their work sites.
3 Population figures are based on Statistics New Zealand’s estimated residential population as at 30 June of the particular survey period, in this case, 30 June 2018.

The New Zealand Medical Workforce in 2018 35
International medical graduates International medical graduates (IMGs) make up 40.1 percent of doctors who responded to the survey and 42.7 percent of doctors on the register. Historically the proportion of IMGs has tended to increase each year. However, over the last five years, this growth has stopped and the proportion is now either about the same or slightly less as the previous year.
How we define IMGs
We define IMGs as doctors who obtained their primary medical qualification in a country other than New Zealand. Please take care when comparing the proportion of IMGs employed in New Zealand to the proportion in other countries – many countries define IMG differently from us.
Importance of IMGs to the workforce
IMGs play an important role in the medical workforce. IMGs fill gaps that we cannot fill with locally trained doctors, and some IMGs come here to gain experience and expertise they cannot get in their home country. Movement of doctors between countries is normal and expected. As IMGs come to New Zealand to work, many New Zealand-trained doctors work in other countries – see the retention section on page 47 for more on this.
Work role
IMGs are most represented amongst medical officers – 61.5 percent. They are least represented amongst house officers (15.7 percent) and registrars (36.2 percent). This reflects that we are training more doctors locally and so there are fewer training posts available for IMGs. Figure 16: Proportion of IMGs by work role at main work site (1980–2018)
The New Zealand Medical Workforce in 2018 36
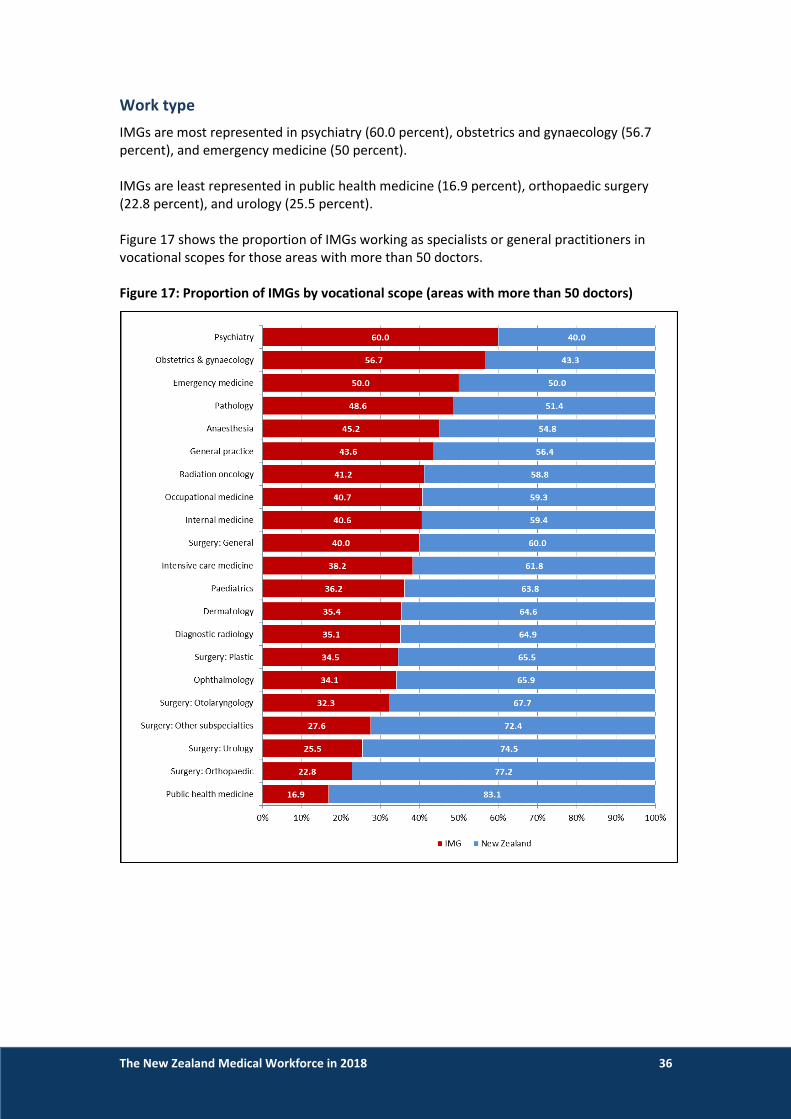
Work type
IMGs are most represented in psychiatry (60.0 percent), obstetrics and gynaecology (56.7 percent), and emergency medicine (50 percent). IMGs are least represented in public health medicine (16.9 percent), orthopaedic surgery (22.8 percent), and urology (25.5 percent). Figure 17 shows the proportion of IMGs working as specialists or general practitioners in vocational scopes for those areas with more than 50 doctors. Figure 17: Proportion of IMGs by vocational scope (areas with more than 50 doctors)

The New Zealand Medical Workforce in 2018 37
Retention — how long do our doctors stay
Retention of New Zealand graduates
New Zealand is retaining more of our own graduates than we used to. We retained no less than 90 percent of graduates from the 2010, 2011, 2012 and 2013 cohorts for 5 years after initial registration. Retention for earlier cohorts at the same point averaged just under 80 percent. This may reflect initiatives like the Ministry of Health’s Voluntary Bonding Scheme10 giving graduates greater incentives to remain in New Zealand in the years immediately after graduation. Figure 18 compares the retention rates at each year after graduation for successive classes of graduates from 1995 to 2015, combining these into 5-year cohorts to make it easier to see trends. See Table 23 on page 56 for more detailed retention data for New Zealand graduates. Figure 18: Graduate retention of class years 1995–2015 (5-year cohorts)
10 https://www.health.govt.nz/our-work/health-workforce/voluntary-bonding-scheme.

The New Zealand Medical Workforce in 2018 38
Most graduates who leave go to Australia
The vast majority of New Zealand-trained doctors practising outside of New Zealand are in Australia (2,054 in 2017). This is not surprising given that Australia is our nearest (and largest) neighbour. Other countries where New Zealand-trained doctors are practising include the United Kingdom (185 in 2018), Ireland (27 in 2018), Canada (113 in 2017), and Israel (5 in 2018)11. The OECD data on how many doctors move each year is relatively incomplete. The available data shows that in 2017, 26 doctors moved to Canada, 34 to the United Kingdom, and 7 moved to Ireland12.
11 OECD, Health Workforce Migration – Foreign-trained doctors by country of origin – stock
(https://stats.oecd.org/). 12 OECD, Health Workforce Migration – Foreign-trained doctors by country of origin – Annual inflow
(https://stats.oecd.org/).

The New Zealand Medical Workforce in 2018 39
Retention of International medical graduates
Most IMGs don’t stay in New Zealand for long periods. Just over 60 percent leave in the first two years after they register. IMGs continue to leave in subsequent years until there are about 20 percent remaining. Retention at 1 year post-registration is improving (see Figure 22), but the overall trend is largely stable. Figure 19 and 22 show the overall retention rate for IMGs who registered in New Zealand between 2000 and 2017. See the method section on page 47 for information on how we grouped IMGs together into cohorts. Figure 19: Retention rate for IMGs (2000–2017)
Figure 20: Changes in IMG retention over time (1–5 years post-registration (PR))

The New Zealand Medical Workforce in 2018 40
Retention by country of qualification
Doctors from Africa, the Middle East and Asia are most likely to stay. We retain three-quarters of doctors from these countries for one year and about 50 percent for a further four years. Over half of doctors from Africa and the Middle East are still in New Zealand up to eight years after they initially register. Doctors from North America are least likely to stay in New Zealand followed by Oceania (mainly doctors from Australia and the Pacific), the United Kingdom (UK), and Europe. Only 40 percent of doctors from North America are retained one year after initial registration, dropping further to 22.3 percent in the second year. Over 60 percent of doctors from the UK are retained after one year, but this then drops to 33 percent in the second year. This suggests that doctors from the United Kingdom and North America are more likely to only come to work in New Zealand temporarily for short periods (eg a working holiday). Doctors from Africa, the Middle East and Asia are more likely to relocate to New Zealand permanently. Figure 21: Retention of IMGs by country of qualification

The New Zealand Medical Workforce in 2018 41
Retention by age group and time since qualification
Doctors aged between 30 and 50 are more likely to stay compared to doctors in their 20s and those aged 60 and over. Similarly, doctors in the middle of their careers are more likely to stay compared with newer doctors in their first 10 years of practice. This suggests that newer doctors aged under 30 are more likely to come to New Zealand for a short period of time compared with doctors in their 30s and 40s who are more likely to be relocating permanently. Figure 22: Retention rates for IMGs by age group (2000–2017)
Figure 23: Retention rate for IMGs by time since qualification (2000–2017)

The New Zealand Medical Workforce in 2018 42
Data sources used in this publication This report incorporates the results of the Medical Council of New Zealand workforce survey for 2018 with registration data. It also includes other non-register registration data collected from doctors as part of the initial registration process and when they renew their practising certificates each year.
Register data and other non-register data
Register data Register data is that used as part of the medical register. This includes doctors’ scopes of practice, practising certificate dates, and qualification data.
Non-register registration data Non-register registration data is collected from doctors when they renew their practising certificate each year or when doctors notify Council of changes during the year. This includes information on where doctors are employed, the level of their practice, the type of medicine, and whether they are in a vocational training programme.
Survey data We survey doctors as part of their application to renew their practising certificate. This survey collects detailed information from doctors about the work they are doing. This fills in the gaps not covered by register data and non-register registration data enriching these datasets.
Representativeness of the survey data The response rate for the 2018 survey dropped again in 2018 – 76.5 percent of doctors surveyed responded compared with 80.8 percent in 2017 and 96.3 percent in 2016. We believe the response is still representative and that valid conclusions can be drawn from the data despite the reduced response rate. This belief is based on the population size and demographic comparison of the survey data with register data.
Survey statistical confidence – population size
A major factor in determining survey statistical confidence is the size of the population. For our survey, the size of the population is the number of doctors on the register with a current practising certificate – 16,389 as at 31 March 2018. For a population of this size, a response rate of 76.5 percent should provide 95 percent certainty.13 This supports our conclusion that, even though our response rate is lower, any conclusions drawn from the data are still valid.
13 GreatBrook, Survey Statistical Confidence: How Many is Enough?, https://greatbrook.com/survey-
statistical-confidence-how-many-is-enough/.

The New Zealand Medical Workforce in 2018 43
Demographic comparison – survey data versus register data
While the population size is important, the sample must accurately reflect the survey population. If it is, we can say that the survey data is representative. To test whether the survey data is representative, we compared the age and gender of those who responded to the survey with those on the medical register. While there were some very small differences when broken down by age group, the breakdown by gender was nearly identical. This further supports our conclusion that the survey response for 2018 is representative.
Comparison by gender Figure 24 illustrates that, when broken down by gender, the demographics of the two groups are effectively identical. In both cases, 45 percent were female and 55 percent were male. Figure 24: Comparison of survey respondents with doctors on the medical register as at 31 March 2018 by gender
Comparison by age group Figure 25 and Table 18 show small differences between the two groups when they are broken down by age group. There is a greater proportion of younger doctors (aged between 25 and 39) amongst doctors on the register, compared with those who responded to the survey. There is a corresponding larger proportion of doctors aged between 40 and 59 amongst survey respondents. This suggests that doctors who come to New Zealand for short periods and are not asked to complete the workforce survey are, on average, younger.

The New Zealand Medical Workforce in 2018 44
Figure 25: Comparison of survey respondents with doctors on the medical register as at 31 March 2018 by age group
Table 18: Summary of differences between survey respondents and doctors on the medical register as at 30 June 2018 by age group (selected age groups only)
Age group 25–29 30–34 35–39 40–49 50–54 55–59 60–64
Survey difference to register
-0.3% -0.7% -0.1% 0.2% +0.6% +0.2% -0.1%
Comparison by country of qualification The proportion of international medical graduates (IMGs) amongst doctors on the register is higher than the proportion of IMGs amongst doctors who responded to the survey (42.7 percent versus 40.1 percent). This reflects that we don’t ask IMGs who come to New Zealand for short periods to complete the survey.
Survey method
Change in delivery method
We are now delivering our survey questionnaire entirely electronically. We made this change when we moved our practising certificate renewal process online. Doctors now renew their practising certificates through myMCNZ (https://mymcnz.org.nz/). This is the third survey we have done electronically.
Timing of the questionnaire
We ask doctors to renew their practising certificate (and complete the workforce survey) at one of four dates during the year, determined by the doctor’s birthdate.
The New Zealand Medical Workforce in 2018 45
The 2018 survey covers doctors who renewed their practising certificate from December 2017, March 2018, June 2018, and September 2018.
Doctors are able to complete the survey up to 6 weeks before these dates. We collected all data within 3 months of a renewal period ending.
Sampling frame
We ask doctors to complete the survey if they:
hold a current general, provisional general, vocational or provisional vocational scope of practice, and
hold a current practising certificate or held one at some point in the previous year, and
have a New Zealand address. We don’t ask doctors who are registered for specific short-term purposes (special-purpose scope of practice) to complete the survey.
Responses to the survey
The response rate to the 2018 survey is 76.5 percent. We asked 14,467 doctors to complete the survey: 12,592 doctors responded. Of the doctors who did not complete the survey, 3,147 doctors declined to complete the survey and 234 doctors reported that they did not work.
This response rate is lower than 2017 (80.8 percent) and significantly lower than 2016 (96.3 percent). We believe the reduced response to the survey is due to a combination of moving the survey online, and making it clearer that the survey is optional (and easier for doctors to opt out).
A change in legislation in 2019 will significantly affect the workforce survey. The Health Practitioners Competence Assurance Amendment Act 2019 requires us to provide the Director-General of Health with particular information on health practitioners14. This may also change which information doctors can opt out of providing.
Active doctors
The results in this report reflect the responses from active doctors. Active doctors are those who reported working four or more hours per week. There were 12,573 active doctors in 2018.
14 Health Practitioners Competence Assurance Amendment Act 2019, s134A –
http://www.legislation.govt.nz/act/public/2003/0048/latest/LMS193179.html
The New Zealand Medical Workforce in 2018 46
Categories of data
We asked doctors completing the survey to report an employer type (eg public hospital), role type (eg registrar) and work type categories (eg cardiology) for up to three work sites.
Use of registration data
We combined survey data with registration information to avoid asking doctors unnecessary questions and make it easier for them to respond to the survey. This information included the doctor’s age, gender, registration date, and year and country of graduation.
We also used registration data in this report where it was more reliable than survey data.
How we do geographical analysis
We assigned doctors’ responses to a territorial local authority (TLA) and district health board (DHB) region, based on their employment information.
We used Statistics New Zealand’s Estimated Resident Population dataset as at 30 June 201715 for DHB and TLA populations.
We now report the Auckland region as a single TLA. We used to try to break the Auckland region down into its historic boundaries to compare the data with 2014 and earlier years, but this is now impractical.
Method for determining whether areas are urban or rural There is no one agreed method to determine whether an area is urban or rural. Statistics New Zealand outlines the complexities involved in classifying an area as rural or urban in its report New Zealand: An Urban/Rural Profile16. They also note that there is no internationally recognised definition of a ‘rural’ area. For this report we have approximated how rural or urban an area is by looking at how densely it is populated. We have allocated TLAs into one of three groups based on population density. We calculated the population density for each TLA by dividing its population by its land area (in km2). For example, Wellington City, an urban area, has an area of 290 km2 and a population of 212,700, giving it an average population density of 733 people per square kilometre. South Wairarapa District, generally considered a rural area, has an area of 2,387 km2 and a population of 10,250, giving it an average population density of 4.3 people per square kilometre. The three groups are defined as:
main urban — areas with 100 or more people per square kilometre
secondary urban — areas with 21–99 people per square kilometre
rural — areas with 20 or fewer people per square kilometre.
15 Statistics New Zealand: Estimated Resident Population as at 30 June 2016
http://archive.stats.govt.nz/browse_for_stats/population/estimates_and_projections/NationalPopulationEstimates_HOTPAt30Jun16.aspx.
16 Statistics New Zealand: New Zealand: An Urban/Rural Profile http://www.stats.govt.nz/browse_for_stats/people_and_communities/Geographic-areas/urban-rural-profile.aspx
The New Zealand Medical Workforce in 2018 47
Ethnicity
Doctors can report up to three ethnicities. However, when we report data, we assign each doctor a single ethnicity using a simplified version of Statistics New Zealand’s prioritisation standard. The priority order is: 1. Māori 2. Pacific Island (Pasifika) 3. Chinese 4. Indian 5. Other non-European 6. Other European 7. New Zealand European/Pākehā. The ethnicity we use in analysis is the one reported by the doctor with the highest priority.
Calculating retention rates
Retention of New Zealand graduates We calculate the retention rates for New Zealand graduates by comparing the list of graduates provided by the universities with the lists of doctors who held practising certificates in subsequent years.
Retention of international medical graduates We calculate the retention rates for IMGs by grouping them into year cohorts and then checking whether doctors in the cohort held a practising certificate in subsequent years. We express the retention rate as a percentage. If 100 doctors are in the cohort and 90 doctors hold a practising certificate in the following year, the retention rate is 90 percent.
We include a doctor in the cohort for a year if they practised in New Zealand during that year but not in the previous year. For example, for an IMG to be included in the 2000 cohort, they must have practised in New Zealand in 2000 but not in 1999.
Inclusion in a group does not relate to the date of graduation in the IMG’s home country.

The New Zealand Medical Workforce in 2018 48
Explanation of terms used Active doctors Active doctors are doctors who, by their own estimate, worked a total of at least 4 hours in medical (including non-clinical) work during a typical working week.
Full-time equivalent (FTE) We base proportional calculation of FTEs on a 40-hour week. For example, 60 hours = 1.5 FTE. On-call time is only included in FTE when the doctor works.
General practitioner (GP) A GP is any respondent who indicated working in the GP work role at one of their work sites. It does not specifically refer to a doctor holding the FRNZCGP qualification or a vocational scope of general practice. We sometimes need to use a different definition of GP. We will specify that we have done this in the text.
House officer House officers are doctors in their first 2-3 years out of medical school. Doctors in their first year out of medical school are sometimes known as interns or PGY1s.
Hours on call Hours on call are additional hours when doctors were on call but did not work.
Hours worked Hours worked are those doctors report unless we specify otherwise.
We ask doctors to report the hours they work across all work sites during a typical working week. Alternatively, we ask doctors to report their most recent week if they cannot identify a typical week.
International medical graduate (IMG) A doctor who obtained their primary medical qualification in a country other than New Zealand. IMGs used to be called overseas-trained doctors.
Main work site The work site where the doctor spends most of their working hours.
Medical officer The Multi Employer Collective Agreement (MECA) between the Association of Salaried Medical Specialists (ASMS) and DHBs17 defines medical officer as “any medical practitioner who is registered under the Health Practitioners Competence Assurance Act 2003 … who is not a medical specialist”. Medical officers were previously called medical officers of special scale (MOSS).
Registrar A doctor who has at least 2 years of experience since graduation from medical school. Registrars are generally undertaking vocational training in their chosen specialty.
17 https://www.asms.org.nz/wp-content/uploads/2017/10/2017-2020-DHB-MECA-Signed.pdf.

The New Zealand Medical Workforce in 2018 49
Registered within a vocational scope of practice Doctors registered in a vocational scope of practice have completed an approved or equivalent postgraduate training programme leading to the award of an approved or equivalent postgraduate qualification.
Registration within a vocational scope of practice was previously known as vocational registration.
Specialist This work role category is generally understood to require membership of the relevant specialist college (and registration within a vocational scope of practice). However, the data is self-reported and doctors who respond to the survey may apply the term more broadly.
General practice is a specialty, and GPs are specialists. However, we ask doctors working in general practice, urgent care, and other primary care disciplines to use separate work role categories to help us analyse the data.
Work role Work role category options for the survey are:
GP
primary care other than GP
house officer
registrar
medical officer
specialist/consultant
other.
Work type Work type is the area of medicine or specialty that the doctor is working in. For example, internal medicine or general surgery.

The New Zealand Medical Workforce in 2018 50
More information Please contact Andrew Cullen, Council’s Information Systems Analyst for further information about this report. You can send email requests to [email protected].
You can also get further information about the medical workforce from the Ministry of Health. Please see:
https://www.health.govt.nz/nz-health-statistics/access-and-use/how-access-data
Alternatively, you can contact the Ministry at the following address:
Analytical Services National Collections & Reporting National Health Board PO Box 1043 Wellington New Zealand
Email: [email protected] Website: www.moh.govt.nz Phone: +64 4 816 2850

The New Zealand Medical Workforce in 2018 51
Appendix 1 – Changes in the medical workforce by work role Table 19 shows the changes in the distribution of the workforce by work role over time. Table 19: Changes in the medical workforce
Proportion of active doctors (%)1
Workforce role2 1980 1985 1990 1995 2000 2005 2010 2015 2018
General practitioner (GP) 37 38 38 38 37 33 31 28 28
House officer 12 11 11 10 10 9 8 11 9
Medical officer 3 3 3 3 3 4 5 4 4
Primary care other than GP 1 2 3 4 2 2 1 1 1
Registrar 11 13 13 13 14 16 15 17 17
Specialist 34 32 31 30 31 34 35 36 39
Other 1 2 2 2 2 2 3 3 2
No answer - - - - 0 0 2 0 -
Total 100 100 100 100 100 100 100 100 100
1 Proportion of doctors who responded to the survey and reported working 4 or more hours per week.
2 Work role at the doctor’s main work site.
The New Zealand Medical Workforce in 2018 52
Appendix 2 – Work type Table 20: Number of doctors by vocational scope for selected years (2005–2019)
Vocational scope
Year1
2005 2010 2015 2018 2019
Anaesthesia 488 577 737 814 835
Breast medicine 4 - - -
Cardiothoracic surgery 19 23 28 30 34
Clinical genetics 6 7 12 18 18
Dermatology 50 56 63 72 74
Diagnostic and interventional radiology 266 303 448 489 510
Emergency medicine 88 135 224 298 319
Family planning and reproductive health 24 26 24 25 29
General practice 2,446 2,701 3,303 3,609 3,671
General surgery 227 235 262 291 294
Intensive care medicine 44 58 81 104 107
Internal medicine 656 761 958 1,099 1,164
Medical administration 12 15 25 30 32
Musculoskeletal medicine 20 22 20 23 23
Neurosurgery 18 20 23 23 24
Obstetrics and gynaecology 223 234 280 313 321
Occupational medicine 40 49 53 59 62
Ophthalmology 107 124 134 147 157
Oral and maxillofacial surgery 17 17 20 24 27
Orthopaedic surgery 211 237 273 291 303
Otolaryngology head and neck surgery 85 97 108 118 118
Paediatric surgery 15 14 19 22 24
Paediatrics 219 289 353 401 412
Pain medicine - - 23 29 30
Palliative medicine 32 42 54 61 71
Pathology 225 238 278 309 319
Plastic and reconstructive surgery 43 55 64 72 76
Psychiatry 425 489 559 622 634
Public health medicine 130 157 177 169 172
Radiation oncology 34 49 60 59 64
Rehabilitation medicine 11 16 24 26 27
Rural hospital medicine - 26 105 117 120
Sexual health medicine 18 20 18 19 19
Sport and exercise medicine 12 19 26 27 30
Urgent care 103 119 136 206 227
Urology 51 54 64 68 67
Vascular surgery 20 26 33 33 34
Total 6,389 7,310 9,069 10,117 10,448
1 Figures represent the number of doctors with vocational scope and current practising certificate as at 30 June of the year.

The New Zealand Medical Workforce in 2018 53
Appendix 3 – Age Table 21 shows the changes in the average age of doctors holding a vocational scope between 2005 and 2019. Table 21: Average age of doctors on the register with a vocational scope (2005–2019)
Vocational scope 2005 2010 2015 2018 2019
Anaesthesia 46 48 49 49 49
Cardiothoracic surgery 48 52 53 53 53
Clinical genetics 42 46 46 47 47
Dermatology 51 51 52 52 51
Diagnostic and interventional radiology 48 49 49 49 49
Emergency medicine 41 43 45 45 46
Family planning and reproductive health 53 53 53 53 52
General practice 49 51 53 53 53
General surgery 49 51 51 51 52
Intensive care medicine 46 48 49 50 50
Internal medicine 50 51 50 51 51
Medical administration 53 56 58 57 57
Musculoskeletal medicine 52 55 58 60 61
Neurosurgery 54 55 52 53 52
Obstetrics and gynaecology 49 51 52 52 52
Occupational medicine 50 53 55 57 57
Ophthalmology 49 50 51 51 51
Oral and maxillofacial surgery 45 48 52 49 49
Orthopaedic surgery 49 50 52 52 52
Otolaryngology head and neck surgery 49 51 53 53 54
Paediatric surgery 49 53 55 51 51
Paediatrics 47 48 49 50 50
Pain medicine - - 54 53 53
Palliative medicine 50 54 56 54 53
Pathology 49 50 51 51 51
Plastic and reconstructive surgery 49 48 50 51 51
Psychiatry 48 50 52 53 54
Public health medicine 47 49 51 52 52
Radiation oncology 46 47 49 50 51
Rehabilitation medicine 51 51 51 53 52
Rural hospital medicine - 47 49 50 51
Sexual Health Medicine 50 52 55 54 54
Sport and exercise medicine 46 46 48 49 49
Urgent care 45 48 51 51 52
Urology 50 52 51 50 51
Vascular surgery 48 50 50 52 52
All doctors with vocational scope 48 50 51 52 52

The New Zealand Medical Workforce in 2018 54
Appendix 4 – Ethnicity by work type Table 22 shows the distribution of ethnicity for each work type at doctors’ main work site. Table 22: Distribution of ethnicity by work type at main work site (%)
Work type Māo
ri
Pac
ific
Isla
nd
(P
asif
ika)
Ch
ine
se
Ind
ian
Oth
er
Oth
er
Euro
pe
an
NZ
Euro
pe
an/P
āke
hā
Re
fuse
d
To
tal
Anaesthesia 2.5 0.5 5.9 4.0 7.4 21.9 55.0 2.9 100.0
Basic medical science 0.0 0.0 1.8 3.6 14.3 19.6 55.4 5.4 100.0
Clinical genetics 0.0 0.0 0.0 0.0 0.0 14.3 85.7 0.0 100.0
Dermatology 1.3 0.0 5.3 4.0 5.3 21.3 62.7 0.0 100.0
Diagnostic radiology 1.5 1.0 6.3 5.8 8.5 14.8 59.6 2.5 100.0
Emergency medicine 3.0 1.0 4.6 3.8 7.9 38.0 39.3 2.5 100.0
Family planning & reproductive health 3.6 0.0 10.7 0.0 17.9 14.3 50.0 3.6 100.0
General practice 3.4 2.2 5.7 5.5 10.3 19.0 52.2 1.6 100.0
House officer rotations 8.4 3.0 7.8 5.0 14.5 8.6 50.1 2.7 100.0
Intensive care medicine 2.2 1.5 3.7 2.2 5.2 33.6 49.3 2.2 100.0
Internal medicine 2.9 1.1 8.7 6.3 13.5 18.7 45.3 3.5 100.0
Medical administration 6.8 0.0 0.0 0.0 2.7 17.8 68.5 4.1 100.0
Musculoskeletal medicine 4.5 0.0 4.5 0.0 4.5 9.1 77.3 0.0 100.0
Obstetrics & gynaecology 3.9 1.0 4.8 7.5 12.3 18.8 49.5 2.2 100.0
Occupational medicine 1.4 0.0 1.4 6.8 6.8 14.9 68.9 0.0 100.0
Ophthalmology 1.7 2.3 10.3 4.6 13.1 13.7 52.0 2.3 100.0
Other 5.2 2.6 1.5 2.6 7.7 21.1 57.7 1.5 100.0
Paediatrics 3.9 2.2 6.2 4.5 8.8 16.3 55.5 2.6 100.0
Palliative medicine 1.2 0.0 2.3 5.8 7.0 33.7 48.8 1.2 100.0
Pathology 0.9 0.9 6.8 5.9 11.3 19.9 52.0 2.3 100.0
Primary care other than GP 4.8 1.2 2.4 2.4 7.1 10.7 69.0 2.4 100.0
Psychiatry 2.7 1.9 2.5 8.3 13.9 25.7 43.6 1.3 100.0
Public health medicine 10.1 3.4 2.2 2.8 3.9 7.3 69.7 0.6 100.0
Radiation oncology 1.6 3.1 7.8 10.9 14.1 14.1 45.3 3.1 100.0
Rehabilitation medicine 6.3 0.0 12.5 15.6 25.0 21.9 18.8 0.0 100.0
Rural hospital medicine 3.8 0.0 3.8 5.1 7.7 23.1 52.6 3.8 100.0
Sexual health medicine 0.0 0.0 3.0 6.1 3.0 30.3 57.6 0.0 100.0
Sports medicine 8.6 0.0 0.0 0.0 8.6 8.6 71.4 2.9 100.0
Surgery: Other subspecialties 4.1 4.1 4.1 3.1 7.2 18.6 56.7 2.1 100.0
Surgery: Cardiothoracic 0.0 0.0 4.4 20.0 8.9 24.4 40.0 2.2 100.0
Surgery: General 4.6 6.3 7.4 7.4 13.4 13.7 45.4 1.9 100.0
Surgery: Neurosurgery 6.1 0.0 6.1 9.1 18.2 30.3 30.3 0.0 100.0
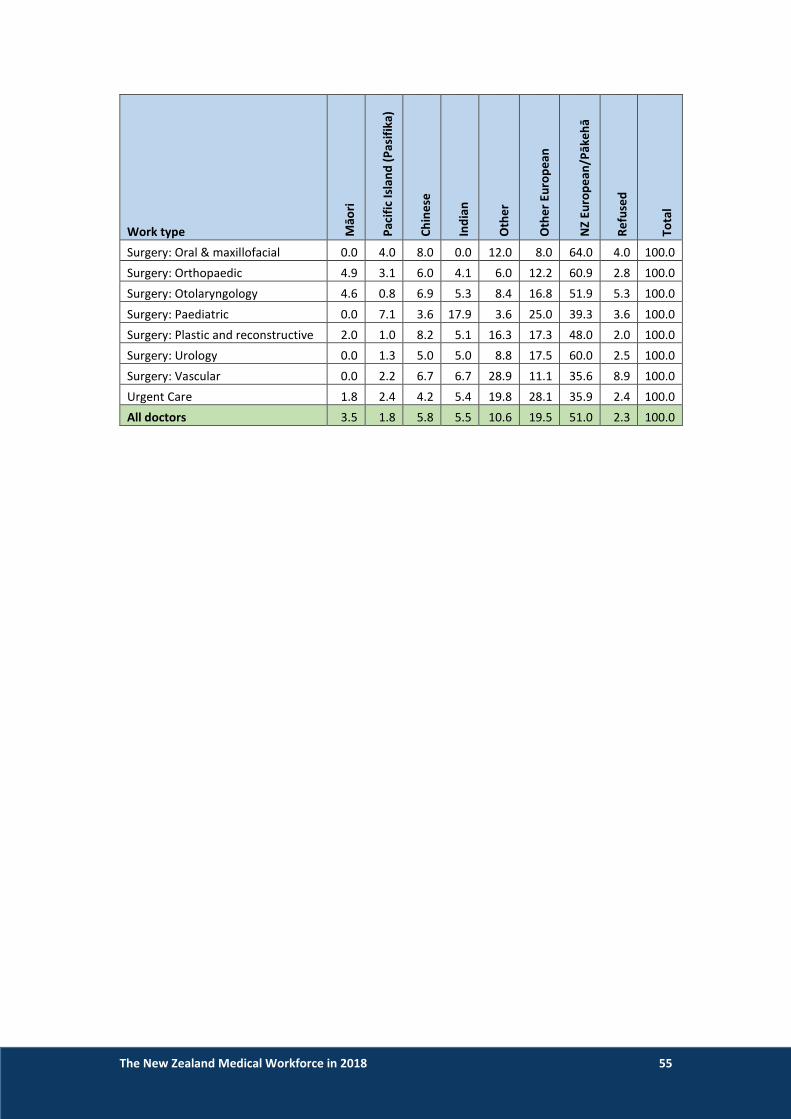
The New Zealand Medical Workforce in 2018 55
Work type Māo
ri
Pac
ific
Isla
nd
(P
asif
ika)
Ch
ine
se
Ind
ian
Oth
er
Oth
er
Euro
pe
an
NZ
Euro
pe
an/P
āke
hā
Re
fuse
d
To
tal
Surgery: Oral & maxillofacial 0.0 4.0 8.0 0.0 12.0 8.0 64.0 4.0 100.0
Surgery: Orthopaedic 4.9 3.1 6.0 4.1 6.0 12.2 60.9 2.8 100.0
Surgery: Otolaryngology 4.6 0.8 6.9 5.3 8.4 16.8 51.9 5.3 100.0
Surgery: Paediatric 0.0 7.1 3.6 17.9 3.6 25.0 39.3 3.6 100.0
Surgery: Plastic and reconstructive 2.0 1.0 8.2 5.1 16.3 17.3 48.0 2.0 100.0
Surgery: Urology 0.0 1.3 5.0 5.0 8.8 17.5 60.0 2.5 100.0
Surgery: Vascular 0.0 2.2 6.7 6.7 28.9 11.1 35.6 8.9 100.0
Urgent Care 1.8 2.4 4.2 5.4 19.8 28.1 35.9 2.4 100.0
All doctors 3.5 1.8 5.8 5.5 10.6 19.5 51.0 2.3 100.0

The New Zealand Medical Workforce in 2018 56
Appendix 5 – Retention of New Zealand graduates Table 23: Proportion of New Zealand graduates retained by cohort and year post-registration (%)
Graduate cohort
Year post-registration
0 1 2 3 4 5 6 7 8 9 10 11 12 13 14 15 16 17 18 19 20 21 22 23
1995 100 96 85 74 74 79 76 72 68 65 64 65 67 70 68 68 67 68 69 67 66 68 68 68
1996 100 97 88 77 77 79 79 77 74 70 64 64 59 63 64 67 67 67 67 67 67 66 65 1997 100 97 85 71 68 69 69 73 69 69 63 65 62 62 63 63 63 63 64 65 65 65 1998 100 96 79 67 75 76 76 76 69 67 63 60 55 59 60 60 64 63 62 60 61 1999 100 97 83 75 77 76 76 73 70 68 58 58 56 58 59 60 61 60 62 63 2000 100 98 84 74 76 79 79 80 77 75 69 61 58 58 59 62 64 64 65 2001 100 99 85 77 79 80 80 78 75 71 64 65 57 61 58 58 59 59 2002 100 99 87 75 79 80 80 77 77 74 70 68 65 62 61 65 66 2003 100 99 86 79 80 78 78 75 73 72 68 63 63 62 63 66 2004 100 99 92 80 81 83 83 79 76 73 67 64 61 65 65 2005 100 100 87 75 76 76 76 73 73 70 67 66 61 64 2006 100 100 91 83 79 79 79 75 77 72 67 64 67 2007 100 99 86 78 79 74 74 72 74 73 69 66 2008 100 99 92 86 86 82 82 81 81 79 77 2009 100 100 92 85 82 84 84 83 80 79 2010 100 99 97 92 90 90 90 89 87 2011 100 100 96 92 90 90 90 87 2012 100 100 95 92 90 90 90 2013 100 99 97 93 94 93 2014 100 100 98 95 92 2015 100 100 100 99 2016 100 100 100 2017 100 100 2018 100
Average - 99 90 82 81 81 80 78 75 72 66 64 61 62 62 63 64 63 65 64 65 66 66 68
Standard deviation - 1.5 6.1 8.9 6.9 6.2 5.7 5.1 4.9 4.0 4.5 2.7 4.1 3.5 3.3 3.5 2.9 3.1 2.8 2.8 2.8 1.3 1.9

The New Zealand Medical Workforce in 2018 57
Appendix 6 – List of tables and figures
Tables
Table 1: Proportion of doctors by ethnic group (%) ..................................................................................... 5 Table 2: Proportion of doctors and New Zealand population by ethnic group ............................................ 6 Table 3: Average age of doctors by ethnicity and gender ............................................................................ 7 Table 4: Estimated yearly workforce growth and changes in composition ................................................ 13 Table 5: Number of doctors by vocational scope for selected years (2005–2019) .................................... 18 Table 6: Average age of doctors on the register with a vocational scope (2005–2019) ............................ 20 Table 7: Average hours worked by work role (2000–2018) ........................................................................ 22 Table 8: Average of total hours worked, by age and gender ...................................................................... 23 Table 9: Average hours worked, by gender and year (2005–2018) ............................................................ 23 Table 10: Doctors’ on-call hours, grouped in each work role (%) ............................................................... 24 Table 11: Proportion of doctors on call for 10 or more hours each week, by employer (%) ..................... 25 Table 12: Average on-call hours by work role (2000–2018) ....................................................................... 25 Table 13: Distribution of doctors and GPs by DHB region .......................................................................... 27 Table 14: DHBs by percentage female, percentage IMG and average age ................................................ 30 Table 15: Summary of workforce statistics by population density of area (all doctors) ............................ 31 Table 16: Average age by work role and population density group ........................................................... 32 Table 17: Summary of workforce statistics – Auckland City ....................................................................... 34 Table 18: Summary of differences between survey respondents and doctors on the medical register as at 30 June 2018 by age group (selected age groups only) .............................................................................. 44 Table 19: Changes in the medical workforce .............................................................................................. 51 Table 20: Number of doctors by vocational scope for selected years (2005–2019) .................................. 52 Table 21: Average age of doctors on the register with a vocational scope (2005–2019) .......................... 53 Table 22: Distribution of ethnicity by work type at main work site (%) ..................................................... 54 Table 23: Proportion of New Zealand graduates retained by cohort and year post-registration (%) ........ 56
Figures
Figure 1: Ethnicity by age group (selected groups)....................................................................................... 7 Figure 2: Proportion of ethnic groups by work role at main work site ......................................................... 8 Figure 3: Vocational training area by gender (areas with more than 20 trainees)..................................... 10 Figure 4: Proportion of females by work role at main work site (1980-2018) ........................................... 11 Figure 5: Proportion of doctors by work type and gender ......................................................................... 12 Figure 6: Change in size of the medical workforce compared to change in size of the New Zealand population (2001–2018) ............................................................................................................................. 13 Figure 7: Age distribution of the active workforce (1980–2018) ................................................................ 14 Figure 8: Proportion of active doctors by gender (1980–2018) showing projected trend forward to 2025. .................................................................................................................................................................... 15 Figure 9: Distribution of active doctors by age and gender ........................................................................ 16 Figure 10: Proportion of active doctors by work role (1980–2018) ........................................................... 17 Figure 11: Average age by work type at main work site (areas with more than 50 doctors) .................... 19 Figure 12: Average hours worked by work type (areas with more than 50 respondents) ......................... 21 Figure 13: Proportion of doctors by age group (main urban and rural) ..................................................... 32 Figure 14: Proportion of doctors by gender and population density of area ............................................. 33

The New Zealand Medical Workforce in 2018 58
Figure 15: Proportion of IMGs by population density of area .................................................................... 33 Figure 16: Proportion of IMGs by work role at main work site (1980–2018) ............................................. 35 Figure 17: Proportion of IMGs by vocational scope (areas with more than 50 doctors) ........................... 36 Figure 18: Graduate retention of class years 1995–2015 (5-year cohorts) ................................................ 37 Figure 19: Retention rate for IMGs (2000–2017) ....................................................................................... 39 Figure 20: Changes in IMG retention over time (1–5 years post-registration (PR)) ................................... 39 Figure 21: Retention of IMGs by country of qualification .......................................................................... 40 Figure 22: Retention rates for IMGs by age group (2000–2017) ................................................................ 41 Figure 23: Retention rate for IMGs by time since qualification (2000–2017) ............................................ 41 Figure 24: Comparison of survey respondents with doctors on the medical register as at 31 March 2018 by gender .................................................................................................................................................... 43 Figure 25: Comparison of survey respondents with doctors on the medical register as at 31 March 2018 by age group ............................................................................................................................................... 44