Theologies And development For development With development - In development

THE NEW POLITICAL ECONOMY OF DEVELOPMENT

THE NEW POLITICAL ECONOMY OF DEVELOPMENT
Integrated Theory and Asian Experience
K. Dopfer

© K. Dopfer 1979
Softcover reprint ofthe hardcover 1st edition 1979 978-0-333-26963-3
All rights reserved. No part of this publication may be reproduced or transmitted, in any form or by any means,
without permission
First published 1979 by THE MACMILLAN PRESS LTD
London and Basingstoke Associated companies in Delhi
Dublin Hong Kong Johannesburg Lagos Melbourne New York Singapore Tokyo
Typeset in Great Britain by Santype International Ltd., Salisbury
British Library Cataloguing in Publication Data
Dopfer, Kurt New political economy of development 1. Economic development I. Title 330.9 HD82
ISBN 978-1-349-04786-4 ISBN 978-1-349-04784-0 (eBook) DOI 10.1007/978-1-349-04784-0

Contents
List of Tables
List of Figures
Preface
Glossary of Symbols
Introduction
PART ONE: SCOPE AND FOUNDATIONS
1. Impact of Regional Scope on Choice and Validity of
ix
xii
xv
xvii
1
Theory 7
2. Rationale and Implications of Historical Time 10
3. A Holistic Systems View 12
4. Total-System Behaviour: Principles and Propositions 17 I. Determinism: Historical and A Priori Concepts
II. Finality and Equifinality III. Predictive Capacity of System Theories IV. Developmental Function: Desiderata and In-
strumentals V. Towards an Empirical Welfare Theory: Minimum
and Supplementary Desiderata VI. System Levels and Hierarchical Dependency
PART TWO: POPULATION DYNAMICS IN A FINITE WORLD
5. Basic Causal Linkages 37
v

vi Contents
6. Po.pulatio.n Dynamics 40 I. Characteristics o.f Po.pulatio.n System
II. Pre-Transitio.n Equilibria and Adjustments III. Demographic Turning Po.ints IV. Transitio.n Scenario.s
7. Po.pulatio.n Densities 59 I. Overall Density Index
II. Dispersio.n: Simultaneo.us Trends to.wards Urbaniza-tio.n and Ruralizatio.n
8. Lo.ng-Run Capacity o.f Agriculture 66 I. Co.mparative Dynamics: 18th- and 19th-Century
Euro.pe and Co.ntempo.rary Asia II. Po.litical and So.cio.-Econo.mic Respo.nses Required
9. No.n-Renewable Reso.urce Basis fo.r Industrialisatio.n 75 I. No.n-Renewable Reso.urce Supply Capacity as a Func-
tion o.f Reserves and Po.litical-Eco.no.mic Po.wer II. Eco.no.mic Implicatio.ns of 'Delayed Entry' in Re-
so.urce Exhaustio.n III. Energy Co.nstraints, Time Preference, and Risk o.f
No.n-Co.nventio.nal So.lutio.ns
10. Carrying Capacity o.f the Eco.system 89 I. Po.llutio.n fro.m Agriculture
II. Po.llutio.n fro.m Industry III. Quantitative Acco.unt o.f Po.llutio.n Po.tentials and
Carrying Capacity
11. So.cial Cho.ice in a Finite Wo.rld I. Cho.ice Criteria and Choice Variables
II. Evaluatio.ns Pertaining to. Po.pulatio.n System III. Evaluatio.ns Pertaining to. the k-Co.mpo.nent
PART THREE: THEORETICAL AND EMPIRICAL OUTLINE OF MAJOR SOCIO-ECONOMIC PROCESSES
99
12. Dissected System Structure and Secto.ral Relatio.nships 111
13. A General Theo.ry o.f Transitio.n 114

Contents
14. In the Theoretical Mainstream I. Classical and Neoclassical Theory as Descriptive and
Normative Theories II. Validity of Cognitive Steps and Resulting
Hypotheses 1. Compatibility with Historical Experience of
Western Countries 2. Feasibility and Desirability of Repeating Western
Experience in Contemporary Asia 3. Predictive Capacity for Contemporary Asia
vii
121
15. Against the Current 146 I. Bird's-Eye View
II. Asset Differentials and Concentration Trends III. Increasing Income Differentials IV. Effect of Increasing Income Inequality on Savings
and Consumption Behaviour V. Demand as an Explanatory Variable
VI. 'Subsistence Surplus', Intersectoral Terms of Trade, and Responsiveness of Supply
VII. Stagnation and Crash-Modernisation Transitions VIII. Impact of Socio-Economic Processes on Population
Behaviour IX. Impact of Population Growth on Socio-Economic
Processes X. Ecosystem, Development Differentials, and Social
Choice
16. New Normative Directions of Socio-Economic Processes 188 I. General Policy Inference: Narrowing the Develop-
ment Differentials II. The Bare Bones of a Normative Model
1. An Outline 2. Classification of Welfare Components 3. Poverty Line and Minimum Income 4. Welfare and Needs
III. Productivity Effects of Redistributional Policies 1. Composite Productivity Effects: A Model 2. Direct Productivity Effects 3. Productivity Effects of Welfare

viii Contents
17. Behavioural Stratum I. Mi-unit Characteristics, Behavioural Sequence, and
Classification of Activities II. Multiple Nature and Impact of Behavioural Deter-
minants on Development Agents 1. 'External' and 'Internal' Determinants of Social
Change 2. 'Holistic' and 'Particularistic' Aspects of Institu-
tional Change 3. Resource Availability as Determinant of Beha-
vioural Change
18. Political Structure: Deterministic Forces and the
240
Exogenously Determined 'Energy for Change' 263 I. Outline of Political Structures
II. Welfare and Productivity Implications of Changes in Political Structure
III. Resource Distribution and Institutional Factors as Determinants of Political Structure
IV. Ideas as Autonomous Factors V. 'Energy for Change' vs. Deterministic Operation of
System
Conclusion
Appendixes
Notes
Bibliography
Index
278
283
305
319
333
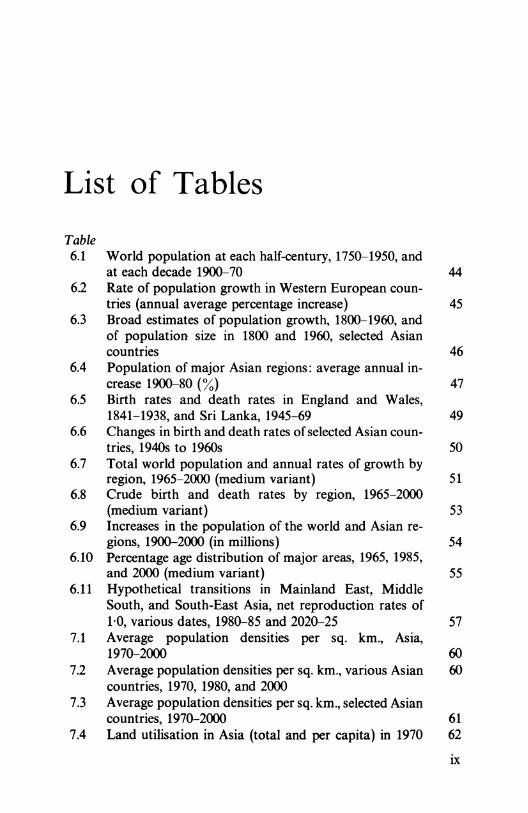
List of Tables Table 6.1
6.2
6.3
6.4
6.5
6.6
6.7
6.8
6.9
6.10
6.11
7.1
7.2
7.3
7.4
World population at each half-century, 1750-1950, and at each decade 1900-70 Rate of population growth in Western European coun-tries (annual average percentage increase) Broad estimates of population growth, 1800-1960, and of population size in 1800 and 1960, selected Asian countries Population of major Asian regions: average annual in-crease 1900-80 (%) Birth rates and death rates in England and Wales, 1841-1938, and Sri Lanka, 1945-69 Changes in birth and death rates of selected Asian coun-tries, 1940s to 1960s Total world population and annual rates of growth by region, 1965-2000 (medium variant) Crude birth and death rates by region, 1965-2000 (medium variant) Increases in the population of the world and Asian re-gions, 1900-2000 (in millions) Percentage age distribution of major areas, 1965, 1985, and 2000 (medium variant) Hypothetical transitions in Mainland East, Middle South, and South-East Asia, net reproduction rates of 1'0, various dates, 1980-85 and 2020-25 Average population densities per sq. km., Asia, 1970-2000 Average population densities per sq. km., various Asian countries, 1970, 1980, and 2000 Average population densities per sq. km., selected Asian countries, 1970-2000 Land utilisation in Asia (total and per capita) in 1970
44
45
46
47
49
50
51
53
54
55
57
60 60
61 62
ix

x List of Tables
7.5 Population estimates and projections, Asia, 1970-2000 (total, urban, and rural) 63
7.6 Urban and rural populations, selected European coun-tries, 1850-1911 65
8.1 Arable land used as fallow land, selected European countries, 17th-19th centuries 67
9.1 Crude estimate of ultimate resources of fossil fuels 83 92 Energy resources per capita of the world by regions 84
10.1 Crude measurement of pollution intensity in countries of the ESCAP region 96
14.1 Long-term changes in Pareto coefficients in England and Germany (Prussia), 1850-1960 129
142 Absolute number of workers in agriculture in Great Bri-tain and France, 1831-1931 130
14.3 Gross domestic saving as percentage of GNP, selected Asian countries (at current market prices) 132
14.4 Gross investment as percentage of GNP, selected Asian countries (at current market prices) 132
14.5 Annual growth rates of real GNP, selected Asian coun-tries, 1950-80 135
14.6 Total labour force and unemployment, selected Asian countries 136
14.7 Urban slums and uncontrolled settlements, selected Asian countries 137
14.8 Estimated unemployment by region in Asia, 1970 and 1980 139
14.9 Increase in money and real wages in manufactui-ing industry, 1963-66 and 1966--69, selected Asian countries 142
15.1 Average profits and wages per person employed by size of industrial firms in Greater Bangkok area 156
152 Rates and shares of demographic investment in selected Asian countries, 1970 177
15.3 Growth rates of labour force (%) and net additions to the labour force, Asia, 1965-85 (in millions) 180
16.1 Estimates of population below poverty lines 208 162 Poor, seriously poor, destitute, and total population by
region, 1972 209 16.3 Calcutta: mean intake of nutrients 216 16.4 Household size and nutritional intakes compared,
Philippines survey 216

List of Tables Xl
16.5 Food supplies: calories and proteins per capita compared with respective requirements 217
16.6 Alternative projections of calorie deficits, affected popu-lation 218
16.7 Ratios of output and profits to fixed assets of foreign and domestic firms in Greater Bangkok area 224
16.8 Capital-output ratio, net savings rates, and annual rates of capital formation-simulation results 225

List of Figures Figure 4.1 Hypothetical changes in desiderata values of various
sub-systems with minima and maxima 25 5.1 Causal interactions between MIUJ_ and Mil-levels 38 8.1 Seasonal distribution of rainfall at selected stations in
monsoon Asia 68 8.2 Soil regions 70 8.3 Major locations oftransplanting and shifting cultivation 71
13.1 Modes of transition and differential development paths (of B-sector) 117
14.1 Framework of cognitive steps 128 14.2 Gini ratios against GNP per capita, selected Asian coun-
tries, 1965 140 14.3 Wage and employment levels given various assumptions
about population growth and productivity differentials 143 15.1 Basic causal links of socio-economic variables within a
multi-systems context 148 15.2 Sectoral terms of trade under conditions of rural-urban
migration and subsistence consumption 170 15.3 Nature of a 'dualistic transitional process' 171 15.4 Population growth as a function of average income given
various assumptions about income distribution 174 15.5 Hypothetical total and sectoral growth-path assump-
tions; growth of total labour force 2 %; initial labour force in agriculture 80% 181
15.6 Income and population growth differentials as determin-ants of net social welfare 183
16.1 Social welfare in multi-systems context-with policy linkages 192
16.2 Needs and actual provision of calories according to age groups: deviations from the optimum distribution 213
16.3 Causal model combining direct and indirect producti-vity effects 221
xii

List of Figures xiii
16.4 Productivity effect of welfare-causal model with policy linkages 229
16.5 Productivity effects of welfare over k periods 230 17.1 Interactions between resource and behavioural variables
with policy linkages 242 17.2 Determinants of micro-behaviour 243 17.3 Impact of determinants on type and level of behavioural
components-examples of feasible linkages 251 18.1 Welfare and productivity implications of political
structure-basic causal links within a multi-systems con-text 265
18.2 Resource distribution and institutions as determinants of political structure and development strategy-basic causal linkages in multi-systems context 269
18.3 'Energy' for strategy change 275
ALl Impact of development of industrialised countries on Asian countries (hypothetical paths) 284
A2.1 Finality and equifinality 286 A2.2 Ranges of single paths within total area of possible paths 288 A3.l Shifting agricultural production functions and arable
land densities in comparative view 292 A4.1 Causal impact model of pollution in multi-systems con-
text 297 A5.1 Social welfare at various levels of activities given finite
resource constraints and constant population 301 A52 Social welfare at various levels of activities given finite
resource constraints and different popUlation levels 301

Preface
At the present state of development theory, any author seems to be confronted with the choice whether to travel on a well-paved road in a wrong din:ction or to travel on an unpaved road in (hopefully) the right direction. As far as this author could not avoid making this choice, he unhesitatingly chose the latter option-well aware of the risks involved in such a choice. There are, indeed, good reasons to use the well-paved road of established paradigms in the theory of develop-ment, the well-reasoned hypotheses, neatly arranged data, and rigorous methods of empirical testing. There is, for instance, always the hope that the well-paved road will be only a detour that finally arrives at the proper destination-with more rigour and with more substance of the theoretical and empirical statements made.
The author felt reluctant to adopt this optimism. The empirical evidence challenges increasingly not only the validity of single hy-potheses, but of the entire set of premises on which these hypotheses are based. Major developmental outcomes-such as increasing socio-economic differentials (asset-, income-, productivity-, etc. differentials), imbalances in ecological development, persistent population pressure and increasing mass poverty-are difficult to predict and to explain within the existing 'paradigm'. Thus, the assumption of a 'productive detour' may well misdirect our entire research efforts in a principal way. It becomes increasingly apparent that only a new road-a reassessment of the basic set of premises and assumptions-will secure a somewhat safer travelling given the present state of development theory.
xv

xvi Preface
I have the agreable duty to thank all those who contributed to the accomplishment of the work. In particular, I gratefully acknowledge valuable comments made by Professors Michael Braulke (Konstanz), David J. Frederickson (New York), Takao Fukuchi (Tokyo), Emil Kung (St. Gallen), Harvey Leibenstein (Cambridge, USA), Kurt W. Rothschild (Linz), and Mitsuo Sasaki (Tokyo). I further owe a token of gratitude to Mrs Ingrid Seger who typed the manuscript, and, finally, to the Swiss National Science Foundation who supported the study. It goes without saying that for all the inadequacies the reader may encounter on the unpaved road, the author alone is responsible.
Glossary of Symbols
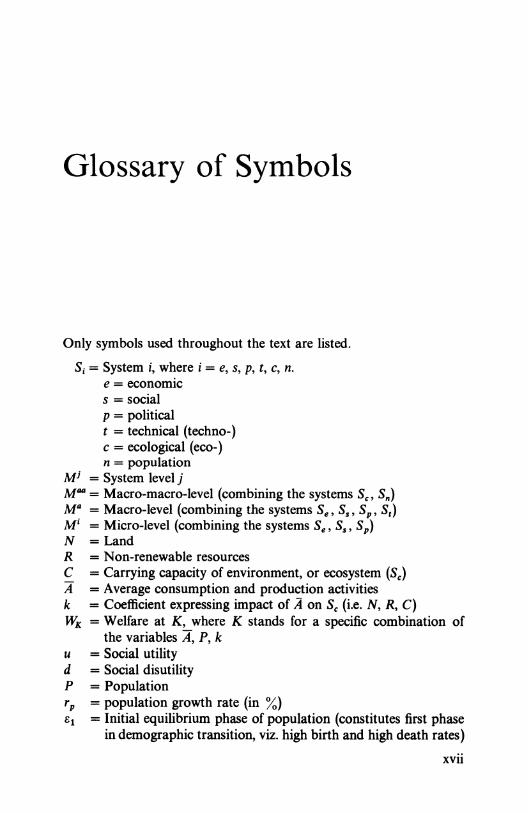
Only symbols used throughout the text are listed.
Si = System i, where i = e, S, p, t, C, n. e = economic S = social p = political t = technical (techno-) C = ecological (eco-) n = population
Mi = System level j MaD = Macro-macro-Ievel (combining the systems S., Sn) Md = Macro-level (combining the systems Se, S., SP' S,) Mi = Micro-level (combining the systems Se, S., Sp) N = Land R = Non-renewable resources C = Carrying capacity of environment, or ecosystem (S.) It = Average consumption and production activities k = Coefficient expressing impact of A on Sc (i.e. N, R, C) WK = Welfare at K, where K stands for a specific combination of
the variables It, P, k u = Social utility d = Social dis utility P = Population rp = population growth rate (in %) 81 = Initial equilibrium phase of population (constitutes first phase
in demographic transition, viz. high birth and high death rates)
xvii

xviii Glossary of Symbols
1:4 = Ultimate equilibrium phase of population (constitutes fourth phase in demographic transition, viz. low birth and low death rates)
Fi = Production function = 0i = f(K;, L;, ... )
0i = Output Ki = Capital Li = Labour i stands for sector (s)i, where i = 1, ... n
Pi = 'Traditional', small-scale sectors, applying specific 'traditional' production and demand functions, institutions and behaviour
Pn = 'Modern', large-scale sectors, applying specific 'modern' produc-tion and demand functions, institutions and behaviour
Y = Total income y = Average income ro = Total income growth rate (in %) r i = Average income growth rate (in %)