THE NEW GEOSCIENCE ATLAS - nr.gov.nl.ca · INTRODUCTION The Geoscience Atlas ... Atlas Tutorial...
8
Current Research (2015) Newfoundland and Labrador Department of Natural Resources Geological Survey, Report 15-1, pages 287-294 THE NEW GEOSCIENCE ATLAS P. Honarvar, L.W. Nolan, L. Crisby-Whittle, G. Roberts and S. Duquet Geoscience Data Management Section ABSTRACT The Geoscience Atlas is Newfoundland and Labrador’s website to view, query and output geoscience datasets from the Provincial Government. The Atlas was recently upgraded to a new server technology, with a new organization, new tools and new layers, as well as updates to some of the older layers. Access to the Atlas is through the GeoScience OnLine webpage, as it provides not just a link to the Atlas and other online resources, but also announcements, such as scheduled maintenance times when the Atlas or specific layers may be unavail- able. New additions to the Atlas tools include a tool to share the map view with a colleague, draw graphics and text on the map, download both vector and raster data in a variety of formats, more custom query forms, print to scale and bookmark window extents. New layers include numerous Atlas base maps and base maps from external sources, coastal monitoring lay- ers indicating coastal erosion and characterization, hydrogeology, and numerous detailed airborne geophysics images of western Labrador and western Newfoundland. Future upgrades include the reorganization of the Indexes Group, the addition of tools to provide summary reports, links to more data, photos, maps and reports to provide streamlined access to all geoscience data and information for the Province. INTRODUCTION The Geoscience Atlas is Newfoundland and Labrador’s (NL) website to view, query and output geoscience datasets from the Provincial Government. Access to the Atlas is through the GeoScience OnLine webpage. The goal of the Geoscience Atlas is to provide easy access to the geoscience data and information of the Province in a map-based spatial format with numerous links to related data contained in sites, such as the bibliographic Geofiles ( http://gis.geosurv.gov.nl.ca/minesen/geofiles/ ), Mineral Licence Inquiry Reports (http://gis.geosurv.gov.nl.ca/mrinquiry/mrinquiry.asp) or MODS Cards (http://gis.geosurv.gov.nl. ca/mods/mods.asp). The Geoscience Atlas was recently upgraded to a new server technology, with new tools and new layers as well as updates to some of the older layers. A number of new base maps are available to provide spatial reference for the point, line and polygon layers. This overview of the Atlas will focus on groups of tools, such as the Search and Query tools. A linear, step-by-step approach to the Atlas can be found in the Atlas Help file (http://geoatlas.gov.nl.ca/custom/help/help.html) and the Atlas Tutorial slides (http://geoatlas.gov.nl.ca/custom/help/ Help_AtlasTutorial.pdf). GEOSCIENCE ONLINE Geoscience Online provides links to the Geoscience Atlas, as well as links to provincial Mines Branch Services and Energy Branch Services as well as National GIS Resources. It is recommended to access the Geoscience Atlas through the GeoScience OnLine webpage (http://gis.geosurv.gov.nl.ca), as it provides announcements on scheduled maintenance times when the Atlas may be unavailable, or if specific layers are down for maintenance. The Geoscience Online webpage also provides a link to the What’s New page, listing recent updates to the Atlas, and an email link ([email protected]) for any questions or comments on the Atlas. Access to the Geoscience Atlas is through the Interac- tive Maps link, by clicking on the image of Newfoundland and Labrador or going directly to http://geoatlas.gov.nl.ca. 287
Transcript of THE NEW GEOSCIENCE ATLAS - nr.gov.nl.ca · INTRODUCTION The Geoscience Atlas ... Atlas Tutorial...
Current Research (2015) Newfoundland and Labrador Department of Natural ResourcesGeological Survey, Report 15-1, pages 287-294
THE NEW GEOSCIENCE ATLAS
P. Honarvar, L.W. Nolan, L. Crisby-Whittle, G. Roberts and S. Duquet
Geoscience Data Management Section
ABSTRACT
The Geoscience Atlas is Newfoundland and Labrador’s website to view, query and output geoscience datasets from theProvincial Government. The Atlas was recently upgraded to a new server technology, with a new organization, new tools andnew layers, as well as updates to some of the older layers.
Access to the Atlas is through the GeoScience OnLine webpage, as it provides not just a link to the Atlas and other onlineresources, but also announcements, such as scheduled maintenance times when the Atlas or specific layers may be unavail-able.
New additions to the Atlas tools include a tool to share the map view with a colleague, draw graphics and text on themap, download both vector and raster data in a variety of formats, more custom query forms, print to scale and bookmarkwindow extents. New layers include numerous Atlas base maps and base maps from external sources, coastal monitoring lay-ers indicating coastal erosion and characterization, hydrogeology, and numerous detailed airborne geophysics images ofwestern Labrador and western Newfoundland.
Future upgrades include the reorganization of the Indexes Group, the addition of tools to provide summary reports, linksto more data, photos, maps and reports to provide streamlined access to all geoscience data and information for the Province.
INTRODUCTION
The Geoscience Atlas is Newfoundland and Labrador’s
(NL) website to view, query and output geoscience datasets
from the Provincial Government. Access to the Atlas is
through the GeoScience OnLine webpage. The goal of the
Geoscience Atlas is to provide easy access to the geoscience
data and information of the Province in a map-based spatial
format with numerous links to related data contained in
sites, such as the bibliographic Geofiles
(ht tp: / /g is .geosurv.gov.n l .ca/minesen/geof i les / ) ,
Mineral Licence Inquiry Reports
(http://gis.geosurv.gov.nl.ca/mrinquiry/mrinquiry.asp) or
MODS Cards (http://gis.geosurv.gov.nl. ca/mods/mods.asp).
The Geoscience Atlas was recently upgraded to a new
server technology, with new tools and new layers as well as
updates to some of the older layers. A number of new base
maps are available to provide spatial reference for the point,
line and polygon layers.
This overview of the Atlas will focus on groups of tools,
such as the Search and Query tools. A linear, step-by-step
approach to the Atlas can be found in the Atlas Help file
(http://geoatlas.gov.nl.ca/custom/help/help.html) and the
Atlas Tutorial slides (http://geoatlas.gov.nl.ca/custom/help/Help_AtlasTutorial.pdf).
GEOSCIENCE ONLINE
Geoscience Online provides links to the Geoscience
Atlas, as well as links to provincial Mines Branch Services
and Energy Branch Services as well as National GIS
Resources. It is recommended to access the Geoscience
Atlas through the GeoScience OnLine webpage
(http://gis.geosurv.gov.nl.ca), as it provides announcements
on scheduled maintenance times when the Atlas may be
unavailable, or if specific layers are down for maintenance.
The Geoscience Online webpage also provides a link to the
What’s New page, listing recent updates to the Atlas, and an
email link ([email protected]) for any questions
or comments on the Atlas.
Access to the Geoscience Atlas is through the Interac-tive Maps link, by clicking on the image of Newfoundland
and Labrador or going directly to http://geoatlas.gov.nl.ca.
287
CURRENT RESEARCH, REPORT 15-1
GEOSCIENCE ATLAS
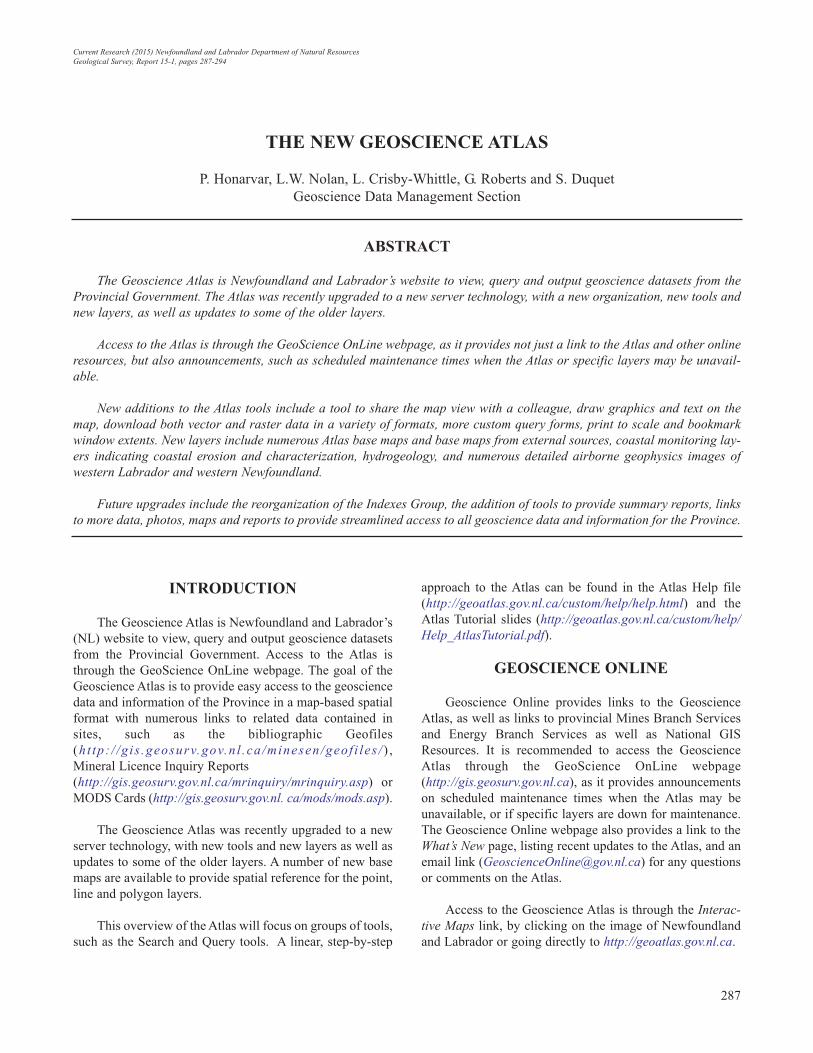
The Geoscience Atlas default page (Figure 1) opens to
a regional view of Newfoundland and Labrador with the
Contents panel on the left and the pull-down menus along
the top. The coordinates along the bottom of the map view
are latitude and longitude, and UTM based on the NAD27
datum. The overview window can be toggled on and off by
clicking on the white arrow in the lower right corner. A new
feature of the Atlas is the ability to retain a memory of the
map extents and open layers when it is subsequently opened;
to utilize this feature the internet browser settings should be
set to ‘remember history’ or ‘allow cookies’.
Further information on the layers and tools is available
in the Atlas Help file through the HELP icon. An overview
of the Atlas is provided in the Atlas Tutorial slides located at
the top of Atlas Help.
NAVIGATION AND TOOLS
Most of the tools in the new Geoscience Atlas are sim-
ilar to the old Atlas, but there are new tools and methods of
navigating around the Atlas. The following list describes
methods to navigate (zoom and pan) around the map view-
er window:
1. Roll the mouse roller to zoom in/out,2. Drag the zoom slider, on the left side, to zoom in/out,3. Hold down the shift key and drag a box on the map to
zoom in,
4. Hold down Ctrl+Shift and drag a box on the map to
zoom out,5. Click the map and drag the mouse to pan the map,
6. Click the shaded box in the overview map, on the lower
right, and drag it to a new location to quickly pan the
map.
There is no longer an Identify tool – this has been
replaced by a simple click of the cursor that will display tab-
ular data in the Search Results window for any of the open
vector layers but not for the raster images.
The main set of tools is in the Tools menu and consist
of Share Map, Draw Graphics, Spatial Search, Add Map
288
Figure 1. The Geoscience Atlas default page with scale slider and contents panel on the left, scale bar, cursor coordinates(based on datum NAD27) and overview window along the bottom and menu’s across the top of the Map Viewer window.

P. HONARVAR, L.W. NOLAN, L. CRISBY-WHITTLE, G. ROBERTS AND S. DUQUET
Service, Download Data, Attribute Query and CustomQueries. A description of these tools is provided in the AtlasHelp file (http://geoatlas.gov.nl.ca/custom/help/help.html)as well as the Atlas Tutorial slides (http://geoatlas.gov.nl.ca/custom/help/Help_AtlasTutorial.pdf).
LAYERS AND BASE MAPS
Layers
The Contents panel provides access to over 150 layers
of data, ranging from Map Labels to regional Newfoundland
and Labrador Residual Magnetics images in the GeophysicsGroup. The groups consist of:
Map Layers
Coastal Monitoring
Indexes
Land Use
Mineral Lands
Geochemistry
Bedrock Geology
Surficial Geology
Geophysics
The order of the groups is important. If the groups are
not in the above order then a layer of images or polygons
may cover a layer of points or lines. To reset the order, click
on the refresh/reload button ( ) once or twice. Note that the
order of the layers in the Contents panel is the same order as
in the drop-down lists, such as in the Download or AttributeQuery tool lists.
Most of the groups are self-explanatory but some of the
groups require more explanation. The Map Layers Group is
a miscellaneous set of layers consisting mainly of topo-
graphic layers (place names, NTS mapsheet outlines, UTM
grid lines, roads, rivers, shorelines, provincial border and
elevation contours) but also includes Drill Core and Miner-al Occurrence datasets. The new Coastal MonitoringGroup consists of layers providing coastal erosion rates,
geomorphology, sedimentology, sensitivity and petroleum
vulnerability. The Indexes Group provides bounding poly-
gons, and links to further information, for Bedrock GeologyMaps, Geochemical Surveys and Airborne Geophysical Sur-veys. The layers in the Land Use Group are from other
departments. They include the Labrador Inuit Lands area
and the Public Water Supply areas that have restrictions on
what can be done within the area boundaries. The Geo-chemistry Group now includes both the geochemistry ele-
ment layers (e.g., plutonic rocks, lake sediments) as well
drop-down lists of over 200 sublayers of geochemical data,
consisting of dot plots, interpolated element images and
contours derived from those images. This provides more
flexibility in displaying many data layers at the same time.
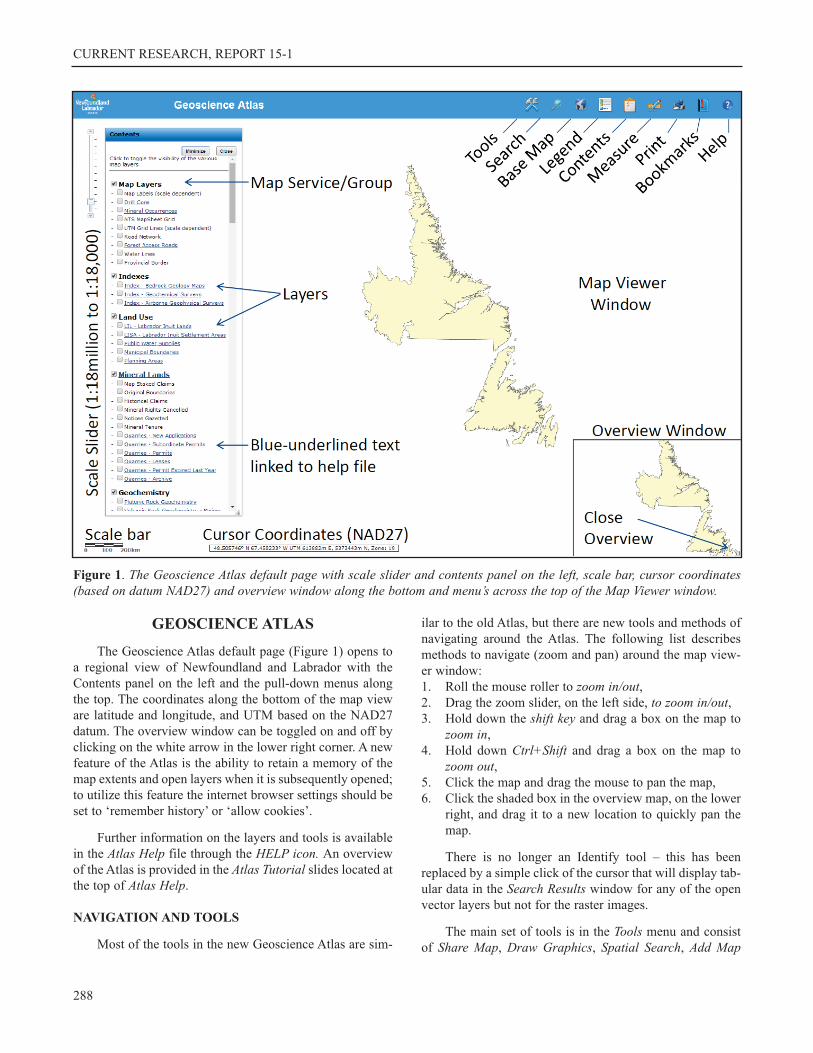
The Geophysics Group contains over 90 geophysical images
from the west coast of the Island as well as western
Labrador (Figure 2). The last two images consist of the
regional magnetics for all of Newfoundland and Labrador. A
white Water Lines layer is available at the top of the Geo-physics Group to overlay on the geophysics images.
Base Maps
Five base maps (Figure 3) are available to provide a
topographic reference for the layers in the Contents panel.
These can be accessed through the Base Map icon on the
menu bar. There are two vector-based topographic maps,
Topographic and Outline Topo, that display lakes and rivers,
building locations, built up areas and power lines (red
dashed lines) at the most detailed zoom level. The ScannedTopo base map displays mosaicked scans of the 1:250 000-
and 1:50 000-NTDB topographic paper maps. Some of these
maps are based on the NAD27 datum and others on the
NAD83 datum, so the scanned UTM grid lines may not
match up with the NAD27 UTM Grid Lines layer in the MapLayers Group. The fourth base map is the Grey Topo base
map. It provides a simple, clean layer to overlay other infor-
mation on. The last base map is the Grey Topo DEM (Digi-
tal Elevation Model). It displays a shaded-relief elevation
image developed from the Shuttle Radar Topography Mis-
sion (http://www2.jpl.nasa.gov/srtm/).
None of the base maps are available to query or down-
load. Further information on all the layers is provided in the
Atlas Help file under the List of Layers link in the BaseMaps section.
Map Services
Another set of base maps can be obtained from the
Tools menu under the Add Map Service tool. Under the
ArcGIS Server type, click on the drop-down list to pick the
default ArcGIS Online rest services (http://services.arcgisonline.com/arcgis/rest/services). Click on the GetServices button to provide a list of over 20 world base maps,
such as ESRI_Imagery_World_2D. To overlay the Atlas lay-
ers on these Map Services, click on the Reorder tab, scroll to
the bottom of the list and move the Map Service layer up to
the top. This list indicates the draw order of the layers and
that the ESRI_Imagery_World_2D will draw first. This
Reorder list cannot be used to reorder the other layers. Note
that these Map Services are based on the WGS84 datum and
so the Atlas layers, based on NAD27, will not overlay exact-
ly at larger scales.
SEARCH AND QUERY
Search Tool
The Search tool, on the main menu bar, provides a text-
289
CURRENT RESEARCH, REPORT 15-1
based search of any or all the data layers. Click on the
Search icon ( ) and then click on the drop-down list to
select All, select a group or select an individual layer, such
as Detailed Bedrock Geology. Type the word to search for,
such as granite. This will find all the features that contain
granite in the associated attribute table(s) and highlight
them on the map.
The Search tool can also search location place names by
clicking on Location. Type the location name, such as
postville, NL. Capitals are not necessary, but the province
and sometimes country are necessary to distinguish the
place from other places in the world. If the map view shifts
to a blank white screen, click the Bookmark icon on the
menu bar to locate the map view back to Labrador, New-
foundland or the default Initial Extents. A right click on the
red search location dot (Figure 4) provides access to GoogleStreet View and Bing Bird’s Eye view, as well as direct access
to the Spatial Search tool, where this location is automati-
cally entered into the Graphic selection.
Spatial Search
Spatial Search is available through the Tools menu. It
can be performed on features in the map display using either
Graphic selection or Current selection (Figure 5). The
Graphic is based on graphics that have been drawn on the
map display using the Draw Graphics tool. To create a new
graphic, access the Draw Graphics tool by clicking on
the Add Graphic button ( ) to the right. Previously created
graphics are listed in a drop-down list and can be selected
for use. Any features that overlap this selected graphic and a
buffer around the graphic, will be highlighted on the map
while the records will be returned in the Search Results win-
dow.
Records listed in the Search Results window, whether
from a Spatial Search, a query or by clicking on a feature,
can be used in further Spatial Searches by clicking on the
Overlap – Current Results option. This option bases a new
search on any features, such as polygons in the Detailed
290
Figure 2. Detailed geophysics (in this case, residual magnetics are shown) from 12 detailed surveys.

P. HONARVAR, L.W. NOLAN, L. CRISBY-WHITTLE, G. ROBERTS AND S. DUQUET
Bedrock Geology layer, overlapping a current result or a
buffered current result.
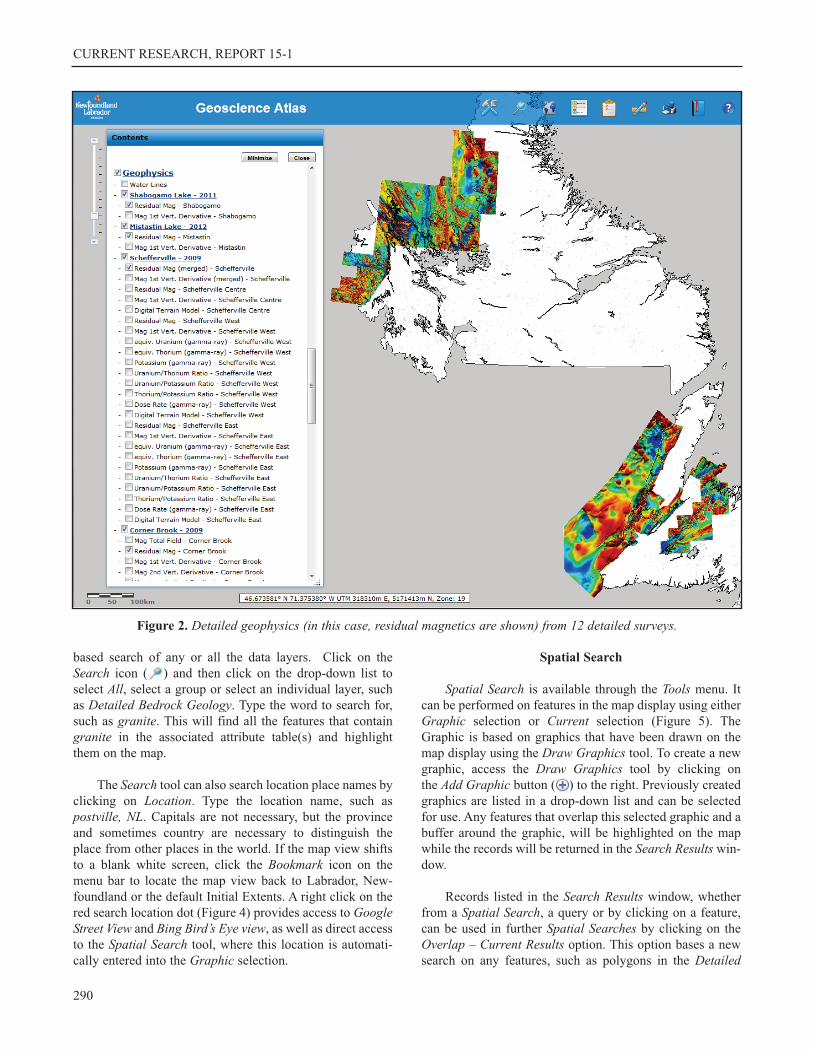
Attribute Query
The Attribute Query tool, in the Tools menu, provides
the ability to question the various vector layers (i.e., layers
that contain associated tabular data) by using the structured
query language (SQL) method. The dialogue box (Figure 6)
provides drop-down lists to select the layer and attribute
(field) of interest. The Operations, such as Equal To or
Greater Than, are also provided in a drop-down list. Click
on Get Sample Values to populate the drop-down list of val-
ues for that attribute; if there are too many values then this
list will only provide an example of the values in that field.
To enter a value not on the values list enter it manually in the
box below. Then click Add to Query Expression and run the
query. The query expression cannot be manually edited in
the expression box.
Custom Query
The Custom Queries, also in the Tools menu, are organ-
ized as forms listing common queries for 17 layers. For
example, a common query for the Map Staked Claims layer
is ‘What claims have been staked in the last few days’.Entering the Start Stake Date and running the query will
provide a Search Results window listing the latest claims
staked between the start date and the current date (the
default end date).
291
Figure 3. Base Maps available to add as spatial referencefor the layers in the Contents panel.
Figure 4. Search for a Location and access Google StreetView, Bing Bird’s Eye view or use the location for a SpatialSearch.
Figure 5. Spatial Search dialogue box where drillcore loca-tions will be selected if they overlap the graphic Polygon 1and a 100 m buffer around the polygon.
CURRENT RESEARCH, REPORT 15-1
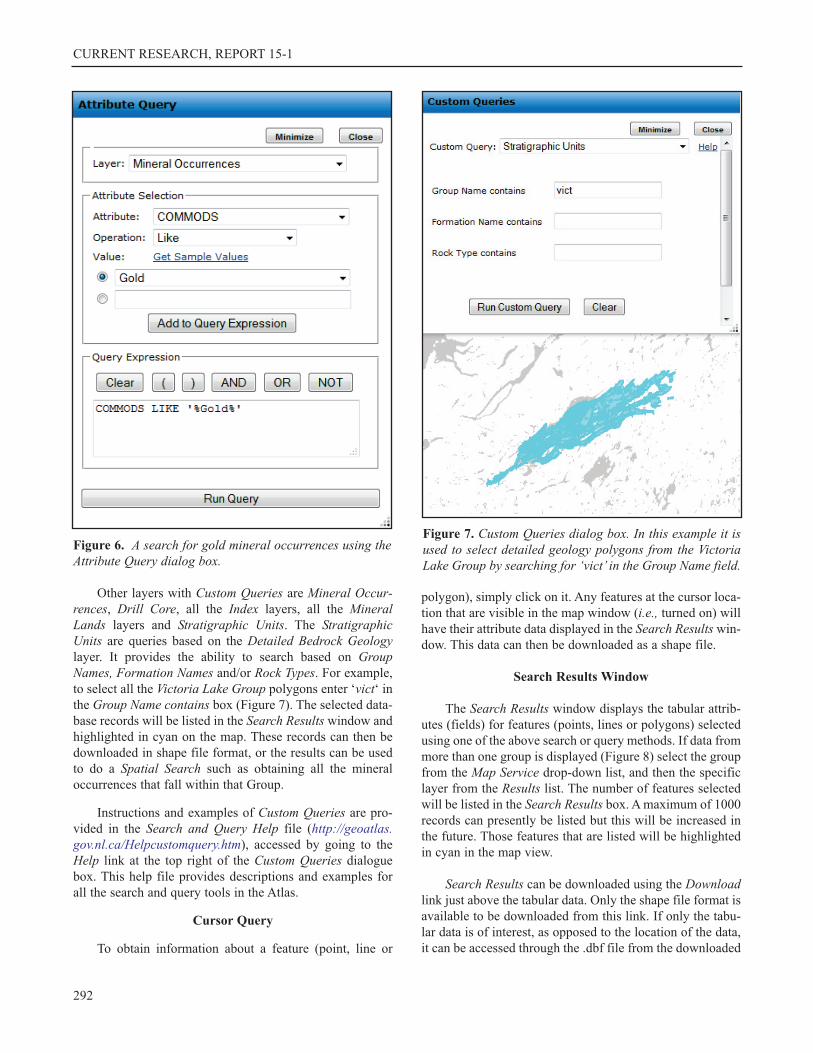
Other layers with Custom Queries are Mineral Occur-rences, Drill Core, all the Index layers, all the MineralLands layers and Stratigraphic Units. The StratigraphicUnits are queries based on the Detailed Bedrock Geologylayer. It provides the ability to search based on GroupNames, Formation Names and/or Rock Types. For example,
to select all the Victoria Lake Group polygons enter ‘vict‘ inthe Group Name contains box (Figure 7). The selected data-
base records will be listed in the Search Results window and
highlighted in cyan on the map. These records can then be
downloaded in shape file format, or the results can be used
to do a Spatial Search such as obtaining all the mineral
occurrences that fall within that Group.
Instructions and examples of Custom Queries are pro-
vided in the Search and Query Help file (http://geoatlas.gov.nl.ca/Helpcustomquery.htm), accessed by going to the
Help link at the top right of the Custom Queries dialogue
box. This help file provides descriptions and examples for
all the search and query tools in the Atlas.
Cursor Query
To obtain information about a feature (point, line or
polygon), simply click on it. Any features at the cursor loca-
tion that are visible in the map window (i.e., turned on) will
have their attribute data displayed in the Search Results win-
dow. This data can then be downloaded as a shape file.
Search Results Window
The Search Results window displays the tabular attrib-
utes (fields) for features (points, lines or polygons) selected
using one of the above search or query methods. If data from
more than one group is displayed (Figure 8) select the group
from the Map Service drop-down list, and then the specific
layer from the Results list. The number of features selected
will be listed in the Search Results box. A maximum of 1000
records can presently be listed but this will be increased in
the future. Those features that are listed will be highlighted
in cyan in the map view.
Search Results can be downloaded using the Downloadlink just above the tabular data. Only the shape file format is
available to be downloaded from this link. If only the tabu-
lar data is of interest, as opposed to the location of the data,
it can be accessed through the .dbf file from the downloaded
292
Figure 6. A search for gold mineral occurrences using theAttribute Query dialog box.
Figure 7. Custom Queries dialog box. In this example it isused to select detailed geology polygons from the VictoriaLake Group by searching for ‘vict’ in the Group Name field.

P. HONARVAR, L.W. NOLAN, L. CRISBY-WHITTLE, G. ROBERTS AND S. DUQUET
data and opened in many spreadsheet programs. The data
can also be manually selected from the Search Results win-
dow and copied and pasted to a spreadsheet program.
To the left of each record in the Search Results window
there is a zoom function; this will zoom to that record’s fea-
ture (point, line or polygon), center it in the map view and
highlight it in red. Many databases also have Links to relat-
ed data. For example, Mineral Occurrences will link to fur-
ther information contained on their MODS cards, and MapStaked Claims and Historical Claims link to both the Min-eral License Inquiry reports as well as any assessment
reports contained in the Geofiles database.
OUTPUT: DOWNLOAD AND PRINT
Download Data
The Download Data tool, in the Tools menu, has been
enhanced to download both vector (features such as points,
lines and polygons) and raster (image) formats. Only geo-
science data is available for download; no topographic or
Land Use data can be downloaded. The layers in the drop-
down list are in the same order as in the Contents panel. The
layer does not have to be turned on to download it. For vec-
tor features, only the data within the extents of the map win-
dow are downloaded. For raster images, the whole image is
downloaded regardless of the map window extents. A num-
ber of formats are available to download the data, including
shape files for vector data and geotif’s for raster images. The
downloaded file coordinate system is latitude-longitude
based on the datum NAD27. Only one layer at a time can be
downloaded. Vector data can be downloaded through the
Search Results window as well. This will encompass only
the data that is listed in the Search Results window.
Print Tool
The Print tool, on the main menu bar, provides access
to various printing methods. Set up the map viewer with the
layers and extent of interest. Then click on the Print icon to
see a preview of the map. Scroll to the bottom of the win-
dow to view the Custom print options on the left and Quickprint options on the right. The main feature of the Customprint options is its ability to print to scale. It also provides
for the input of a title and the choice of a number of map
templates on different paper sizes and orientations. If DrawnGraphics are used, they will not be included on the custom
map. The output is provided in pdf format.
The Quick print options, on the lower right side, do
include Drawn Graphics. The Print Image button sends the
preview map straight to the chosen printer. The Save Imagebutton will open the map in a new browser window where it
can be copied and pasted to another program or saved as a
bmp or png file, depending on what browser is being used.
The Save Image as PDF and the Print Legend buttons are
self-explanatory. Note that the legend contains all the sym-
bology (including point symbols, line styles and polygon
colours) for all layers turned on and not just for features vis-
ible in the print preview extents. The legend does not display
symbology from the base maps, road networks or images.
HELP FILES
All the layers of data have associated help files. Most
layers have help files linked to their layer name but some
help files are linked to the group name indicated by the blue
underlined text in the Contents panel. All the layers also
have a brief description in the List of Layers help file.
The Atlas Help file, in the Help menu on the main menu
bar, provides a brief description of all the Atlas tools as well
as links to other help files, such as Frequently Asked Ques-tions (FAQ), List of Layers, and the Search and Query help
file.
The Frequently Asked Questions file provides answers
to common questions such as:
• What is the projection and datum of the Atlas versus
293
Figure 8. Groups are listed in the Search Results windowunder Map Service. Select the Group first, then select thelayer in the Results drop-down list.

CURRENT RESEARCH, REPORT 15-1
downloaded data,
• What do you do when the Atlas does not perform as
expected (e.g., does not return tabular data in the
Search Results window),
• Where do you get symbology to apply to downloaded
GIS data, and
• What to do when the layers in the Contents panel are
not in the correct order.
As mentioned above, the List of Layers help file
describes each layer in the Contents panel as well as the base
maps. It also provides links to the What’s New file and the
online mineral Claim Staking system.
The Search and Query help file provides more detailed
instructions on how to run the search and query tools con-
sisting of Spatial Search, Attribute Query, Custom Queries,
Search (on the main menu bar) and Identify. This help file is
still under construction and will have more graphics and
examples added in the future.
FUTURE PLANS
Many of the future plans listed in the 2013 Current
Research (Honarvar et al., 2013) are summarized here as
they were sidelined while this new Atlas was being devel-
oped. The What’s New file will provide an update of recent
changes.
The next set of upgrades to the Atlas will occur in the
Indexes Group. This Group presently consists of the spatial
extents or NTS map overlap of geological, geochemical and
geophysical reports, maps and data. New indexes, such as
Surficial Geosciences and a Publications index, will be
added to provide links to surficial geology maps, aggregate
maps and published reports.
The Detailed Geology of Labrador has begun to be
compiled, starting with the maps in the southeast (Gower,
2010) and working inland to the west and north. As a first
step, this information will be made available on the Geo-
science Atlas for download as vector polygon and line files
with the original geological unit attributes included but
without a common legend theme or colour set.
New tools will be developed, such as a tool to provide
a geology map legend that limits the units to just those with-
in the map extents. A tool to provide a comprehensive list of
all data, reports and maps available for a specified area of
interest will also be developed.
The Atlas itself will be upgraded so that the layers in the
Contents panel are collapsed in their groups (i.e., hidden
until the group is opened), so more layers, such as more
detailed geophysics images, can be added in the future.
Overall, the Geoscience Atlas will become more
streamlined to provide easier access to the geoscience data
and information for the Province.
ACKNOWLEDGMENTS
Tamarack Geographic Technologies, of St. John’s, NL,
is thanked for the building of the new Geoscience Atlas,
with support from OCIO, the Provincial Government Infor-
mation Technology Group.
REFERENCES
Gower, C.F.
2010: Geology of the Grenville Province and adjacent
eastern Makkovik, eastern Labrador. Government of
Newfoundland and Labrador, Department of Natural
Resources, Geological Survey, Open File LAB/1575,
[Map 2010-50].
Honarvar, P., Nolan, L.W., Crisby-Whittle, L. and Morgan,
K.
2013: The Geoscience Atlas. In Current Research. Gov-
ernment of Newfoundland and Labrador, Department of
Natural Resources, Geological Survey, Report 13-1,
pages 1-3.
294