COWAN, LIEBOWITZ & LATMAN, P.C. 114 West 47th Street New ...

The New Economy, Network Effects and Market Structure
Steven S. CuellarDepartment of EconomicsSonoma State University1801 East Cotati AvenueRohnert Park CA. 94928
e-mail: [email protected]: http://www.sonoma.edu/users/c/cuellar/Home.htm
Paper presented at the NATIONAL BUSINESS AND ECONOMIC SOCIETY Conference
March 8th 2002Maui, Hawaii

1
The New Economy, Network Effects and Market Structure
by
Steven S. CuellarDepartment of EconomicsSonoma State University1801 East Cotati AvenueRohnert Park CA. 94928
e-mail: [email protected]
Abstract
Much has been said about how the �new economy� differs from the old economicparadigms. Specifically, it is argued that the antiquated economic theories and antitrust laws arenot well suited to deal with modern technology which moves at a lightning pace. One of thedefining characteristics of the new economy that distinguishes it from the old economy is theexistence of �network effects� and the corollary theory of �lock in.� For example, networkeffects and lock in were central in the Microsoft antitrust trial. This paper examines the role ofnetwork effects on the structure and behavior of markets in which strong network effects exist. The paper begins with a review of the theoretical properties of network effects including a reviewof some of the seminal work on network effects. The definition of network effects follows thatof Katz and Shapiro (1985) and refined by Liebowitz and Margolis (1990). The theoreticaltreatment of networks follows that of Katz and Shapiro (1985), Arthur (1989), David (1985),Liebowitz and Margolis (1990), Benson and Farrell (1994) and Economides (1995). Well-known historical examples of industries with strong network effects are examined including thecase of keyboards, video cassette recorders and operating system industries. Finally, theimplications for current and future industries is provided.

1 Shugart and McKenzie (1998) argue that network effects are insignificant if they existat all, while Liebowitz and Margolis (1994) argue that they are insignificant because of theirubiquity.
2 The main issue taken up by Liebowitz and Margolis is the use of the term networkeffect as opposed to network externality.
2
I Introduction
Network effects have become a topic of immense interest over the last few years and have
been referred to by a variety of names: Network externalities, network effects, consumption
externalities, economies of scale in consumption and economies of scope in consumption. All of
these terms refer to the same basic concept, a good who�s value increases as the number of
people consuming the good increases. Despite the recent interest, network effects are neither
new nor novel. Historical examples of networks include the rail road system, telephone networks
and the interstate highway system. More recent examples include, credit card networks, ATM
(automated teller machine) networks, facsimile machines, modems, the internet, and computer
software. To be sure, the existence and impact of network effects has not been without its
detractors. In fact, critics of network effects have argued that, although theoretically possible,
network effects are either so rare so as to be insignificant, something akin to a Giffen good or Big
Foot or that they are so ubiquitous that they are insignificant.1
This paper will follow the distinction between direct and indirect network effects set forth
by Katz and Shapiro (1985) as amended by Liebowitz and Margolis (1994)2. Specifically, a good
is said to exhibit direct network effects if the value of the good increases as more people
purchase the same good. The standard example is that of the telephone. Clearly there is very
little value to being the only one who owns a telephone since you cannot call anyone else.

3
However, the value of a telephone increases as more people own telephones. To illustrate this,
consider a telephone network with n people. In this case, with n people who own telephones,
there are n(n-1) potential exchanges among telephone owners (i.e., network members). With
n=3, there are 3(2)=6 possible exchanges.
(1,2), (1,3) => One can call two and three.
(2,1), (2,3) => Two can call one and three.
(3,1), (3,2) => Three can call one and two.
Each new telephone owner provides a direct benefit to all other owners by adding 2n potential
new exchanges. Thus with one new telephone owner, there are now 2(3)= 6 new exchanges for a
total of 12 total possible exchanges. The six previously existing exchanges along with the six
new exchanges created by the addition of a new member, so that now,
(1,2), (1,3), (1,4) => One can call two, three and four.
(2,1), (2,3) ,(2,4) => Two can call one, three and four.
(3,1), (3,2), (3,4) => Three can call one, two and four.
(4,1), (4,2), (4,3) => Four can call one, two, and three.
Other goods that exhibit direct network effects include the internet, fax machines, computer
operating systems, ATM networks and credit card networks.
Additionally, a good is said to exhibit indirect network effects if the value of the good
increases as more complementary goods are made available. This is often referred to as a
positive feedback loop. Similarly, the value of the complementary good increases as more
people own the primary good. A typical example of an indirect network effect is the relationship
between computer systems and software. Purchasers of computers will want to purchase the

4
system with the greatest number of complementary software programs available. Thus, the more
software programs are available for an operating system, the value the operating system is to
users. Likewise, software producers will want to write application programs for computer
operating systems with the greatest number of users. As a result, operating systems with the a lot
of users will tend to have the most applications available. For obvious reasons, Katz and Shapiro
(1985) refer to this as the hardware-software paradigm. Other goods that exhibit indirect network
effects include video or computer games and players, operating systems and software and video
players and rentals.
Katz and Shapiro (1985) also include a third category they refer to as �post purchase
services� for durable goods in which the number and availability of post purchase service for a
good increases as the number of owners of the good increases. However, for the purposes of this
paper, post purchase services can be included as a complementary good to the primary good in
question and thus be included as a indirect network effect.
Additionally, Economides and White (1994) make a further distinction between one-way
and two-way networks. Two-way networks are defined as those in which reciprocal transactions
occur among members. For example, in the telephone network mentioned above, a phone call
from consumer One to consumer Two is treated as distinct transaction from a phone call from
consumer Two to consumer One. In one-way networks, reciprocal transactions do not occur.
For example, a television network where there is no reciprocal transactions among members.
Economides and White also note that direct effects generally occur two way networks and
indirect effects generally occur one way networks. However, this is not necessarily always the
case as will be demonstrated.

5
II The Model
The model used in this paper follows that of Katz and Shapiro (1985), Farrell and Saloner
(1985) and Economides (1995). The basic model used is a simple one period model in which the
consumers decision is whether or not to purchase a good that exhibits network effects. Since the
value of the good increases as more people purchase the good, consumers will base their decision
to purchase on their expectations of how many others will purchase the good. The model
assumes that consumers expectations about the size of the network are correct. If we define �n�
as the size of the network then ne is the expected size of the network, where n is normalized such
that 0 # n #1. Assume for example, n represents the percentage of the market that belongs to the
network rather than the number of consumers. Following Economides (1995) let h(ne)=k + δf(ne)
be the network externality function where,
k -is the value of the good in the absence of any network effects.
δ -is an indicator variable which equals one if network effects exist and zero otherwise.
f(ne) -is a network effects function that measures the value the consumer places on the
good in the presence of network effects when the number of others who own the
good is ne. The network effects function is assumed to be twice continuously
differentiable where f�(ne)>0 indicates that network effects are positive and
f�(ne)<0 indicates diminishing marginal returns to network effects.
Assume that consumers, indexed by �y,� are heterogeneous and differ in their willingness
to pay for the good. Furthermore, let u(y, ne) be consumer y�s willingness to pay for one unit of
the good with a network of expected size ne so that u(y, ne) = yh(ne). Note that the multiplicative
form of the willingness to pay function differs from that of Katz and Shapiro and others which

6
use an additive form of the type u(y, ne) = y + h(ne). The multiplicative specification allows for
heterogeneity among consumers of the good in question and provides a greater level of
generality. Given a continuum of consumers types, let G(y) be the cumulative distribution
function normalized to be between [0, 1]. Define y* as the marginal consumer who faced with
price p and expected network size ne has the valuation function m(p, ne) = y*. Where y* is the
value of y that solves the consumers utility maximizing problem u(y, ne) = p. By substitution we
get the following: Since y* = m(p, ne) and p = u(y, ne), and given the consumers willingness to
pay as yh(ne) = u(y, ne) it follows that y*h(ne) = p, for the marginal consumer, where:
y* =
0 if ph(n e)
< 0
ph(n e)
otherwise
1 if ph(n e)
> 0 9If the price of the good is relatively low, inducing all consumers to purchase the good and
resulting in a large ne then marginal consumer has a very low willingness to pay and y* = 0.
Conversely, if the price of the good is relatively high so that very few purchase the good and the
marginal consumers valuation is high, then y* = 1. It follows then that all consumers with
valuations higher then y* purchase the good while those below y* abstain. Thus, the size of the
network at price p is, n = 1 - G(y*) = 1-G(m(p, ne)). The willingness to pay of the last consumer
in a network of size n with expectations ne is,
p(n, ne) = h(ne)G-1(1 - n)
which can also be interpreted as a standard inverse demand function. Katz and Shapiro (1985)
and Economides (1994) assume that in equilibrium, expectation are fulfilled or that consumers

7
Figure 1
expectation are correct so that ne = n. Note that, < 0 which implies diminishing returns toMpMn
network size and by itself results in a conventional downward sloping demand curve. However,
> 0 implies that expectations of larger networks increase a consumers willingness to pay. MpMn e
These effects are accounted for separately in that, for example, lower prices that increase the
network size are represented as movements along a demand curve while lower prices that
increase the expected size of the network are represented by shifts in the demand curve. This is
illustrated in Figure One where two demand curves are shown labeled p(n , ne1 ) and p(n, ne
2)
respectively. p(n , ne1 ) represents the demand curve for a consumer when the actual and
expected network size
is ne1. While p(n, ne
2) represents a demand curve where actual and expected network size is ne2 >
ne1. The demand curves are downward sloping illustrating the fact that a decrease in price causes
a movement along the demand curve and results in a larger network. However, an increase in the
expected size of the network, from ne1 to ne
2, shifts the demand curve from p(n , ne1 ) to p(n, ne
2)

8
Figure 2
and results in a higher willingness to pay, from p2 to p3. If we trace out the locus of equilibrium
points for networks of various sizes, we get what Economides call the fulfilled expectations
demand curve shown in Figure Two.
The fulfilled expectations demand curve can be examined for a variety of cases. Consider
first the case in which the good has no value in the absence of a network, that is when k = 0 in
the network effect function h(ne)= k + δf(ne). This would be the case for the telephone example
used earlier. The telephone has no value in the absence of others who also own telephones, since
you cannot call anyone nor can anyone call you. In this case, with a network of size zero or more
precisely an expected network of size zero, the consumer willingness to pay is zero and thus they
abstain from the market. This is shown as the origin in Figure Two. As the expected network
size increases, the consumers willingness to pay increases. This is shown as the upward sloping
portion of the inverted �U� or parabola in Figure Two and results in a upward sloping fulfilled

9
Figure 3
expectations demand curve. Note, however, that after some point the returns to being part of a
network begin to diminish. This occurs in Figure Two for networks beyond size n6, after which
the fulfilled expectations demand curve decreases. The parabolic fulfilled expectations demand
curve shown in Figure Two is drawn for the special case in which the good has no value in the
absence of a network.
For goods which have value by themselves, that is for k > 0, and whose value increases as
the network of users increases, there are different shaped fulfilled expectations demand curves.
Figure Three represents one possible shape for the fulfilled expectations demand curves when k
> 0. Note that the y-intercept in Figure Three shows the value of the good, �k�, in the absence of
any network and whose value increases as the network size increases. This could be the case for
example of a computer software such as a spreadsheet or word processor. There is a value to the
program by itself for its spreadsheet or word processing capabilities, but there is also a benefit to
having a network of others who use the same program. For example the ability to share files

10
Figure 4
with others using the same program and the ability to use your files on other computers. As a
result, computer programs may exhibit strong network effects resulting in an upward sloping
portion of the fulfilled expectations demand curve where a consumers willingness to pay
increases as the expected network size increases.
Conversely, there are a variety of goods for which network effects exert very little
influence on a consumers willingness to pay. In this case, the fulfilled expectations demand
curve might look like that shown in Figure Four, which is strictly decreasing. For example, there
are likely additional benefits to reading a book that others have read, in that you can discuss the
contents with those who have read the same book and thus increase the benefits of reading the

3 These benefits should be distinguished from so called �bandwagon effects� which arenot explicitly treated in this paper but have been treated elsewhere. See for example Leibenstein(1950).
4 Liebowitz and Margolis (1994) mockingly catalog a variety of goods for which theutility derived from the consumption of a good may benefit from increased consumption byothers.
11
Figure 5
book.3, 4 From Figure Four it is clear that network effects only exert a discernable influence on
the fulfilled expectations demand curve when there are strong network effects.
One result of the presence of strong network effects is the existence of multiple
equilibria. Consider the case in which the good in question has no value in the absence of other
users, (i.e., when k = 0). For simplicity, assume a constant marginal cost of production denoted
MC. Figure Five represents the good the fulfilled expectation demand curve for the good in
question with two different marginal cost curves. Consider first the higher marginal cost curve
labeled MC0. With a marginal cost of MC0, the equilibrium network size is zero, since the
marginal cost is greater than the willingness to pay for the good. Consider now the more
12
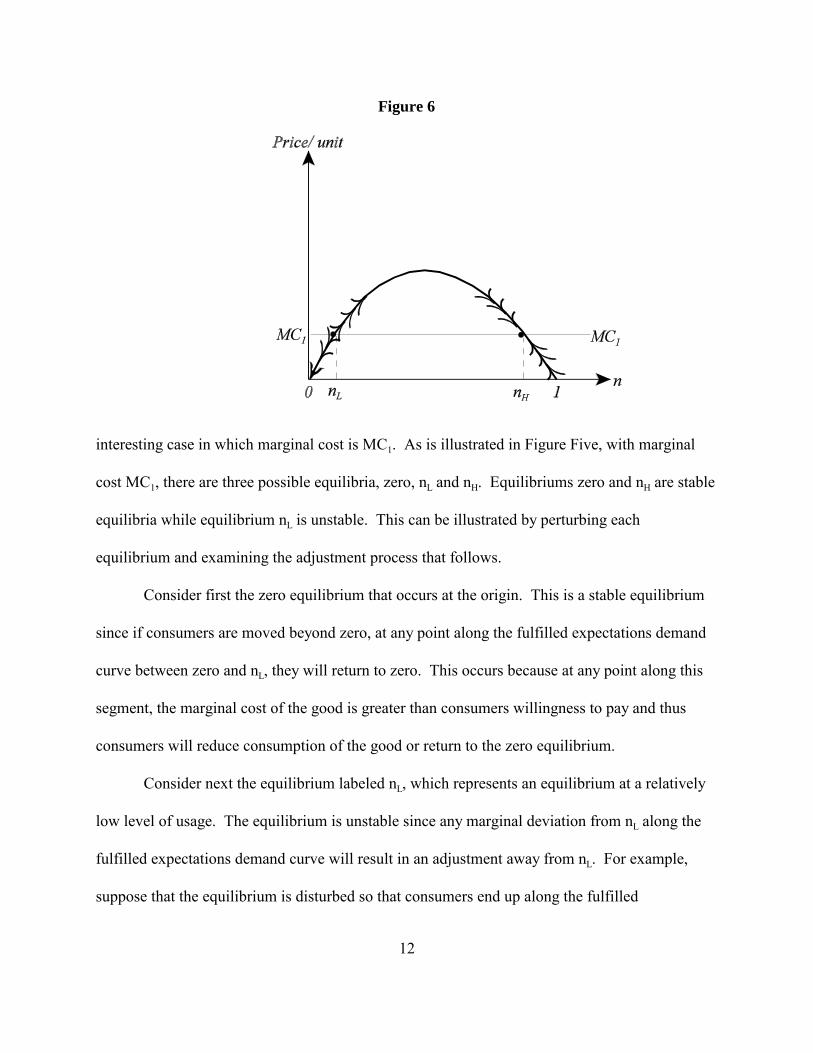
Figure 6
interesting case in which marginal cost is MC1. As is illustrated in Figure Five, with marginal
cost MC1, there are three possible equilibria, zero, nL and nH. Equilibriums zero and nH are stable
equilibria while equilibrium nL is unstable. This can be illustrated by perturbing each
equilibrium and examining the adjustment process that follows.
Consider first the zero equilibrium that occurs at the origin. This is a stable equilibrium
since if consumers are moved beyond zero, at any point along the fulfilled expectations demand
curve between zero and nL, they will return to zero. This occurs because at any point along this
segment, the marginal cost of the good is greater than consumers willingness to pay and thus
consumers will reduce consumption of the good or return to the zero equilibrium.
Consider next the equilibrium labeled nL, which represents an equilibrium at a relatively
low level of usage. The equilibrium is unstable since any marginal deviation from nL along the
fulfilled expectations demand curve will result in an adjustment away from nL. For example,
suppose that the equilibrium is disturbed so that consumers end up along the fulfilled

5 Arthur (1989) refers to the unstable equilibrium nL as non-ergodic and the stableequilibria as ergodic.
13
expectations demand curve at a point between zero and nL. This is case discussed above, and
results in consumers decreasing consumption towards zero and away form nL. Now, suppose that
the equilibrium is disturbed so that consumers end up along the fulfilled expectations demand
curve at a point between nL and nH. At any point along this segment, marginal cost is less than
the willingness to pay so consumers increase consumption again moving away from nL. Thus nL
is an unstable equilibrium since any perturbation that results in a consumers being at a point in
the neighborhood of nL will result in consumers moving away from that point.5
Consider now the equilibrium nH, which represents a relatively high market share
equilibrium. This is a stable equilibrium since any marginal deviation from nH will result in an
adjustment back to nH. For example, suppose that the equilibrium is disturbed so that consumers
end up on the fulfilled expectations demand curve at a point between nL and nH. This is the
situation discussed above where the marginal cost is less than the willingness to pay and
consumers increase consumption of the good moving back toward nH. If instead the equilibrium
is disturbed so that consumers end up at a point between nH and one, marginal cost is greater than
the consumers willingness to pay and consumers reduce consumption of the good again moving
back toward nH.
The unstable equilibrium nL plays an important role in the dynamics of market with
strong network effects. First, it illustrates the fact that markets with network effects may have
products with a significant but not dominant market share. Second, for products that reach
beyond the low equilibrium demand becomes self reinforcing and this product will eventually

6 Liebowitz and Margolis (199X) provide a definition of path dependence with varyingdegrees. David (200) disputes the definitions provided by Liebowitz and Margolis and goes onto provide both positive and negative definitions of path dependence.
14
become the market standard. Thus, the low nL is often referred to as the �critical mass�, �tipping
point� or �watershed point.� Economides (1995) defines the critical mass as, �the smallest
network size that can be sustained in equilibrium� which illustrates the nature of the first
property of the critical mass. The second and more apt definition for the purposes of this paper is
provided by Arthur (1989) who defines the critical mass as a point �above which adoption of the
technology with this share becomes self reinforcing in that it tends to increase its share, below
which it is self-negating in that it tends to lose its share.� That is, once a product reaches the
market share denoted the critical mass, consumers will increasingly choose that product because
they expect others to choose that product. The market thus �tips� in favor of that product.
However, for products that fail to reach the critical mass, consumers will choose an alternative
product because they expect others to and thus market share shrinks. At this point several other
related terms common to the literature on network effects become important: Path dependence,
lock in, and first mover advantage.
Path dependence, like much of the terminology in the network effects literature is subject
to varying definitions.6 David (2000) defines path dependence as a stochastic process who�s
evolution depends on its own history. That is, the demand for a good with strong network effects
depends on the demand decisions for that good made by consumers in the past. For the purposes
of this paper, path dependence explains the process by which demand, once it reaches a point
beyond the critical mass, is self reinforcing or directed towards the high market share
equilibrium. Path dependence is represented in Figure Six by the arrows that show consumers

7 Economides (1995).
8 As will be shown, reaching the market first does not ensure reaching the critical massare first.
15
following the path along the fulfilled expectations demand curve. To use a term often associated
with path dependence, once demand reaches a point beyond the critical mass, �history matters�
because consumers will continue to choose that product that others have chosen and that they
believe others will choose as the standard in the future. The existence of strong network effects
and path dependence result in a market process in which the product that reaches the critical
mass first derives a definite advantage in becoming the market standard. This leads us to our
next definition.
Once a product has become the standard in a market with strong network effects, the self
reinforcing nature of the market is said to �lock in� consumers to that standard. Lock in is thus
the concept that once a standard is reached, consumers resist switching to alternative goods
because there are not enough users of the alternative good. Farrell and Saloner (1986) refer to
this situation as �excess inertia.� Economides and others have referred to this as the�chicken and
the egg� paradox in which, �many consumers are not interested in purchasing the good because
the installed base is too small, and the installed base is too small because an insufficiently small
number of consumers have purchased the good.�7 Clearly in markets that exhibit strong network
effects and path dependency, reaching the critical mass first is vital to becoming the market
standard. First mover advantage refers to the idea that the good that can reach the critical mass
first has a distinct advantage over competing goods in becoming the market standard.8
Consequently, competition among alternatives to reach the critical mass will often be fierce.

9 See for example David (1985), Farrell and Saloner (1985), Katz and Shapiro (1986),and Arthur (1989) for an elaboration of this scenario.
10 Liebowitz and Margolis (2000) refer to this process as serial monopoly.
16
Although products that become the market standard have a clear advantage over rival
products, they are not immune from competition and are still subject to displacement by superior
products. Despite the fact that much of the theoretic literature on network effects allows for the
possibility of an inferior good being locked in to a market, and a superior good being locked out,
this is generally regarded as a remote theoretic construct.9 Markets that exhibit strong network
effects tend to result in a single good becoming the standard and as a result the producer
supplying the entire market results in a natural monopoly. However, as recent history has shown,
inferior standards are often displaced by superior standards. This dynamic process of
Schumpeterian �creative destruction� where one monopoly is replaced by another, is seen as a
vital source of economic growth and technological progress.10
Two of the most often cited examples of strong network effects exerting significant
market pressure are the video tape and the typewriter keyboard markets. These examples are
especially well suited for several reasons. First, they deal with goods with which most are
familiar. Second, they both illustrate different aspects of markets in which strong network effects
exist. Finally, the folklore surrounding both the video tape and keyboard markets contain some
common misperceptions associated with network effects.
III Typewriter Keyboards: Qwerty versus Dvorack
Consider first the keyboard that is currently used by typist and computer users called the
QWERTY keyboard. QWERTY refers to the first six letters on the upper left hand side to the

11 Richard Polt�s Typewriter web site.
12 Yamada quoted in Liebowitz and Margolis (1990).
17
keyboard. Although keyboards have value by themselves, it is argued that keyboards also exhibit
indirect network effects. That is, there are benefits to learning to use a keyboard whose skills are
transferable from place to place. For example using the same keyboard at home, at a friends, at
school, and at work significantly reduces the costs of acquiring keyboard skills. Moreover, if you
are looking to learn a type on a keyboard as a marketable skill, you want to lean that keyboard
that will be demanded by the most number of employers. Consequently, the market for
keyboards exhibits network effects in that keyboard users will want to use the keyboard that
others are using or that they believe others will use.
The patent for the QWERTY or Universal typewriter dates back to 1868 and was first
issued to Christopher Lathom Sholes of Wisconsin. The rights to the Sholes patent were
eventually sold to gun manufacturer E. Remington & Sons in 1873 who then went on to sell the
first mass produced typewriter in 1874 under the name �Sholes & Glidden Type Writer.� The
original Sholes & Glidden typewriter wrote only in capital letters and was eventually replaced by
the �Remington No. 2� in 1878 which typed both upper and lower case letters and has remained
the same since. Although Remington�s QWERTY keyboard eventually became the standard, it
was neither the first nor the last keyboard to enter the market. Typewriter patents date back to
the early 1700�s and at least fifty typewriters existed before the Sholes & Glidden.11, 12 Not only
were there a variety of keyboards but there were a variety of typewriters with different
mechanisms. For example, one drawback of the Sholes & Glidden was that it was a �blind�
typewriter, so called because the typist could not see what is being typed. There were however

13 Polt op. cit.
18
visible typewriters that competed in the market well before the QWERTY based Remington
became the standard. To be sure, early consumers of typewriters, which consisted mostly of
businesses, had a wide choice of typewriters from which to choose. In addition to the
competition of the market, there were typing competitions in which rival machines competed on,
among other things, the basis of speed. The QWERTY based Remington won some of these
competitions but by no means won all of them.
In addition to the non-price competition that existed in the typewriter market, there was
also competition for consumers based on price. The price of the Remington was approximately
one hundred dollars. There were however, significantly cheaper models. One example of a low
priced typewriter was the �American� which sold for five dollars and was marketed to occasional
home users. Clearly, competition in the typewriter market was fierce as rivals fought for a
critical mass of users. Out of this competition came the Remington and its QWERTY based
keyboard. In fact, by 1920 the QWERTY based machines were the industry standard and have
remained so ever since.13 Although the Remington, which became the eventual standard, was not
the first typewriter, it was the first to gain enough of a consumer base for demand to become self
reinforcing. Recall that first mover advantage does not imply that the first to market gains an
advantage but rather that the first to gain a critical mass of users gains an advantage.
The fact the QWERTY keyboard continues to this day illustrates the ability of network
effects to lock in products once they have gained dominance. Once a standard has been adopted,
the theory of lock in argues that competing keyboards will have trouble acquiring a base of users
because consumers will be reluctant to switch to a new keyboard that no one else is using or that

14 David (1985) has been a proponent of this view.
15 Liebowitz and Margolis (1990) refute the veracity of the claims to the Dvorak�ssuperiority.
16 See Cuellar (2001) for a exposition on the theory of lock in and its relevance in theQWERTY versus Dvorak case.
19
they expect no one else to use. That is consumers are locked into the existing standard. The
QWERTY example is especially important because there has been a cottage industry claiming
that network effects have so effectively locked in the QWERTY keyboard that superior
keyboards have been prevented from gaining a foothold in the market.14 The most celebrated
example of a superior keyboard that was kept out of the market is the Dvorak Simplified
Keyboard named after its inventor August Dvorak. Unfortunately, most the claims about the
Dvorak�s superiority were made by Dvorak himself and there has been very little independent
empirical evidence to support his claims.15
Although most of the claims of the superiority of the Dvorak over the QWERTY
keyboard may have been over stated, there were studies in which the Dvorak was considered at
least as efficient as the QWERTY. Herein lies the essential point to the theory of lock in. Goods
that exhibit strong network effects benefit from being the standard, but they are not immune from
competition. Goods that are locked in by network effects will be replaced by superior goods as
long as the benefits to switching are greater than costs of the transition. That is, even if the
Dvorak is as efficient or marginally more efficient than the QWERTY, these benefits must
outweigh the costs of switching in order to replace the existing standard. The QWERTY versus
Dvorak example serves as an illustration of the value that consumers place on standardization
and the reluctance of consumers to incur the costs of switching unless there are clear benefits.16

17 According to Ampex web site, �the Ampex VRX-1000 (later renamed the Mark IV)videotape recorder is introduced on March 14, 1956, at the National Association of Radio andTelevision Broadcasters in Chicago.�
20
The example considered next illustrates a case in which consumers switch to a new standard
when a superior alternative exists.
IV Home Video Cassette Recorders: VHS versus Beta
The video cassette industry is another example of strong network effects exerting
significant influence over the industry. Despite the predominance of the digital video disk
(DVD), most people are familiar with its precursor, the video cassette and video cassette
recorder. Like the QWERTY keyboard, video cassette recorders have value in and of
themselves. In particular, people value the ability of taping programs and events, and watching
them at a later time. VCR�s however, also exhibit indirect network effects. In particular, the
value of a VCR increases as more complementary pre-recorded video�s and video rental outlets
become available. Likewise the value of owning a video rental outlet increases as more people
own VCR�s. Consumers will not want to purchase a format for which there are few pre-recorded
movies and or there are few outlets renting pre-recording videos. As a result, potential buyers of
VCR�s will want to purchase that format which they believe others will purchase and will
become the market standard.
The history of the video cassette recorder dates back to 1956 when it was first developed
by Ampex, one of California�s early electronics companies, for professional use in the broadcast
industry.17 However, it was not until the mid seventies that competition for home use began in

18 Much of the information in this section is taken from Lardner (1987) and Liebowitzand Margolis (1994b).
19 Although Sony and JVC eventually became the main competitors, there were othermanufacturers and types in the market. Specifically Matsushita played a significant role in theearly competition of the VCR market.
21
earnest by Japanese manufacturers, namely Sony and JVC (Victor Company of Japan).18, 19
Although Sony was the first to successfully market a home use machine, the Betamax, in May of
1975, JVC had been working on an alternative machine since 1971 called the Video Home
System (VHS). At the time, Sony�s Betamax had a better picture quality, smaller machine and
smaller tape than JVC�s VHS system. The main benefit of JVC�s VHS was that it had a longer
recording time, two hours to Sony�s one hour. The difference in recording times represented
different marketing philosophies of Sony and JVC and would prove to be a decisive factor for
consumers. Sony believed that a smaller cassette would allow for greater portability, while JVC
believed that longer recording times would appeal to consumers who wanted to record whole
movies on a single tape. Unfortunately, to achieve a greater recording time, JVC�s VHS system
had to sacrifice cassette size and picture quality.
Both Sony and JVC knew of the potential benefits of becoming the market leader and so
competition between the two was heated. By 1976, JVC had improved the picture quality of the
VHS system equal to that of Sony�s Betamax. During the same time, Sony had been working on
increasing the recording time of its Betamax to two hours, the same as the VHS system. In
response to Sony�s two hour Betamax, JVC began work on a four hour machine utilizing the
same technology that Sony used to extend the Betamax�s recording time. With picture quality
essentially the same between Beta and VHS, VHS continued to hold a decided advantage in

20 Lardner (1987).
22
recording time and as a result began to gain a decided advantage in the market where consumers
chose recording time over cassette size, Sony�s main attribute. When Betamax finally reached
four hours, VHS reached eight hours, but by then VHS had reached the critical mass of
consumers necessary to become the de facto standard with VHS�s market share growing and
Beta�s market share falling.
Not only was JVC correct in anticipating viewing time as a deciding factor, they and
other VHS producers , were also much more aggressive in reducing cost. In 1977, when the
Betamax was selling for $1,300, VHS machines were selling for less than $1,000. When the
price of Betamax machines eventually came down, it was too little too late, VHS was already
viewed as the standard in home video cassette recording. As liebowitz and Margolis state,
The market referendum on playing time versus tape compactness was decisive and
immediate. Not just in the United States, but in Europe and Japan as well. By mid 1979
VHS was outselling beta by more than 2 to 1 in the US. By 1983 Beta�s world share was
down to 12 percent. By 1984 every VCR manufacturer except Sony had adopted VHS.
This occurred in a market where in 1977 Betamax had a �commanding lead� over VHS in the
United States.20 But this was early in the market for VCR�s when consumer interest was at its
infancy. It appears that this early lead led to a bit of hubris on the part of Sony in the marketing
of its Betamax machines. Sony was not responsive to consumer demand in terms of recording
time and was not responsive to consumer demand in terms price. As the market expanded and
competition between formats heated, consumers chose the standard that best fit their desires.
The VCR market, with VHS as the standard, provides another example of the effect of

21 DVD was developed by a collaboration between Phillips and Sony, and introduced inthe US market in 1997.
22 As the name implies, the Apple II was preceded by the Apple I, which was used mostlyby hobbyist. The Apple II was the first made accessible to the general public.
23
lock in where strong network effects exist. Because consumers value uniformity, compatibility
and the availability of complementary products, the VHS format will be preferred to equally
efficient formats. But standards are not immune from competition. Unlike the QWERTY
keyboard that is still the standard today after nearly two hundred years, the VHS format was
eventually displaced as the dominant format for viewing pre-recorded movies. Digital video
disks (DVD), which offer a vastly superior picture quality and are more compact than VHS
cassettes, have displaced VHS as the dominant format for viewing pre-recorded movies although
the war over a dominant digital recording format is still being waged.21
V Personal Computer Operating Systems: IBM-PC versus Apple-Macintosh
Although the main participants in the battle for dominance in the personal computer
market were IBM and Apple computers, there were entrants before these. The first entrant into
the personal computer market was Micro Instrumentation and Telemetry Systems, Inc (MITS)
Altair 8800 introduced in 1975. The Altair was sold as a kit and meant primarily for hobbyist
who could assemble their own computers. A year later in 1976, Steve Jobs and Steve Wozniak
sold another kit meant for hobbyist the Apple I. The first serious entrant into the market for
personal computers occurred when Apple computers introduced the fully assembled Apple II in
June of 1977 for a price of approximately $1,300.22 However, it was not until 1978 that personal
computers went from hobbyist toy to actual business use with the introduction of the first
spreadsheet program VisiCalc and other software programs such as the word processing program

24
WordStar and the data base program Vulcan in 1979. The complementarity between hardware
and software resulted in drastically increased sales beginning in 1978.
In 1980, Commodore introduced the VIC-20 which at $299 went on to become the first
personal computer to sell more than one million units. There were still, however, dozens of
small computer manufacturers each running their own operating systems and software programs
incompatible with other systems. IBM during this time was developing its own personal
computer while simultaneously providing software developers and peripheral manufactures with
prototypes and the architectural structure of their systems. IBM recognized the complementarity
among hardware, software and peripherals such as printers and monitors and wanted to ensure
that both complementary software and hardware were available when the IBM-PC hit the market
on August 12 1981. The entry of IBM into the personal computer market gave the market
legitimacy and helped move the personal computer beyond that of the hobbyist. Another
significant event in 1981 was Microsoft�s agreement with IBM to provide an operating system to
the IBM-PC on a non-exclusive basis. That is, Microsoft could sell its operating system MS-
DOS to other personal computer manufactures. This would have a significant impact on the
availability of IBM clones and the expansion of the personal computer market.
As with the early VCR and typewriter markets, the early years of the personal computer
market were fiercely competitive. In 1982, Compaq introduced the first IBM clone, and in 1983
Apple computers introduced the Lisa which used a graphical user interface �borrowed� from
Xerox. Although the Lisa was a flop at $10,000, it paved the way for the Macintosh in 1984
which also used the graphical user interface and sold at a more reasonable $2,500. The
introduction of the Macintosh created a decisive divergence in the personal computer market

23 Much of this myth was propagated by Apple itself who compared IBM�s marketdominance over the �superior� Apple systems to that of QWERTY�s dominance over the�superior� Dvorak keyboard.
24 Liebowitz and Margolis (1999), pg. 127-128.
25
with two main incompatible and very different systems: The IBM-PC with its DOS based
systems and Apple�s Macintosh with its user friendly mouse and graphical user interface.
It is here at this divergence that reality and myth become obscured. It is often alleged that
Apple with its more user friendly machines were superior to the IBM-DOS based machines and
that the IBM-PC�s eventual dominance is yet another example of market failure.23 However,
although Apple�s machines were more user friendly, IBM-DOS based machines did have their
attractions. First, the IBM-DOS based machines were cheaper. Because IBM allowed its
systems to be cloned, competition among IBM and the clones reduced the price of IBM based
machines. Second, the IBM-DOS based machines which used command lines were much faster
than Apple�s graphical user interface based machines which were slowed by the extensive
graphics. Third, although Apple�s graphical user interface based machines were easier to use and
allowed users to learn how to use more programs, many business users used personal computers
for only a few purposes. For example word processing and spread sheet uses. Finally, IBM-
DOS based machines had more programs available them Apple�s. Recall that IBM strategically
sought to ensure a wide variety of program available. Also, because DOS was a simpler
operating system then Apple�s operating system, it was easier to write programs for DOS than for
Apple.24
The eventual dominance of IBM-PC based machines was a conscious decision by utility
maximizing consumers who weighed the costs and benefits of the respective systems and chose

26
that which best satisfied their needs. As a result, although Apple entered the market first, IBM-
DOS based machines reached a critical mass of users and ended up being the market standard.
As it turns out, by 1985 the difference between IBM-PC�s and Apple became less divergent when
IBM-PC�s and clones began running Microsoft�s Windows which also used the more user
friendly mouse and graphical user interface. Microsoft and IBM again acted strategically by
making Windows backwards compatible. That is, Windows would still run DOS based programs,
which significantly reduced the cost of switching to Windows. Apple systems were not always
compatible with next generation systems which again raised the cost of upgrading to newer
versions.
To this point I have discussed the early development and competition in the personal
computer market and have only alluded to the role of network effects. A more complete analysis
of network effects is examined next.
Personal computer operating systems provide one of the best examples of the power of
both direct and indirect network effects. It is argued that operating systems exhibit a direct
network externality in that as more and more people use a single operating system, consumers
benefit from the uniformity and compatibility that exists with other users. IBM�s entry into the
personal computer market gave credibility to the personal computer and provided a signal to
potential consumers that investment in a computer was more than a passing fad. Prior to IBM�s
entry, there were dozens of small computer manufacturers producing incompatible systems that
may or may not be around in a few years. The early personal computers, both IBM and Apple
were not very easy to use and users benefitted from the increased network of knowledge that
those using the same system possess. Consumers also benefit from the compatibility that results

27
from belonging to a network of users with same system. For example, users benefit from being
able to share files and from the portability of taking files on a floppy disk to and from home, the
office, school or a friends. For those deciding on which system to purchase, many potential users
preferred a system for which a large network of users exists.
Operating systems also exhibit indirect network effects in that users benefit from the
existence of a large number of complementary products such as software and hardware
components. Again IBM recognized this and made sure that a large number of software and
peripheral hardware components were made available for its systems prior to its introduction. In
both price and non-price competition, the IBM/Microsoft/Intel based PC was more competitive
than Apple�s systems. As noted above, IBM�s were cheaper than Apple machines. With respect
to complementary hardware components there was a thriving market for both IBM produced and
IBM compatible peripheral components. Apple on the other hand, maintained strict proprietary
control over peripherals which resulted in fewer choices and higher prices. Once consumers
made clear their choice of IBM based machines over Apple�s, the self reinforcing nature of
demand resulting from network effects �tips� the market toward the IBM/Microsoft/Intel system
and resulted in the IBM/Microsoft/Intel system becoming the clear market leader in personal
computers and Microsoft�s MS-DOS became the dominant operating system.
Although the IBM based machines became the dominant system, because the IBM
allowed its systems to be cloned, IBM�s share of the PC began to diminish almost from the onset.
Compaq, Dell, Gateway, Hewlett Packard and generic clones all surpassed IBM in PC market
share. However, all these system�s ran Microsoft�s MS-DOS, which resulted in Microsoft
becoming the dominant force in personal computer market. Microsoft�s lock on the operating

25 The applications barrier to entry is also central to the current antitrust trial in that it isalleged that Microsoft�s engaged in illegal activity in order to maintain the applications barrier toentry.
28
systems market and it�s marketing practices drew sharp criticism early and often and eventually
culminated in the most recent anti trust trial. Central to the anti trust trial was the existence of
network effects as a barrier to entry into the operating systems market and the maintenance of
Microsoft�s monopoly position.
It is argued that the existence of a direct network effects poses a barrier to entry to new
operating systems because consumers will be reluctant to embrace a new operating system that
lacks widespread use and therefore the uniformity and compatibility with others that consumers
desire.
It is also argued that the indirect network effects exhibited by operating systems pose a
significant barrier to entry into the operating systems market. The indirect network effect creates
what is referred to as the �applications barriers to entry.� The applications barriers to entry is
used to explain why there is very little competition for Microsoft�s Windows and why it is
unlikely that competing operating systems will be developed in the near future.25 The logic
behind the applications barrier to entry is as follows: Because of the high fixed costs of
developing an operating system, developers of new operating system�s need to reach a large
number of consumers to recoup costs. Additionally, consumers prefer to purchase an operating
system for which there are a large number of applications available to run on the operating
system. However, because re-writing software to a variety of operating systems is expensive,
software vendors will prefer to write applications for operating systems that are used by a large
number of people. Since there is no guarantee that a new operating system will be successful,

29
software vendors will be reluctant to write software that will run on a new operating system.
Consequently, because few applications will be available for a new operating system, demand for
a new operating system will be low. Similarly, operating system developers will be reluctant to
invest in the development and marketing of new operating systems for which there will be little
demand. In short, the applications barrier represents a �vicious circle� in which an operating
system will only be successful if there are a large number of applications available. While a
large number of applications will only be written for an operating system that is used by a large
number of people. However, a large number of people will use an operating system only if there
are a lot of applications available for it to run and so on ad infinitum. The applications barrier to
entry �locks in� consumers to the dominant system and �locks out� competitors from entering the
operating system market.
The applications barrier to entry is illustrated by the dearth of applications and the
reluctance of a large number of independent and varied software applications vendors to write for
operating systems other than Windows. Consider for example, Apple�s Mac OS, the second
largest personal computer operating system on the market. Although Apple�s Mac OS has a
loyal, albeit small, user base it does not have the same amount of software applications available
as Microsoft�s Windows. The applications barrier becomes even greater for smaller operating
systems such as Linux and greater yet for a new operating system. Although the vicious circle of
the applications barrier to entry is a significant barrier, it is not unbreakable. Clearly, Microsoft�s
Windows sits at the dominant equilibrium position (nH in Figure Five) in the operating systems
market, while Apple computers, although it still exists, remains at the unstable low equilibrium
(nL in Figure Five). In fact, Apple has had to restructure more than once and was actually helped

26 Liebowitz and Margolis op cite refer to this as �serial monopoly.�
30
out by Microsoft.
VI Conclusion
Markets characterized by network effects often result in a single standard or product
dominating the industry. However, as this paper has shown, this does not mean that there will be
no competitive pressure exerted on the dominant product. Nor does it mean that the dominate
product will dominate indefinitely. George Stigler assures us that no monopoly has ever lasted
over one hundred years, so that monopoly is essentially a short term phenomena. While Joseph
Shumpeter tells us of the benefits of �creative destruction� where one monopoly replaces another
with a superior technology.26 However, despite Stigler and Shumpeter, the QWERTY example
shows us that the long run can be quite long. The QWERTY example clearly shows how a
product that exhibits network effects will be replaced only when the benefits of changing
outweigh the costs. Although the Dvorak keyboard may be as efficient as the QWERTY, it
appears that claims to it�s superiority are questionable at the best. As a result, the costs of
switching do not outweigh any alleged benefits and QWERTY remains the standard today, over a
hundred years after it�s introduction. VHS�s displacement by DVD�s illustrates how superior
technologies can overcome the barriers posed by network effects, while MS-DOS’s eventual
transformation into the Macintosh like Windows illustrates how competition at the margin can
exert pressure on the dominant product to innovate.

31
Works Cited
Armentano, Dominick T. Antitrust and Monopoly: Anatomy of a Policy Failure, John Wiley &Sons, New York, New York, 1982.
Arthur, W. Brian. �Competing Technologies, Increasing Returns, and Lock-In By HistoricalEvents.� The Economic Journal, 99(March) (1989).
Besen, Stanley M., and Farrell, Joseph. �Choosing How to Compete: Strategies and Tactics inStandardization.� Journal of Economic Perspectives, 8(2) (1994): .
Church, Jeffrey, and Gandal, Neil. �Network Effects, Software Provision, and Standardization.�The Journal of Industrial Economics, XL(1) (1992).
Cuellar, Steven S. �Is Microsoft a Monopoly?� , Working Paper(2000).
Cuellar, Steven S. �The Fable of the Keys Revisited: A Look at the Margin.� , WorkingPaper(2001).
David, Paul A. �Clio and the Economics of QWERTY.� American Economic Review, 75(May)(1985): 332-37.
David, Paul A. (1986). �Understanding the Economics of QWERTY.� , W. N. Parker, ed., BasilBlackwell, New York.
David, Paul A. �Path Dependence, its Critics and the Quest for 'Historical Accidents'.�Unpublished Manuscript(2000).
Economides, Nicholas, and Salop, Steven C. �Competition and Integration AmongComplements, and Network Market Structure.� The Journal of Industrial Economics,XL(1) (1992).
Economides, Nicholas, and White, Lawrence J. (1994). �One-Way Networks, Two-WayNetworks, Compatibility, and Public Policy.� Unpublished Manuscript.
Economides, Nicholas, and Himmelberg, Charles. �Critical Mass and Network Size withApplication to the US FAX Market.� Unpublished Manuscript(1995): .
Economides, Nicholas. �The Economics of Networks.� International Journal of IndustrialOrganization, 14(2) (1996).
Farrell, Joseph, and Saloner, Garth. �Standardization, Compatibility and Innovation.� RandJournal, 16(Spring) (1985): 70-83.

32
Farrell, Joseph, and Saloner, Garth. �Installed Base and Compatibility: Innovation, Product Pre-announcements, and Predation.� American Economic Review, 76(5) (1986).
Farrell, Joseph, and Saloner, Garth. �Converters, Compatibility and the Control of Interfaces.�The Journal of Industrial Economics, XL(1) (1992).
International, Jones. �Personal Computers: History and Development.� , JonesTelecommunications & Multimedia Encyclopedia.
Katz, Michael, and Shapiro, Carl. �Network Externalities, Competition, and Compatibility.�American Economic Review, 75(3) (1985).
Katz, Michael L., and Shapiro, Carl. �Technology Adoption in the Presence of NetworkExternalities.� Journal of Political Economy, 94(4) (1986).
Katz, Michael L., and Shapiro, Carl. �Product Introduction with Network Externalities.� TheJournal of Industrial Organization, XL(1) (1992).
Katz, Michael L., and Shapiro, Carl. �Systems Competition and Network Effects.� Journal ofEconomic Perspectives, 8(2) (1994).
Knight, Dan. �Personal Computer History.� Low End PC,http://lowendpc.com/history/index.shtml(2001).
Lardner, James. Fast Forward; Hollywood, The Japanese, and the Onslaught of the VCR, W.W.Norton & Company, New York, 1987.
Leibenstein, H. �Bandwagon, Snob, and Veblen Effects in the Theory of Consumer's Demand.�The Quarterly Journal of Economics, 64(2) (1950).
Liebowitz, Stan J., and Margolis, Stephen E. �The Fable of the Keys.� Journal of Law &Economics, XXXIII(April) (1990): 1-26.
Liebowitz, Stanley J., and Margolis, Stephan E. �Path Dependence, Lock-In, and History.�Journal of Law, Economics, and Organization, 11(1995).
Liebowitz, Stan J., and Margolis, Stephen E. Winners, Losers & Microsoft: Competition andAntitrust in High Technology, The Independent Institute, Oakland, California, 1999.
Tirole, Jean. The Theory of Industrial Organization, MIT Press, Cambridge, 1988.