The Neuromuscular and Mechanical Control of the …clok.uclan.ac.uk/12860/2/Lindley Steven Final...
293
The Neuromuscular and Mechanical Control of the Knee Joint in Patellofemoral Pain Sufferers By Steven Lindley A thesis submitted in partial fulfilment of the requirements for the degree of Doctor of Philosophy at The University of Central Lancashire University of Central Lancashire September 2015
Transcript of The Neuromuscular and Mechanical Control of the …clok.uclan.ac.uk/12860/2/Lindley Steven Final...

The Neuromuscular and Mechanical Control of the
Knee Joint in Patellofemoral Pain Sufferers
By
Steven Lindley
A thesis submitted in partial fulfilment of the requirements for the
degree of Doctor of Philosophy at
The University of Central Lancashire
University of Central Lancashire
September 2015

i
Declaration
I declare that while registered as a candidate for the research degree, I have not been a registered
candidate or enrolled student for another award of the University or other academic or
professional institution
I declare that no material contained in the thesis has been used in any other submission for an
academic award and is solely my own work
Signature of Candidate:
Type of Award: Doctor of Philosophy
School: School of Health Sciences
Steven
Stamp

ii
Acknowledgements
I will not be able to fully demonstrate my utter appreciation in acknowledging all the
individuals who provided me with the unyielding support throughout this work. However,
there are some individuals who cannot go unmentioned for without their inspirational,
relentless and sometimes well-needed tough love this work would have not been possible. Supervisors
Jim and James have from the first day I met them, fresh faced and boyish, inspired me with
their contagious enthusiasm and love for their work, which is somehow always a combination
of jovial wit and world-leading clinical research. They have both challenged and supported
me throughout, not so fresh faced and boyish anymore, which I can only repay by reciting their
mantras; Jim - “The knee is not a hinge, it’s 18 more times complicated than that you know”
and James – “I don’t care what these squiggly lines show, what do I tell a patient?”. I consider
Jim and James not only to be great mentors and future colleagues but ultimately good friends. Ms Devi Bheemappa
There are not many individuals you can say have so greatly influenced your path, but my friend
Devi is most certainly one of them. Without Devi’s philanthropic and unselfish nature this work
would have simply not been possible; not only has she believed in me throughout she has been
a source of great admiration for her attitude, tenacity and belief in others. Devi, thank you! Neuromuscular Research Centre
Professor’s Carlo De Luca, Serge Roy, Paola Contessa and Sam Chang have all been greatly
influential prior to, during and no doubt in the future of this work. Either through my consistent
referral to the systemic work of Muscles Alive, their ceaseless publications or generous
communications they have all offered unique and inspiring support. This coupled with the
creation and ever evolving dEMG technology has made this work a possibility. Family and Friends
It’s difficult to express the unfaltering support and love I have received from my family and
friends who have been there for me during the moments of utter clarity and elation but also
during the moments of disbelief and despair. Even though they may have not understood, being
remotely interested or had their own concerns each one of them in their own unique and
unselfish way pushed and dragged me through the past 3 years for which I can never forget and
I am immensely proud to call you my family and friends. Dad, Mum, Zoe and Nick, thank you!
Ambreen, Hazel, Jessie, Karen, Katie, Rob and Matt, thank you!

iii
Abstract
Background
Patellofemoral pain (PFP) is a condition that has been described as “the Loch Ness monster of
the knee” and the “black hole of orthopaedics” due to its indefinable and expansive nature
when addressing the aetiology, management and treatment. Although significant and clinically
important changes have been observed with the joint biomechanics, psychosocial factors, brain
activity and neuromuscular activity a lack of understanding of PFP still remains. The overall
aim of the study was to provide a unique and multifaceted investigation into the motor unit
control, biomechanical, neuromuscular and psychosocial factors in understanding the
movement control of PFP subjects and the response to a common clinical intervention.
Method
Non-symptomatic (n=13) and symptomatic subjects (n=13) performed a single limb isometric
squat in two conditions, no tape and with a medial glide tape application. Motor unit data from
the Vastus Medialis (VM) and Vastus Lateralis (VL) was recorded using sEMG
Decomposition. Muscle activity of the Gastrocnemius (GAS), Rectus Femoris (RF), Biceps
Femoris (BF) and Gluteus Medius (GMed) were collected using sEMG. Kinematic and kinetic
data from the lower limb were recorded. All systems were synchronised for simultaneous data
collection. Measures of conscious motor processing were made using the Movement Specific
Reinvestment Scale and pain levels recorded using the Numerical Rating Scale.
Results
Grouped Tape Response: The mean motor unit firing exhibited an increase in the VM firing
rate and a decrease in the VL firing rate within the tape condition, across both subject groups,
suggesting a modification in the load bias across the Vasti muscles. The common drive, a
physiological phenomenon describing common fluctuations in the motor unit firings and
consequently a measure of the nervous systems signals to control pools of motor units,
increased in the VM and decreased for the VL in response to the tape condition in symptomatic
subjects showing that the tape may be providing enhanced feedback to the nervous system that
responded by modifying the ‘control’ to the motor units. There were no changes however in
the non-symptomatic subject group, perhaps suggesting their motor units were already
controlled efficiently. Motor unit recruitment analyses, through regression analysis of the
motor unit firing rate and knee joint moment, showed the VM motor units in the non-
symptomatic subjects were recruitment at a higher firing rate in the tape condition but
interestingly no change in the VL and no change in the symptomatic subjects. Both non-

iv
symptomatic and symptomatic subjects demonstrated significant reductions in transverse plane
knee joint range of moment, illustrating a more controlled rotational knee joint after the
application of tape. There were no significant changes found in the coronal or sagittal joint
mechanics. Symptomatic subjects demonstrated a propensity to consciously control their
movements, suggestively disrupting automatic motor control tasks. Symptomatic subjects
presented with pain scores of 4.2/10 on the numerical rating scale.
Individual Tape Response: Exploration of individuals’ response to tape, opposed to pooling
data and treating as homogenous groups, exhibited a non-uniform response with variable
increases, decreases and no changes across the different measurements taken. The exploration
of the data with this method is in line with common clinical presentation of PFP subjects and
presents rationale for new ways to view the data as to not mask the true physiological
behaviours.
Comparison of groups: Motor unit recruitment analyses comparing the subject groups
demonstrated that symptomatic subjects had a significantly different motor unit recruitment
strategy for the Vasti muscles, where the larger motor units were firing faster compared to the
non-symptomatics larger motor units in both VM and VL for the same level of force.
Symptomatic subjects demonstrated a lower common drive to the VM and higher common
drive in the VL compared to non-symptomatic subjects, which after the application of tape
became the same level as the non-symptomatics. Symptomatic subjects also exhibited
significantly lower muscle activity in the GAS, BF, RF and GMed, thus suggestively increasing
the muscle activity bias to the Vasti muscles. No changes were seen in the joint biomechanics
or mean motor unit firing rate between the groups.
Discussion
These findings suggest that the nervous system offers a portfolio of solutions to control and
distribute force, which can be manipulated through a common taping intervention. The results
show that the motor unit firing rate in the VM increases and decreases in the VL, coupled with
altered motor unit recruitment strategies thus inferring that there may be a re-distribution of
force across the Vasti with the application of tape. This is interestingly complimented with an
increase of common drive in the VM and decrease in the VL between subject groups. The
presence and then change of common drive within the Vasti so that the motor units are firing
in unison, more so with tape, and providing a tantalising prospect that the VM muscle is acting
more efficiently and controlled with tape. The novel findings of the neuromuscular system and
its modification were alongside the increase in torsional joint control. However, it is evident
that the motor unit firing rate, common drive and motor unit recruitment present variable

v
responses amongst individuals, offering different solutions to achieve the same goal; increasing
the force and its control within the muscle. The underlying mechanism for the observed
findings are unable to be expressed definitively, however it can be deduced that the application
of tape presents proprioceptive feedback to the muscle that alters the motor unit pool;
consequently adjusting the force and its control within and across muscles leading to an
increase in knee stability.
Conclusion
The key implications from this work is that the application of tape can offer clinically
meaningful changes to the sensory-motor control system, through the manipulation and
alteration of the motor unit pool, suggestively from an enhanced proprioceptive feedback
mechanism. However, researchers and clinicians should consider the individualistic responses
and the potential to mask true physiological findings by assuming homogeneity within patient
populations with data analyses and clinical decision processes respectively. This work offers
unique and novel insights into both the behaviour of patients with Patellofemoral Pain and also
the effects of a taping intervention, thus providing additional clinical understanding and also
tantalizing opportunities for future work exploring musculoskeletal or neurological disorders
and insight into the sensory-motor control strategies.

vi
Contents
Declaration................................................................................................................................. i
Acknowledgements .................................................................................................................. ii
Abstract ................................................................................................................................... iii
Contents ................................................................................................................................... vi
List of Figures .......................................................................................................................... ix
List of Tables ......................................................................................................................... xiv
Glossary of Terminology and Definitions .......................................................................... xvii
Glossary of Abbreviations .................................................................................................... xix
1. Introduction ...................................................................................................................... 1
2. Literature Review ............................................................................................................. 4
2.1 Patellofemoral Pain Aetiology .................................................................................... 4
2.2 Neuromuscular Involvement ....................................................................................... 8
2.3 Pathomechanics ......................................................................................................... 22
2.4 Psychosocial Involvement ......................................................................................... 28
2.5 Therapeutic Interventions .......................................................................................... 31
2.6 Somatosensory Input ................................................................................................. 33
2.7 Summary ................................................................................................................... 35
2.8 Study Aims and Objectives ....................................................................................... 37
3. General Methods............................................................................................................. 39
3.1 Introduction ............................................................................................................... 39
3.2 Equipment Used ........................................................................................................ 39
3.3 Sampling Frequencies ............................................................................................... 42
3.4 EMG Data Fidelity .................................................................................................... 44
3.5 Kinematics and Kinetics Setup ................................................................................. 51
3.6 dEMG Setup .............................................................................................................. 59
3.7 Integration and Synchronisation................................................................................ 60
4. Data Processing Methods ............................................................................................... 63
4.1 Introduction ............................................................................................................... 63
4.2 Decomposition Algorithm ......................................................................................... 64
4.3 Decomposition Accuracy .......................................................................................... 66
4.4 Mean Firing Rate Processing .................................................................................... 70
4.5 Cross Correlation Processing .................................................................................... 75

vii
4.6 Recruitment Threshold Processing............................................................................ 82
4.7 Surface EMG Processing .......................................................................................... 87
4.8 Kinematic and Kinetic Processing Methods ............................................................. 91
4.9 Taping Intervention ................................................................................................... 95
5. Development of Methods................................................................................................ 97
5.1 Introduction ............................................................................................................... 97
5.2 Pilot Study 1 – Vastus Medialis Longus and Vastus Medialis Obliquus: What are the
Functional Differences? ....................................................................................................... 98
5.3 Pilot Study 2 - Develop a stability challenging and functional relevant task ......... 103
5.4 Pilot Study 3 –Signal Fidelity for Surface EMG Decomposition ........................... 109
5.5 Pilot Study 4 – Open and Closed Chain Activities: MU Characteristics ................ 115
5.6 Summary of Findings .............................................................................................. 120
6. Method - Non-Symptomatic Subjects ......................................................................... 121
6.1 Introduction ............................................................................................................. 121
6.2 Subjects ................................................................................................................... 121
6.3 Ethical Approval ..................................................................................................... 121
6.4 Recruitment Criteria ................................................................................................ 121
6.5 Data Collection Procedures ..................................................................................... 122
7. Results – Non-Symptomatic Subjects ......................................................................... 124
7.1 Overview ................................................................................................................. 124
7.2 Knee Joint Biomechanics ........................................................................................ 124
7.3 Surface EMG ........................................................................................................... 130
7.4 Mean Firing Rate ..................................................................................................... 132
7.5 Common Drive ........................................................................................................ 134
7.6 Recruitment Threshold ............................................................................................ 137
7.7 Recruitment Operating Point ................................................................................... 142
7.8 Traffic Light Results – Non-Symptomatic Subjects ............................................... 144
7.9 Results Summary – Non-Symptomatic Subjects .................................................... 146
8. Method - Symptomatic Subjects ................................................................................. 149
8.1 Introduction ............................................................................................................. 149
8.2 Symptomatic Subjects ............................................................................................. 149
8.3 Ethical Approval ..................................................................................................... 149
8.4 Recruitment Criteria ................................................................................................ 150
8.5 Data Collection ........................................................................................................ 151

viii
9. Results – Symptomatic Subjects .................................................................................. 152
9.1 Overview ................................................................................................................. 152
9.2 Knee Joint Biomechanics ........................................................................................ 152
9.3 Surface EMG ........................................................................................................... 158
9.4 Mean Firing Rate ..................................................................................................... 160
9.5 Common Drive ........................................................................................................ 163
9.6 Recruitment Threshold ............................................................................................ 166
9.7 Recruitment Operating Point ................................................................................... 169
9.8 Movement Specific Reinvestment Scale ................................................................. 172
9.9 Numerical Rating Scale ........................................................................................... 173
9.10 Traffic Light Results – Symptomatic Subjects ....................................................... 174
9.11 Results Summary – Symptomatic Subjects ............................................................. 176
9.12 Comparison of Non-symptomatic and Symptomatic Subjects ............................... 180
10. Discussion................................................................................................................... 189
10.1 Biomechanical ......................................................................................................... 189
10.2 Psychosocial ............................................................................................................ 193
10.3 Neuromuscular ........................................................................................................ 195
10.4 Neuromuscular, Biomechanical and Clinical Relationship..................................... 217
11. Conclusions ................................................................................................................ 221
11.1 Summary ................................................................................................................. 221
11.2 Clinical Contributions ............................................................................................. 223
11.3 Research Limitations ............................................................................................... 225
11.4 Further Work ........................................................................................................... 227
11.5 Final Conclusions .................................................................................................... 229
12. Appendices ................................................................................................................. 230
12.1 Appendix A – Individual Results ............................................................................ 230
12.2 Appendix B – Patient Information Sheet ................................................................ 242
12.3 Appendix C – Consent Form ................................................................................... 247
12.4 Appendix D – Patellofemoral Pain Questionnaires ................................................. 248
12.5 Appendix E – Ethical Approval .............................................................................. 250
13. References .................................................................................................................. 257

ix
List of Figures
Figure 2-1 Illustration of the anatomy and physiology of the motor unit ............................................ 14
Figure 2-2 Illustration of the process of decomposing the surface EMG signal .................................. 16
Figure 2-3 Graphical representation of motor control systems .......................................................... 36
Figure 3-1 The Delsys dEMG system ................................................................................................. 39
Figure 3-2 The Delsys Trigno EMG system (left) and the Delsys Trigno EMG sensor (right) ........... 40
Figure 2-6 The Qualisys Oqus 310 camera series ............................................................................... 40
Figure 3-4 AMTI BP400600 Force Platform imbedded in the laboratory floor .................................. 41
Figure 3-5 Surface EMG optimal sensor location on a muscle a) Amplitude and Frequency
characteristics of different placements b) Sensor placement avoiding innervation zone and
perpendicular to muscle fibres .................................................................................................... 45
Figure 2-9 An example of the dEMG sensor location on the right Vastus Medialis and Vastus
Lateralis...................................................................................................................................... 46
Figure 3-7 a) Graphical representation of the Delsys Trigno EMG sensor b) Actual Delsys Trigno
EMG sensor ............................................................................................................................... 47
Figure 2-11 a) Graphical representation of the Delsys dEMG sensor b) Actual Delsys dEMG sensor.
................................................................................................................................................... 48
Figure 2-12. Process of skin preparation before applying the dEMG sensor. ..................................... 49
Figure 3-10 A graphical representation of the camera positioning ...................................................... 51
Figure 2-14. L-Shaped reference structure (Left) placed in data measurement area and the calibration
wand (Right). ............................................................................................................................. 52
Figure 2-15 Example of calibration results ........................................................................................ 53
Figure 2-16 Retro-reflective markers positioned for positional calibration ........................................ 53
Figure 3-14 9mm Spherical Retro-Reflective Markers ....................................................................... 54
Figure 3-15 Rigid technical frame marker clusters applied to the thigh and shank segments ............ 54
Figure 2-19. Model marker set used for the foot segment. ................................................................. 55
Figure 2-20. Model marker set used for the shank segment ............................................................... 56
Figure 2-21 Coordinate system of the pelvis segment and calculation of the hip joint centre ............ 57
Figure 2-22 Model marker set used for the thigh segment ................................................................. 57
Figure 2-23 Model marker set used for the pelvis segment ................................................................ 58
Figure 3-21 Example of full marker set on anatomical figure (a) and subject (b) .............................. 58
Figure 2-25 Decomposition Tracking Paradigm ................................................................................ 59
Figure 3-23 Overview of integration and syncronisation of equipment ............................................. 62
Figure 3-24. Overview of Integration and Synchronisation method................................................... 62
Figure 4-1 A graphical representation of the Decompose-Synthesise-Decompose-Compare (DSDC)
process. ...................................................................................................................................... 67

x
Figure 4-2 A representation of the output from the Delsys Decomposition Accuracy and a legend of
the results ................................................................................................................................... 68
Figure 4-3 Example of raw EMG from Vastus Lateralis collected from the dEMG sensor ............... 70
Figure 4-4 Example motor unit firing from Vastus Lateralis ............................................................. 71
Figure 4-5 Graphical representation of the mean firing rate calculation using a Hanning filter ......... 71
Figure 4-6 Example mean firing rate plot from the Vastus Lateralis after a 3-second Hanning window
................................................................................................................................................... 72
Figure 4-7 Selected 5-second constant force region of the mean firing rate ....................................... 73
Figure 4-8 Example of the average MFR from a Vastus Lateralis contraction .................................. 73
Figure 4-9 Mean Firing Rate of the Vastus Lateralis with a 800ms Hanning window filter .............. 75
Figure 4-10 Selected 5-second constant force region of the mean firing rate ..................................... 76
Figure 4-11 Example of two motor unit mean firing rate showing common fluctuation .................... 77
Figure 4-12 Example of cross-correlated motor unit pairing.............................................................. 77
Figure 4-13 Example of cross-correlation on a single contraction from the Vastus Lateralis ............ 78
Figure 4-14 Calculation used to normalise cross-correlation data ...................................................... 80
Figure 4-15 Example of the normalised peak cross-correlation result presenting the Vastus Lateralis
common drive ............................................................................................................................ 81
Figure 4-16 Representative example of a participants sagittal knee moment. Red line being the
highest knee moment used for normalisation. ............................................................................ 83
Figure 4-17 Example of sagittal plane knee moment (red line) and the associated Vastus Lateralis
motor unit MFR with the recruitment phase highlighted. ........................................................... 84
Figure 4-18 Resultant recruitment threshold from Vastus Lateralis showing the recruitment of 39
motor units normalised against sagittal plane knee moment ....................................................... 84
Figure 4-19 Regression plot of average motor unit MFR and the recruitment of the motor units ...... 85
Figure 4-20 Plot of raw EMG data from Gastrocnemius, Bicep Femoris, Rectus Femoris and Gluteus
Medius ....................................................................................................................................... 87
Figure 4-21 Filtered EMG data from Gastrocnemius, Bicep Femoris, Rectus Femoris and Gluteus
Medius ....................................................................................................................................... 88
Figure 4-22 Process of identifying maximal observed EMG signal ................................................... 88
Figure 4-23 Selection of 5-second period from constant force region for data extraction .................. 90
Figure 4-24 Joint Moment calculations and extracted information .................................................... 93
Figure 4-25 Joint Angle calculations and extracted information ........................................................ 94
Figure 4-26 Example application of taping intervention .................................................................... 96
Figure 4-1 The Compex Mi-Sport muscle stimulation device and the motor point pen. ..................... 99
Figure 4-2. An example of the sensor and innervation zone locations, in both graphical and real form.
................................................................................................................................................. 100

xi
Figure 4-3. Mean firing rate (MFR) curves of a typical subject. Proximal placement (Red) and distal
placement (Blue). ..................................................................................................................... 102
Figure 4-4. Subject performing the single limb isometric squat ........................................................ 104
Figure 4-5. Subject performing sit-to-stand squat ............................................................................. 105
Figure 4-6. Subject performing double limb squat ............................................................................ 105
Figure 4-7. Subject performing step-down task ................................................................................ 106
Figure 5-8 Delsys dEMG setup with mains power supply ............................................................... 110
Figure 5-9 Delsys dEMG setup with bespoke battery pack .............................................................. 110
Figure 4-10 Raw baseline noise of the dEMG system with mains line power connection (red) and
bespoke battery power pack (blue) ........................................................................................... 111
Figure 4-11 Power Spectral Density of the baseline noise for the mains power connection (red) and
battery power pack (blue) ......................................................................................................... 112
Figure 5-12 The small plastic disc used to compress the sensor onto the skin ................................. 114
Figure 5-13 Open kinetic chain exercise participants performed on the dynamometer with the dEMG
sensors placed on the Vasti muscles. ........................................................................................ 116
Figure 4-14 Closed kinetic chain exercise participants performed with the dEMG sensors placed on
the Vasti muscles...................................................................................................................... 117
Figure 5-1 Closed kinetic chain exercise participants performed with the dEMG sensors placed on the
Vasti muscles. .......................................................................................................................... 123
Figure 6-1 Graphical representation of the variables investigated in the non-symptomatic group ... 124
Figure 7-2 Example of a subject with a large decrease in coronal plane knee moment with tape
condition (red) compared to no tape (blue) .............................................................................. 128
Figure 7-3 Example of a subject with a large increase in coronal plane knee moment with tape
condition (red) compared to no tape (blue) .............................................................................. 128
Figure 7-4 An example of a subject increasing coronal plane range of motion in the tape condition
(red) compared to the no tape (blue)......................................................................................... 129
Figure 7-5 An example of a subject decreasing coronal plane range of motion in the tape condition
(red) compared to the no tape (blue)......................................................................................... 129
Figure 7-6 Example of an individuals response to tape (red) compared to no tape (blue) showing an
increase in mean firing rate in the tape condition ..................................................................... 133
Figure 7-7 Example of an individuals response to tape (red) compared to no tape (blue) showing a
decrease in mean firing rate in the tape condition .................................................................... 133
Figure 7-8 Cross-correlation data from grouped non-symptomatic subjects in the Vastus Lateralis in
the two different conditions. ..................................................................................................... 135
Figure 7-9 Cross-correlation data from grouped non-symptomatic subjects in the Vastus Medialis in
the two different conditions. ..................................................................................................... 135

xii
Figure 7-10 Example of a decrease in common drive in tape condition (red) compared to no tape
(blue) in the Vastus Lateralis .................................................................................................... 136
Figure 7-11 Example of an increase in common drive in tape condition (red) compared to no tape
(blue) in the Vastus Medialis .................................................................................................... 136
Figure 7-12 Regression plot of the Vastus Medialis from the non-symptomatic subjects, showing the
recruitment threshold differences between no tape (blue) and tape (red) ................................. 138
Figure 7-13 Regression plot of the Vastus Lateralis from the non-symptomatic subjects, showing the
recruitment threshold differences between no tape (blue) and tape (red) ................................. 139
Figure 7-14 An example of the Vastus Medialis in an individual non-symptomatic subject, showing
the recruitment threshold differences between no tape (blue) and tape (red) ............................ 140
Figure 7-15 An example of the Vastus Lateralis in an individual non-symptomatic subject, showing
the recruitment threshold differences between no tape (blue) and tape (red) ............................ 140
Figure 7-16 An example of the Vastus Medialis in an individual non-symptomatic subject, showing
the recruitment threshold differences between no tape (blue) and tape (red) ............................ 141
Figure 7-17 An example of a non-symptomatic subject Vastus Medialis requiring additional
force/excitation in the tape condition (red) compared to the no tape condition (blue) ............. 143
Figure 7-18 An example of a non-symptomatic subject Vastus Medialis requiring less
force/excitation in the tape condition (red) compared to the no tape condition (blue) ............. 143
Figure 7-19 'Traffic Light' results for non-symptomatic subjects ..................................................... 145
Figure 8-1 Graphical representation of the variables investigated in PFP group .............................. 152
Figure 9-2 Example of a subject increasing the range of moment in the coronal plane with the
application of tape (red) compared to no tape (blue) ................................................................ 156
Figure 9-3 Example of a subject decreasing the range of moment in the coronal plane with the
application of tape (red) compared to no tape (blue) ................................................................ 156
Figure 9-4 Example of a subject decreasing the range of motion in the coronal plane with the
application of tape (red) compared to no tape (blue) ................................................................ 157
Figure 9-5 Example of a subject increasing the range of motion in the coronal plane with the
application of tape (red) compared to no tape (blue) ................................................................ 157
Figure 9-6 An example of a subject whom increases the Vastus Medialis firing rate in the tape
condition (red) compared to the no tape (blue) ......................................................................... 162
Figure 9-7 An example of a subject whom shows no change in the Vastus Lateralis firing rate in the
tape condition (red) compared to the no tape (blue) ................................................................. 162
Figure 9-8 Cross-correlation data from grouped symptomatic subjects in the Vastus Medialis in the
two different conditions............................................................................................................ 164
Figure 9-9 Cross-correlation data from grouped symptomatic subjects in the Vastus Lateralis in the
two different conditions............................................................................................................ 164
Figure 9-10 An example of a subject increasing the common drive to the Vastus Medialis ............ 165

xiii
Figure 9-11 An example of a subject decreasing the common drive to the Vastus Medialis ............ 166
Figure 9-12 Example of a changing recruitment threshold in the Vastus Medialis with tape (red) and
no tape (blue) ........................................................................................................................... 168
Figure 9-13 An example of a subject who did not exhibit any significant change in Vastus Medialis
with tape (red) compared to no tape (blue) ............................................................................... 168
Figure 9-14 'Traffic Light' results for symptomatic subjects ............................................................ 175
Figure 9-15 Common drive for non-symptomatic and symptomatic subjects for Vastus Medialis
(Red) and Vastus Lateralis (Blue) ............................................................................................ 184
Figure 9-16 Recruitment Threshold for Vastus Medialis for Non-Symptomatic subjects (Blue) and
Symptomatic subjects (Red) with no intervention .................................................................... 186
Figure 9-17 Recruitment Threshold for Vastus Lateralis for Non-Symptomatic subjects (Blue) and
Symptomatic subjects (Red) with no intervention .................................................................... 186
Figure 10-1 The normalised mean EMG activity for the non-symptomatic subjects from the
Gastrocnemius, Biceps Femoris, Rectus Femoris and Gluteus Medius and their respective
responses to tape (red) compared to no tape (blue) .................................................................. 196
Figure 10-2 An example of a subject with differing results from the group in response to the tape
(red) compared to the no tape (blue)......................................................................................... 197
Figure 10-3 An example of a subject decreasing muscle activity with tape (red) compared to no tape
(blue) ........................................................................................................................................ 197
Figure 10-4 The normalised mean EMG activity for the symptomatic subjects from the
Gastrocnemius, Biceps Femoris, Rectus Femoris and Gluteus Medius and their respective
responses to tape (red) compared to no tape (blue) .................................................................. 198
Figure 10-5 Mean EMG from Gastrocnemius, Biceps Femoris, Rectus Femoris and Gluteus Medius
in the non-symptomatic (blue) and symptomatic (red) subjects. .............................................. 199
Figure 10-6 Example of change in Vastus Medialis Mean Firing Rate in response to tape in non-
symptomatic subject ................................................................................................................. 202
Figure 10-7 Example of change in Vastus Medialis Mean Firing Rate in response to tape in
symptomatic subject ................................................................................................................. 204
Figure 10-8 Common drive results from both subject groups before and after the application of tape.
................................................................................................................................................. 208
Figure 10-9 Graphical representation of the inter-relationships and contributing factors to force
generation and control within the motor unit pool .................................................................... 216
Figure 10-10 Graphical representation of systems involved in movement control including new motor
unit control strategy findings .................................................................................................... 220

xiv
List of Tables
Table 2-1 Summary of other proposed PFP paradigms ......................................................................... 7
Table 2-2 Hip Joint Centre (HJC) calculation values and respective planes of motion ....................... 56
Table 3-1 Motor unit selection criteria ............................................................................................... 69
Table 3-2 Example statistics of the MFR variables extracted; Minimum, Maximum, Mean and
Standard Deviation ..................................................................................................................... 74
Table 3-3 An example of the cross-correlation data extraction reporting the median and inter-quartile
(IQR) 25th and 75th percentile range ......................................................................................... 79
Table 3-4 Representative example of peak cross-correlation values for a subject within the different
cross-correlation values .............................................................................................................. 79
Table 3-5 Example data from normalised cross-correlation calculations ........................................... 81
Table 3-6 A example of the extracted data from the recruitment threshold calculation ..................... 86
Table 3-7 A example of the extracted data from the recruitment operating point calculation ............ 86
Table 3-8 Example of average normalised EMG for the Rectus Femoris .......................................... 90
Table 3-9 Joint coordinate system and axes, planes of motion and respective movements ................ 91
Table 4-1. Mean firing rates and motor unit yields for both Vastus Medialis (VM) proximal and distal
placement ................................................................................................................................. 101
Table 4-2. The four tasks subjects performed and their success rate of decomposing ...................... 107
Table 4-3 Results table showing the mean MFR, standard deviations and significance value for the
two Vasti during the different tasks. ......................................................................................... 118
Table 6-1 Sagittal plane knee joint moment and angle descriptive statistics .................................... 125
Table 6-2 Coronal plane knee joint moment and angle descriptive statistics ................................... 126
Table 6-3 Transverse plane knee joint moment and angle descriptive statistics ............................... 127
Table 6-4 sEMG results from grouped analysis of the non-symptomatic subjects showing the EMG
activity response to the taping intervention .............................................................................. 130
Table 6-5 Grouped analysis of all non-symptomatic subjects average MFR, standard deviations and
MFR minimum and maximum values ...................................................................................... 132
Table 6-6 Grouped common drive results from the non-symptomatic subjects showing the median
and inter-quartile range (25th and 75th percentile) for the two conditions in the two muscles. 134
Table 6-7 Recruitment threshold results from the symptomatic subjects showing the Vastus Medialis
and Vastus Lateralis in the tape and no tape condition ............................................................. 138
Table 6-8 Descriptive statistics for the grouped recruitment operating point from the non-
symptomatic subjects. .............................................................................................................. 142
Table 8-1 Sagittal plane knee joint moment and angle descriptive statistics .................................... 153
Table 8-2 Coronal plane knee joint moment and angle descriptive statistics ................................... 154
Table 8-3 Transverse plane knee joint moment and angle descriptive statistics ............................... 155

xv
Table 8-4 sEMG results from grouped analysis of the symptomatic subjects showing the mean EMG
activity, standard deviation, mean difference, 95% confidence intervals and p-values. ........... 158
Table 8-5 Grouped analysis of all symptomatic subjects average MFR, standard deviations and MFR
minimum and maximum values ............................................................................................... 160
Table 8-6 Grouped common drive results from the symptomatic subjects showing the median and
inter-quartile range (25th and 75th percentile) ......................................................................... 163
Table 8-7 Recruitment threshold results from the symptomatic subjects showing the intercept and
slope values for the tape and no tape condition from the Vastus Medialis and Vastus Lateralis.
................................................................................................................................................. 166
Table 8-8 Descriptive statistics for the grouped recruitment operating point from the symptomatic
subjects. .................................................................................................................................... 170
Table 8-9 Mean and standard deviation values for the conscious motor processing and movement
self-consciousness in the symptomatic subjects. ...................................................................... 172
Table 8-10 Numerical Pain Rating Scale results from symptomatic subjects .................................. 173
Table 8-11 Sagittal plane results from the mean moment and mean angle comparing the non-
symptomatic and symptomatic subjects ................................................................................... 180
Table 8-12 Coronal plane results from the range of moment and range of angle comparing the non-
symptomatic and symptomatic subjects ................................................................................... 181
Table 8-13 Transverse plane results from the range of moment and range of angle comparing the non-
symptomatic and symptomatic subjects ................................................................................... 181
Table 8-14 Surface EMG amplitude results for non-symptomatic and symptomatic subjects .......... 182
Table 8-15 Inferential analyses of the motor unit firing rate comparing non-symptomatic and
symptomatic subjects ............................................................................................................... 183
Table 8-16 Recruitment threshold results comparing the regression lines between the non-
symptomatic and the symptomatic subjects with no intervention for the Vastus Medialis and
Vastus Lateralis. ....................................................................................................................... 185
Table 11-1 Kinematic and Kinetic results of the non-symptomatic subjects showing the range of
moment and range of motion in the coronal and transverse planes........................................... 230
Table 11-2 Kinematic and Kinetic results of the symptomatic subjects showing the range of moment
and range of motion in the coronal and transverse planes ........................................................ 231
Table 11-3 sEMG results from the non-symptomatic subjects showing the mean difference % MVC
values for each subject. ............................................................................................................ 231
Table 11-4 sEMG results from the symptomatic subjects showing the mean difference % MVC
values for each subject. ............................................................................................................ 232
Table 11-5 Mean Firing Rate for the Vastus Medialis and Vastus Lateralis in the tape and no tape
condition for non-symptomatic subjects ................................................................................... 233

xvi
Table 11-6 Mean Firing Rate for the Vastus Medialis and Vastus Lateralis in the tape and no tape
condition for symptomatic subjects .......................................................................................... 234
Table 11-7 Cross-correlation results for the Vastus Medialis and Vastus Lateralis in the tape and no
tape condition for non-symptomatic subjects ........................................................................... 235
Table 11-8 Cross-correlation results for the Vastus Medialis and Vastus Lateralis in the tape and no
tape condition for symptomatic subjects .................................................................................. 236
Table 11-9 Recruitment Threshold results for the Vastus Medialis and Vastus Lateralis showing
comparison regression lines with their intercept and slope values for non-symptomatic subjects
................................................................................................................................................. 237
Table 11-10 Recruitment Threshold results for the Vastus Medialis and Vastus Lateralis showing
comparison regression lines with their intercept and slope values for symptomatic subjects ... 238
Table 11-11 Recruitment operating point results for the Vastus Medialis and Vastus Lateralis
showing the percentage at which the first motor units were recruited for the non-symptomatic
subjects ..................................................................................................................................... 239
Table 11-12 Recruitment operating point results for the Vastus Medialis and Vastus Lateralis
showing the percentage at which the first motor units were recruited for the symptomatic
subjects ..................................................................................................................................... 240
Table 11-13 Results from the Movement Specific Reinvestment Scale (MSRS) for the movement
self-consciousness and conscious motor processing ................................................................. 241
Table 11-14 Numerical Rating Scale results from symptomatic subjects ........................................ 241

xvii
Glossary of Terminology and Definitions
Throughout the thesis various terms are used to describe physiological concepts or processes,
although many of the terms are familiar they can be misrepresented or misunderstood across
differing fields. Therefore to ensure no ambiguity exists a selection of pertinent terms are
described and/or defined below.
Biomechanical System
The ‘Biomechanical system’ is used as a descriptive term used to encompass the involvement
of the joint mechanics and its mechanical interactions, measured in this context from a motion
capture system.
Neuromuscular System
The ‘Neuromuscular system’ is used as a term used to describe the combination of the muscles,
the nervous system (central and peripheral) and its physiological interactions.
dEMG/Surface EMG Decomposition
This term is used to describe the method of decomposing a surface EMG signal, using
specialised and novel technology, into its constituent motor unit action potentials (MUAPs).
This differs from the traditional method of surface EMG, which provides information about
the composition of all detected MUAPs that is unable to provide the detailed information on
the firing characteristics as dEMG is able to.
Proprioception
This can be defined as the body’s ability to sense stimuli from muscular, tendon and articular
sources to detect position, motion and equilibrium.
Common Drive
The physiological phenomenon that the firing rates of motor units fluctuate in unison with
essentially no time delay between them, leading to a concept of common drive. Suggesting
that the CNS has evolved a strategy for controlling motor units, rather than controlling the
activity of each motor separately the CNS appears to control the excitation to the motoneuron
pool.

xviii
Cross-Correlation
The mathematical calculation used to provide a measure of common drive, showing motor units
have correlated fluctuations in their firing within a ±100ms time lag.
Mean Firing Rate (MFR)
The motor unit action potential train (MUAPT) passed through a low pass hanning filter
provides the mean of the firing rate of a given motor unit. The mean firing rate provides
behavioural information about the muscle and the force it generates.
Recruitment Threshold
The Recruitment Threshold is the point at which a given motor unit begins to fire and is often
presented in relation to an MVC, within the context of this thesis that is the maximum knee
moment. The recruitment threshold is often regressed against another variable relating to the
motor unit characteristics, in the case of this thesis it’s related to the average MFR.

xix
Glossary of Abbreviations
MU – Motor Unit
MUAP – Motor Unit Action Potential
MUAPT – Motor Unit Action Potential Train
MFR – Mean Firing Rate
PPS – Pulses Per Second
Hz – Hertz
PFP – Patellofemoral Pain
VM – Vastus Medialis
VL – Vastus Lateralis
MRI – Magnetic Resonance Imaging
EMG – Electromyography
sEMG – Surface Electromyography
dEMG – Surface Electromyography Decomposition

1
1. Introduction
Patellofemoral pain (PFP) is a condition that has been described as being “the Loch Ness
monster of the knee” (Grelsamer et al. 2009) and the “black hole of orthopaedics” (Dye &
Vaupel 1994) due to its indefinable and expansive nature when addressing the aetiology,
management and treatment. A plethora of academic and clinical investigations has evolved the
knowledge and understanding of PFP, however this has often provided inconsistent and varied
information to researchers and clinicians alike. This can partly be explained by the complex
mosaic of pathophysiological processes associated with PFP. Patellofemoral Pain has been
reported as being a common complaint amongst a wide range of individuals, thought to be
particularly prevalent in younger and physically active persons (Taunton et al. 2002). PFP has
been attributed to several causes: traumatic, overuse, patellofemoral malalignment,
degenerative and idiopathic (Sanchis-Alfonso & Roselló-Sastre 2005). Due to the suggested
high prevalence of PFP much research has focused on identifying the true cause of the pain
and dysfunction. The primary theory, at this current time, is that patellofemoral malalignment
and/or maltracking results in PFP symptoms, however the mechanisms behind the
pathomechanics are yet to be fully understood. Several factors have been theorized to
contribute towards abnormal tracking and alignment of the patella, including; quadriceps
weakness, quadriceps muscle imbalances, excessive soft tissue tightness, increased quadriceps
angle (Q-angle), hip weakness and altered foot kinematics (Bolgla & Boling, 2011).
Conservative intervention and management has been as varied and multifaceted as the
causative factors associated with PFP. Treatment often consists of various components
designed to improve patella alignment, including: quadriceps retraining, stretching of the lower
limbs, patella mobilization, correcting foot kinematics with foot orthoses and patellar taping
(Bolgla & Boling, 2011). Since McConnell’s landmark paper (McConnell, 1986) there has
been widespread acceptance in clinical practice for the use of tape. The proposed aim of
McConnell taping is to create a medial realignment of the patella within the trochlea groove,
consequently enhancing the tracking and control of the patella thus reducing pain and
improving function to allow pain-free rehabilitation to be performed (McConnell, 1986).
However, despite the clinical success of patellar taping at reducing pain and improving function
the mechanisms are yet to be fully understood, which is certainly not reflective of the wealth
of research that has focused on patellar taping. Various explanations of the clinical success

2
with patellar taping have been proposed and investigated (Crossley et al., 2000), with the
neuromuscular system being a favoured area of study and specifically the role of the vasti
muscles.
The neuromuscular system and its control of the knee joint musculature is perhaps the least
understood variable associated with patellofemoral pain (Grabiner et al. 1994), however often
the most cited factor in rehabilitation. Previous investigations have followed the clinical lead
with the belief that the vasti muscles, being synergistic stabilizers of the knee, are important
factors in patellofemoral control with the Vastus Medialis being “the only dynamic medial
stabilizer of the knee” (McConnell, 1986). Extensive investigations have explored the
neuromuscular control of the vasti muscles using electromyography (EMG), both invasively
and non-invasively, using various EMG measurements and techniques. The majority of
investigations have focussed on the postulate of delayed firing or ratio difference between the
VM and VL in various conditions and environments (Neptune et al., 2000; Bowyer et al., 2008;
Van Tiggelen & Med, 2009; Cowan et al., 2001; Wong, 2009; Sung & Lee, 2009; Chester et
al., 2008; Smith et al., 2009). The lack of homogeneity amongst the protocols, methods and
data processing techniques used in the literature has led to inconsistent and mixed findings
(Wong, 2009). Therefore definitive neurophysiological evidence for a change in vasti
coordination within a PFP population is limited. One method that may provide additional
insight into this would be to study control at the motor unit (MU) level opposed to studying
whole muscle behaviour.
Studying the neuromuscular system at a motor unit level is often achieved through invasive
EMG procedures consisting of inserting fine-wire or needle electrodes into the muscle belly.
These procedures provide information on the characteristics of a small yield (typically 2-5) of
MUs, which can be described as being the smallest controllable muscular units in the body
(Basmajian & De Luca, 1985). The study of the individual motor unit action potentials
(MUAPs) provides desirable information on the timing of their discharges and therefore
allowing a detailed description of the interpulse interval, firing rate and synchronisation
characteristics (De Luca et al., 2006). From a clinical perspective this could provide invaluable
information regarding the control of the muscles. Recent developments have allowed
decomposition of surface EMG signals (De Luca et al. 2006; Nawab et al. 2010) providing new
information on the hierarchical control of motor units during voluntary isometric contractions
in non-symptomatic individuals (De Luca & Contessa, 2012), in elderly subjects (Erim et al.

3
1999), muscular fatigue (Adam & De Luca, 2003; Contessa et al., 2009), strength training
(Beck et al. 2011) and stroke sufferers (Suresh et al. 2011), however no previous work has
explored any musculoskeletal conditions. To date, previous investigations using
decomposition methods have used isometric open kinetic chain exercises to explore MU
behaviour. Although these methods allow for highly repeatable and reliable contractions they
tend to lack the clinical relevance for most musculoskeletal conditions, such as patellofemoral
pain, as it lacks a stability challenge and functional relevance. A task that offers stability
challenges and functional relevance for patellofemoral pain, without compromising the use of
the surface EMG decomposition method, could provide tantalizing insights into MU control.
Such information allows the study of the neuromuscular system, however the functional
interaction between the intrinsic biomechanics of the knee joint and the surrounding
musculature that drives the movements (Andriacchi et al. 1984), is yet to be fully understood.
Previous research exploring the role of biomechanics in PFP has focussed on the sagittal plane
or used too simplistic modelling techniques (Gilleard et al., 1998; Salsich et al., 2001; Brechter
& Powers, 2002; Salsich et al., 2002; Crossley et al., 2004), however the knee joint is
significantly more complex than singular plane movements. Kowalk et al. (1996) highlighted
the importance of the abduction-adduction moment in medio-lateral stability. Selfe et al.
(2008) also emphasized this significance of studying the coronal and transverse planes when
exploring the control of the knee during step descent, being further highlighted in a PFP
population (Selfe et al. 2011). The authors showed that the discrete and significant changes in
the coronal and transverse plane knee kinetics and kinematics could be observed with varying
therapeutic interventions, with no changes seen in the sagittal plane. Clinically it seems logical
to explore the coronal and transverse planes of movement as most common therapeutic
interventions are directed medially, as in the medial glide with the McConnell taping technique
(McConnell, 1986).
The last decade has seen an exponential rise in inter-disciplinary research with kinetics,
kinematics and sEMG being applied to musculoskeletal and neurological conditions, providing
further insight into the interaction of the neuromuscular system on the biomechanical system.
However, studying motor unit level control of the neuromuscular system coupled with detailed
3-dimensional biomechanics remains both technically challenging and conceptually complex.
The application of such investigations could provide new insights or clarifications into
common musculoskeletal conditions and consequent treatment efficacies, further representing
significant contributions to the apparent knowledge gap.

4
2. Literature Review
2.1 Patellofemoral Pain Aetiology
2.1.1 “Patellofemoral Pain”
The term Patellofemoral Pain is a descriptive diagnosis that is often, and sometimes
inaccurately, synonymous with Anterior Knee Pain (AKP), idiopathic anterior knee pain,
Patellagia, Patella compression syndrome, overuse patellofemoral pain and Chondromalacia
(Näslund et al. 2006). Historically, Chondromalacia Patellae was the first term and diagnosis
used by Koenig (1924) to describe all-inclusive knee pain associated with the patellofemoral
joint. It was not until 1977 that a differential diagnosis of knee pain was exposed (Ficat &
Hungerford 1977) and Chondromalacia Patella was restricted to describing articular cartilage
defects. The term Patellofemoral Pain is the current descriptive diagnosis that has, and will no
doubt, continue to evolve over time as more is understood about the condition. However, there
is evidently a lack of homogeneity in the definition of PFP which becomes apparent in the
reported incidence and prevalence of the condition.
2.1.2 Prevalence and Incidence
Patellofemoral pain is frequently claimed and described as a ‘common complaint’ amongst a
wide range of groups and settings (Cavazzuti et al. 2010; Cook et al. 2010; Cowan et al. 2000;
Crossley et al. 2001). Various population groups have been investigated, including;
adolescents (Rathleff et al. 2013), military (Boling et al. 2009), athletic (Witrouw et al. 2000),
females (Boling & Padua 2010) and the general population (Wood et al. 2011). Authors have
attempted to be more specific with the incidence of PFP by stating a popularised, yet
unsubstantiated, ratio of 1:4 or 25%. However, such statements are often lacking source data
or are biased to specific populations, as highlighted in a review by Callaghan and Selfe (2007)
whom explored the reported incidence and prevalence rates for PFP. It was stated that 40/136
papers reviewed cited a numerical rate or ratio, with 15 of these papers citing the 1:4 ratio or
25% value. The 40 papers that offered a numeric value cited many papers for justification,
with four citations being most popular (Devereaux & Lachmann 1984; DeHaven & Lintner
1986; Kannus et al. 1987; Milgrom et al. 1991). These and much of the literature is based upon
convenient and/or accessible populations such as sports medicine clinics and military
populations, yet the incidence and prevalence rates from these settings are often inaccurately
inferred to the adult general population. Wood et al. (2011) is the only author to investigate

5
the prevalence of PFP within the United Kingdom in the general adult population. During one
year (2006) and across 8 general practices there were 1782 knee-related consultations held, of
which 303 or 1:6 were classified as being a patellofemoral disorder. Although PFP is reported
as having a relatively high incidence and being a prevalent condition it is evident that caution
should be sought when considering and inferring this across different population groups. A
factor which further hazes the prevalence and incidence of PFP is its presentation, consequent
clinical examination and classification.
2.1.3 Symptoms and Clinical Examination
PFP is commonly described as retropatellar or peripatellar pain which can present itself, and
often is exacerbated, during activities such as walking, running, stair ascent and descent,
squatting, kneeling and sitting. Naslund et al. (2006) reviewed the wide spectrum of the PFP
symptomatology that has been reported, concluding that there is a clear lack of consensus on
the definition or classification, and that PFP is often a diagnosis made by exclusion.
Consequently there exists a plethora of methods and criteria that researchers and clinicians use
to assist the clinical examination of PFP that include: detailed evaluation of complaints of pain,
identification of origin of symptoms, assessment of performance deficits, and imaging
investigation (Cook et al. 2012).
Due to the multifactorial aetiology of PFP a battery of clinical examination techniques are
frequently used to substantiate the rule-out, rule-in probabilistic model. Cook et al. (2010)
individually and collectively explored the diagnostic accuracy and disability relationship of a
selection of routinely used measures, including: manual compression of the patella, palpation
of patella borders, isometric quadriceps contraction, squatting, stair climbing, kneeling, and
prolonged sitting. The authors found that no single physical examination test or functional
activity is helpful in the diagnosis of PFP, however they did state that any two of three: pain
with quadriceps contraction, pain during squatting, and/or pain during palpation of the postero-
medial or postero-lateral borders resulted in a moderate shift towards a PFP diagnosis. These
findings are in agreement with similar studies who also found that no single physical or
functional test is sensitive or specific enough to diagnose PFP but positive findings from
multiple tests could indicate a PFP diagnosis (Haim et al. 2006; Nijs et al. 2006). The lack of
definitive physical examinations and functional tests, which are able to diagnose or assist in
the diagnosis, could be due to the various suggested paradigms of PFP.

6
2.1.4 Patellofemoral Pain Paradigms
PFP has historically been widely accepted as being a mechanical problem with the patella
incorrectly aligned in the trochlear groove, Patellofemoral Malalignment and/or the patella
incorrectly tracking in the trochlear groove during the flexion-extension cycle, Patellofemoral
Maltracking. First proposed by Insall (1979) as “Patellar Malalignment Syndrome”, it was
thought that the lateral loading of the patella was increased with malalignment. The patella
maltracking theory suggests that the abnormal tracking of the patella changes the contact zones
and thus causes a noxious stimulus (Fulkerson 2004), which is then subjectively and
individualistically inferred as pain by the patient. This proposal was, and frequently still is,
met with a surgical intervention (Lateral Retinacular Release) to ‘correct the malalignment’,
however this theory has also provided many conservative non-invasive modalities. The
malalignment and/or maltracking theory has been investigated by many authors in an attempt
to provide empirical evidence and justification, most commonly through various imaging
techniques. Plain radiographs (Teitge 2001), computed axial tomography (Biedert & Gruhl
1997) and magnetic resonance imaging (MRI) (Noehren et al. 2012) are common techniques
which have been used in an attempt at providing insight into the mechanical aspects of the
malalignment/maltracking theory with homogeneous findings. In more recent years it has been
highlighted that the malalignment and maltracking theories may not be the sole cause of PFP
and that several contributory components may be ascribed to causing pain. A complimentary
component of the biomechanical approach is the psychosocial element to movement related
pain and an individual’s conscious perception of their movement. Masters and Maxwell (2008)
have proposed that psychological, physiological, environmental and mechanical events are a
function of an individual’s propensity to consciously control movements, coined ‘The Theory
of Reinvestment’. The psychosocial component of PFP is one of which compliments the
biomechanical and neuromuscular elements of PFP and consequently the
malalignment/maltracking theory.
Various other paradigms have been suggested to be responsible and/or contribute to PFP, a
summary of which can be seen in Table 2-1. Although these paradigms evidently present
complementary and alternative information to the understanding of PFP they are beyond the
scope of this thesis and will not be investigated but held in consideration.

7
Table 2-1 Summary of other proposed PFP paradigms
PFP
Paradigm Key Information References
Tissue
Homeostasis
Envelope of load acceptance and function leading
to loss of tissue homeostasis. Theory suggesting
coexistence of multiple causative factors leading to
PFP.
(Dye 2005)
Pathophysiology of Patellofemoral Pain
Fat Pad The involvement of the highly innervated and
vascular fat pad as a source of pain in PFP.
(McConnell 2013)
Management of a difficult knee
problem
Vascular Concept that poor vascularisation of the patella and
knee surrounding arteries
(Sanchis-alfonso 2010)
Pathophysiology of Anterior Knee Pain

8
2.2 Neuromuscular Involvement
2.2.1 Background
The knee joint is not only comprised of complex articulating anatomical structures but has an
equally intricate neuromuscular system, in producing both power and control leading to the
generation of force and stability at the joint. A plethora of classic texts have investigated the
quadriceps muscles in an attempt at understanding the role and function of the knee joint
(Lindahl & Movin 1967; Haffajee et al. 1972; Carlsoo et al. 1973; Wahrenberg et al. 1978),
where the historical view being that the Quadriceps main function is the sole contributor in
extension of the knee. Even though the Quadriceps muscles has been described as being “the
most beautiful muscles” (Last 1952) other muscles have shown their contribution to the
function of the knee. The work of Andriacchi et al. (1984) demonstrated the significant roles
the Vastus Medialis, Vastus Lateralis, Vastus Intermedius, Rectus Femoris, Gracilis, Sartorius,
Biceps Femoris, Semitendinosus, Semimembranosus, tensor fasciae latae, medial and lateral
heads of Gastrocnemius all have in the control of the knee at different knee angles and external
moments. In addition to the Quadriceps role in knee extension it has been postulated that the
Vasti components hold significant contributions in the control of the patella and knee joint
(Lieb & Perry 1968; Makhsous & Lin 2004; Wilson & Sheehan 2009; Lin et al. 2010).
Explicitly, the role of the Vastus Medialis has held the focus of researchers and clinicians for
its purported role in acting as a medial stabiliser of the patella (McConnell 1986) and its
possible dysfunction in terms of strength (Neptune et al. 2000), disbalance (Petersen et al.
2013), force direction (Tucker & Hodges 2010) and control (Toumi et al. 2013).
2.2.2 Muscle Activity and Patellofemoral Pain
Electromyography (EMG) provides a detailed measurement and quantification of the
behaviour of the muscle, consequently offering key insights into the neuromuscular system and
its behaviour. The advent of surface EMG technology has offered a repeatable, accurate and
non-invasive method to measure the behaviour of a muscle and also the ability to measure
multiple muscles simultaneously from the surface of the skin. This has stimulated a host of
investigations into the neuromuscular involvement in Patellofemoral Pain, where a key focus
has been to attempt to understand the behaviour of the muscles surrounding the knee and
explicitly the Vasti muscles (Tang et al. 2001;Cowan et al. 2001; Christou 2004; Sacco et al.
2006; Bowyer et al. 2008; Patil et al. 2011; Lee & Cho 2013). By far, the majority of the

9
studies investigating PFP and its neuromuscular components have done so by observing the
gross changes of the surface EMG signal, predominantly through investigations of the signal
amplitude or activation timing of the muscles. The heterogeneous findings and purported
relationships between and within the Vastus Medialis and Vastus Lateralis have long been
studied in an attempt to understand the ‘control’ of the muscles and their respective behaviour
(Cowan et al. 2001; Herrington et al. 2005; Rainoldi et al. 2008; Cowan & Crossley 2009;
Cavazzuti et al. 2010).
Quadriceps muscle imbalances is one of the most popularised areas of investigation in the
neuromuscular explorations within PFP research. This follows a seemingly logical concept
that if there is a load bias across the differing portions, specifically the Vastus Medialis and
Vastus Lateralis, then it may cause maltracking of the patella within the trochlear groove and
perhaps being a causative factor in PFP (see section 2.3.3). The imbalance of the Quadriceps
has historically been thought to be down to two main possibilities; a reduction in the force
producing ability of the Vastus Medialis (Ahmed & Burke 1987) or due to an altered temporal
control of the Vasti in PFP patients (Voight & Weider 1991). The altered onset of the Vastus
Medialis (temporal control) has been considered to be of particular importance due to the
hypothesis from Grabiner et al. (1994) that the VM should be activated earlier than the VL to
be able to optimally track the patella, as the VM has a smaller cross-sectional area in
combination with the dominant laterally directed force contribution of the VL. Neptune et al.
(2000) used musculoskeletal modelling to simulate running and the effects of two treatments,
foot orthoses and VM strengthening, and the functional significance to VM onset timing had
on the estimated patellofemoral joint loads. It was found that both treatments significantly
reduced the average patellofemoral joint load and the VM strengthening also significantly
reduced the peak patellofemoral joint load. Interestingly when the VM timing was delayed and
advanced relative to the VL onsite there was a significant increase and decrease in
patellofemoral joint load respectively. Many other investigations have explored the temporal
characteristics of the Vasti muscles in relation to PFP and therapeutic interventions (Cowan et
al. 2002; Wong 2009; Sung & Lee 2009; Chester et al. 2008; Van Tiggelen et al. 2009; Dixon
& Howe 2007; Cavazzuti et al. 2010; Cowan et al. 2001). However, there exists controversy
as to the ‘normal’ relationship in the EMG onsets of the Vasti muscles, and if there actually
exists any differences in a PFP population. The controversies present themselves in various
forms; through processing techniques, measurement error, in reference to non-physiological
events and sample sizes. There exist many methods of determining the onset of a muscle

10
contraction through varying processing techniques, with the most commonly cited methods
being manual/visual determination, onset relative to the number of standard deviations away
from the baseline noise (using automatic processing methods) and cross-correlation yet there
is no consensus within the literature which may be the most sensitive and reliable. Uliam
Kuriki et al. (2011) collected sEMG data from the two Vasti muscles with 33 subjects, 11 of
which had PFP, during a stair climbing task. The same data set was then processed using three
different techniques at determining the onset of the muscle, namely cross-correlation,
automatic detection and visual inspection. The results demonstrated the cross-correlation
technique had the lowest variation but the results were not able to elicit a difference between
the PFP and control group, unlike the other techniques that showed significantly larger standard
error of measurement but could distinguish between the different subject groups. Interestingly
the authors also reported that the variability was higher in the PFP patients, indicating that the
multifactorial aetiology of PFP can also affect the results (Cavazzuti et al. 2010). It can be
seen from this paper and others that using the same samples from the same subjects, varying
only the technique used to obtain the onset, the results can be significantly manipulated and
potentially leading to gross misinterpretation. Wong and Ng (2006) examined the effect of
electrode positioning on the EMG recordings of VM and VL with respect to the onset timing
during quadriceps stretch reflex and voltage during voluntary isometric contraction. They
revealed that different positioning of the VL electrodes would significantly affect the EMG
onset time, VL relative to VM, and the electrical signal strength during the same activity. These
highlighted points can be seen within the diversity and lack of consensus in the literature about
EMG onset and the methodology of determining the onset is a crucial aspect when interpreting
the results.
In addition to the processing and measurement problems that seem to plague the investigations
into the onset timing it is seemingly common to present the onset timing as percentage of a gait
cycle (Powers et al. 1996), in relation to changes in force (Morrish & Woledge 1997) or simply
reporting the time difference between the onset (Cowan et al. 2002) rather than considering the
joint biomechanics which are suggestively more sensitive and applicable. Often talked within
the same scope are papers that have investigated the Vasti onset timing in relation to a reflex
task (Voight & Weider 1991; Witvrouw et al. 1996; Karst & Willett 1995), which should be
approached with caution due to the different physiology behaviour between a reflex based onset
timing and voluntary contraction onset timing, with the former offering the question about the
clinical relevance to such work. These critiques and literature explicitly bring into question
the validity and applicability of the plethora of texts exploring the onset time of the Vasti and

11
the purported delay, which seems to have become a dogmatic belief within both the literature
and clinical practice. Although the imbalance between the Vasti muscles is a logical concept
the confusion amongst the literature perhaps taints the understanding, where new methods of
exploring the load bias across these structures may be able to offer further detail and insight.
Andriacchi et al. (1984) demonstrated many years ago the significance in the role of a number
of the lower limb muscles involved in the control of the lower limb and specifically the knee.
As often with investigations into musculoskeletal conditions there is a keen focus on the
musculature that surrounds the joint of interest, in the case of PFP then the majority of the work
has exerted great effort in attempting to understand the Vasti muscles during various movement
tasks and under differing interventions, but with less exposure often found for the other
involved muscles around the ankle, knee and hip. The control, strength and consequent
muscular behaviour of the hip has gained much attention in recent years with the theory that
that diminished gluteal muscle function could cause increased hip joint adduction and internal
rotation when carrying out activities such as running, squatting and stair ascent/descent. The
excessive and aberrant hip motion has been proposed to increase the patellofemoral joint stress,
which is considered to be associated the development of PFP (Powers 2010). Following on
from this a host of strengthening programmes have been devised which have provided positive
clinical outcomes (Mascal et al. 2003; Fukuda et al. 2010). However, despite this support for
the efficacy of gluteal strengthening it has been documented that the development of PFP is
not predictive through hip strength testing (Prins & van der Wurff 2009) but at the same time
it’s also been reported that greater hip external rotational strength could be predictive (Boling
et al. 2009). The method of measuring ‘muscle strength’ is done through isometric testing and
can only loosely be associated with the functional and dynamic movements, and in addition
does not take into account any of the other lower limb muscles, kinematics, or joint forces and
these should be considered when evaluating the reported involvement and importance of the
hip. A recent systematic review by Barton et al. (2013), with 10 case-control studies and no
prospective studies, concluded that the gluteal muscle activity with PFP is limited due to an
absence of prospective research, low sample sizes and heterogeneity in methodological design
including procedures, data reduction and analysis and participant inclusion and exclusion
criteria. It was identified that moderate-to-strong evidence suggests Gluteus Medias muscle
activity is delayed and of shorter duration during stair negotiation in PFP patients, but in
running there is limited evidence indicating that Gluteus Medius muscle activity may be
delayed and of shorter duration.

12
Regardless if there is a true relationship, simply exploring the gluteal muscle activity of hip
strength in isolation will likely not provide a complete picture of the PFP patient and the
influence of the gluteal muscle function, where more parts of the pathophysiological puzzle are
needed.
In general more than a single muscle is required to produce a joint moment and the joints
consequent movements. This is certainly the case when investigating a closed chain exercise,
such as squatting, walking and stair negotiation where multiple joints and consequently
multiple muscles are involved. However, a limiting factor in our understanding of movements
in general is that there is no consensus or good understanding on what is expected or ‘normal’
for a muscle or groups of muscles in a given task. Frequently the literature focusses on
manipulating the muscles and movements through various forms of therapeutic interventions
with little thought to what other muscle groups or structures have also been manipulated in the
process. To the authors knowledge no other work has considered the relative muscle activity
between PFP patients and non-symptomatic individuals, even though a plethora of work has
focussed on physical therapy treatments directed at these muscle groups (Crossley et al. 2002;
Sacco et al. 2006; Kaya et al. 2010). Further work should perhaps direct the focus to attempting
to understand, or at least consider, a more complex pattern of the involved muscle groups in
the lower limb, compare how they may differ across subject groups, how differing tasks can
influence the results and the important of measures other than amplitude or muscle onset
timing.
2.2.3 Motor Unit Measurement
Typical sEMG measurements provide gross information of the muscle behaviour in that the
represented signal is a composition of all the motor unit action potentials within the measured
area. It is suggested that this may not be sensitive enough to understand the intricate and
discrete changes in motor unit control that may be occurring. It has been reported that there
are many intrinsic and extrinsic factors that can affect the sEMG signal (De Luca 1997) with it
being demonstrated that different inter-electrode spacing and different electrode configurations
can have significant effect on the fidelity of the signal (De Luca et al. 2012). Although sEMG
can offer key insights into the muscle activity the extracted variables, the inferred outcome and
the consequent conclusions should be in consideration to the factors that can affect the fidelity
of the signal.

13
Another method of measuring the behaviour of the muscles involved in Patellofemoral Pain
and many other situations is through invasive EMG procedures, which is typically achieved
through inserting fine-wire into the muscle belly, where less signal fidelity problems arise.
Many investigators have applied the fine-wire EMG technique in an attempt access more
detailed information on the behaviour of individual motor units and consequently the behaviour
of the muscles in PFP patients (MacGregor et al. 2005; Mellor & Hodges 2005b; Mellor &
Hodges 2005a). The study of the individual motor unit action potentials (MUAPs) can provide
desirable information of the timing of their discharges, thus allowing a detailed description of
interpulse interval, firing rate and synchronisation characteristics (De Luca et al., 2006). From
a clinical perspective this could provide invaluable information regarding the control of the
muscles from the nervous system.
2.2.3.1 Anatomy and Physiology
In order to appreciate where the EMG signal originates, and remove any ambiguities, the
anatomy and physiology of the processes involved in the decomposition of an EMG shall be
covered in brief. The structural unit of a muscular contraction is the muscle cell or muscle
fibre, which are supplied by the terminal branches of one nerve fibre or axon. The neural
structure whose cell body is located in the anterior horn of the spinal cord, through its relatively
large diameter axon and terminal branches, innervates a group of muscle fibres. The term used
to describe the single smallest controllable muscular unit, is a Motor Unit (MU). The motor
unit consists of a single alpha-motoneuron, its neuromuscular junction, and the muscle fibres
it innervates (as few as 3, as many as 2000) (Basmajian & De Luca 1985). An illustration of
the relevant anatomy can be seen below in Figure 2-1.

14
Figure 2-1 Illustration of the anatomy and physiology of the motor unit
When an excitation occurs within the cell body it propagates down a motoneuron, down all the
branches and to all the muscle fibres that are connected together as a motor unit. Each of said
muscle fibres generate a force twitch, relative to the muscle fibre characteristics, and the motor
unit overall generates the motor unit force twitch. If the motor unit force twitches fire fast
enough and in close enough succession a tetanic force is produced, a process called tetanisation,
and the muscle produces a voluntary controlled force. Understanding and measuring the motor
unit functional characteristics is one of the most seductive muses of physiology, so that we
have a fuller understanding on force production and control from a muscle. However, the task
at hand has historically been a challenging one as has required using invasive methods to
directly measure the electrical potentials from within the muscle, and further complicated by
the very nature of a muscular contraction in that the motor units fire concurrently and thus
cause a superposition of motor units.

15
2.2.3.2 Decomposition Techniques
As first described by LeFever & De Luca (1982) the process of decomposing an EMG signal
into its constituent components is able to present information on the firing characteristics and
morphology of the MUs, consequently detailed information on the behaviour of the muscle.
The process is achieved by manually identifying individual MUAPs and allocating them, by
their shape and amplitudes, to a specific motor unit action potential train (MUAPT). Although
this process could provide a unique insight into the behaviour of the muscle its application is
limited. Due to the selective nature of the invasive detection electrode only a small number of
motor units could be detected, with 2-5 MUs typical for most measurements, which
significantly limits the representative information that can be gained from a muscle contraction
where hundreds of MUs could be active. A further limiting factor with invasive EMG
decomposition is that the signal becomes redundantly complex when the force contraction
increases, this is because the additional force the muscle requires to contract requires additional
motor units and their firing behaviour changes thus the superposition of the MUs becomes near
impossible to resolve in to the MUAPTs at all or with much confidence. Therefore the invasive
measurements have typically been conducted with low force levels (1-10 % MVC), which
again limits its application when larger force contractions are wanting to be explored. Another
pragmatic but important limitation is the measurement procedures whereby a needle or fine-
wire is required to be inserted into the muscle. This primarily brings about concerns with the
ethics and safety of the process, and secondary the physiological effect of inserting foreign
objects into the muscle belly and its potential for altering the behaviour. With the above points
in consideration, although invasive EMG decomposition offers detailed information about the
motor unit characteristics the relevance to the behaviour of a representation portion of the
muscle and at such low force levels should be considered whether it’s clinically applicable.
Decomposition of a surface EMG signal is an attractive notion that has been considered for
many years (Masuda et al. 1985), however the complexity of a sEMG signal with multiple
superimposed MUAPs and noise contamination make it a difficult task to resolve. Recent
developments towards a non-invasive surface EMG decomposition solution have shown
impressive results (De Luca et al., 2006) which are evolving (Nawab et al., 2010) to provide a
solution for investigating MU properties from the surface of the skin. Artificial intelligence
based algorithms have been developed (De Luca et al., 2006; Nawab et al., 2010), which can
automatically decompose sEMG signals from isometric contractions at force levels up to 100%

16
maximal voluntary contraction (MVC). Figure 2-2 below illustrates an overview of the method
behind decomposition a surface EMG signal and accessing the MU firing information. A
surface EMG sensor (see section 3.4.2.2 is placed onto the surface of the muscle whereby it
collects 4-channels of raw EMG data, after which it is processed by sophisticated algorithm
(see section 4.2 for details) and provides the firing characteristics of individual motor unit
action potentials.
Figure 2-2 Illustration of the process of decomposing the surface EMG signal
The advent of this technology has provided ground-breaking new insights into the hierarchical
control of the neuromuscular system, whereby it has been documented that, at any time and
force during voluntary constant-force contractions, earlier-recruited motor units maintain
higher firing rates than later-recruited ones, providing an inverse orderly hierarchy of nested
firing rate curves resembling the layers of the skin of an onion (De Luca et al. 2006). These
recent developments in the ability to decompose a sEMG signal up to a maximum contraction
and accurately observe high yields of motor units (typically 30-50 motor units) has provided
new information on the nervous systems hierarchical control of motor units. The surface EMG
decomposition outputs the firing instances and MU morphology which can processed to extract
information about the firing rate, MU recruitment and de-recruitments, morphological changes
in action potentials, correlations in MU firing, firing rate variability within and across MUs all
17
of which can be applied to a wide range of fields in exercise physiology, kinesiology, motor
control or rehabilitation. These variables can inform the researcher and clinician alike with
regards to the behaviour and control of the neuromuscular system, and potentially how we can
manipulate this to alter the force and consequent movements of the body. These insights
provide significant advances compared to the ability of exploring a normal sEMG signal for its
amplitude, timing or fatigue. The advances have led to a greater understanding in various
population groups and situations; during voluntary isometric contractions in non-symptomatic
individuals (De Luca & Contessa, 2012), in elderly subjects (Erim et al. 1999), during muscular
fatigue (Adam & De Luca, 2003; Contessa et al., 2009), strength training (Beck et al. 2011)
and stroke sufferers (Suresh et al. 2011).
The advantages of the ability to decompose a surface EMG signal are vast, but specifically the
ability to measure up to 60 MUs from a single contraction, with force contractions up to 100%
MVC and all from the surface of the skin far outweighs the aforementioned limitations of
invasive EMG decomposition methods. However, the measures extracted should be
contextualised within the validation and accuracy of the technology.
2.2.3.3 Surface EMG Decomposition Validity
As with any new technological and methodological advancement it quite rightly leads to
questions regarding the validity and accuracy, which have been raised within the literature
(Farina & Enoka 2011). In the landmark paper by Nawab et al. (2010) details of the surface
EMG decomposition algorithm are presented, along with a method to validate the output of the
motor unit firing instances described as the reconstruct-and-test procedure. Farina and Enoka
(2011) in a letter to the editor, firstly casted doubt on the ability of the decomposition algorithm
to resolve N overlapping action potentials due to the complexity of the signal segment.
Secondly, Farina and Enoka (2011) question the validity of using the proposed Reconstruct-
and-Test in evidence for the decomposition output. In their rebuttal, De Luca and Nawab
(2011) clearly demonstrate the misunderstanding and unsubstantiated arguments as proposed
by Farina and Enoka (2011), which is backed up by a host of technical peer-reviewed and
empirical evidence (Mambrito & Luca 1984; Lesser et al. 1995; Chang et al. 2008; Nawab et
al. 2009; Nawab et al. 2010; De Luca & Hostage 2010). In addition, the sEMG decomposition
algorithm (Nawab et al. 2010) has undergone significant independent validation and
verification of the technique and consequent output (Hu, et al. 2013a; Hu, et al. 2013b; Hu, et
al. 2013c). The substantial peer-reviewed publication, complimented by decades of internal
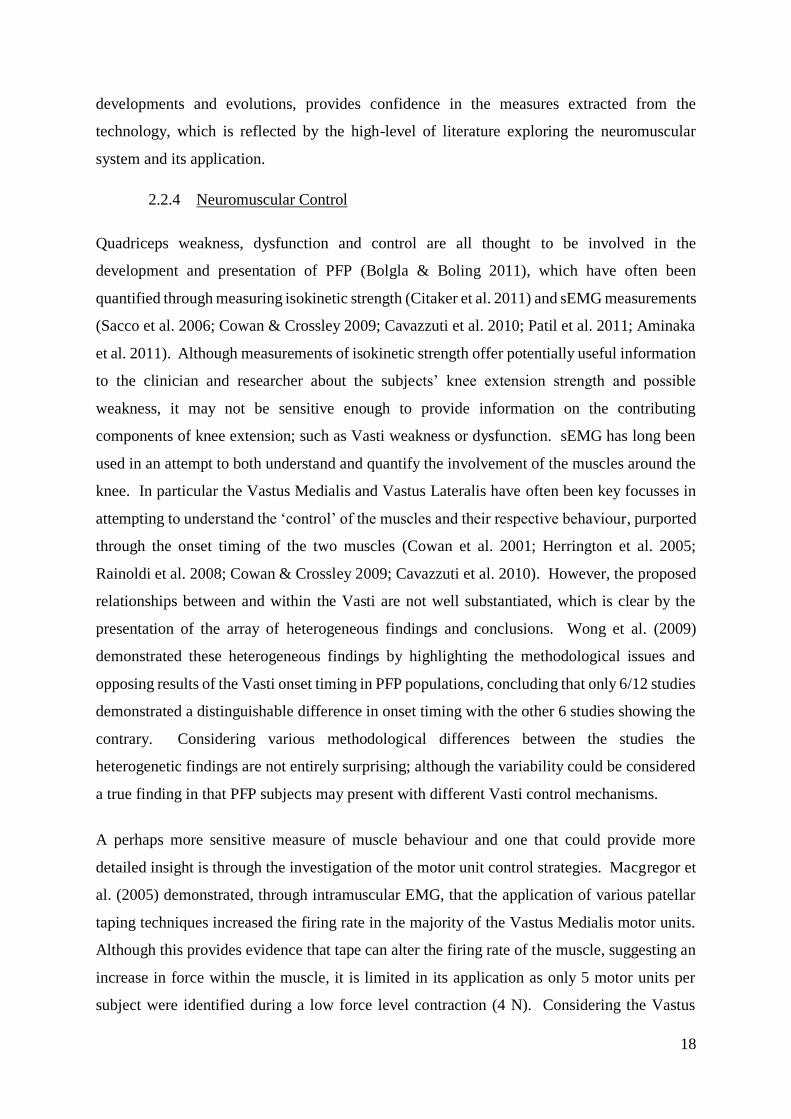
18
developments and evolutions, provides confidence in the measures extracted from the
technology, which is reflected by the high-level of literature exploring the neuromuscular
system and its application.
2.2.4 Neuromuscular Control
Quadriceps weakness, dysfunction and control are all thought to be involved in the
development and presentation of PFP (Bolgla & Boling 2011), which have often been
quantified through measuring isokinetic strength (Citaker et al. 2011) and sEMG measurements
(Sacco et al. 2006; Cowan & Crossley 2009; Cavazzuti et al. 2010; Patil et al. 2011; Aminaka
et al. 2011). Although measurements of isokinetic strength offer potentially useful information
to the clinician and researcher about the subjects’ knee extension strength and possible
weakness, it may not be sensitive enough to provide information on the contributing
components of knee extension; such as Vasti weakness or dysfunction. sEMG has long been
used in an attempt to both understand and quantify the involvement of the muscles around the
knee. In particular the Vastus Medialis and Vastus Lateralis have often been key focusses in
attempting to understand the ‘control’ of the muscles and their respective behaviour, purported
through the onset timing of the two muscles (Cowan et al. 2001; Herrington et al. 2005;
Rainoldi et al. 2008; Cowan & Crossley 2009; Cavazzuti et al. 2010). However, the proposed
relationships between and within the Vasti are not well substantiated, which is clear by the
presentation of the array of heterogeneous findings and conclusions. Wong et al. (2009)
demonstrated these heterogeneous findings by highlighting the methodological issues and
opposing results of the Vasti onset timing in PFP populations, concluding that only 6/12 studies
demonstrated a distinguishable difference in onset timing with the other 6 studies showing the
contrary. Considering various methodological differences between the studies the
heterogenetic findings are not entirely surprising; although the variability could be considered
a true finding in that PFP subjects may present with different Vasti control mechanisms.
A perhaps more sensitive measure of muscle behaviour and one that could provide more
detailed insight is through the investigation of the motor unit control strategies. Macgregor et
al. (2005) demonstrated, through intramuscular EMG, that the application of various patellar
taping techniques increased the firing rate in the majority of the Vastus Medialis motor units.
Although this provides evidence that tape can alter the firing rate of the muscle, suggesting an
increase in force within the muscle, it is limited in its application as only 5 motor units per
subject were identified during a low force level contraction (4 N). Considering the Vastus

19
Lateralis is thought to have approximately 300 motor units (Rich et al. 1998), this would mean
only a 1.7% representation of the muscle was measured and shown to increase the motor unit
firing rate by 1-2 Hz. The clinical significance of this change should be considered as such a
small representation of the muscle under investigation at a low level of force would not
demonstrate a ‘real-world’ situation. The motor unit firing rate, although a determinate of
producing force within the muscle (Burke 1981), does not provide a full description or
understanding of the control of the motor unit pool.
Motor unit synchronisation describes the greater than chance tendency for concurrently active
motor units to discharge within a few milliseconds of each other (Semmler et al. 1997), which
could offer insight into the control of a muscle. Mellor and Hodges (2005a) presented, through
intramuscular EMG and at low levels of force, that subjects with anterior knee pain may present
with a reduced motor unit synchronisation across the Vasti. However, it has been shown that
motor unit synchronisation can vary considerably and even within the same muscle (Bremner
et al. 1991). Although Mellor and Hodges (2005a) present an interesting finding of possible
strength and control dysfunction within anterior knee pain subjects, the relevance of a small
representation of the motor unit pool, low level force contractions and the variability of motor
unit synchronisation should be considered. The common drive, as first described by De Luca
et al. (1982), describes a remarkable and eloquent scheme of the nervous system to control
groups of the motor unit pool within and across muscles. The common drive can be observed
through simple observation of common fluctuating motor units, or in more detail by measuring
the cross-correlation of motor unit firings with essentially zero time shift. The common drive
has been reported in antagonist muscle groups (De Luca & Mambrito 1987), synergist muscle
groups (De Luca & Erim 2002), hand dominance (Kamen et al. 1992; Adam et al. 1998),
exercise training (Beck et al. 2011) and in ageing (Erim et al. 1999). The investigation into the
effects of ageing on motor unit control by Erim et al. (1999) presented an interesting finding
with the differences between young subjects and elderly subjects. The most striking finding
was that the elderly subjects demonstrated a decreased common drive, less commonality in
motor unit firings, compared to the young subjects. The diminished commonality suggests that
the ageing process significantly alters the control of the motor unit pool, presenting the first
evidence that the control of a muscle can be dysfunction or inefficient compared to a healthy
individual. The applicability of this method coupled with surface EMG decomposition
techniques could offer significant insight into the control of a muscle in PFP subjects.

20
2.2.5 Vastus Medialis Function
Since the seminal work of Lieb and Perry (1968) with the investigation into Quadriceps
function there has been a dogmatic and popularized view that the Vastus Medialis muscle is
two distinguishable muscles, the Vastus Medialis Longus (VML) and Vastus Medialis
Obliquus (VMO). Lieb and Perry’s (1968) investigations were comprised of applying tension
to the individual components of the Quadriceps, using external weights, on cadaver specimens
in an attempt to determine their individual contributions and function. The authors determinate
for Quadriceps function being open-chain knee extension in cadaver specimens. They found
that when applying tension to the proximal area of the VM it was able to both individually, and
as part of the Quadriceps group, perform knee extension. However, when applying tension to
the distal area of the VM it was unable to individually produce knee extension and the only
movement occurring was a medial shift of the patella. The authors inferred from these
observations that the VM should be considered in two anatomically and functionally differing
portions, namely the VML and VMO, which lay unchallenged and accepted for decades.
This debate, now spanning over four decades, has yet to reach an empirically led consensus.
Various arguments have been proposed for the existence of two distinct portions of VM with
the main topic areas concerning physiological and morphological differences, including: fibre
orientation, fascial planes and nerve innervation.
2.2.5.1 Fibre Orientation
Anatomists have documented the observation, through dissection, that the Vastus Medialis has
distinct differences in fibre orientation, decreasing in the obliquity from the most distal portion
to the most proximal portion of the VM as highlighted in a systematic review (Smith et al.
2009). It was found that there large variations in the reported orientation of the VM portions
with 40° to 77° and 11.5° to 35° for the distal and proximal portions respectively. However,
no study has found any correlation or suggestion that fibre orientation is associated with PFP
or degeneration, therefore the lack of clinical relevance to these findings should be considered
and emphasized.
2.2.5.2 Fascial Planes
As with fibre orientation, anatomists have explored cadaver specimens for the presence of
differing facial planes, potentially separating the Vastus Medialis muscle into two distinct

21
portions. The investigations have simply been made by observation and whether there was a
separate fascial plane present or not. Conflicting evidence for this has been presented with
Galtier et al. (1995) reporting no definitive separation of muscle portions of 44 cadaver
specimens, yet Javadpour et al. (1991) reported all 15 specimens had clear fascial separation.
The heterogeneous findings around the existence of VM fascial planes is further confounded
by the lack of evidence for its involvement in patellofemoral conditions.
2.2.5.3 Nerve Innervation
In addition to the aforementioned anatomical investigations, authors have investigated the
innervation characteristics of the VM. Smith et al. (2009) found that nerve innervation in the
VM had been investigated in 11 studies, summarising that 194 knees or 59% of the cohort
found a single nerve trunk and 135 or 41% found two nerve trunks. These mixed observations
were found in cadaver knees which were seemingly non-symptomatic with no observable
patellofemoral joint conditions. Galiter et al. (1995) also reported similar heterogeneous
observations within pathological specimens with 45% presenting with a single nerve branch
and 55% with two nerve branches. However, upon further exploration Galiter et al. (1995)
found a correlation between the degree of patellofemoral joint cartilaginous damage and the
presence of either one or two nerve branches, one nerve branch indicating the higher severity
of degeneration.
It could be concluded that the anatomical and morphological evidence is far from arriving at a
consensus as to whether we should consider the VM being two distinct portions, but perhaps
more worryingly is the lack of relevance or consideration to function and clinical application.
An important aspect that has yet to be addressed, is whether there is an actual functional
difference between the proximal and distal portions of the muscle. The neurophysiological
approach would suggest that muscle fibres are distributed evenly throughout the muscle
(Basmajian & De Luca 1985), and consequently so are the motor units, thus a single muscle
could be seen as one functional unit. However, there is currently no literature that has
adequately addressed the suggestion that the Vastus Medialis has different neuromuscular
control mechanisms for different areas of the muscle as has been previously inferred from
anatomical studies. The current investigations have however highlighted the importance of
understanding the disparity in its findings which has, and does, consequently affect clinical
understanding and reasoning for patellofemoral pain and similar conditions.

22
2.3 Pathomechanics
The anatomical and morphological characteristics of the tibiofemoral and patellofemoral
osseous and soft tissue structures are comprehensibly documented in a plethora of texts, which
would far excel any attempts made in this thesis. Therefore this chapter shall instead focus on
presenting the pathological background and current understanding of PFP.
2.3.1 Background
There exists a remarkably delicate and yet beautiful evolutionary relationship between the flat
triangular patella bone, the femoral condyles and the surrounding soft tissue structures that
combined form the Patellofemoral Joint (PFJ), having key responsibilities in the knee and
lower limb functionality. The PFJ has been reported to be responsible for quadriceps
efficiency, centralising quadriceps forces, transmitting femoral forces, functioning as a bony
shield, and even providing a cosmetic appearance to the knee (Aglietti & Menchetti 1995).
However, for numerous purported reasons these responsibilities and relationships seemingly
become dysfunctional and individuals experience pain in and around the patella.
2.3.2 Patella Mechanics
There is a deep and extensive literature base for the purported role of the patella, which has
been likened to the mechanical components of a lever with a balance beam, fulcrum, load and
effort (Richards 2008). In the first attempt of understanding the contact zones of the patella,
Wiberg (1941) demonstrated that as the knee moved from extension to flexion the band of
contact moved proximally from the pole towards the base of the patella, which was also later
shown by Fulkerson and Shea (1990). The effect and importance of the contact zone moving
has shown that at knee flexion angles of less than 60 degrees the quadriceps lever arm holds a
mechanical advantage, yet at angles greater than 60 degrees it works at a mechanical
disadvantage (Nissel & Ekholm 1985; Gill & O’Connor 1996). This phenomenon was also
demonstrated in healthy individuals during a step descent, where at 61 degrees there was a
dramatic loss of eccentric control (Selfe 2000), also later shown in PFP subjects at 58% (Selfe
et al. 2001), which demonstrates that the symptomatic individuals may have a more
dysfunctional Patellofemoral control mechanism.

23
2.3.3 Patella Tracking
The long standing and relatively unchallenged theory for the main contributor to PFP is the
abnormal tracking of the patella within the trochlear groove (Fulkerson & Shea 1990;
Fulkerson 2004), including static and dynamic components. Grelsamer (2005) describes the
abnormal positioning of the patella in any plane as ‘patella malalignment’, and an abnormally
positioned patella at one or more points in the flexion-extension cycle as ‘patella maltracking’.
The dynamic pathway of the patella within the trochlear groove comprises of a delicate
articulation between the medial and lateral facets of the patella and the medial and lateral
condyles of the femur. The articulation being far from a simple flexion-extension pathway
involves spin, tilt and glide within a multi-degrees of freedom movement of the patella, thus
becomes difficult to objectively measure, and even more challenging to measure clinically.
Evidence for patella malalignment first surfaced 40 years ago with Merchant et al. (1974), who
did not actually study PFP patients, this was then followed up with similar findings from Laurin
et al. (1978) and Agiletti et al. (1983) who all used various static radiographic methods in an
attempt to substantiate differences in patella malalignment between non-symptomatic and
symptomatic subjects. The use of radiographic has since been shown to be an insensitive and
unreliable method in investigating patella alignment (Muhle et al. 1999); instead more recent
works have explored patella alignment using MRI. McNally et al. (2000) demonstrated that
more subjects in the non-symptomatic group (63%) presented with lateral patella displacement
compared to the symptomatic group (57%), thus suggesting that these measures, even during
non-stability challenging or non-clinically relevant tasks, are unable to distinguish non-
symptomatics and symptomatics individuals. An evolution of imaging, explicitly dynamic
MRI, has shown to be sensitive when measuring change in the position of the patella with the
application of the McConnell taping technique (Derasari et al. 2010); suggesting that the patella
is shifted inferiorly in response to tape. However, limitations remain with the fact that these
techniques are difficult to access, operate and interpret the results requiring both opportunity
and significant expense. But perhaps more importantly and often not explicitly stated is the
lack of functional relevance with the low loading and open kinetic chain activities performed
and thus the context of the findings should be considered as to their clinical relevance.

24
2.3.4 Tibiofemoral Mechanics and Control
A well-established avenue to investigate has been the study of 3-dimensional tibiofemoral
kinematic and kinetic joint mechanics in symptomatic subjects (Salsich et al. 2002; Richards
et al. 2008; Selfe et al. 2008; Paoloni et al. 2010; Selfe et al. 2011) through the use of
optoelectronic stereophotogrammeric technology; commonly referred to as motion capture
(Cappozzo et al. 2005). Numerous investigators have explored the knee joint kinematics and
kinetics in a PFP population, which have often reported conflicting evidence. Nadeau et al.
(1997) demonstrated that in just 5 symptomatic subjects there was a significant reduction in
knee flexion angle compared to the 5 non-symptomatic subjects whilst walking down a 9 metre
walkway, measured using a video camera sampling at 30 Hz. These results were then reported
to demonstrate a strategy to avoid quadriceps contraction, even though no muscle
measurements were made. The small sample size, limited technology and discrete results from
the sagittal plane question the applicability of this work. Similar work and methods were in
agreement that the knee flexion angle was differing in symptomatic subjects (Dillon et al.
1983). However, in opposition to these findings it has been reported that there are no changes
in knee flexion angle in symptomatic individuals during gait (Heino & Powers 2002; Powers
et al. 1999). . However, investigating the sagittal plane knee mechanics during step ascent and
descent in symptomatic individuals has been able to exhibit some significant changes (Crossley
et al. 2004; Brechter & Powers 2002; Aminaka et al. 2011; Salsich et al. 2001) reporting lower
knee flexion angles and moments. The reported reduced knee flexion is often described as an
altered strategy or a load re-distribution amongst symptomatic subjects; as such are presenting
with a different control mechanism or response. However, these studies did not compliment
the joint biomechanics measurements with EMG and therefore the justification of such
conclusions are questionable. Regardless of the evidence presented about the knee flexion
angle during gait the results should be placed in context to the condition under investigation,
PFP, which has been reported for many years being exacerbated under more significant loads
such through activities such as stair ascent and descent or running. It is thought that the load
exerted by walking upon the PFJ is not sufficient enough to reveal consistent biomechanical
changes, which may explain the aforementioned conflicting work. Researchers within the field
face the problem as to how define the activities that may be functionally relevant to PFP
patients and at the same time sufficiently challenge the dynamic stability of the joint. To add
further frustration and difficulty with this goal the activities should avoid inducing pathological
overload with consequent risk of injury. Instead it is suggested that stair ascent and descent

25
will serve as more appropriate means of eliciting changes since the activity loads the PFJ to a
greater degree (Costigan et al. 2002). In the past decade there has been an increase in the
investigations that are exploring the variables associated with eccentric control during step
descent (Crossley et al. 2002; Crossley et al. 2004; Nijs et al. 2006; Gilleard et al. 1998; Salsich
et al. 2001; Selfe et al. 2001; Selfe 2000; Selfe et al. 2008; Richards & Selfe 2011). The
eccentric control required during a step descent provides an additional challenge compared to
step ascent and significantly difference to low load activities such as gait. During stair descent
the centre of mass is carried forwards and then gravity is resisted during the controlled lowering
phase, this is achieved through eccentric muscular contraction controlling the rate of lowering
of the centre of mass. In the absence of strong eccentric muscle activity around the knee and
other structures, the centre of mass would accelerate due to gravity. In addition during the
controlled lowering phase the knee joint starts from a relatively stable extended position and
flexes, towards an increasingly unstable position (Selfe et al. 2008). The increased joint flexion
causes a progressive increase in the external flexion moment which is matched by progressively
increasing eccentric muscle contraction, in order to prevent medial collapse that is seen as
detrimental to the optimal patella contact zones due to the cam shape of the femoral condyles.
This causes the patella tendon lever arm to lengthen and the quadriceps lever to shorten. The
effect of the moving contact zone is significant; at angles of less than 60 degrees knee flexion
the quadriceps lever arm works with a mechanical advantage, however, at angles of greater
than 60 degrees knee flexion the quadriceps work at a mechanical disadvantage (Nissel &
Ekholm 1985; Gill & O’Connor 1996). Achieving this level of knee flexion in gait is not
possible and therefore the use of gait to investigate the control of the knee joint and specifically
within PFP research may not be an appropriate task or measure to take In conclusion, measuring
the sagittal plane the authors infer that the knee is a simple flexion-extension mechanism and
seemingly not considering the other planes of motion at the knee, the coronal and transverse
planes, for their importance and contribution to the control of the knee.
Several researchers have however highlighted the importance of studying the coronal and
transverse planes of motion when investigating the knee joint mechanics (Kowalk et al. 1996;
Selfe et al. 2008; Karamanidis & Arampatzis 2009; Paoloni et al. 2010; Selfe et al. 2011).
Kowalk et al. (1996) were the first to propose the importance of investigating the abduction-
adduction knee moments, reporting that although the sagittal plane moment are important for
propulsion the coronal plane plays a vital role in the medio-lateral stability of the knee.
Following on from this Selfe et al. (2008) eloquently presented that not only was the coronal

26
plane demonstrating a significant role in the control of the knee during a slow step descent, but
the transverse plane was also significantly involved. An equally important finding from this
work was that it was shown that clinical interventions, neutral taping and a soft brace, could
offer clinically meaningful alterations to the coronal and transverse planes. Selfe et al. (2008)
reported significant reductions in the maximum coronal plane knee angle from 10.7 degrees to
8.1 degrees in the neutral taping condition and further reductions in the soft brace to 5 degrees,
these changes were also mimicked in the reduction in coronal plane knee moment from 0.39
Nm/kg to 0.36 Nm/kg in the taping condition and 0.24 Nm/kg with the soft brace condition.
Similar changes were also later demonstrated in a Patellofemoral Pain population (Selfe et al.
2011). These findings demonstrated that common clinical interventions, tape and bracing, can
offer significant and clinically important changes in control. However, it should be noted that
although changes were statistically significant there were large standard deviations in both knee
angle and moment, which could indicate that some subjects present with a different response
or strategy. Movement control changes in the coronal and transverse plane have also been
observed in the work of Paoloni et al. (2010) where PFP subjects displayed significantly higher
knee abductor and external knee rotator moments in gait loading response compared to non-
symptomatic individuals. It was suggested, although not measured, that this was due to a
dysfunction between the Vastus Medialis and Vastus Lateralis and/or a delayed Vastus
Medialis activation. In knee osteoarthritis similar differences can be seen in the coronal and
transverse planes between elderly and young subjects (Karamanidis & Arampatzis 2009)
during stair ambulation, with elderly subjects demonstrating significantly higher adduction and
internal rotation at the knee joint. These findings were reported to present a re-distribution of
the mechanical load in the elderly subjects and seemingly offer different strategies in
negotiating a stability challenging task compared to younger subjects.
In addition, and complimentary, to exploring the step tasks there have been a wealth of research
using squatting exercises to challenge the motor control system and investigate the mechanical
and muscular changes that occur between patient groups. The squat exercise, in all of its
variations, is an integral part to the majority of strength and conditioning programs for its
ability to strengthen multiple large muscle groups. Equally as important is the application of
this exercise within rehabilitation as can be reflected by the volume and variety of
investigations exploring its use (Lutz et al. 1993; Ohkoshi et al. 1991; Shelbourn & Nitz 1990;
Stuart et al. 1996; Yack et al. 1993; Richards et al. 2008; Mostamand et al. 2011; Clément et
al. 2014; Noehren et al. 2012; Wilson et al. 2009). Squatting activities replicate daily function

27
tasks such as; sit-to-stand, kneeling, stair ascent/descent etc., and offer a stability challenge to
the patient so is often a preferred exercise for measurement and quantification as well as the
rehabilitation protocol itself. The biomechanics of a squat is a complex combination of
multiple joints, muscles and tendons all which interact in an attempt at producing a smooth
generation of force and maintain the body in a stable and aligned position. To manipulate the
contribution of the muscles, joints and tendons many different variants of squatting are
employed; double limb, single limb, body weight, barbell weighted, inclined squats, declined
squats, mini squats, deep squats, wide stance squats and even more to create an exhaustive
variant list. However, for the application within PFP research there has been a focus on the
use of the single limb (Richards et al. 2008) or quasi-static squats (Clément et al. 2014) which
provide a stability challenging task involving the lower limb and specifically the knee and its
surrounding structures. The basic principle of a squat is that as the knee angle increases the
ground reaction force becomes distanced from the knee joint, moving the centre of pressure in
the posterior direction, and thus an increased knee extensor joint moment and consequently an
increase in the knee extensor muscles and patellofemoral joint reaction forces (Richards 2008).
Within clinical practice therapists either increase the load at the knee joint in order to stimulate
a quadriceps dominant exercise or decrease the load of the knee joint and consequent
Quadriceps loads. It has been shown this can be altered by performing the squat on a decline,
whereby the increase in decline angle increased the knee joint moment whilst decreasing the
ankle joint (Richards et al. 2008). As previously highlighted the flexion movements may not
be the clinically relevant measure to extract for the PFP population, where there has been a
focus on the ‘control’ element by studying the medio-lateral and rotational movements.
However, to the authors knowledge there is no literature focussing on these movement
variables during squatting tasks, Clément et al. (2014) designed an appropriate study using 3-
dimensional kinematic analysis and investigating the differences between a quasi-static and
fast single limb squat however only studied the flexion angles, velocities and vertical ground
reaction force thus not describing suggestively useful information about the medio-lateral and
rotational control.
Control and stability, measured by studying discrete and subtle coronal and transverse plane
joint mechanics, has been shown to be different amongst different subject groups and their
response to a clinically orientated intervention. However, these findings can only speculate on
the underlying mechanisms as they lack the investigation of seemingly important sensory-
motor control process such as the neuromuscular and psychosocial factors.

28
2.4 Psychosocial Involvement
Historically, movement control and related disorders have been questioned through mechanical
and neuromuscular measurements with less consideration to the psychosocial features.
However, it has been shown that psychosocial elements, in-particular pain and fear of pain, can
have distinct and significant influences on motor control (Lethem et al. 1983).
2.4.1 Pain and Movement Control
Despite the extensive history in exploring the mechanisms and understanding of pain, dated
back to the early systemic work of Descartes (1662), a comprehensive understanding continues
to elude researchers. As defined by the International Association for the Study of Pain (IASP)
pain can be described as:
“An unpleasant sensory and emotional experience associated with the actual or potential
tissues damage, or described in terms of such damage” (Merskey & Bogduk 1994).
The generality in the very definition of pain is mimicked by the disparity and vagueness of pain
reported clinically with PFP subjects, most likely due to the subjective nature of pain. The
patella maltracking theory suggests that the abnormal tracking of the patella changes the
contact zones and thus causes a noxious stimulus (Fulkerson 2004), which is then subjectively
and individualistically inferred as pain by the patient. Various classification tools have been
used by researchers and clinicians in the study of PFP to determine the level of pain patients
experience and the response from a clinical intervention (Crossley et al. 2004; Van Tiggelen et
al. 2009; Tucker & Hodges 2010; Kaya et al. 2010; Salsich et al. 2012; Papadopoulos et al.
2014; Ferrari et al. 2014). Smart et al. (Smart et al. 2012) interestingly demonstrated that
symptomatic features rather than clinical signs were more useful for identifying nociceptive
pain, which indicates that subjectively orientated tools, as used in the previous PFP research,
are sensitive and useful at determining the pain experienced. This is in agreement with Stinson
et al. (2006) and Pagé et al. (2012) who demonstrated the validity of using the Numerical Rating
Scale (NRS) as a measure of pain intensity and unpleasantness.
It was first proposed by Melzack and Wall (1965) that pain experience was jointly determined
by physiological, motivational, cognitive and emotional responses. The process arguably
revolutionised pain research with a multi-dimensional concept, which has consequently been
furthered by Melzack (1999 and 2001). The premise that pain and movement are inter-related

29
is now a well-established phenomenon, yet remarkably poorly understood or misinterpreted,
which is evident by the various theories of pain and the body’s response and adaptation to pain.
The Vicious Cycle theory (Roland 1986) proposes that all muscles stereotypically will increase
their activity in response to pain or pain within the region, which is in complete opposition to
the later proposed Pain Adaptation theory (Lund et al. 1991). The pain adaptation theory
instead suggests that the activity of the muscle that is painful or produces a painful voluntary
contraction is stereotypically inhibited. However, two of the major limitations are that the
majority of the experimental and clinical findings are inconsistent with the proposed theories
and secondly that the evidence between the theory and rehabilitation is weak (Hodges 2011).
In opposition to the theories propositions, Holroyd et al. (1984) stated that clinical
improvements were reported but with no evidence of associated change in muscle activity,
therefore perhaps suggesting that cognitive processes may be involved in the presentation and
rehabilitation. Hodges and Tucker (2011) propose a new theory in attempt to explain the
adaptation to pain, arguing that pain is distributed within and between muscles rather than a
stereotypical inhibitory or excitatory response from the muscles. This theory has recently been
complimented with empirical evidence (Hodges et al. 2013) demonstrating that in most
individuals’ acute lower back pain leads to an increased spinal stability and that patterns of
muscle activity are not stereotypical, but instead present with individualistic responses.
2.4.2 Conscious Processing
Lethem et al. (1983) had previously proposed that pain and ‘fear of pain’ may generate, in
some individuals, a strategy to either avoid or confront a painful situation thus suggesting
conscious aspects of movement may influence a musculoskeletal pain response. Masters and
Maxwell (2008) proposed the theory of re-investment, furthering developing the concept of
conscious involvement of movement. The theory of re-investment suggests that individuals
present conscious aspects in the execution and control of a movement, which may be altered
in certain populations and disrupt optimal performance or execution. Selfe et al. (2014) in a
cross-sectional study of pain free and self-reported knee pain subjects found that symptomatic
subjects had a higher conscious motor processing score on the Movement Specific
Reinvestment Scale (MSRS) (Masters & Maxwell 2008) compared with people who are pain
free. For the first time this showed that subjects with self-reported knee pain have a propensity
to consciously control their movements, meaning they were more likely to be concerned with
the execution and control of their movements. These findings may suggest that there could be

30
a disruption in the effective automatic control processes (Masters & Maxwell 2008), which has
also been seen with a higher falls incidence in the elderly (Wong et al. 2008) and movement
impairments in stroke subjects (Orrell et al. 2009). These findings are similar to the previous
propositions that individuals may display different psychological traits and responses to pain
or the fear of pain, with extreme examples described as being ‘confrontation’ and ‘avoidance’,
although likely a mixture of the two (Lethem et al. 1983).
The conscious motor processing and experience of pain have been shown to play important
roles, although perhaps not causative factors in developing or worsening symptoms, in PFP
and should perhaps be a point of consideration and reflection during investigations of the
complex sensory-motor processes.

31
2.5 Therapeutic Interventions
Since the landmark paper by McConnell (McConnell 1986) there has been an exponential rise
and popularity in the application of patellar taping for the treatment and management of PFP.
McConnell (McConnell 1986) described the application of rigid tape across the patella with
various alterations of the position of the patella in the process, including; patella tilt, patella
spin and patella glide. It was originally proposed that the tape application, particularly the
medial glide aspect, may adjust the tracking of the patella within the femoral groove and the
Vastus Medialis resumes its responsibility acting as a medial stabiliser (McConnell 1986).
These postulates have been explored through radiographic investigations, demonstrating that
there may be some evidence of an altered patella position with the application of tape (Bockrath
et al. 1993; Larsen et al. 1995; Somes et al. 1997). However, the radiographic findings do not
directly confirm the original thought of a mechanical shift, as the shift in the patella position
could be due to various other mechanisms; such as a change in Vasti muscle activity
distribution and control. Opposing evidence for the mechanical effect of patellar taping can be
found in the work of Selfe et al. (2008 and 2011). It was found that adhesive tape placed over
the patella, with no stretch or patella glide, could significantly reduce the mediolateral and
rotational joint moment. These findings suggest that the application of a neutral tape can
significantly improve the stability of the knee joint in both healthy and PFP subject, suggesting
that tape may offer a proprioceptive effect. It has previously been demonstrated that subjects
with poor proprioceptive ability, as measured by active and passive ankle reproduction, can
benefit from the application of tape with an enhanced proprioceptive status (Callaghan et al.
2002). The detailed review of Crossley et al. (2000) suggests that tape demonstrates sporadic
yet unexplainable clinical success in reducing pain and improving function in PFP subjects,
concluding that more studies should explore the Vasti motor control system in functional tasks.
Complimentary to the observed changes in joint mechanics and angle reproduction with the
application of tape, significant changes have been demonstrated with brain activity in response
to clinical interventions (Thijs et al. 2010; Callaghan et al. 2012). Thijs et al. (2010) using
functional magnetic resonance imaging (fMRI) investigated levels and areas of brain activation
with a knee brace, knee sleeve and without any application. It was found that higher levels of
cortical activation were present with the application of the two interventions. Similar findings
were later found by Callaghan et al. (2012) with a taping intervention, where significant
increase in blood oxygenation level-dependent (BOLD) were found in the taped condition.

32
Both of these studies present evidence suggesting that a peripheral proprioceptive intervention,
such as tape or knee braces, influence brain activity in areas of the brain thought to be
responsible for proprioception. These findings coupled with previous work investigating the
changes with joint mechanics, gross muscular changes and conscious motor processing
involvement suggest that tape and other proprioceptive orientated interventions are capable of
modifying the sensory-motor processes but still lacks information on the mechanisms of force
and control.

33
2.6 Somatosensory Input
The somatosensory system, a complex scheme of sensory receptors and neurons, provides
crucial information about the external environment and our bodies interactions with it;
including information on position and movement (proprioceptors), skin stimuli (cutaneous
receptors) and pain (nociceptors). The sensory receptors and neurons reside within the
periphery such as the skin, muscle, tendons and joints with deeper neurons within the central
nervous system, and both the central and peripheral systems being delicately entwined and
majestically controlled. The eminent neurophysiologist, Sir Charles Sherrington, was the first
to introduce the concept and term ‘The Proprioceptive System’ in 1906 describing it as being
a group of varied sensory receptors to give the body the ability to sense position of self and
movement (Burke 2007).
Therapists often aim to enhance the patients’ movement and reduce pain through manipulating
the somatosensory inputs in a wide range of musculoskeletal and neurophysiological
conditions. The method of the sensory manipulation has been addressed in various ways (joint
mobilisations, movement re-education, medication, injection therapy etc.) but with no direct
measurement of the sensor receptor activity feasible then therapists and researchers alike rely
on indirect measures such as joint position sense, clinical questionnaires and scores, patient
perceived benefit, measures of movement control or muscle behaviour. Taping of the joint has
been used across many clinical populations as a way of supporting and enhancing the
movement control in patients and specifically in Patellofemoral Pain patients, as discussed in
section 2.5, for which proprioception has been inferred to be the mechanism behind the
observed changes. There have been a plethora of studies demonstrating significant changes
with the application of tape to the ankle on ankle proprioception (Karlsson & Andreasson 1992;
Robbins et al. 1995; Heit et al. 1996; Simoneau et al. 1997) showing enhanced movement
control and recovery. This is similar to the work described in section 2.5 for PFP patients
showing the effects of joint taping or similar proprioceptive orientated interventions (Tubigrip,
soft braces, non-adhesive bandages etc.), which have been suggested to provide a
proprioceptive enhancement and perhaps through cutaneous stimulation. Murray & Husk
(2001) describes tape causing an increase in proprioception through increased stimulation to
cutaneous receptors, although measured indirectly. Grigg (1994) suggests that applying
pressure to, and stretching the skin can stimulate cutaneous receptors, and that the sense of
stretching is thought to possibly signal information of joint movement or joint position.
Furthermore, it has been stated that cutaneous receptors might play a role in detecting joint

34
movement and position resulting from the stretching of skin at extremes of motion, much like
joint mechanoreceptors (Riemann & Lephart 2002). While the exact role of cutaneous
receptors is still under discussion, it has become evident they may signal joint movement and
to some extent joint position (Simoneau et al. 1997).
The changes in joint position and control through varying proprioceptive orientated
interventions come about due to the muscle behaviour controlling the kinematic adjustments,
so investigations into the muscle activity have been explored to try and understand the effects
of proprioception. Selkowitz et al. (2007) found decreased upper trapezius activity and
increased lower trapezius activity in people with suspected shoulder impingement with tape
applied to the shoulder joint. In opposition to these findings Alexander et al. (2003), using a
scapular taping technique on healthy individuals, found a decreased amplitude of the lower
trapezius H-reflex, and suggesting an inhibitory influence of taping. But again in opposition to
previous work Cools et al. (2002) found no significant differences between scapular taping and
no taping for the upper, middle, and lower trapezius, and the serratus anterior. These previous
works have investigated ‘gross’ muscle activity through simply investigating the amplitude of
the signal, which arguably may not offer enough sensitivity or with enough confidence the
changes in the muscle behaviour. Macgregor et al. (2005) explored the motor unit firing rate,
using invasive EMG methods, to establish the effect of a taping intervention on the Vasti
muscles. The authors used three different applications of tape by varying the direction of
stretch across the patella and recording the motor unit firing rate, documenting that although
there was not a net increase in the firing rate the majority of the motor units in the Vastus
Medialis increased their firing rate during the lateral stretch with no change in the Vastus
Lateralis. The effect between a cutaneous afferent stimulation has also been seen previously
(McNulty et al. 1999) whom demonstrated that firing of a single cutaneous afferent influences
muscle activity in the hand. Interestingly not just the firing rate of the motor units have
demonstrated a change to a cutaneous stimulation as Garnett and Stephens (1981) found a
change in the order of the motor unit recruitment in the dorsal interosseous muscle during
cutaneous stimulation of the hand. The underlying mechanism for the apparent modification
are unable to be expressed definitively, however it has been deduced that the application of the
tape could be presenting a form of feedback to the muscle, most likely the through the muscle
spindles (De Luca et al. 2009), which both the central and peripheral nervous systems alter the
motor unit pool by adjusting the force and its control within the muscle that may consequently
adjust the joint mechanics.

35
These works have demonstrated that there exists some significant changes in the muscle
behaviour with proprioceptive orientated interventions, excitingly suggesting that taping may
adjust muscle activity via proprioceptive feedback, a sensory modality allowing a person to
identify the position of a limb in space and perceive limb motion. However there is still a lack
of consistent and clear understanding on the responses and/or a fuller description on other
involved changes such as the joint mechanics and psychosocial elements.
2.7 Summary
Previous investigations have found significant and clinically important changes in the joint
biomechanics, psychosocial factors, brain activity and gross neuromuscular activity yet there
is a lack of conclusive understanding on the motor unit behaviour within a Patellofemoral Pain
population and the efficacy of a tape intervention (Figure 2-3). A contributory limiting factor
may also be that most investigations have studied these sensory-motor processes in isolation
opposed to a complex yet desirable inter-disciplinary approach. This study aims to provide a
unique and multifaceted investigation into the motor unit control, biomechanical,
neuromuscular and psychosocial factors in understanding the movement control of
Patellofemoral Pain subjects and the response to a common clinical intervention.

36
Ventral
Horn
sEMG
Muscle Behaviour
Joint
Biomechanics
Motor Unit
Behaviour
?
Central Nervous
System
Muscle Spindles
Free Nerve
Endings
Figure 2-3 Graphical representation of motor control systems
Steven
Stamp

37
2.8 Study Aims and Objectives
2.8.1 Aim of MPhil
To investigate the neuromuscular and biomechanical control of the knee joint and the response
of a taping intervention within a non-symptomatic population.
2.8.2 Objectives of MPhil
2.8.2.1 To develop methods in order to capture a host of neuromuscular and
biomechanical measures that are appropriate and relevant for
Patellofemoral Pain.
2.8.2.2 To determine the mechanical control of the knee joint during a stability
challenging task and the response of a taping intervention.
2.8.2.3 To explore the motor unit behaviour using new and existing methods of
non-invasive surface electromyography and the response of a taping
intervention.
2.8.2.4 To measure the muscular control of the knee joint during isometric and
stability challenging tasks and the response of a taping intervention.

38
2.8.3 Aim of PhD
To investigate the neuromuscular, biomechanical and clinical changes associated with control
of the knee joint on Patellofemoral Pain patients and the response of a taping intervention.
2.8.4 Objectives of PhD
2.8.4.1 To determine the mechanical control of the knee joint during a stability
challenging task with patellofemoral pain patients and the response of a
taping intervention.
2.8.4.2 To determine the muscular control of the knee joint during a stability
challenging task with patellofemoral pain patients and the response of a
taping intervention.
2.8.4.3 To determine the clinical, neuromuscular and biomechanical effects of a
taping intervention on patellofemoral pain patients.
2.8.4.4 Explore the differences in the control between the non-symptomatic
participants and patellofemoral pain patients.
2.8.4.5 Explore the relationships between clinical outcomes, neuromuscular and
biomechanical control with a taping intervention applied.

39
3. General Methods
3.1 Introduction
To measure and explore the detailed yet discrete control mechanisms of the neuromuscular and
biomechanical system a battery of objective measures associated with PFP were required. The
study design consequently employed the use of four separate measurement tools: kinematics,
kinetics, surface EMG and surface EMG decomposition. This required a combination of
integration and synchronisation techniques, all presenting technical challenges due to the
variety of data types, connection options, synchronisation delays and sampling frequencies.
The following section provides a technical summary of the equipment and the techniques used
throughout the thesis.
Chapter Outline
- Stating the type of equipment employed (3.2)
- Describing and justifying the sampling frequencies of the equipment (3.3)
- Pertinent information relating to the surface EMG setup (3.4)
- Pertinent information relating to the kinetic and kinematics setup (3.5)
- Pertinent information relating to the surface EMG decomposition setup (3.6)
- Integration and synchronisation methods (3.7)
3.2 Equipment Used
3.2.1 Surface EMG Decomposition System
The Delsys Surface EMG Decomposition system (dEMG, Delsys Inc., Boston, MA) (Figure
3-1) is a surface EMG decomposition system that uses 5-pin array sensor collecting 4 channels
of single differential surface EMG data.
Figure 3-1 The Delsys dEMG system

40
3.2.2 Surface EMG System
The Delsys Trigno Lab system (Delsys Inc., Boston, MA) (Figure 3-2) is a wireless EMG
system that uses a single differential electrode configuration to detect the electrical signals from
the surface of a given muscle.
3.2.3 Motion Capture System
The Qualisys passive motion capture system (Qualisys Medical AB, Gothenburg) (Figure 3-3)
uses high quality two dimensional (2-D) digital cameras, which emit short infrared pulses. The
infrared pulses are reflected back into the camera after hitting retro-reflective markers, which
are placed upon a subject.
Figure 3-3 The Qualisys Oqus 310 camera series
Figure 3-2 The Delsys Trigno EMG system (left) and the Delsys Trigno EMG sensor
(right)

41
3.2.4 Force Platform
The AMTI BP400600 (Figure 3-4) (Advanced Mechanical Technology Inc., Boston, MA)
force platforms are strain gauge platforms utilising the principle of strain, a ratio of changes
between original dimensions and the deformed dimensions (Richards 2008).
60cm
Figure 3-4 AMTI BP400600 Force Platform imbedded in the laboratory floor

42
3.3 Sampling Frequencies
In contemporary analyses and applications of many physiological and biomechanical signals,
such as sEMG or motion capture data, computers and their algorithms are required. The
algorithms necessitate that the signals are expressed in numerical sequences. The process of
converting the detected analog signals into the numerical sequences is called analog-to-digital
(A/D) conversion, generating a sequence of numbers where each number represents the
amplitude of an analog signal at a specific time point. The consequent number sequence is
then called a digital signal, the analog signal is then said to be ‘sampled’. The process of
digitising a signal is defined by the concept of the sampling frequency, which plays a critical
role in providing an accurate and reproducible representation of the sampled signal.
Selecting the sampling frequency is dependent on various factors, two of the main factors
being; Nyquist Theorem and the type of activity being measured. Nyquist Theorem (Shannon
1948) states that the sampling frequency should be at least twice the highest frequency
component being measured in order to accurately reconstruct the signal. Therefore it is
important to consider the type of activities being captured to establish the highest frequency
component and the consequent minimum frequency. Throughout this thesis the tasks
performed are comprised of low frequency sagittal plane movements, which are coupled with
higher frequency coronal and transverse plane movements. Although the movements are only
semi-dynamic the sampling frequencies need to reflect all the discrete components of the
movements.
3.3.1 dEMG Sampling Frequency
In order to decompose the sEMG signal into its constituent MUAPs the sampling rate is
required to be significantly higher than traditional sEMG data collection, as MU shapes
discrimination needs a high volume of data points, therefore a sampling frequency of 20,000
Hz is recommended (Nawab et al. 2004).
3.3.2 sEMG Sampling Frequency
Frequency content of sEMG signals can be up to 400 Hz (Basmajian & De Luca 1985).
Therefore to abide by Nyquist Theorem, sampling at no less than twice its frequency, the sEMG
signal should be sampled at a minimum of 900 Hz to avoid aliasing of the signals. The sEMG

43
was sampled at 2000 Hz, the same frequency as the kinetic data as both systems were integrated
into the same A/D board.
3.3.3 Kinematic Sampling Frequency
Selfe et al. (2008 & 2011) whom were investigating the discrete coronal and transverse plane
movements in slow controlled sagittal plane movements utilised a 100 Hz sampling frequency
for kinematics. Therefore a sampling frequency of 200 Hz will provide a highly accurate
representation of the desired kinematic data.
3.3.4 Kinetic Sampling Frequency
Selfe et al. (2008 & 2011) investigating similar activities sampled kinetic data at 200 Hz.
However, in this current work the force platforms and sEMG system were being sampled
through the same (A/D) board. Therefore both sampling frequencies had to be the same with
the kinetic data up-sampled to compliment the sEMG sampling. Therefore a sampling
frequency of 2000 Hz was used to collect the kinetic data.

44
3.4 EMG Data Fidelity
The quality of the detected signals determines the usefulness and accurate interpretation of the
muscle activity, these include the intrinsic and extrinsic factors. Intrinsic factors, as classified
by De Luca (1997), refer to anatomical, physiological and electrical properties that are not
controllable by the user. Extrinsic factors fortunately can be controlled by the user and the
sensor manufacturer, these include: sensor location, electrode configuration, EMG bandwidth,
skin preparation and noise sources.
3.4.1 EMG Sensor Location
3.4.1.1 Surface EMG Sensor
The location and positioning of EMG sensors is a much discussed topic with various
recommendations either based upon surveys (SENIAM Recommendations) (Hermens et al.,
2000) or through empirical evidence (Roy et al., 1986). It has been shown that the location of
the sensor is one of the most important factors in obtaining a high fidelity EMG signal, with
differing locations rendering dramatically different EMG characteristics (De Luca 1997).
Sensor placement has also been shown that it may have a considerable effect on the temporal
relationship of the vasti muscles (Wong & Ng, 2006), which has been a commonly investigated
variable within the study of PFP (Wong, 2009). Roy et al. (1986) demonstrated the effects of
positioning the sEMG sensor across varying areas of the muscle with respect to sEMG signal
characteristics. It was found that with the electrode being positioned in proximity to the
tendonous insertion of the muscle and the innervation zones was detrimental to signal fidelity.
The differing placements and consequent differing signal characteristics are represented in
Figure 3-5a. Placement of sEMG sensors has therefore been recommended to avoid
innervation zones, which often reside near the edge of the muscles, tendonous origin and
insertions with the optimal placement being the middle of the muscle belly (De Luca 1997).
Positioning of the sEMG sensors during data collection was conducted with the sensors being
placed in the middle of the muscle belly and with the bar electrodes perpendicular to the muscle
fibre orientation as shown in Figure 3-5b.
As discussed throughout section 2.2 there are a host of lower limb muscles that have been used
when investigating PFP and lower limb control, but mainly focussing locally around the knee
joint. In order to gain a fuller understanding of the lower limb muscle behaviour sEMG sensors
were placed on the Medial Gastrocnemius, Biceps Femoris, Rectus Femoris and Gluteus

45
Medius. Selecting these muscles allows information to be extracted about the ankle, knee and
hip musculature, which have all been shown to have an important role in the control of the
lower limb (section 2.2). The investigation of these muscles allows a better understanding of
the control of the lower limb, response to the taping intervention and any between group
differences as per the project objectives (section 2.8).
3.4.1.2 Surface EMG Decomposition Sensor
The placement of the surface EMG decomposition (dEMG) sensors, whose design is
considerably different to traditional surface EMG sensors (section 3.4.2), have not had the same
extensive review of standard sEMG sensor placements. As part of the development of the
methods (section 5.2) the optimal location of the dEMG sensors was investigated with regards
to the motor unit behavioural differences. It was found that placement of the dEMG sensor
can be placed either proximally or distally to the innervation zone and still provide
representative behaviour of the whole muscle. However, a study by Zaheer et al. (2012) did
describe a marginally greater motor unit yield when the dEMG sensors were placed proximal
Direction of muscle fibres
Bars to be perpendicular to fibres
= Innervation Zone
a) b)
Figure 3-5 Surface EMG optimal sensor location on a muscle a) Amplitude and Frequency
characteristics of different placements b) Sensor placement avoiding innervation zone and
perpendicular to muscle fibres

46
to the middle of the muscle belly. Therefore, the dEMG sensors were placed slightly proximal
to the middle of the muscle belly on both the Vastus Lateralis and Vastus Medialis muscles, an
example of the placement can be seen in Figure 3-6.
Figure 3-6 An example of the dEMG sensor location on the right Vastus Medialis and
Vastus Lateralis
3.4.2 EMG Electrode Configuration
3.4.2.1 Surface EMG Electrode
Typical sEMG sensors employ a single differential electrode configuration, where the voltage
at each electrode is measured with respect to a third reference electrode and then subtracted
using a differential pre-amplifier. Thus any voltage that is common to the two electrode
contacts such as line interference, movement artefact and muscle crosstalk are subtracted to
zero. The Delsys sEMG electrode contacts are designed in a parallel bar configuration opposed

47
to other sEMG systems that use a disc electrode configuration. The parallel bar configuration
allows a repeatable and consistent 10mm inter-electrode distance, thus significantly reducing
the likelihood of muscle crosstalk and inter-intra subject reliability issues (De Luca et al. 2012).
The Delsys Trigno EMG sensor (Figure 3-7) employs a single differential configuration with
two EMG electrode contacts and two stabilising reference contacts.
3.4.2.2 Surface EMG Decomposition Electrode
dEMG signals were collected using a 5-pin surface sensor, which consists of five cylindrical
pins (0.5 mm diameter each) with blunted ends that protrude from the sensor housing to
enhance the skin-electrode interface without puncturing the skin (Figure 3-8). Four pins are
placed at the corners of a 5x5 mm square with the fifth pin placed in the centre of the four pins
having an inter-electrode distance of 3.6mm. Pair-wise subtraction of voltages from the five
pins is used to create four channels of single differential EMG signal. The four channels thus
create a multi-channel sEMG system allowing the decomposition algorithm to discriminate the
MUAP shapes (LeFever & De Luca, 1982). In addition, a dermatode reference electrode was
placed over the dorsal aspect of the hand.
b) a)
Figure 3-7 a) Graphical representation of the Delsys Trigno EMG sensor b) Actual Delsys
Trigno EMG sensor

48
Figure 3-8 a) Graphical representation of the Delsys dEMG sensor b) Actual Delsys
dEMG sensor.
3.4.3 EMG Bandwidth
The frequency content of the sEMG signal typically ranges from 0-400 Hz and can be affected
by various factors including: electrode spacing, the amount of fatty tissue between the skin and
the muscle, the shapes of the action potentials and the muscle type (Basmajian & De Luca
1985). The low-pass bandwidth employed, responsible for attenuating high frequency
components, is often in the range of 400-450 Hz as this is typically the point at which noise
components exceed the sEMG signal (De Luca et al. 2010), with most sEMG commercial
components following this reasoning.
The high-pass filter is responsible for removing low frequency noise components from the
signal, such as movement artefact. However, the high-pass frequency cut-offs do not have the
same consensus as the low-pass filter cut-offs, with various standards and recommendations
being proposed and followed (Winter et al. 1980; Merletti 1999; Hermens et al. 2000). The
difficulty with selecting an appropriate high-pass filter lies within the low frequency noise
contamination being expressed from various sources. De Luca et al. (2010) provided empirical
evidence for the selection of a 20 Hz high-pass filter as this offers the best compromise in
retaining the desired sEMG content and removal of low frequency noise sources. Therefore
both the EMG systems used for data collection had an analog Butterworth bandwidth filter of
20 ±5 Hz – 450 ±50 Hz, consequently attenuating any frequency below 20 Hz and above 450
Hz.

49
3.4.4 EMG Skin Preparation
A key factor in collecting a high fidelity sEMG signal is through an effective preparation of
the skin-electrode interface. Skin preparation is often satisfied through removing skin debris
with the application of a 70% Isopropyl pad across the application site. Signal fidelity was
inspected following skin preparation and sensor placement, which involved inspection of the
baseline noise component, Signal-to-Noise Ratio (SNR) and 50 Hz signal contamination. If
the signal fidelity was contaminated with 50 Hz noise, a large baseline noise or poor SNR
component then the skin preparation procedure was repeated and the sensor re-applied to the
middle of the muscle belly. This procedure was performed prior to all data collection sessions.
The electrode pins and the inter-electrode distance of the dEMG sensors are critical design
features but, by their nature, generate more skin-electrode noise than more traditional sEMG
sensors. Consequently the signal quality procedure is paramount to a high MU yielding and
accurate firing data set. The optimal skin preparation procedures were investigated (see section
5.4) and found that the following steps (Figure 3-9) were required to be performed with each
subject prior to data collection to ensure a high fidelity signal.
Figure 3-9. Process of skin preparation before applying the dEMG sensor.
Three steps were taken to inspect the signal fidelity following the skin and sensor preparation:
Baseline noise inspection, Signal-to-Noise Ratio (SNR) and line interference.
3.4.4.1 Baseline Noise
The baseline noise is the sum of the inherent sensor electronic noise and the skin-electrode
interface, the lower the baseline noise component allows enhanced discrimination of the small
motor units. With the subject in a fully extended and relaxed position magnification of the
baseline noise within the acquisition software (EMGworks, Delsys Inc., Boston, MA) was
performed. Baseline noise was deemed acceptable with values of <4.8 μV RMS, as per
manufactures guidelines. If the baseline noise component exceeded <4.8 μV RMS then the
skin preparation procedure was repeated until it the value fitted within the given parameters.
Shave site to remove hair
Remove skin oils by applying 70% Isopropyl
pad
Remove dead skin cells by
applying hypo-allergenic tape
Moisten the application site and electrode
contact

50
SNR =
3.4.4.2 Signal-to-Noise Ratio
The SNR can be defined by the following equation:
sEMG Signal Amplitude (RMS)
Baseline Signal Amplitude (RMS)
Manual inspection of the SNR can provide information for the suitability of the signal fidelity.
If the SNR was poor but the baseline noise component acceptable the sensor location was
relocated and procedures repeated until the SNR was acceptable.
3.4.4.3 Line Interference
Interference from power lines and other sources can adversely affect the motor unit yield and
accuracy, as the frequency of the line noise is typically found at 50 Hz and therefore is within
the same frequency bandwidth as EMG signals. Expanding the time series of the signal plotting
exposes any cyclical 50 Hz line interference. An inspection was conducted prior to data
collection, if there was a significant 50 Hz component then the skin preparation procedure was
repeated to ensure this was due to skin-electrode interface, as opposed to mains line noise
entering the system as discussed in section 5.4.
3.4.5 Data Fidelity Validation
The above factors were all taken into consideration during data collection ensuring that each
session abided by the strict parameters. The data did not always fit within the stated parameters
at first attempt. The baseline noise parameter was violated in approximately 20% of the
subjects, therefore the skin preparation procedure was repeated in these cases to ensure it did
not exceed <4.8 μV RMS. If the SNR was poor but the baseline noise component acceptable
the sensor was location was slightly adjusted and skin preparation procedures repeated until
the SNR was acceptable, this rule was violated in approximately 10% of subjects. No evidence
of 50 Hz line interference was found during any data collection periods.

51
3.5 Kinematics and Kinetics Setup
3.5.1 Camera Positioning
Ten cameras were placed upon tripods, elevated to 2.1 metres and spaced approximately 2
metres apart, which were arranged to focus on the data measurement area. See Figure 3-10
below for a graphical representation of the camera arrangement around the data measurement
area.
3.5.2 Kinematic Calibration
In order to resolve the two dimensional (2D) data into three dimensional (3D) data the Qualisys
software, Qualisys Track Manager (QTM), requires information about the orientation and
position of each camera. To gather this information a static and dynamic calibration procedure
was performed prior to each data collection session, defining the global coordinate system and
the scaling of the axes. The calibration procedure is directly related to the accuracy of the data,
thus robust methods were adhered to.
To define the global coordinate system a static L-shaped reference structure (Wand 300
Calibration Kit, Qualisys Medical AB, Gothenburg, Sweden) as seen in Figure 3-11 was placed
in the data measurement area, comprising of an aluminium frame and 4 retro-reflective
markers. The L-shaped structure provides positional information with respect to a known frame
of reference (Richards 2008).
Figure 3-10 A graphical representation of the camera positioning

52
Figure 3-11. L-Shaped reference structure (Left) placed in data measurement area and
the calibration wand (Right).
In addition to the static reference a calibration wand (Figure 3-11), with 2 retro-reflective
markers spaced 298.1mm apart, was moved within the measurement volume in all three planes
ensuring that all axes were properly scaled. The information on the camera positioning and
orientation from the calibration procedure is used by the calibration algorithm within QTM.
The system was calibrated for 30 seconds with the manufactures default sampling frequency
of 100 Hz.
3.5.3 Kinematic Calibration Quality
The average residuals of the retro-reflective markers identified by each camera were populated
following the calibration procedure. These residual values are the average of errors (in mm)
from the distance between the 2D marker ray and its corresponding 3D point. A value below
1.0mm for each camera is deemed acceptable following the manufactures guidelines and
previous publication (Richards 1999). Calibration values did not exceed 1.0mm within all data
collection sessions. An example of a successful calibration and each cameras’ residual values
can be seen in Figure 3-12
298.1mm

53
Figure 3-12 Example of calibration results
3.5.4 Force Platform Calibration
In order to provide positional information about the imbedded force platform retro-reflective
markers were placed in each corner of the force platform (Figure 3-13), followed by a 2-second
data collection period using QTM. The marker positional information allowed the software to
resolve both the location and position of the force platform.
Figure 3-13 Retro-reflective markers positioned for positional calibration

54
3.5.5 Marker Set and Anatomical Model
In order to model the bony segments of the subjects, retro-reflective markers (Figure 3-14)
were placed on specific anatomical landmarks, providing an anatomical frame. The placement
of the anatomical markers on the externally palpable landmarks is critical. Palpation of the
external landmarks was approached with due care during the preparation of each subject.
Technical frame marker clusters (Figure 3-15), consisting of at least three non-colinear
markers, were placed in relatively arbitrary positions on body segments and respective of the
sEMG sensor placements. The model used throughout the thesis was the Calibrated
Anatomical System Technique (CAST), first proposed by Cappozzo et al. (1995).
Figure 3-15 Rigid technical frame marker clusters applied to the thigh and shank segments
Figure 3-14 9mm Spherical Retro-Reflective Markers

55
Specific details on the modelling of each segment can be found below:
3.5.5.1 Foot Segment Marker Set
The foot segment coordinate system was defined with markers placed upon the heads of the 1st
and 5th metatarsals, medial aspect of malleolus and lateral aspect of the malleolus. The
technical frame markers, used for segment tracking, were placed on the heads of the 1st and 5th
metatarsals, mid-foot marker and the posterior surface of the calcaneus. Figure 3-16 below
shows the location of the markers used to model and track the single segment foot.
Figure 3-16. Model marker set used for the foot segment.
(Blue = Anatomical Markers, Red = Technical Frame Markers, Blue/Red = Anatomical
and Technical Frame Markers)
3.5.5.2 Shank Segment Marker Set
The shank segment coordinate system was defined by proximal markers placed upon the medial
and lateral femoral epicondyles and the distal end was defined by markers placed upon the
medial and lateral aspects of the malleoli. The four technical frame markers were fixed on a
rigid cluster and attached to the shank. The location of the anatomical and technical frame
markers can be seen in Figure 3-17.

56
Figure 3-17. Model marker set used for the shank segment
(Blue = Anatomical Markers, Red = Technical Frame Markers, Blue/Red = Anatomical
and Technical Frame Tracking)
3.5.5.3 Thigh Segment Marker Set
The thigh segment coordinate system was defined with distal markers placed on the medial and
lateral femoral epicondyles and the proximal end with a marker placed on the external
projection of the greater trochanter. The proximal marker placement was used in calculating
the hip joint centre, derived from the Bell method (Bell et al. 1990). The hip joint centre
calculation used is described below in Table 3-1 and represented in Figure 3-18:
Table 3-1 Hip Joint Centre (HJC) calculation values and respective planes of motion
Right Hip Joint
Centre
0.36 * ASIS_Distance
(X Axis – Sagittal)
-0.19 * ASIS_Distance
(Y Axis – Coronal)
-0.3 * ASIS_Distance
(Z Axis – Transverse)
Left Hip Joint
Centre
-0.36 * ASIS_Distance
(X Axis – Sagittal)
-0.19 * ASIS_Distance
(Y Axis – Coronal)
-0.3 * ASIS_Distance
(Z Axis – Transverse)

57
Figure 3-18 Coordinate system of the pelvis segment and calculation of the hip joint
centre
The four technical frame markers were fixed on a rigid cluster and attached to the thigh, which
can be seen in Figure 3-19.
Figure 3-19 Model marker set used for the thigh segment
(Blue = Anatomical Markers, Red = Technical Frame Markers, Blue/Red = Anatomical
and Technical Frame, Purple = Calculated Hip Joint Centre)

58
3.5.5.4 Pelvis Segment Marker Set
The pelvis segment was defined with markers being placed on the left and right Anterior
Superior Iliac Spine (ASIS) and the left and right Posterior Superior Iliac Spine (PSIS).
The origin of the pelvis segment coordinate system was defined as the mid-point between the
ASIS markers. The ASIS and PSIS markers were also used as the technical frame markers,
thus tracking the pelvis segment. The location of the markers for the pelvis segment can be
seen in Figure 3-20.
Figure 3-20 Model marker set used for the pelvis segment
(Blue = Anatomical Markers, Red = Technical Frame Markers, Blue/Red = Anatomical
and Technical Markers, Purple = Calculated Hip Joint Centre)
3.5.5.5 Complete Marker Set
An example of the full marker set, 38 retro-reflective markers, can be seen on the anatomical
figure and an example subject in Figure 3-21.
Figure 3-21 Example of full marker set on anatomical figure (a) and subject (b)

59
3.6 dEMG Setup
3.6.1 Tracking Paradigm
The decomposition algorithm was designed to decompose sEMG signals from isometric
contractions, following specific contraction guidelines (Nawab et al. 2010). A quiescent region
must be present at the beginning and the end of the contraction, allowing the algorithm to
establish the baseline noise and the recruitment and de-recruitment of the MUs. A progressive
increase and decrease of a contraction allows the algorithm to accurately monitor the
recruitment and de-recruitment of motor units, a contraction with a rapid increase or decrease
would result in a complex superposition of motor units for the algorithm to resolve. A
contraction period of at least 10 seconds was required, as this provided the algorithm sufficient
information on the identity of MUAP shapes. Figure 3-22 shows the tracking paradigm which
the contraction followed however, subjects were not provided this as visual feedback but
instead received instructions from the operator (see section 6.5).
Figure 3-22 Decomposition Tracking Paradigm
Quiescent
Region
(5s)
Quiescent
Region
(5s)
Up
Ramp
(3s)
Down
Ramp
(3s)
Constant Force
Region
(20s)
Duration of Contraction
Length of sEMG Signal File

60
3.7 Integration and Synchronisation
In order to collect the neuromuscular and mechanical variables under investigation in this thesis
a collection of specialised measurement tools were required. Considerable exploration and
investigation was required to ensure the previously mentioned issues were addressed, Figure
3-24 shows an overview of the equipment used and the method of integration and
synchronisation. Details of the connections and relevant details can be found below.
3.7.1 Surface EMG Decomposition
The Delsys dEMG system (Figure 3-23, item 4) was managed and recorded separately to the
rest of the data acquisition systems. The analog EMG data was amplified and then output via
a Small Computer System Interface (SCSI) cable (NI SH68-68-EPM) to an A/D device (NI
USB 6251) (Figure 3-23, item 7). The converted digital data was then output from the A/D
device, via a USB cable, to a laptop computer and controlled via Delsys EMGworks
Acquisition software (Figure 3-23, item 8).
3.7.2 Surface EMG
The Delsys Trigno EMG system (Figure 3-23, item 3) was also integrated via its analog
connection. The SCSI cable (NI SH68-68-EPM) formed a data connection between the Delsys
Trigno EMG system and the BNC interface (NI BNC 2090A). BNC cables then connected the
BNC interface to the A/D board (Figure 3-23, item 6) allowing the raw analog data to be
streamed into Qualisys Track Manager (QTM) (Figure 3-23, item 5). The Delsys Trigno EMG
system had a fixed 48ms delay, which was offset within QTM, and the synchronisation was
managed by the same method as the kinetics, via the synchronisation cable from the master
camera of the Qualisys motion capture system.
3.7.3 Kinematics
The Qualisys motion capture system (Figure 3-23, item 1) was connected from a LEMO-to-
ethernet cable exiting the master camera and entering the computer (Figure 3-23, item 5),
creating a direct digital connection into QTM.

61
3.7.4 Kinetics
The AMTI force plates (Figure 3-23, item 2) were integrated via analog connections. The
Souriau 26-pin cable was input into the amplifier and the signals fed into the (A/D) board (NI
USB 2533) via BNC cables. The A/D board (Figure 3-23, item 6) delivered the data into QTM
via USB, where it was managed and captured (Figure 3-23, item 5). The force plates were
synchronised with the Qualisys motion capture system via the ‘Synchronisation In’ connector
on the master camera, thus ensuring time synchronisation. To ensure synchronisation between
this and the other systems a triggering solution was required.
3.7.5 Triggering Solution
The Delsys Trigger Module was used to create a hardware synchronisation between the Surface
EMG Decomposition system and the other three measurement systems. The trigger module
was connected to the Delsys dEMG system via its LEMO connector, so when a trigger
command was sent from the trigger module it would start and stop data acquisition, therefore
the Delsys dEMG was a slave/secondary device in this setup scenario.
BNC cables were connected from both the ‘start output’ and the ‘stop output’ BNC connections
on the trigger module, which were input into a BNC Tee connector. The third BNC connection,
from the BNC Tee connector, housed a single BNC cable which was connected to the ‘Trigger
In’ connection on the master camera of the Qualisys motion capture system. The Kinetics,
Kinematics and Surface EMG systems were then also configured to be slave/secondary devices
to the trigger module. When using an external trigger with QTM there is a 20ms fixed delay,
which was accounted for in post-processing of the data. The trigger module was configured to
be an independent trigger, being the master/primary device to all connected devices. Upon
pressing the start or stop button all the connected systems would respond accordingly. The
connected systems were configured to start and stop data acquisition on a +/- 5V Transistor-
Transistor Logic (TTL) pulse with a negative pulse polarity. This triggering setup ensured all
devices were all time synchronised and also allowed simpler data acquisition protocols.

62
Kinematics
(Qualisys Motion Capture)
Kinetics
(AMTI Force Plates) Surface EMG
(Delsys Trigno EMG)
Surface EMG Decomposition
(Delsys dEMG)
Surface EMG Decomposition
Acquisition Software
(Delsys EMGworks)
Kinematics, Kinetic and sEMG
Acquisition Software
(Qualisys Track Manager)
Analog-to-Digital
(NI USB 2533 and NI BNC 2090A)
Analog-to-Digital
(NI USB 6251)
SH68-68-EPM Cable
48ms Fixed Delay
Souriau 26-pin Cable
SH68-68-EPM Cable
LEMO to Ethernet Cable
USB Data Cable
USB Data Cable
To Delsys dEMG
Triggering Solution
(Delsys Trigger Module)
To Qualisys Motion Capture
20ms Fixed Delay
Start Trigger Stop Trigger
1 2 3 4
5 6 7
9
8
Figure 3-23 Overview of integration and
syncronisation of equipment

63
4. Data Processing Methods
4.1 Introduction
Employing multiple data acquisition methods provides the much needed wealth of data to
provide insights into the complexities of the motor control system. In order to provide
meaningful and appropriate quantification of these complexities the data set, compromising of
approximately 500,000 data points per subject, requires specific and targeted data processing
techniques. Some of these data processing methods are well-established techniques whilst
others are newly introduced, regardless all are described in detail in the following chapter
demonstrating the process from raw data to final data extraction for the targeted analysis
exhibited throughout this thesis.
Chapter Outline
- Outline of the surface EMG decomposition algorithm utilised (4.2)
- Details pertaining to the accuracy of the surface EMG decomposition algorithms
accuracy and application to this work (4.3)
- Pertinent information relating to the processing of the surface EMG decomposition
variables (4.4, 4.5 and 4.6)
- Pertinent information relating to the surface EMG processing (4.7)
- Pertinent information relating to the kinematic and kinetic processing (4.8)
- Details of the taping intervention application methods (4.9)

64
4.2 Decomposition Algorithm
The Delsys decomposition algorithm is based upon artificial intelligence and utilises advanced
signal processing techniques, using the Integrated Processing and Understanding of Signals
(IPUS) concept (Lesser et al. 1995) followed by the Iterative Generate and Test (IGAT) stages.
A detailed description of the algorithm and its processes are beyond the scope of this work,
descriptions of the algorithms processes and complexities are detailed by De Luca et al. (2006)
and Nawab et al. (2010). However, a brief overview of the steps involved in the decomposition
algorithm can be found below.
4.2.1 IPUS Stage
4.2.1.1 MUAP Template Creation
The algorithm begins by identifying as many templates for the various uncontaminated MUAP
shapes as possible from the EMG data. When a sufficient number of similar shapes are
identified they are averaged and designated a MUAP template (De Luca et al. 2006).
4.2.1.2 MUAP Template Matching
The matching of MUAP templates against the remaining sEMG signal takes place through a
Maximum A-posteriori Probability Classifier (LeFever & De Luca 1982), using the action
potential amplitude and the residual EMG signal.
4.2.1.3 MUAP Template Updating
MUAP templates are updated through a recursive weighting process whenever the matching
procedure detects a new instance of a previously detected MUAP (Nawab et al. 2002).
4.2.2 IGAT Stage
This stage of the algorithm identifies any template whose presence is objectively indicated in
any of the complex superpositions in the EMG signal.

65
4.2.2.1 Template Matching
A template-matching procedure is performed on the EMG signal to identify locations where
the shape of the EMG signal and the shape of an identified MUAP template exhibits a
correlation of at least 20% (Nawab et al. 2004).
4.2.2.2 Discrimination Analysis
A discrimination analysis is performed, at each of the aforementioned location, to determine
which of the multiple matching templates has contributed (Nawab et al. 2004).
4.2.3 Decomposition Process
Previous attempts at sEMG decomposition involved operator editing in order to resolve signal
complexities and to improve the accuracy. The Delsys dEMG algorithm was designed so that
users did not require extensive signal processing understanding, instead the algorithm was
designed to be an automatic process. The EMG data is processed within EMGworks Analysis
(Delsys Inc., Boston, MA) where the EMG channels and feedback channel are used alongside
the MVC and offset values. The algorithm then automatically begins to decompose the EMG
data.

66
4.3 Decomposition Accuracy
4.3.1 Introduction
In order to have confidence in the outcome variables from a measurement system it is vital that
the technology has been validated appropriately and it can demonstrate the outputs are not
masked by measurement error. The surface EMG decomposition (dEMG, Delsys Inc.) has
been challenged considerably and consequently validated, as discussed in section 2.2.3
demonstrating that the technology has the ability to provide robust and accurate information
on the motor unit properties. Equally important is to be able to validate each decomposed file
and the individual motor unit firing properties as the motor unit accuracy is of paramount
importance to have confidence in the consequent measured behavioural characteristics of the
motor units, without such vigilance differentiating between errors and true physiological events
becomes an impossible task. The term ‘accuracy’ in this context is the testing of the
decomposition algorithms ability to successfully resolve the complex EMG signal into its
constituent motor unit action potential firings from each recorded signal, thus being specific to
the users testing. This accuracy testing provides a percentage output to describe the amount of
common firings it has found after ‘re-decomposing’ the signal, and therefore an understanding
on the success of the algorithm and the level of confidence we can place in the individual motor
units for each contraction.
In an ideal world all motor unit firings would be resolved with 100% accuracy, however the
inherent complexities of decomposing a sEMG signal into its constituent components requires
an exponentially increasing set of operations, therefore the Delsys decomposition algorithm
limits the combinatorial calculations and accepts a small (typically <5%) error (De Luca et al.
2006; Nawab et al. 2010; De Luca & Nawab 2011). The process for verification of the
decomposition accuracy, termed Decompose-Synthesize-Decompose-Compare (DSDC) test,
was first proposed by Nawab et al. (2010) and has since been included in the commercial
software package from Delsys (Delsys Inc., Boston, MA). The DSDC process is outlined
below, a more detailed description and validation of the process can be found in Nawab et al.
(2010) and the appendix of De Luca & Contessa (2012).

67
4.3.2 Software Processes
The Delsys Decomposition Accuracy program automatically determined the accuracy
characteristics of a decomposed data set. The program background process used a previously
decomposed data file that contains the ‘truth’ signal, consisting of a set of MUAPT for which
the firing instances and MUAP shapes are known. Gaussian noise was then added to the ‘truth’
signal, simulating the normally occurring noise in the EMG signal, creating a new synthesised
file. The synthesised file was then decomposed and compared to the original decomposed
signal, an overview of the process can be seen in Figure 4-1.
The Delsys Decomposition Accuracy software produced a plot comparing the original ‘truth’
firing instances and the synthesised firing instances, an example of this output can be seen in
Figure 4-2. Each blue bar represents a firing instance of the original MUAPT, the black ‘X’
above a blue bar represents agreement between the original and synthesised signal, true
positive. A red ‘O’ above the firing instance represents a false negative with the decomposed
synthesised signal missing the firing instance. The red ‘+’ is indicative of an erroneously
detected firing from the synthesised signal, a false positive. The plot provided an accuracy
value (percentage) and number of error/s for each MUAPT either for the whole contraction
length or a selectable range, as shown in Figure 4-2.
Figure 4-1 A graphical representation of the Decompose-Synthesise-
Decompose-Compare (DSDC) process.

68
4.3.3 Motor Unit Selection
Considering the previously stated importance of motor unit accuracy, a motor unit selection
criteria should be considered and actioned accordingly. Motor unit selection is largely
dependent on each individual’s research question and the type of calculation being performed.
For example, it has been suggested that when studying common drive and using the cross-
correlation calculation, motor units should achieve at least 95% accuracy and motor units
falling below this threshold should be discarded from further analyses (Carlo De Luca, Sam
Chang and Paola Contessa, personal communication, November 2012). A motor unit selection
criteria was established after discussions with experts in the field with whom have 30+years of
EMG decomposition and signal processing. Motor unit selection criteria used for surface EMG
decomposition analysis can be seen in Table 4-1.
Figure 4-2 A representation of the output from the Delsys Decomposition Accuracy and
a legend of the results

69
Table 4-1 Motor unit selection criteria
Calculation Output Motor Unit Selection
Criteria (%)
Mean Firing Rate ≤ 90%
Recruitment Threshold ≤ 90%
Cross-Correlation ≤ 95%
Motor units with a percentage level <90% were discarded and not included in any further
analyses. All contractions were processed using the Delsys Decomposition Accuracy software
(Delsys Inc., Boston, MA) and was calculated for both the whole contraction length and a 5-
second period in the constant force region.

70
Figure 4-3 Example of raw EMG from Vastus Lateralis collected from the dEMG sensor
4.4 Mean Firing Rate Processing
4.4.1 Stage 1 - Raw EMG
Four channels of sEMG simultaneously collected from a single muscle, Vastus Lateralis in this
example, were imported into EMGworks Analysis (Delsys Inc., Boston, MA) (Figure 4-3).
The raw sEMG data was then input into the decomposition algorithm (Version 42).
4.4.2 Stage 2 - Firing Rates
The decomposition algorithm provided firing characteristics of individual MUAP firings,
which were then automatically allocated to a MUAPT. MUAP firings and their allocation to a
MUAPT can be seen for all the identified MUs in Figure 4-4, each line representing a single
firing instance of a given MU. This example contraction presents 38 motor units, with an
accuracy <90%, from the Vastus Lateralis.
Time (seconds)
Vo
lts
(v)

71
Figure 4-4 Example motor unit firing from Vastus Lateralis
4.4.3 Stage 3 - Mean Firing Rate
To extract additional parameters from the individual MUAPTs, the firing instances can be
calculated as the number of pulses per unit of time, commonly expressed as pulses per second
(PPS). This parameter is extrapolated by calculating the firing rate of an individual motor unit
over a moving time window, thus providing a mean firing rate (MFR). Figure 4-5 provides an
illustration of the calculation of the mean firing rate. A Hanning averaging filter was passed
over the MUAPT and the number of pulses counted. The length of the Hanning window can
be modified to adjust the smoothness of the firing rate trajectories. For additional details on the
filtering procedure see De Luca et al. (1982).
2 3 4 5 Time (seconds)
0
10
20
Mea
n F
irin
g R
ate
(Puls
es P
er S
eco
nd
)
Hanning
Window
Figure 4-5 Graphical representation of the mean firing rate calculation using a Hanning filter
Time (seconds)
Moto
r U
nit
Nu
mb
er

72
The same example contraction from previous illustrations was then computed with a 3-second
Hanning window to exhibit the MFR of all 38 identified MUs. Each line represents the mean
firing rate of an individual motor unit. The 3-second window was chosen as it smooths the
firing rate trajectories sufficiently whilst maintaining an accurate representation of the firing
rate behaviour.
4.4.4 Stage 4 - Constant Force Region Extraction
In order to better understand the behaviour of the motor units during the given task the
recruitment and de-recruitment phases of the contraction were ignored for this analysis. A 5-
second period within the constant force region, an area where no new motor units were
recruited or excessive firing fluctuations occurred, was selected for further analysis.
Figure 4-6 Example mean firing rate plot from the Vastus Lateralis after a 3-second Hanning window
Time (seconds)
Mea
n F
irin
g R
ate
(Pu
lses
Per
Sec
on
d)

73
0
5
10
15
20
25
30
35
1 2 3 4 5 6 7 8 9 10 11 12 13 14 15 16 17 18 19 20 21 22 23 24 25 26 27 28 29 30 31 32 33 34 35 36 37 38
Mea
n F
irin
g R
ate
(Pu
lses
Per
Sec
on
d)
Motor Unit Number
Figure 4-8 Example of the average MFR from a Vastus Lateralis contraction
4.4.5 Stage 5 – Average MFR
The mean firing rate (MFR) of all the motor units for the 5-second constant force region were
extracted. The average firing of each motor unit MFR was then computed, as can be seen in
Figure 4-8.
Figure 4-7 Selected 5-second constant force region of the mean firing rate
Constant Force Region (5-Seconds)
Time (seconds)
Mea
n F
irin
g R
ate
(Pu
lses
Per
Sec
on
d)

74
4.4.6 Stage 6 – Data Extraction
The mean firing rate from all subjects were exported from EMGworks Analysis (Delsys Inc.)
into Microsoft Excel where the minimum, maximum, mean and standard deviation values were
computed for each muscle and condition for each subject. The motor unit firing behaviour is
structured, described as the “Onion Skin Phenomenon” (De Luca & Hostage 2010), therefore
the mean firing rate output is normally distributed. Consequently the mean and standard
deviation was an appropriate measure to extract. The mean MFR values were then entered into
SPSS for inferential analyses. Table 4-2 provides example statistics of the MFR variables
extracted for each individual.
Table 4-2 Example statistics of the MFR variables extracted; Minimum, Maximum,
Mean and Standard Deviation
Mean Firing Rate
(pps) Minimum Maximum
Mean
(SD)
Vastus Lateralis 12.7 30.8 24.1
(3.6)

75
4.5 Cross Correlation Processing
4.5.1 Stage 1 - Raw EMG
Four channels of single differential sEMG were simultaneously collected from a single muscle,
Vastus Lateralis. The raw sEMG data was inputted into the decomposition algorithm (Version
42), details of which can be found in section 4.4.1.
4.5.2 Stage 2 - Firing Rates
MUAP firings were automatically allocated to a MUAPT for all of the identified motor units,
as can be seen in (Figure 4-4) with each line representing a single firing instance of a given
motor unit. In this example contraction 26 motor units from the Vastus Lateralis, with an
accuracy <95%, were identified.
4.5.3 Stage 3 - Mean Firing Rate
As described in section 4.4.3 the mean firing rate (MFR) is a useful variable to extract from
the individual MUAPTs, it’s also an important step and requirement in exploring the common
drive through a cross-correlation calculation. As before a Hanning window is passed over the
MUAPT, however a narrower window is required in order to examine the small fluctuations
between motor units. To investigate the common drive through cross-correlation calculations
Figure 4-9 Mean Firing Rate of the Vastus Lateralis with a 800ms Hanning window filter
Mea
n F
irin
g R
ate
(Pu
lses
Per
Sec
on
d)
Time (seconds)

76
a 800ms Hanning window was passed over the MUAPTs, Figure 4-9 shows the resultant mean
firing rate of each motor unit, the Vastus Lateralis in this example.
4.5.4 Stage 4 – Constant Force Region Extraction
In order to examine the firing rate fluctuations and whether they were firing in unison a constant
force region was required, thus the recruitment and de-recruitment phases of the contraction
were ignored for this aspect of the analysis. A 5-second period within the constant force region,
an area where no new motor units were recruited or excessive firing fluctuations occurred, was
selected for further analysis.
4.5.5 Stage 5 – Cross-Correlation
In order to attain the degree of correlation between the mean firing rate fluctuations of pairs of
concurrently active motor units the mathematical operation of cross-correlation was used. The
cross-correlation calculation was directed to the 5-second constant force region. The cross-
correlation calculation searches for the highest value of cross-correlation function in pairs of
motor units within a ±100ms window. If there was no cross correlation function within that
Figure 4-10 Selected 5-second constant force region of the mean firing rate
Constant Force Region (5-Seconds)
Mea
n F
irin
g R
ate
(Pu
lses
Per
Sec
on
d)
Time (seconds)

77
window then the motor unit pairing was not included in the output. Figure 4-11 shows two
motor units mean firing rate (800ms Hanning window) and the highlighted area (blue) exhibits
an example of the common fluctuations in motor unit firing.
The same motor units from the previous figure (Figure 4-11) were cross-correlated, i.e. the
calculation searched for a common fluctuation in MFR between MU 1 and MU 2 in a ±100ms
window. The figure below (Figure 4-12) shows that there was a cross-correlation and to what
degree, in this case the peak cross-correlation function was 0.7.
Figure 4-12 Example of cross-correlated motor unit pairing Peak Correlation Window (±100ms)
Time Lag (second)
Cro
ss-C
orr
ela
tion
Fu
nct
ion
Figure 4-11 Example of two motor unit mean firing rate showing common fluctuation
Mea
n F
irin
g R
ate
(Pu
lses
Per
Sec
on
d)
Time (seconds)

78
The cross-correlation calculation was repeated on all motor units for each muscle, for each
repetition, for each condition and for all subjects. Figure 4-13 below is a plot of all the pairs
of cross-correlated motor units within a Vastus Lateralis contraction from one subject, the peak
cross correlations occurring within the ±100ms window. This example clearly shows evidence
for common drive in the Vastus Lateralis with 139 motor unit pairs being cross-correlated and
their degree of correlation.
4.5.6 Stage 6 – Data Extraction
Peak cross-correlations for all motor unit pairings within a muscle for all repetitions were
combined. The peak cross-correlation data was not normally distributed amongst some
subjects, therefore the median and inter-quartile range (IQRs) values were extracted for both
muscles and in each condition. An example of peak cross-correlation results with the median
and IQR values for a subject can be seen in Table 4-3.
Figure 4-13 Example of cross-correlation on a single contraction from the Vastus Lateralis
Peak Correlation Window (±100ms)
Cro
ss-C
orr
ela
tion
Fu
nct
ion
Time Lag (second)

79
Table 4-3 An example of the cross-correlation data extraction reporting the median and
inter-quartile (IQR) 25th and 75th percentile range
Cross-Correlation Vastus Lateralis
MEDIAN 0.40
IQR 0.24-0.56
In order to explore the level of cross-correlation in more detail the peak cross-correlation values
were sorted and counted within levels of cross-correlation from 0.0-0.1 up to 0.9-1.0, as can be
seen below in Table 4.4-2. Each level of cross-correlation has the number of pairs of cross-
correlated motor units for each muscle and each condition.
Table 4-4 Representative example of peak cross-correlation values for a subject within
the different cross-correlation values
4.5.7 Stage 7 – Cross-Correlation Normalisation
As can be seen from Table 4-4 there are different totals of cross-correlated motor unit pairs,
which if plotted and analysed would bias the results. This is due to different numbers of MUs
being identified for each muscle, subject, condition and also different amounts of those MUs
were found to be cross-correlated; therefore a normalisation procedure was required. Previous
Level of Cross-Correlation
Vastus Lateralis
0-0.1 4
0.1-0.2 20
0.2-0.3 24
0.3-0.4 18
0.4-0.5 18
0.5-0.6 23
0.6-0.7 17
0.7-0.8 5
0.8-0.9 1
0.9-1.0 0
Total MU Pairs 131

80
work (De Luca et al. 1993; De Luca & Erim 1994; Erim et al. 1999) using cross-correlation to
investigate common drive used intramuscular EMG and therefore a low MU yield and
consequent small amount of MU pairings being cross-correlated and so normalisation was not
previously required. As this data set is unique, in particular with the large number of pairs of
cross-correlated MUs, then there are no previous publications proposing or guiding such a
procedure to normalise the data. After personal communications with Dr Carlo De Luca and
Dr Paola Contessa (August 2013) and numerous explorations an appropriate method was
established.
Cross-correlation data was normalised by the number of paired cross-correlated MUs, for each
level of cross-correlation, against the total number of paired cross-correlated MUs. The
example below shows the calculation for Vastus Medialis - No Tape (NT), at level 0.0-0.1, as
highlighted in Figure 4-14 and Table 2-1.
Level 0.0 – 0.1 4 (Number of paired motor units cross-correlated for 0.0 - 0.1)
131 (Total number of paired MUs)
Multiply by x100
Level of cross-correlation (Normalised) = 3 %
Figure 4-14 Calculation used to normalise cross-correlation data

81
Table 4-5 Example data from normalised cross-correlation calculations
Level of Cross-Correlation Vastus Lateralis
0-0.1 3
0.1-0.2 15
0.2-0.3 18
0.3-0.4 14
0.4-0.5 14
0.5-0.6 18
0.6-0.7 13
0.7-0.8 4
0.8-0.9 1
0.9-1.0 0
Total Percentage 100
4.5.8 Stage 8 – Data Presentation
The normalised cross-correlation data was presented in a bar plot where each bar represents
the cross-correlation percentage for each cross-correlation level. Figure 4-15 presents the data
from a representative Vastus Lateralis contraction.
Figure 4-15 Example of the normalised peak cross-correlation result presenting the Vastus
Lateralis common drive

82
4.6 Recruitment Threshold Processing
4.6.1 Stage 1 - Raw EMG
Four channels of single differential sEMG were simultaneously collected from a single muscle,
Vastus Lateralis. The raw sEMG data was inputted into the decomposition algorithm (Version
42)
4.6.2 Stage 2 - Firing Rates
MUAP firings and their allocation to a MUAPT can be seen for all the identified motor units
(Figure 4-4), each line representing a single firing instance of a given motor unit. In this
example contraction 38 motor units from the Vastus Lateralis were identified, with an accuracy
<90%.
4.6.3 Stage 3 - Mean Firing Rate
The firing rates were passed through a 3-second Hanning window to exhibit the mean firing
rates of all 38 identified MUs. Each line represents the mean firing rate of an individual motor
unit, with the mean firing rate increasing through the recruitment phase, remaining stable
during the constant force region, then decreasing through the de-recruitment phase. The 3-
second window was chosen as it smooth’s the firing rate trajectories sufficiently whilst
maintaining an accurate representation of the firing rate behaviour.
4.6.4 Stage 4 - Average MFR
The mean firing rate (MFR) of all the motor units for the 5-second constant force region were
extracted (see Figure 4-10). The average firing of each motor unit MFR was then computed,
as previously described in 4.4.5.
4.6.5 Stage 5 – Peak Knee Moment
The force acting around the knee was represented by the sagittal plane knee moment and
provided a recruitment threshold percentage, which required a normalisation procedure thus a
peak knee moment was needed. All repetitions for an individual’s knee moment were plotted
together to find the peak knee moment.

83
Figure 4-16 shows 6 repetitions of an individual’s sagittal knee moment during the given task,
it can be seen that the highlighted red plot exhibited the highest knee moment thus was used as
the peak observed knee moment in the following calculations
4.6.6 Stage 6 – Recruitment Threshold Calculation
The recruitment threshold calculation used the sagittal plane knee moment, normalised against
the previously created peak knee moment, to determine at what percentage level the individual
MUs were recruited. The calculation allows any offset to be compensated in case the individual
moves prior to the main movement. Figure 4-17 below shows an example Vastus Lateralis
contraction with the corresponding sagittal plane knee moment (red line).
Figure 4-16 Representative example of a participants sagittal knee moment. Red line being the
highest knee moment used for normalisation.
New
ton
Met
ers
(Nm
)
Time (seconds)

84
Figure 4-18 shows at which percentage level of the peak knee moment the MUs were recruited.
In this example the first 9 motor units were recruited at approximately 9% peak knee moment
with the remainder of the motor units being recruited in response to the increase in load.
Figure 4-18 Resultant recruitment threshold from Vastus Lateralis showing the recruitment of
39 motor units normalised against sagittal plane knee moment
Norm
ali
sed
Kn
ee M
om
ent
(% M
axim
al
Kn
ee
Mom
ent)
Motor Unit
Number
Figure 4-17 Example of sagittal plane knee moment (red line) and the associated Vastus
Lateralis motor unit MFR with the recruitment phase highlighted.
New
ton
Met
ers
(Nm
)
Time (seconds)
Mea
n F
irin
g R
ate
(Pu
lses
Per
Sec
on
d)
Recruitment Region

85
4.6.7 Stage 7 – Recruitment Threshold and Average MFR
The recruitment threshold of each motor unit and the motor unit mean firing rate were extracted
from EMGworks Analysis and a linear regression analysis was performed within SPSS with
the recruitment threshold being the independent variable and mean firing rate as the dependent
variable. The linear regression will provide information on the recruitment strategy of the
muscle and its response to the taping intervention. Once regressed and plotted, the negative
linear relationship between these two variables becomes evident in this example, as shown in
Figure 4-19.
Figure 4-19 Regression plot of average motor unit MFR and the recruitment of
the motor units

86
4.6.7.1 Recruitment Threshold
The intercept and slope values were calculated for Vastus Medialis and Vastus Lateralis in the
two conditions, the two regression lines for each muscle were then compared to provide the
intercept and slope difference values and p-values. Table 4-6 below provides an example of
the statistical data extracted for the two muscles when the no tape and tape conditions are
compared.
Table 4-6 A example of the extracted data from the recruitment threshold calculation
Vastus Lateralis
Intercept Slope
Value p-Value Value p-Value
3.78 <0.001 -0.04 <0.05
4.6.7.2 Recruitment Operating Point
The recruitment operating point was defined as being the point at which the first identified
motor unit was recruited. The first motor unit identified indicated the start of the contraction,
and was extracted from EMGworks Analysis (Delsys Inc.) into Microsoft Excel. The
recruitment operating points from the 3 contractions were averaged to provide excitation point
for the Vastus Medialis and Vastus Lateralis in both the no tape and tape conditions. The mean
difference between the two conditions was calculated to provide a measure for change in the
recruitment operating point. Table 4-7 provides an example of the recruitment operating point
data extracted from an individual for the Vastus Medialis and Vastus Lateralis in the tape and
no tape condition.
Table 4-7 A example of the extracted data from the recruitment operating point
calculation
Recruitment Operating Point Vastus Medialis
Operating Point (%)
No Tape 16.17
Tape 5.83
Mean Difference -10.34

87
4.7 Surface EMG Processing
4.7.1 Stage 1 – Raw Data
Raw sEMG from four muscles (Gastrocnemius, Bicep Femoris, Rectus Femoris and Gluteus
Medius) were imported into EMGworks Analysis (Delsys Inc., Boston, MA).
4.7.2 Stage 2 – sEMG Filtering
As raw sEMG data is variable, by its stochastic nature, filtering is commonly applied to the
signals in order to smooth the data and provide a representative behaviour of the muscle. The
root-mean-squared (RMS) calculation was used on the raw sEMG data, which consists of three
steps:
1) Square all of the values in the specified window
2) Determine the mean of the resultant values
3) Take the square root of the result
Figure 4-20 Plot of raw EMG data from Gastrocnemius, Bicep Femoris, Rectus Femoris and Gluteus Medius
Time (seconds)
Vo
lts
(v)

88
The window length selected was 0.125 seconds with a window overlap period of 0.0625
seconds, these parameters offered sufficient filtering of the data whilst not masking the
behaviour of the muscles during the task. The calculation also removed the DC offset,
consisting of subtracting the mean value from the raw data.
4.7.3 Stage 3 – EMG Normalisation
In order to compare across muscles, conditions and subjects the sEMG data is required to be
normalised to a reference EMG signal. By normalising to a reference contraction the plethora
of factors that affect an EMG signal are referenced to the same point and therefore you are able
to obtain a valid relative measure of muscle activity. The most commonly applied method of
normalising an EMG signal is to a Maximal Voluntary Contraction (MVC), however as
highlighted by Burden (2010) and others, there is no consensus on the ‘best’ method of
normalising an EMG signal with numerous techniques and variations for normalisation being
task, condition and subject dependent (Halaki & Ginn 2012). As highlighted the most cited
method is the MVC, whereby subjects are encourage to perform a maximal isometric
contraction often for a period of 3-seconds and repeated 3 times with the researcher desiring
the maximal neural activation of the muscle in question. However, one of the main limitations
Figure 4-21 Filtered EMG data from Gastrocnemius, Bicep Femoris, Rectus Femoris and Gluteus
Medius
Time (seconds)
Vo
lts
(v)

89
of this method is using this with a patient group and explicitly those whom experience pain
during movement, such as PFP patients. To ask a PFP patient to perform a maximal
contraction, specifically the knee extensors, would firstly be unethical as it would most likely
cause pain to the subject knowingly. Secondly, the patient group would likely either be unable
or unwilling to perform such a contraction and therefore the MVC technique would be
redundant or unreliable. A technique that is used commonly within the literature and clinical
practice is the Maximal Observed Signal, which is method of normalising the EMG data to the
maximum activation obtained during the task under investigation. The Maximal Observed
Signal has been shown to decrease variability between individuals (Chapman et al. 2010) and
between trials (Albertus-Kajee et al. 2011). The Maximal Observed Signal method is
comprised of selecting the maximal EMG signal within the given activity and for each muscle,
often from 3-5 repetitions, and using this signal to divide against the task EMG signal.
This study used the Maximal Observed Signal to normalise the EMG activity from the
Gastrocnemius, Biceps Femoris, Rectus Femoris and Gluteus Medias. For each subject all
repetitions of a muscle were plotted and the maximal observed EMG signal was identified.
Following the identification of the maximal EMG signal within the activity a 3-second period
was subset to create a reference signal.
Step 1.
Raw EMG Data for
individual muscle, all
contractions.
Step 2.
Selected maximal
observed signal in
contraction, subset
maximal signal
Step 3. Create data file with
selected maximal signal
Step 4.
Normalise the EMG
data file to the maximal
observed signal.

90
4.7.4 Stage 4 – Data Extraction
All muscles were processed following the previous documented stages. Data was then
exported to extract pertinent variables associated with muscle amplitudes. Data was subset to
analyse a 5-second period in the constant force region as with processing of the EMG
decomposition data set, which can be seen in Figure 4-23 below.
Average normalised amplitudes were taken for each muscle and each repetition within the 5-
second constant force region, repetitions for each muscle in each condition were then averaged.
This provided two values for each muscle, in the tape and no tape condition, describing the
average muscle amplitude during the constant force region. An example of the data output can
be seen in Table 4-8 below.
Table 4-8 Example of average normalised EMG for the Rectus Femoris
Muscle Condition Rep Average Amplitude
(%)
Rec Fem Average
(%)
Rectus Femoris No Tape
1 23.99
23.95 2 26.10
3 21.74
Time (seconds)
Constant Force Region (5-Seconds)
Rep 1
Rep 2
Rep 3
Figure 4-23 Selection of 5-second period from constant force region for data extraction
Per
cen
tage
MV
C (
%)

91
4.8 Kinematic and Kinetic Processing Methods
Kinematic and Kinetic data captured from the motion capture system (3.2.3) and force plates
(3.2.4) respectively were exported, in Coordinate-3D (C3D) file format, from Qualisys Track
Manager. Data were imported into Visual 3D (Version 5.01.11, C-Motion Inc., USA) for
processing. Motion files were assigned to an anatomical model file (see section 3.5.5 for
details) and files tagged under the appropriate condition, tape or no tape.
4.8.1 Filtering
In order to attenuate high frequency components residing in the kinematic and kinetic signal,
introduced through various sources such as soft-tissue artefact or improper retro-reflective
marker digitization, filtering the data was necessary (Winter et al. 1974). Kinematic data was
filtered using a low-pass zero-lag Butterworth 4th order filter at 6 Hz (Winter et al. 1974).
Kinetic data was also subjected to a low-pass zero-lag Butterworth 4th order filter but with a 25
Hz cut-off frequency (Antonsson & Mann 1985). The filter cut-off frequencies for both the
kinematic and kinetic data were the same as used in study’s with similar protocols (Selfe et al.
2008; Selfe et al. 2011).
4.8.2 Cardan Sequence
The kinematic data was calculated based upon the Cardan sequence of XYZ following
recommendations from Grood and Suntay (1983). The joint coordinate systems were defined
as below (Table 4-9).
Table 4-9 Joint coordinate system and axes, planes of motion and respective movements
Axes Planes of Motion Movement
X Axis Sagittal Plane Flexion/Extension
Y Axis Coronal Plane Adduction/Abduction
Z Axis Transverse Plane Internal/External Rotation

92
4.8.3 Joint Moment Calculations
The knee joint moments were calculated relative to the shank coordinate system within Visual
3D. Force platform height was raised by 20cm in order to compensate for the step height and
thus adjust the joint moment calculation. Joint moments were normalised to subjects’ body
weight.
4.8.3.1 Sagittal Plane Knee Moment
The mean knee moment from the constant force region were calculated from the three
repetitions for each subject (Figure 4-24).
4.8.3.2 Coronal and Transverse Plane Knee Moment
The minimum and maximum knee moments from the constant force region were calculated,
thus providing a range of moment. The range of moments from the three repetitions in each
condition were averaged, consequently giving a mean range of moment for each subject. As
discussed in section 2.3.4 these measures were used following previous publications that
studied the knee joint biomechanics control in PFP patients and found that this measurement
provided key clinically important information on the control of PFP patients and measuring the
response to a proprioceptive intervention. The mean knee moment was also calculated for each
subject. These calculations were performed on the Coronal and Transverse planes (Figure
4-24).

93
4.8.4 Joint Angle Calculations
The knee joint angles were calculated relative to the shank coordinate system within Visual 3D
4.8.4.1 Sagittal Plane Knee Angle
The mean knee angle from the constant force region were calculated from the three repetitions
for each subject (Figure 4-25).
4.8.4.2 Coronal and Transverse Knee Angle
The minimum and maximum knee angles from the constant force region were calculated, thus
providing a range of motion. The range of motion from the three repetitions in each condition
were averaged, consequently giving a mean range of angle for each subject. Similar to the knee
joint range of moment and discussed in section 2.3.4 these measures were used following
Mean Moment
Min Moment
Max Moment
Range of Moment
Min Moment
Max Moment
Range of Moment
Figure 4-24 Joint Moment calculations and extracted information

94
previous publication studying the knee joint biomechanics control in PFP patients and found
that this measurement provided key clinically important information on the control of PFP
patients and measuring the response to a proprioceptive intervention. The mean knee angle
was also calculated for each subject. This calculation was performed on the Coronal and
Transverse planes (Figure 4-25).
Min Angle
Max Angle
Range of Motion
Min Angle
Max Angle
Range of Motion
Mean Angle
Figure 4-25 Joint Angle calculations and extracted information

95
4.9 Taping Intervention
A medial patella glide taping technique, which forms part of the McConnell technique
(McConnell 1986), was used throughout the thesis for symptomatic and non-symptomatic
subjects alike. Subjects were asked to lay supine with the leg in full extension so the tape could
be applied without any resistance from quadriceps contraction (McConnell 1986). Two 5cm
width pieces of self-adhesive polyester tape (Hypafix, Smith & Nephew, London, UK) were
measured as half the knee circumference and placed, with no stretch or pull, over the knee from
the lateral to the medial epicondyles covering the entire patella (Figure 4-26, step 1). This tape
was primarily used in order to protect the skin from the application of the rigid tape, however
it also served as a good fixation surface for the application of the rigid tape. Two 2cm width
pieces of Zinc Oxide high-tensile rigid tape (Leukotape, BSN Medical, Hull, UK) were
measured 2cm shorter than the polyester tape. Starting from the lateral aspect the tape was
anchored (Figure 4-26, step 2) with no stretch or pull, the patella was then glided medially and
held whilst the rigid tape was pulled medially over the patella and fixed to the medial aspect.
The rigid tape application was repeated with the second piece of tape overlapping the first
application (Figure 4-26, step 3). Finally, with the therapist holding the four corners of the
tape the subject was asked to fully flex and extended the knee 3 times in order to ensure good
adhesion of the tape to the skin. Subjects were given 1 minute to familiarise themselves with
the application and the feel of the tape. The application of the tape was conducted by the
researcher, whom is a trained therapist, with each subject to ensure reliability across subjects.

96
2) Application of Hypafix
tape across the knee. 3) Anchoring rigid tape and
medial glide of Patella.
4) Maintaining medial glide of
Patella whilst pulling rigid tape
medially and fixing to medial
side.
1) Completed application of
taping intervention.
Figure 4-26 Example application of taping intervention

97
5. Development of Methods
5.1 Introduction
In order to address the various methodological concerns four different pilot studies were
designed and executed, from which the respective findings could be applied in the design of
the main study protocol. These questions were raised in order to satisfy the study’s first MPhil
objective (see section 2.8.2). The main questions asked and explored were as follows:
5.1.1.1 Do the Vastus Medialis Obliquus and Vastus Medialis Longus present any
functional differences?
5.1.1.2 What is the optimal task which will provide a stability challenge and be
functionally appropriate whilst being applicable for use with surface EMG
decomposition technology?
5.1.1.3 What are the best methods for attaining a high fidelity EMG signal for
surface EMG decomposition?
5.1.1.4 Are there neurophysiological differences between open and closed kinetic
chain tasks and are they suitable for surface EMG decomposition?

98
5.2 Pilot Study 1 – Vastus Medialis Longus and Vastus Medialis Obliquus: What are the
Functional Differences?
5.2.1 Background
There has been a wealth of reports suggesting that the Vastus Medialis is comprised of two
differing portions of the muscle, namely the Vastus Medialis Longus (VML) and Vastus
Medialis Obliquus (VMO). The investigations and consequent debates over the past four
decades are yet to reach an empirically led conclusion on either the anatomical differences or,
perhaps more relevantly, whether there is any functional differences between the proposed VM
portions. A key aspect in understanding the function of a muscle is its neurophysiological
components and consequent behaviour, often investigated by the enquiry of the electrical signal
emanating from the muscle using EMG. The placement of EMG sensors on the surface of the
skin is a much discussed topic and it has been shown that sensor placement may have a
considerable effect on the temporal relationship of the vasti muscles (Wong & Ng, 2006),
which has been a commonly investigated variable within the study of patellofemoral pain
(Wong, 2009). However, whether there are functional differences exhibited in placing the
EMG electrode in differing locations on the muscle, or whether the muscle has differing
portions is yet to be substantiated.
5.2.2 Objectives
- Determine the motor unit behavioural differences between the two portions of the
Vastus Medialis (objective 5.5.1.1.1)
- Establish an optimal placement of the dEMG sensors on Vastus Medialis (objective
5.5.1.1.1)
5.2.3 Participants
Six participants, two females and four males, with a mean age of 27.2 years (S.D. = 7.4 years)
participated. All participants reported to be free from any pain or pathology affecting the spine
or lower limbs at the time of testing. Ethical clearance was obtained from the Faculty of Health
Ethics Committee (FHEC) of the University of Central Lancashire (UCLan) (Proposal 522,
appendix 12.5). Written informed consent was gained from subjects prior to participation.

99
5.2.4 Methods
Participants had the Vastus Medialis (VM) skin prepared by following the steps as described
in section 3.4.4. Once the skin was prepared a muscle stimulation device (Compex Mi-SPORT)
was used in conjunction with a motor point pen (Compex Motor Point Pen), as seen in Figure
5-1, to help locate the innervation zones within VM. The motor point pen produces a small 2
Hz electrical stimulation, therefore when the end of the motor point pen is placed over the top
of an innervation zone a small muscle twitch can be seen and felt by the subject.
Figure 5-1 The Compex Mi-Sport muscle stimulation device and the motor point pen.
The innervation zone(s) were marked and sensor locations were then situated avoiding these
locations as the characteristics of the EMG signal vary in amplitude and frequency components
when the sensor is on or near the innervation zones (Roy et al., 1986).

100
Figure 5-2. An example of the sensor and innervation zone locations, in both graphical
and real form.
Participants were asked to perform an isometric knee extension task whilst seated upon a
dynamometer (Cybex Norm), straps at the shoulder levels, pelvis and thighs were secured to
minimize unwanted or compensatory movement. The anatomical axis of rotation of the knee
joint was aligned with the dynamometer axis of rotation with the safety stops placed at 50° and
70°. The dynamometer was positioned to fix the knee joint angle at 60°. Participants were
first asked to perform a maximum voluntary contraction (MVC), which consisted of a 3 second
maximum knee extension, which was repeated 3 times with at least 60 seconds rest between
each repetition. Following the MVC protocol participants performed a knee extension action
following the trapezoidal trace with real-time sEMG as a form of feedback, the contraction was
maintained at 50% of the previously captured MVC. The knee extension task lasted for 20
seconds with an approximate 3 seconds ramping up and down phase, as described in (Figure
3-22, section 3.6.1). The signals from the four pairs of each sensor electrodes were
differentially amplified and filtered with a bandwidth of 20 Hz - 450 Hz, the signals were
sampled at 20 kHz and stored on a computer for offline processing.

101
5.2.5 Data Analysis
The raw EMG signals from the four channels of signals were decomposed into their constituent
motor unit action potential trains (MUAPTs) using the decomposition algorithm. The
individual MUAPTs and their firing instances were then used to calculate the mean firing rate
(MFR) for each motor unit, a description of the process can be found in section 4.4. The MFR
curves were filtered using a Hanning averaging filter over a 3-second window. The Hanning
window has a low pass filtering effect attenuating fast, transient changes in motor unit firing
rates (Westgaard & De Luca, 2001). A 5-second period from the constant force region, a
portion where there were no large fluctuations in force or newly recruited motor units, was
selected for analysis.
5.2.6 Results
The Vastus Medialis proximal and distal areas of the muscle both exhibited comparable mean
firing rates. A paired samples t-test was performed on the minimum firing rate (phasic motor
units) and the maximum firing rate (tonic motor units). No significant differences were
identified between the minimum (p=0.372) and maximum (p=0.263) mean firing rates motor
units of the proximal and distal areas of the muscle. The proximal and distal areas of the muscle
also exhibited comparable motor unit yields with no significant differences between the two
placements (p=0.912). The mean firing rate frequency (pulses per second, PPS) and the motor
unit yield for both placements, proximal and distal, are shown in Table 5-1.
Table 5-1. Mean firing rates and motor unit yields for both Vastus Medialis (VM)
proximal and distal placement
VM Proximal Area VM Distal Area
Min MFR
(pps)
Max MFR
(pps)
MU Yield
(Number MUs)
Min MFR
(pps)
Max MFR
(pps)
MU Yield
(Number MUs)
12.4
(S.D 2.2)
22.3
(S.D 3.9)
24.4
(S.D 9.8)
11.4
(S.D 1.9)
20.2
(S.D 3.8)
24.8
(S.D 6.9)
A typical representation of a subjects mean firing rate and motor unit yield from the two sensor
placements, both exhibiting similar behaviour, as seen below.

102
Figure 5-3. Mean firing rate (MFR) curves of a typical subject. Proximal placement (Red)
and distal placement (Blue).
5.2.7 Discussion
It was found that there were no significant differences in the motor unit mean firing rate or
motor unit yield between the two different identified areas, proximally and distally to the
innervation zone, of the Vastus Medialis. This is in agreement with neurophysiological
reasoning that muscle fibres, and consequently motor units, are evenly distributed throughout
the muscle belly (Basmajian & De Luca, 1985). These findings provide neuromuscular
evidence that the Vastus Medialis could be seen as acting as a single functional unit, rather than
the muscle operating as two distinguishable units. The comparable behavioural characteristics
of the motor unit mean firing rate and the motor unit yield are also in agreement with previous
literature (Roy et al., 1986; Zaheer et al., 2012) with respect to sensor placement. The dEMG
sensor placement should follow the same guidance as sEMG placement being placed
approximately in the middle of the muscle belly.
5.2.8 Conclusion
The findings from this pilot study provides guidance for the protocol of the main study, that
placement of the dEMG sensor can be either proximal or distal to the innervation zone and still
provide representative behaviour of the whole muscle. But the more important and clinically
Constant Force Region (5-Seconds)

103
significant finding to take from this study is it provides further evidence that the VM can be
considered as one functional muscle.
5.3 Pilot Study 2 - Develop a stability challenging and functional relevant task
5.3.1 Background
Closed kinetic chain exercises are extensively used within rehabilitation for a variety of knee
conditions, such as patellofemoral pain, often being preferred over open kinetic chain exercises.
Closed kinetic chain exercises engage multi-joint systems such as the lower limb functional
improvements in coordination, strength and control (Mellor & Hodges, 2005). However,
previous investigations using decomposition methods have performed isometric open chain
exercises, which may not provide a sufficient neuromuscular challenge or lack functional
relevance.
5.3.2 Objectives
Develop a stability challenging and functionally relevant task without compromising the use
of surface EMG decomposition methods (objective 5.5.1.1.2)
5.3.3 Methods
Four participants, two females and two males, with a mean age of 29.3 years (S.D. = 9.9 years)
participated. All participants reported to be free from any pain or pathology affecting the spine
or lower limbs at the time of testing. Ethical clearance was obtained from the Faculty of Health
Ethics Committee (FHEC) of the University of Central Lancashire (UCLan) (Proposal 522,
appendix 12.5). Written informed consent was gained from subjects prior to participation.
Participants were asked to perform four variations of knee loading tasks; single limb isometric
squat, sit-to-stand squat, double limb isometric squat and step down task. These closed chain
tasks were designed to challenge the knee joint sufficiently to replicate daily living loading
tasks whilst being subjectively acceptable and without comprising the surface EMG
decomposition methods.
Participants performed the four tasks, in a randomized order, with 3 repetitions of each task
with at least 60 seconds rest period between each repetition and task. The surface dEMG
sensors were placed on Vastus Medialis (VM) and Vastus Lateralis (VL) muscles following
the skin preparation procedure previously described (section3.4.4). The sensors were placed
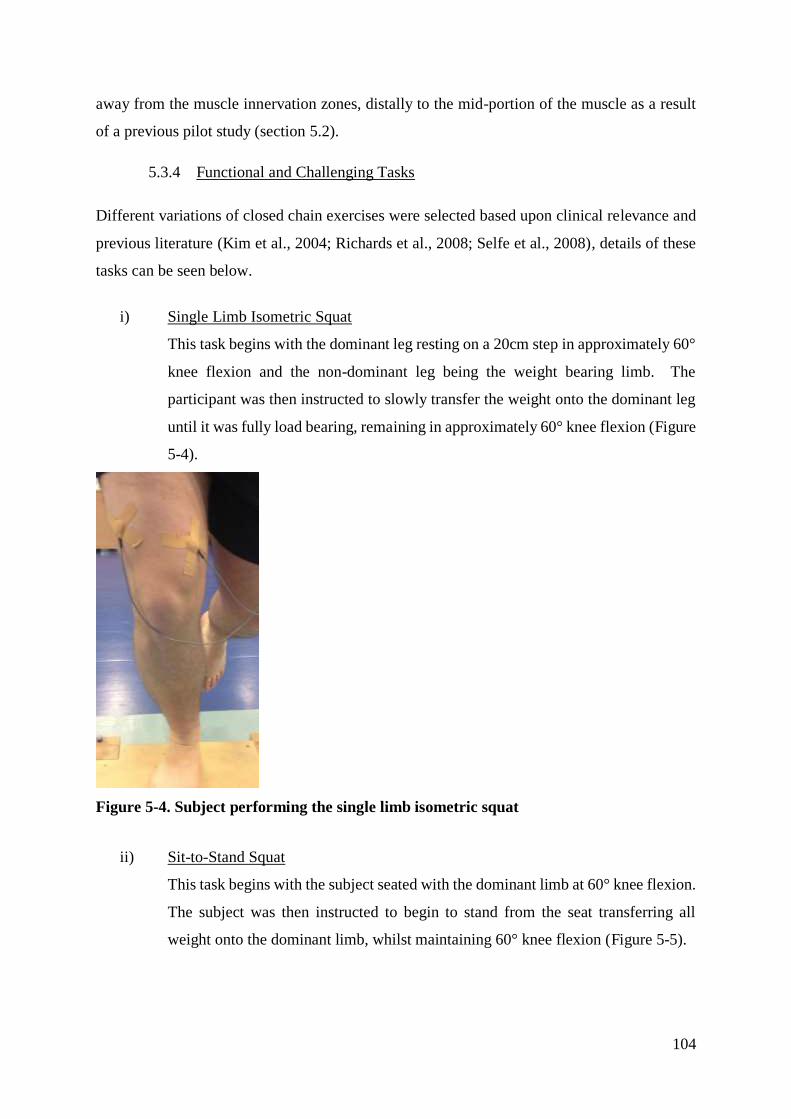
104
away from the muscle innervation zones, distally to the mid-portion of the muscle as a result
of a previous pilot study (section 5.2).
5.3.4 Functional and Challenging Tasks
Different variations of closed chain exercises were selected based upon clinical relevance and
previous literature (Kim et al., 2004; Richards et al., 2008; Selfe et al., 2008), details of these
tasks can be seen below.
i) Single Limb Isometric Squat
This task begins with the dominant leg resting on a 20cm step in approximately 60°
knee flexion and the non-dominant leg being the weight bearing limb. The
participant was then instructed to slowly transfer the weight onto the dominant leg
until it was fully load bearing, remaining in approximately 60° knee flexion (Figure
5-4).
Figure 5-4. Subject performing the single limb isometric squat
ii) Sit-to-Stand Squat
This task begins with the subject seated with the dominant limb at 60° knee flexion.
The subject was then instructed to begin to stand from the seat transferring all
weight onto the dominant limb, whilst maintaining 60° knee flexion (Figure 5-5).

105
Figure 5-5. Subject performing sit-to-stand squat
iii) Double Limb Squat
Participants began with both limbs fully extended and then when instructed slowly
flexed to approximately 60° knee flexion with both limbs sharing the load
distribution (Figure 5-6)
Figure 5-6. Subject performing double limb squat

106
iv) Step-down
This task begins with the subject standing upon a 20cm step and the non-dominant
limb bearing the full load. When instructed subjects were asked to transfer weight
onto the dominant limb and be the load bearing limb. Then subjects were instructed
to slowly descend from the step with the heel of the non-dominant limb hitting the
ground to avoid plantar flexion of the ankle (Figure 5-7). The task protocol was
based upon previous publication (Selfe et al. 2011; Selfe et al. 2008). Although the
Delsys dEMG system has strict guidelines and can only be applied to isometric
conditions, the algorithm does allow for discrete changes in MUAP shape. This
task was included to assess whether the algorithm was capable of decomposing this
semi-dynamic task.
Figure 5-7. Subject performing step-down task
5.3.5 Data Analysis
The dEMG data were processed using methods as described in the section 4.4. Successful
decomposition of the trials was the primary outcome measure, however data outputs were also
visually inspected to ensure the motor unit behaviour and motor unit yield was similar to
previous data collection sessions and previously published work. These outcomes were then
used as indicators to the suitability of the different tasks. Subjects were asked to provide verbal
feedback on the tasks being performed, which was noted against each task for face validity.

107
5.3.6 Results
The single limb isometric squat task exhibited the highest number of successfully decomposed
trials with 34 from a possible 36 trials. The double limb isometric task was also found to
provide a high number of successfully decomposed trials, 29 from a possible 36 trials. The sit-
to-stand and step-down tasks were too complex for the decomposition algorithm to resolve and
had a high number of failed trials, 13 and 22 failed trials respectively. Subject feedback
concluded that the single limb isometric and the step-down tasks were the most challenging of
the four tasks performed. The double limb isometric task was reported as not challenging as
subjects could share the load distribution through both limbs. The sit-to-stand task was
reported difficult to replicate similar movements and maintain the approximate 60° knee
flexion.
Visual inspection of the raw and processed decomposition data showed agreement with the
subjective feedback of the trials and related to the number of successfully decomposed trials,
with the single limb isometric squat being the most optimal.
Table 5-2. The four tasks subjects performed and their success rate of decomposing
5.3.7 Discussion
The study was conducted to develop a stability challenging and functionally relevant task
without compromising the use of the surface EMG decomposition methods. The findings of
the study showed that the single limb isometric squat task was the optimal solution.
The single limb isometric squat task created a sufficient stability challenge to the subjects as
opposed to the double limb isometric squat; subjects reported that during the double limb squat
they were able to compensate through distributing the load to the non-dominant limb. The sit-
to-stand task created a similar stability challenge to the subjects yet the procedure was difficult
Task
Trials
Single Limb
Isometric Squat
Double Limb
Isometric Squat
Sit-to-Stand
Squat Step-Down
Successful
Decomposed
Trials
34/36 29/36 23/36 14/36

108
to consistently repeat and control the same knee flexion angle, thus detrimental to the protocol
repeatability within and between subjects. The step-down task created a sufficiently
challenging task, however due to the change in knee angle as the subject stepped down the
EMG signals were too complex for the decomposition algorithms to resolve. The complexity
of the EMG signals during the step-down task caused the number of successfully decomposed
trials to be significantly reduced when compared to the other tasks. The inability of the
decomposition algorithm to accurately decompose these EMG signals is multifaceted, however
largely due to two factors. The short contraction period of the muscles, approximately 4
seconds, does not provide sufficient isolated MUAP shapes for the decomposition algorithm to
find shapes repeating. Secondly, the movement of the soft tissues underlying the skin where
the dEMG sensor is placed causes inaccurate and failed decomposition trials, due to the
detection area changing and large MUAP shape changes therefore different groups of motor
units were being detected.
5.3.8 Conclusion
This pilot study was aimed at developing a stability challenging yet functionally relevant task
without compromising the use of surface EMG decomposition methods. It was found that the
single limb isometric squat provided the optimal solution. The task sufficiently challenged the
subject, as found through subjective feedback, and was the most successfully decomposed task
with all subjects’ trials. These findings provide justification for the use of the tasks within the
main study protocol.

109
5.4 Pilot Study 3 –Signal Fidelity for Surface EMG Decomposition
5.4.1 Background
The EMG signal is the result of many physiological, anatomical and technical factors, with
some of these factors being managed by proper detection methods and technology whilst other
sources can only be considered. The factors affecting the EMG signal fidelity is an extensive
and daunting list, yet there are certain external factors which can be controlled and addressed
by the astute operator. A key component in gaining a high fidelity EMG signal for
decomposition is achieved with a high Signal to Noise Ratio (SNR) (Zaheer et al. 2012), which
is comprised of the EMG signal amplitude and the baseline noise component. EMG amplitude
can be affected by several factors with sensor location being the overriding factor, as discussed
in section 3.4. Likewise the baseline noise component is also affected by various factors,
including: skin-electrode interface, fatty tissue and mains line noise to name a few.
Decomposing the sEMG signal requires additional preparation techniques and considerations
as the variables of interest, motor unit behaviour, can be limited or masked in the presence of
a poor fidelity signal. Consequently the signal quality procedure is paramount in producing a
high motor unit yielding and accurate firing data set.
5.4.2 Objectives
- Investigate the mains line noise and its interference effect on surface EMG
decomposition signal quality (objective 5.5.1.1.3).
- Explore skin preparation techniques and determine the most effect for a high fidelity
surface EMG decomposition signal (objective 5.5.1.1.3).
5.4.3 Line Interference
The Delsys dEMG system (Delsys Inc., Boston, MA) and its constituent components are
powered by a medical grade power supply, being connected to the mains wall socket. This is
the manufactures recommended and typical setup for powering and operating the dEMG
system, however the typical setup does not account for every environment and may not be
suitable for an individuals’ setup. In order to assess the suitability of the main line power
connection and whether it has a detrimental effect on the EMG signal fidelity the system was
setup with two different scenarios, one using the medical grade power supply (Figure 5-8),
and the other using a bespoke battery pack (Figure 5-9).

110
1 Amplifier 4 Reference Electrode 7 Laptop
2 dEMG Sensor 5 Power Supply Unit
3 Input Module 6 A/D Board
1 Amplifier 4 Reference Electrode 7 Laptop
2 dEMG Sensor 5 Battery Power Pack
3 Input Module 6 A/D Board
1
2
3
4
7
5
6
Figure 5-8 Delsys dEMG setup with mains power supply
Figure 5-9 Delsys dEMG setup with bespoke battery pack

111
The dEMG sensor was placed directly onto the dermatode reference electrode as a method to
remove any noise source coming from the skin-electrode interface, consequently the baseline
noise exhibited is isolated to the dEMG system components and the mains power line. Data
collection was conducted for 60 seconds within EMGworks Acquisition (Delsys Inc., Boston,
MA) for both scenarios (mains power supply unit and battery power pack). The recorded data
was imported into EMGworks Analysis for post processing analysis of the baseline noise
comparing the two power supply scenarios.
Figure 5-10 shows an overlaid plot of the baseline noise from the two power supply sources,
the red plot representing the baseline noise collected when using the mains power supply unit
and the blue plot representing the bespoke battery power pack.
Figure 5-10 Raw baseline noise of the dEMG system with mains line power connection
(red) and bespoke battery power pack (blue)

112
Further investigation of the baseline noise, through the Power Spectral Density, shows that the
main line connection (red line) was contaminated with 50 Hz line interference (Figure 5-11).
Figure 5-11 Power Spectral Density of the baseline noise for the mains power
connection (red) and battery power pack (blue)
These explorations and findings provide clear evidence of 50 Hz noise entering the dEMG
system when the mains power supply is used to power the dEMG system. These issues seem
local to the data collection area and difficult to identify and consequently mitigate, however it
is also clear that the issue can be avoided when using the bespoke battery power pack for the
dEMG system.

113
5.4.4 Skin Preparation Techniques
The electrode pins and the inter-electrode distance of the dEMG sensors are critical design
features but, by their nature, generate more skin-electrode interface noise than traditional
sEMG sensors. Attaining a high fidelity EMG signal suitable for surface EMG decomposition
requires additional skin preparation considerations in comparison to traditional EMG data
collection, which is often satisfied with the application of a 70% Isopropyl pad/wipe.
The skin above the Vastus Medialis muscle was prepared, on a single subject, in three different
stages whilst monitoring the effect on the baseline noise component of the signal. The Vastus
Medialis was selected as it would be one of the two muscles investigated in the main study and
would provide the more challenging task due to the increased adipose tissue and muscle-skin
distance in comparison to the Vastus Lateralis. The Delsys dEMG system was setup following
the findings from the exploration into the line interference with the battery power pack. The
dEMG sensor was placed on Vastus Medialis muscle, following the skin preparation stage, and
the dermatode reference electrode was placed on the dorsal aspect of the hand.
Skin Preparation stages:
5.4.4.1 Hair Removal and Alcohol wipe
Hair was removed using a hair removal cream followed by cleansing the application site with
a 70% Isopropyl wipe. The typical resulting baseline noise was in the region of 20uV peak to
peak.
5.4.4.2 Above including; tape application and removal
In addition to the previous preparations (5.4.4.1) hypoallergenic tape was applied to the
application site and swiftly removed in order to remove dead layers of skin, this was repeated
3-5 times. This was followed by re-cleansing the area with an alcohol wipe to remove any tape
glue residue. The typical resulting baseline noise was consequently improved and in the region
of 16uV peak to peak.

114
5.4.4.3 Above including; re-hydrate skin, securing the sensor further
In addition to the two previous preparation stages (5.4.4.1 and(5.4.4.2) the application site was
hydrated by applying small amounts of water and soap, the skin was given approximately 30
seconds to absorb and rehydrate. The skin was then re-cleansed using an alcohol wipe to
remove any remaining soap. In order for the sensor electrodes to make better contact with the
skin, a small plastic disc was applied over the top of the sensor to act as a lever and
consequently apply additional pressure on the sensor and the skin (Figure 5-12). The typical
baseline noise resulting from these skin preparation techniques was in the region of 11uV peak
to peak.
The findings from these explorations into the different skin preparation techniques show that
the extensive skin preparations (5.4.4.3) can provide a very low baseline noise level, although
the procedures require additional efforts and time the reward is a high fidelity EMG signal.
These skin preparation techniques will be applied in all data collection sessions using the
surface EMG decomposition system.
5.4.5 Conclusion
The findings from the line interference exploration show that the dEMG system and data
collections sessions should be conducted using the bespoke battery power pack as it mitigates
the mains line noise that is evident in the laboratory area. The skin preparation explorations
also provided a technique that, although rather extensive, provided a low baseline noise and
should be used in all dEMG data collection sessions. Both of these explorations have provided
optimal techniques and preparations in attaining a high fidelity EMG signal, which will
consequently lead to a high yielding motor unit and highly accurate firing data set.
Figure 5-12 The small plastic disc used to compress the sensor onto the skin

115
5.5 Pilot Study 4 – Open and Closed Chain Activities: MU Characteristics
5.5.1 Background
Open kinetic chain (OKC) and closed kinetic chain (CKC) exercises have been a topic of
interest for many years in the rehabilitation field. However, there is limited evidence in the
neuromuscular, particularly motor unit behavioural, differences between the two forms of
exercises. A previous limitation in understanding the muscular control is the inability to record
a sufficient representation of motor units from a muscle contraction. But recent developments
in surface EMG decomposition (dEMG, Delsys Inc., Boston, MA) provide the ability to
reliably record high yields of motor units from the surface of the skin. All previous
investigations using EMG decomposition methods have used OKC exercises as a method to
study an isolated muscle and the central nervous systems control of the given muscle. The
isometric OKC exercises that have been studied using EMG decomposition methods have been
shown to be highly accurate and validated methods, however isometric CKC exercises have
not been studied and so the accuracy or validity requires exploration.
5.5.2 Objectives
- Determine the efficacy of using a closed kinetic chain exercise using surface EMG
decomposition methods in comparison to a previous validated open kinetic chain
exercise (objective 5.5.1.1.4).
- Explore the motor unit characteristic differences between the open and closed
kinetic chain exercises (objective 5.5.1.1.4).
5.5.3 Methods
The Delsys dEMG system (Delsys Inc., Boston, MA) was used to collect surface EMG
decomposition data and setup in as previously described in section 5.4. The dEMG sensors
were placed on the Vastus Medialis and Vastus Lateralis muscles following the skin
preparation as outlined in section 3.4.4. Participants were first instructed to perform a
maximum voluntary contraction (MVC), which consisted of a 3 second maximum knee
extension, being repeated 3 times with at least 60 seconds rest between each repetition.
Following the MVC protocol participants were instructed to follow the 30 second trapezoidal
tracking paradigm (section 3.6.1), with participants instructed to maintain the held at 50%

116
MVC constant force region. The force level was chosen as it provided an ample challenge to
subjects’ knee extension, a lesser contraction may not have provided a sufficient force to
challenge the Vasti and a greater challenge could have caused fatigue. Participants performed
both open and closed kinetic chain exercises, the order being randomly assigned.
Thirteen participants, 4 female and 9 male, with a mean age of 28.3 years (S.D. = 5.8 years)
participated. All participants reported to be free from any pain or pathology affecting the spine
or lower limbs at the time of testing. Ethical clearance was obtained from the Faculty of Health
Ethics Committee (FHEC) of the University of Central Lancashire (UCLan) (Proposal 522,
appendix 12.5.1). Written informed consent was gained from subjects prior to participation.
5.5.3.1 Open Kinetic Chain Exercise
Participants were instructed to perform an isometric knee extension task whilst seated upon a
dynamometer (Cybex Norm), straps at the shoulder levels, pelvis and thighs were secured to
minimize unwanted or compensatory movement. The anatomical axis of rotation of the knee
joint was aligned with the dynamometer axis of rotation with the safety stops placed at 50° and
70°. The dynamometer was positioned to fix the knee joint angle at 60°. Figure 5-13 shows
the setup of a participant on the dynamometer with the dEMG sensor placed on the Vasti
muscles.
Figure 5-13 Open kinetic chain exercise participants performed on the dynamometer with the
dEMG sensors placed on the Vasti muscles.

117
5.5.3.2 Closed Kinetic Chain Exercise
Participants were instructed to place and rest their dominant leg on a 20cm step in 60° knee
flexion, measured with a goniometer, and allow the non-dominant leg to fully weight bear.
The participant was then instructed to slowly transfer the weight onto the dominant leg until
it was fully load bearing, remaining in 60° knee flexion (Figure 5-14).
Figure 5-14 Closed kinetic chain exercise participants performed with the dEMG sensors
placed on the Vasti muscles.
5.5.4 Data Analysis
The EMG data was imported into EMGworks Analysis (Delsys Inc., Boston, MA) where all
contractions were decomposed using the decomposition algorithm, for details see section 4.2.
The Mean Firing Rate (MFR) was computed using a 3-second Hanning window (section 4.4).
A 5 second constant force region was selected, ignoring the recruitment and de-recruitment
phases of the contraction, where the average MFR was computed. The mean and standard
deviation of the MFR were computed for all contractions for individual participants. The mean
MFR values for both tasks were statistically analysed using a paired samples t-test (IBM Corp.
Released 2012. IBM SPSS Statistics for Windows, Version 21.0. Armonk, NY: IBM Corp.).
Six participants’ open kinetic chain data were omitted from data analysis due to poor motor
unit yield, from the fact of low signal-noise ratio, in the Vastus Medialis muscle. The low
signal-noise ratio was not evident in the CKC exercise for the same participants, and was only
seen in the OKC exercise.

118
5.5.5 Results
The mean MFR results for the two different tasks, open and closed kinetic chain, showed
comparable results with 17.2 pps and 18.1 pps for the open kinetic chain and closed kinetic
chain tasks respectively for the Vastus Medialis. Similar results were found for the Vastus
Lateralis with mean MFR results of 15.8 pps and 16.7 pps for the open kinetic chain and closed
kinetic chain tasks respectively. The paired samples test showed no significant differences
between the mean MFR for both Vastus Medialis and Vastus Lateralis with p-values of 0.62
and 0.57 respectively. A summary of these results can be seen in Table 5-3.
Table 5-3 Results table showing the mean MFR, standard deviations and significance
value for the two Vasti during the different tasks.
Task Mean MFR (pps) p-Value
Vastus Medialis
Open Kinetic Chain
(Isometric Knee Extension)
17.2
(3.1) 0.62
Closed Kinetic Chain
(Single Limb Isometric Squat)
18.1
(2.9)
Vastus Lateralis
Open Kinetic Chain
(Isometric Knee Extension)
15.8
(4.1) 0.57 Closed Kinetic Chain
(Single Limb Isometric Squat)
16.7
(0.8)
5.5.6 Discussion
The aim of this study was to determine the efficacy of using a closed kinetic chain (CKC)
exercise with surface EMG decomposition methods and whether any motor unit characteristic
differences were evident between the two different forms of exercise, open and closed kinetic
chain. After collecting and decomposing surface EMG data from the Vastus Medialis and
Vastus Lateralis during both open and closed kinetic chain tasks it was found that there were
no significant differences (p>.05) for both muscles. As shown in Table 5-3 the motor unit
firing rate was comparable between the two tasks, with only a marginal (>1 pps) increase in
firing rate in the CKC exercise. The results provide evidence for the viability of using a
controlled CKC exercise for surface EMG decomposition methods due to the successful

119
decomposition of the data set and the comparable motor unit mean firing rates between the two
tasks. Poor motor unit yields were found in six subjects’ Vastus Medialis data sets and were
consequently omitted from the results. This is not thought to be due to any methodological
issue as these participants’ CKC data sets for Vastus Medialis exhibited a high signal-noise
ratio and consequent good motor unit yield. Instead this discrepancy is thought to be due to
these participants biasing their Rectus Femoris muscle in the OKC knee extension task and this
task not requiring a significant Vastus Medialis contribution, which was required during the
CKC exercise.
5.5.7 Conclusion
This pilot study was successful in its objectives in establishing the efficacy for using a closed
kinetic chain exercise with the surface EMG decomposition methods. Results provided
evidence in showing comparable motor unit characteristics between the much published open
kinetic chain exercises for surface EMG decomposition and the newly proposed closed kinetic
chain exercise. These findings provide assurances for using the closed kinetic chain exercise,
single limb static squat in the main study protocol.

120
5.6 Summary of Findings
The pilot studies satisfied the MPhil objective of developing appropriate and relevant methods
to capture the host of neuromuscular and biomechanical measures relevant for the investigation
into Patellofemoral Pain. A summary of the main findings from the pilot studies can be seen
below:
- It was found that the placement of the dEMG sensor on the Vastus Medialis
provides the same motor unit firing behaviour regardless whether it is on the oblique
or longus portions, suggesting that the Vastus Medialis can be considered a single
functional muscle.
- The newly developed single limb isometric squat task was found to be the optimal
task for being both a functionally challenging task and without comprising the
surface EMG decomposition methods.
- The dEMG system was found to be best operated with the use of a bespoke battery
pack after finding significant line interference with the mains line power source.
- An optimal skin preparation technique was developed providing the lowest baseline
noise and consequently allowing a higher fidelity signal.
- It was found that using the surface EMG decomposition technique in a functional
closed kinetic chain exercise was comparable to the traditionally used open kinetic
chain exercise.
These findings provide a clear justification for the design of the main studies protocol ensuring
that the data collected is of high fidelity, comparable to previous work and clinically applicable.

121
6. Method - Non-Symptomatic Subjects
6.1 Introduction
This chapter provides the pertinent information relating to the non-symptomatic subjects data
collection methods and procedures.
6.2 Subjects
Subjects were recruited from a population of staff and students at the University of Central
Lancashire (UCLan). Subjects were provided with a ‘Patient Information Sheet’ prior to
attending any testing session, the patient information sheet provided study information and
what was expected of them (see appendix 12.2). Based on previous study by Selfe et al. (2008)
who investigating the effect of proprioceptive bracing on biomechanical parameters, mean
differences were greater than the standard deviations. The knee transverse plane range of
moment yielded a mean difference 0.035 Nm/kg with a standard deviation of 0.03 Nm/kg
during a step-down task. A statistical power calculation yields that with an 80% statistical
power and a significance level of 5% the sample size needs 12 subjects to detect any significant
changes in the biomechanical parameters to be investigated. Sixteen non-symptomatic subjects
were enrolled onto the study, with three subjects omitted from the results due to poor data
quality (see appendix 12.1.1 for details), leaving 13 non-symptomatic subjects for data
processing (4 females and 9 males, aged 30 years (SD 6.5 years), mean weight 74.6 kg (SD
12.5 kg)).
6.3 Ethical Approval
The study was approved by the Faculty of Health & Social Care Ethics Committee (FHEC),
University of Central Lancashire (Proposal no. 522) (see appendix 12.5.1). Prior to data
collection written informed consent (see appendix 12.3) was gained from all subjects.
6.4 Recruitment Criteria
6.4.1 Inclusion Criteria
The inclusion criteria of symptomatic subjects being eligible to participate in the study can be
seen listed below:
- Males and Females to be included
- Age Range 18-40 years old

122
- Able to hold a static squat position for at least 8 seconds
6.4.2 Exclusion Criteria
The exclusion criteria of symptomatic subjects being unable to participate in the study can be
seen listed below:
- Recent knee surgery or trauma (within 3 months)
- Ligamentous instability and/or internal derangement (Subjects should be referred for
arthroscopy or Magnetic Resonance Imaging (Acton & Craig 2000)
- History of patella subluxation or dislocation
- Confirmed osteoarthritis of tibiofemoral and/or patellofemoral joints
- Joint effusion when the mid-patellar girth is 5% or more than the non-involved knee
- True knee joint locking and/or giving way
- Co-existent acute illness or chronic disease
- Bursitis, patella or iliotibial tract tendinopathy, Osgood Schlatter’s disease, Sinding-
Larsen Johansson Syndrome, muscle tears or symptomatic knee plicae
- Pregnant or breast feeding
6.5 Data Collection Procedures
Testing took place in the movement analysis laboratory (Brook Building, UCLan, Preston
Campus, Preston UK). Surface EMG, Surface EMG Decomposition, motion capture and force
plates were all used for data collection, see chapter 3 for details pertaining to the technical and
setup aspects. Subjects skin were prepared for placement of dEMG sensors and sEMG sensors
(see section 3.4.4 for details), followed by placement of retro-reflective markers on the
appropriate landmarks (see section 3.5.5). Following camera and force plate calibration (see
section 3.5.2 and 3.5.4 respectively) subjects were asked to perform a single limb isometric
squat task (Figure 6-1), either beginning with the taped condition or the no tape condition
dependent on the randomised order. Subjects were provided with a familiarisation repetition
to ensure they understood the instructions and that data collection tools were operating as
expected.
Subjects were given clear instructions from the operator which remained the same through all
repetitions for all subjects. These ensured that surface EMG decomposition data could follow
the tracking paradigm (see section 3.6.1) and that the operator did not influence different

123
movements through differing instructions or delivery of speech (i.e. pitch, tone, volume). The
instructions provided to all subjects were as follows:
- “Place your right/left leg on the step and stand quietly”
Subjects place their measurement limb onto the 20cm wooden step with their weight in the
opposing limb, the “quietly” instruction meaning for the subject to remain still and no
movement.
- “Begin to ramp up”
Subjects were then asked to transfer the weight from the weight bearing limb onto the
measurement limb. The subjects were asked to count to 3 seconds before being fully load
bearing.
- “Hold that position”
Subjects held the same knee angle and attempted to remain in the position.
- “Begin to ramp down”
In opposition to the ramping up phase subjects were asked to slowly transfer weight back to
the non-measurement limb, again over a 3-second period.
Subjects were asked to perform the single limb isometric squat task 4 times under each
condition, tape and no tape, with a 60-second rest period in-between each repetition. Subjects
were asked if they felt comfortable and okay to continue after each repetition, however no
information was provided on their performance of the task. The test condition order was
randomised by using an online randomisation generator (Dallal 2013).
Figure 6-1 Closed kinetic chain exercise participants performed with the dEMG sensors
placed on the Vasti muscles.

124
7. Results – Non-Symptomatic Subjects
7.1 Overview
A battery of differing neurophysiological and biomechanical variables were investigated,
Figure 7-1 presents a graphical representation of these measures. All results from the non-
symptomatic subjects were grouped together and analysed as such. However, in order to
explore whether different strategies are present, individual analysis was conducted. Details of
each parameter and their respective findings can be seen in the following chapter, in grouped
and individual analyses.
Figure 7-1 Graphical representation of the variables investigated in the non-
symptomatic group
7.2 Knee Joint Biomechanics
In order to investigate the mechanical control of the knee joint kinematic and kinetic data were
calculated and extracted for the three planes of movement. For the sagittal plane the mean
moment (Nm/kg) and mean angle (degrees) from the constant force region were extracted to
provide information on the squat position between the two conditions. Investigations into the
coronal and transverse planes of movement explored the range of moment (Nm/kg) and range
of motion (degrees) from within the constant force region.
Movement Strategy
Motor Unit Firing Rate
Common Drive
Motor Unit Recruitment
Surface EMG
Knee Joint Moment
Knee Joint Angle

125
7.2.1 Grouped Analyses
7.2.1.1 Sagittal Plane
A paired samples t-test was conducted on the sagittal plane mean knee joint moment and the
sagittal plane mean knee joint angle. The results showed no significant differences between
the two conditions for the mean moment (p=0.84) or the mean angle (p=0.89). Descriptive
statistics of the mean moment and angle can be seen in Table 7-1. These results essentially
rule out any change or differences being due to different knee bend depths.
Table 7-1 Sagittal plane knee joint moment and angle descriptive statistics
Sagittal Plane
Non-symptomatic
Subjects
No Tape Tape
Mean
Difference
Confidence
Interval of the
difference (95%)
p-Value
Mean
(SD)
Mean
(SD)
Mean Moment
(Nm/kg)
1.04
(0.22)
1.03
(0.19) 0.002 -0.03 to 0.03 0.84
Mean Angle
(Degrees)
47.80
(5.9)
47.94
(5.7) -0.14 -2.23 to 1.99 0.89
7.2.1.2 Coronal Plane
A paired samples t-test was conducted on the coronal plane range of moment and mean moment
as well as the range of motion and mean angle. Results (Table 7-2) did not indicate any
significant differences between the two conditions for range of moment (p=0.24) or for range
of motion (p=0.52). Significant differences were seen in the mean knee joint moment (p=0.02)
and mean joint angle (p=0.003), however the mean differences demonstrate marginal mean
differences and large standard deviations, in addition taking into account this is the mean
measurement the clinical significance of these results should be considered.

126
Table 7-2 Coronal plane knee joint moment and angle descriptive statistics
Coronal Plane
Non-symptomatic
Subjects
No Tape Tape
Mean
Difference
Confidence
Interval of the
difference (95%)
p-Value
Mean
(SD)
Mean
(SD)
Mean Moment
(Nm/kg)
-0.24
(0.14)
-0.21
(0.13) -0.03 -0.04 to -0.01 0.02
Range of Moment
(Nm/kg)
0.11
(0.04)
0.10
(0.03) -0.008 -0.02 to 0.01 0.24
Mean Angle
(Degrees)
-0.51
(3.63)
0.06
(3.65) -0.45 -1.88 to -0.48 0.03
Range of Angle
(Degrees)
2.10
(0.84)
2.20
(0.78) 0.056 -1.3 to 2.4 0.52
7.2.1.3 Transverse Plane
Paired samples t-test conducted on the transverse plane range of moment and range of motion
showed that there was a significant decrease in the range of moment (p=0.01) in the tape
condition. However, the range of motion, mean angle or mean moment for the transverse plane
did not show significance. Descriptive statistics of the transverse plane range of moment and
range of motion can be seen in Table 7-3.

127
Table 7-3 Transverse plane knee joint moment and angle descriptive statistics
Transverse Plane
Non-symptomatic
Subjects
No Tape Tape
Mean
Difference
Confidence
Interval of the
difference (95%)
p-Value
Mean
(SD)
Mean
(SD)
Mean Moment
(Nm/kg)
0.05
(0.04)
0.05
(0.04) 0.0002 -0.006 to 0.006 0.94
Range of Moment
(Nm/kg)
0.07
(0.03)
0.05
(0.01) -0.015 -0.02 to 0.01 0.01
Mean Angle
(Degrees)
2.21
(5.77)
1.97
(6.16) 0.24 -1.88 to -0.48 0.55
Range of Angle
(Degrees)
2.03
(0.47)
2.08
(0.32) 0.049 1.8 to 2.7 0.64
7.2.2 Individual Analyses
The range of moment and range of motion with their respective standard deviations were
reported (see appendix 12.1.2) for each subject in the tape and no tape conditions. The results
demonstrated inter-subject variability in the response to the tape condition, for example subject
4 exhibited a 37.4% decrease in range of moment in the coronal plane in the tape condition
(Figure 7-2), however subject 10 showed a 31.7% increase in the same plane of movement
(Figure 7-3). The variability was also shown in the transverse planes range of moment but with
a trend towards a decrease in range of moment in response to tape.

128
Time (seconds)
Nm
/kg
Figure 7-3 Example of a subject with a large increase in coronal plane knee moment with
tape condition (red) compared to no tape (blue)
Time (seconds)
Nm
/kg
Figure 7-2 Example of a subject with a large decrease in coronal plane knee moment with
tape condition (red) compared to no tape (blue)

129
Similar variability was also seen with the range of motion demonstrating increase and decreases
in response to tape, for example subject 9 showed an increase of 23.9% in the coronal plane
range of motion in the tape condition (Figure 7-4). Conversely subject 7 showed a decrease of
20.2% in the coronal plane range of motion in the tape condition (Figure 7-5)
Time (seconds)
Deg
rees
Figure 7-5 An example of a subject decreasing coronal plane range of motion in the tape
condition (red) compared to the no tape (blue)
Time (seconds)
Deg
rees
Figure 7-4 An example of a subject increasing coronal plane range of motion in the tape
condition (red) compared to the no tape (blue)

130
7.3 Surface EMG
The normalised Root Mean Square (RMS) EMG data from the constant force region were
extracted from EMGworks Analysis to quantify the muscle activity from the Gastrocnemius,
Bicep Femoris, Rectus Femoris and Gluteus Medius.
7.3.1 Grouped Analyses
A paired samples t-test was conducted on the EMG data showing that there were not any
significant changes in the muscle activity in response to tape. The Gluteus Medius did exhibit
a 4.8% decrease in muscle activity in the taped condition and is close to becoming significant,
although the large standard deviation of 8.5% shows the variance amongst the subjects with
the Gluteus Medius. The other muscles similarly exhibit relatively high standard deviations
with respect to their mean values, indicating the inter-subject variability.
Table 7-4 sEMG results from grouped analysis of the non-symptomatic subjects showing
the EMG activity response to the taping intervention
Mean Surface EMG
Activity (% MVC)
Non-symptomatic
Subjects
No Tape
Tape
Mean
Difference
Confidence
Interval of the
difference (95%)
p-Value
Mean
(SD)
Mean
(SD)
Gastrocnemius 29.3
(8.1)
29.0
(11.2) 0.32 -7.3 to 6.7 0.92
Bicep Femoris 35.7
(11.0)
33.5
(11.4) 2.13 -0.8 to 5.1 0.14
Rectus Femoris 36.7
(12.6)
35.5
(10.9) 1.18 -1.7 to 4.1 0.39
Gluteus Medius 40.1
(13.5)
35.2
(10.9) 4.81 -0.6 to 10.2 0.08

131
7.3.2 Individual Analyses
The mean difference between the two conditions were calculated for each subject for all four
muscles to investigate individuals’ response to the tape condition. The results (see appendix
12.1.3) highlight the fact that subjects responded in differing magnitudes and direction with
each muscle. For example subject 6 showed a reduction of 23 % in their Gluteus Medius,
whereas subject 4 increased by 9.9 % with the application of tape. In addition to these large
changes in muscle activity it was found that subtle, yet opposite, behaviours can be seen across
the muscle groups and subjects for instance 7 subjects exhibited a reduction in Bicep Femoris
muscle activity whilst 5 subjects showed an increase.

132
7.4 Mean Firing Rate
The average MFR was entered into SPSS for descriptive analysis, extracting the mean, standard
deviation and range for the tape and no tape condition in both Vasti. As the data was normally
distributed the mean, standard deviation and ranges were reported. It was deemed
inappropriate for the mean firing rate to be subjected to statistical analyses because the mean
firing rate is a detailed and sensitive measure, thus computing statistical analyses may mask
the subtle and intricate information that it provides.
7.4.1 Grouped Analyses
The average MFR results for the non-symptomatic subjects showed little response to the tape
condition in the grouped analysis, as shown in table 7-5. The Vastus Medialis exhibited a 0.8
pps increase in its firing rate, representing a 4.5% change in response to tape. The Vastus
Lateralis showed a decrease of 0.6 pps in its firing rate, a 3.3% reduction, in response to the
taping condition. The decrease in Vastus Lateralis firing rate is also represented in the shift in
the range of firing rate from a maximum of 33.6 pps to 30.9 pps and minimum of 6.2 pps to
5.6 pps.
Table 7-5 Grouped analysis of all non-symptomatic subjects average MFR, standard
deviations and MFR minimum and maximum values
Mean Firing Rate
Non-symptomatic
Subjects
Average
MFR (pps)
(SD)
Mean
Difference
Confidence
Interval of the
difference (95%)
Range MFR
p-Value
Vastus Medialis
No Tape
17.7
(4.5)
-0.83 -2.37 to 0.71
5.5 - 33.9
0.26
Vastus Medialis
Tape
18.5
(4.9) 6.4 - 33.5
Vastus Lateralis
No Tape
18.3
(3.9)
0.61 -0.17 to 1.39
6.2 - 33.6
0.11
Vastus Lateralis
Tape
17.7
(4.1) 5.6 - 30.9

133
7.4.2 Individual Analyses
The average MFR and standard deviation values were extracted from SPSS for the two
conditions and the two muscles (see appendix 12.1.4). There is evidently inter-subject
variability within the MFR data set with subjects employing different strategies and responses
to the taping condition. Subject 4 for example showed an increase in the Vastus Medialis MFR
during the taped condition increasing the firing rate by 4.1 pps or a 23.4% increase (Figure
7-6). However, subject 8 responded to the taping condition with opposite behaviour with a
reduction of 3.5 pps or 19.1% in the Vastus Medialis (Figure 7-7).
Mea
n F
irin
g R
ate
(Puls
es P
er S
eco
nd)
Figure 7-6 Example of an individuals response to tape (red) compared to no tape (blue) showing
an increase in mean firing rate in the tape condition
Mea
n F
irin
g R
ate
(Puls
es P
er S
eco
nd)
Figure 7-7 Example of an individuals response to tape (red) compared to no tape (blue) showing
a decrease in mean firing rate in the tape condition

134
7.5 Common Drive
Common drive is the term coined for the physiological phenomenon that the nervous system
controls pools of motor units that can be observed through the common fluctuations in motor
unit firings. To extract these common fluctuations the mathematical function called cross-
correlation is used. A cross-correlation on pairs of motor units were computed for both Vasti
in the tape and no tape condition, if no correlation was found between a pair of motor units it
was automatically omitted from further analysis. The peak cross-correlation values from
Vastus Medialis and Vastus Lateralis were extracted from EMGworks Analysis and entered
into SPSS for statistical analysis. The median and inter-quartile range (IQR) were selected as
it was found that the data was not normally distributed and therefore unsuitable for parametric
testing.
7.5.1 Grouped Analyses
Frequencies statistics calculated the median and IQR for each of the four conditions (no tape
and tape for Vastus Medialis and Vastus Lateralis) grouping all subjects from the non-
symptomatic cohort. Table 7-6 shows the median and IQR (25th and 75th percentiles) values
for each of the two conditions in the two muscles. The median values of the peak cross-
correlation function show that there is marginal reduction of 0.01, or 2.4%, in the tape condition
for Vastus Medialis. No change within the Vastus Lateralis in the two different conditions
were found.
Table 7-6 Grouped common drive results from the non-symptomatic subjects showing
the median and inter-quartile range (25th and 75th percentile) for the two conditions in
the two muscles.
Common Drive
Vastus Medialis
(IQR)
Vastus Lateralis
(IQR)
No Tape Tape No Tape Tape
Non-symptomatic
Subjects
0.41
(0.25-0.55)
0.40
(0.25-0.56)
0.41
(0.26-0.55)
0.41
(0.26-0.56)

135
Figure 7-8 and Figure 7-9 present the normalised (section 4.5.7) cross-correlation data for the
Vastus Medialis and Vastus Lateralis respectively, with each figure showing the two
conditions. Figure 7-8 shows the grouped non-symptomatic subjects cross-correlation results
from the Vastus Medialis and presents the marginal reduction in common drive as shown in
Table 7-6 with the peak cross-correlation being shifted to the left in the tape condition.
Figure 7-8 Cross-correlation data from grouped non-symptomatic subjects in the Vastus
Lateralis in the two different conditions.
Figure 7-9 Cross-correlation data from grouped non-symptomatic subjects in the Vastus
Medialis in the two different conditions.

136
7.5.2 Individual Analyses
Further exploration of the common drive in individuals were undertaken by extracting the
median and IQRs from SPSS, for each of the non-symptomatic subjects. The results (see
appendix 12.1.5) show that different subjects have differing strategies and responses to the
taping condition. For example subject 12 exhibited a 0.07 increase in the cross-correlation
function to the Vastus Medialis in the taping condition, representing an 18% increase in
common drive (Figure 7-11). However, subject 9 did not exhibit any changes in the Vastus
Medialis but instead demonstrated a 0.05 decrease in cross-correlation function in the Vastus
Lateralis, representing an 11.4% decrease in common drive (Figure 7-10).
Figure 7-10 Example of a decrease in common drive in tape condition (red) compared
to no tape (blue) in the Vastus Lateralis
Figure 7-11 Example of an increase in common drive in tape condition (red)
compared to no tape (blue) in the Vastus Medialis

137
7.6 Recruitment Threshold
To calculate the recruitment threshold, the excitation point of the muscle at which the motor
unit becomes active, the first firing of each motor unit was found and the corresponding MVC
percent of the peak knee moment was established. The MUAT calculation script within
EMGworks Analysis was used to calculate the recruitment threshold for each motor unit for all
subjects. The recruitment threshold of each motor unit and the motor unit mean firing rate
were extracted from EMGworks Analysis and a linear regression was performed within SPSS
with the recruitment threshold being the independent variable and mean firing rate as the
dependent variable. The linear regression will provide information on the recruitment strategy
of the muscle and its response to the taping intervention.
7.6.1 Grouped Analyses
The regressed recruitment threshold and mean firing rate data from all non-symptomatic
subjects were calculated. The R Squared for both muscles were computed showing values of
0.37 and 0.51 for the Vastus Medialis and Vastus Lateralis respectively showing that the
recruitment threshold of motor units were inversely related to the mean firing rate as seen in
previous work (De Luca & Hostage 2010). The intercept and slope results can be seen in Table
7-7 for the grouped non-symptomatic subjects. The results show that the Vastus Medialis
intercept point significantly increases in response to the tape condition (Figure 7-12). The
Vastus Medialis slope gradient is consequently also significantly different displaying a steeper
slope gradient. Although these results demonstrate a statistical change in response to tape the
mean firing rate intercept only exhibited a 1.4pps change and the clinical significance of this
should be considered and whether this would offer a significantly different strategy. Whereas
the Vastus Lateralis exhibited no significant difference in the intercept point or the slope
gradient (Figure 7-13). These results offer the first evidence to suggest that a taping
intervention may significantly alter the recruitment strategy of the Vastus Medialis, but the
clinical significance needs to be considered.

138
Table 7-7 Recruitment threshold results from the symptomatic subjects showing the
Vastus Medialis and Vastus Lateralis in the tape and no tape condition
Recruitment
Threshold
Non-symptomatic
Subjects
Vastus Medialis Vastus Lateralis
No Tape Tape p-Value No Tape Tape p-Value
Intercept (pps) 21.5 22.9 <0.0001 20.9 20.0 0.18
Slope (Gradient) -0.13 -0.15 0.05 -0.11 -0.10 0.07
Figure 7-12 Regression plot of the Vastus Medialis from the non-symptomatic subjects,
showing the recruitment threshold differences between no tape (blue) and tape (red)

139
7.6.2 Individual Analyses
The results (see appendix 12.1.6) show that subjects responded to the tape condition with
different strategies. For example subject 5 exhibited significant responses to tape in the Vastus
Medialis, where the intercept was significantly higher (p<0.0001) by 4.9pps and the slope
gradient significantly steeper (p=0.002) in the tape condition (Figure 7-14). Subject 5 also
exhibited significant responses to the Vastus Lateralis (Figure 7-15 ) with a significantly
reduced intercept (p<0.0001) by 1.6pps and significantly flatter slope gradient (p<0.0001).
Subject 10 however showed a significantly flatter gradient slope (p=0.01) in the Vastus
Medialis tape condition but the intercept point did not present any significant changes (p=068).
Figure 7-13 Regression plot of the Vastus Lateralis from the non-symptomatic subjects,
showing the recruitment threshold differences between no tape (blue) and tape (red)

140
However, this subject seemed to utilise a different recruitment strategy by recruiting motor
units at an earlier level of excitation/force (Figure 7-16). Other subjects can be seen to make
no significant changes in either the recruitment intercept or slope in either muscles. These
results present the opportunity for subjects to utilise different recruitment strategies, offering
the first insight into how muscles can alter the recruitment in response to a taping intervention.
Figure 7-14 An example of the Vastus Medialis in an individual non-symptomatic subject, showing
the recruitment threshold differences between no tape (blue) and tape (red)
Figure 7-15 An example of the Vastus Lateralis in an individual non-symptomatic subject,
showing the recruitment threshold differences between no tape (blue) and tape (red)

141
Figure 7-16 An example of the Vastus Medialis in an individual non-symptomatic subject,
showing the recruitment threshold differences between no tape (blue) and tape (red)

142
7.7 Recruitment Operating Point
The recruitment operating point is defined as the force/knee moment point when the first motor
unit in the contraction is recruited. The recruitment operating point for each contraction was
extracted from the recruitment threshold calculation and were averaged, providing an average
excitation point for the tape and no condition for the Vastus Medialis and Vastus Lateralis.
7.7.1 Grouped Analyses
A paired samples t-test was performed on the average excitation point for the Vastus Medialis
and Vastus Lateralis in the tape and no condition. No significant differences were found
between the tape and no condition for each of the Vasti muscles (Table 7-8). Although no
significant differences were found there seems to be a trend to require additional force to recruit
the motor units in both the Vastus Medialis and Vastus Lateralis in the tape condition.
Table 7-8 Descriptive statistics for the grouped recruitment operating point from the
non-symptomatic subjects.
Recruitment Operating Point
(% Knee Moment)
Symptomatic Subjects
No Tape Tape
Mean
(SD)
Mean
(SD)
Vastus Medialis 8.9
(5.3)
10.2
(4.4)
Vastus Lateralis 7.5
(4.3)
8.1
(2.7)
7.7.2 Individual Analyses
The recruitment operating point results from each of the non-symptomatic subjects (appendix
12.1.7) show, as with the recruitment threshold results, that there is a non-uniform response to
the tape intervention. Subjects seem to be presenting with differing responses to the tape
condition, where some subjects present with a strategy to recruit the motor unit pool requiring
less force/excitation (subject 9 for example, Figure 7-18). Conversely, some subjects can be
seen to present with a strategy to require additional force/excitation to recruit the motor unit
pool (Subject 5 for example, Figure 7-17). These findings, for the first time, show that the
motor unit pool recruitment can be modified in relation to the respective joint moment,
providing key information on recruitment strategies and consequent motor unit control in
response to a therapeutic intervention.

143
Figure 7-17 An example of a non-symptomatic subject Vastus Medialis requiring additional
force/excitation in the tape condition (red) compared to the no tape condition (blue)
Subject 5 Vastus Medialis Recruitment Operating Point
Figure 7-18 An example of a non-symptomatic subject Vastus Medialis requiring less
force/excitation in the tape condition (red) compared to the no tape condition (blue)
Subject 9 Vastus Medialis Recruitment Operating Point

144
7.8 Traffic Light Results – Non-Symptomatic Subjects
Results from the non-symptomatic subjects clearly demonstrated that subjects exhibited
different responses to the taping condition, which were variable across the different
biomechanical and neuromuscular measures investigated. In order to explore relationships
between the measured variables and their responses to the tape condition a results ‘traffic light’
table was created. The ‘traffic light’ results demonstrate increases (green), decreases (red) and
no changes (amber) for the measured variables for individual non-symptomatic subjects
(Figure 7-19). Each variable presents a value which represents the percentage change in the
tape condition, apart from the recruitment threshold variable that presents whether a significant
result in the regression slope was found. The threshold values used to represent an increase or
decrease in each variable vary between the different variables. To the authors knowledge there
are no publications using this method to explore individual relationships and strategies as most
data is analysed in groups, therefore selection of the threshold values could not be guided by
previous publication. As the single limb isometric squat task by definition would not reflect
any gross movements the expected changes would be discrete in nature and the threshold
percentages modestly reflected this with both 5%, 10% and 20% changes in the variables. Each
variables threshold percentage is presented with the traffic light results table in Figure 7-19.

145
Figure 7-19 'Traffic Light' results for non-symptomatic subjects
* Significant results from grouped analyses
** From recruitment threshold calculation
*
**
*
**

146
7.9 Results Summary – Non-Symptomatic Subjects
7.9.1 Knee Joint Biomechanics Summary
- Grouped analyses of the transverse plane range of moment exhibited a significant
decrease in response to the taping condition. No significant changes were found in
the transverse plane range of motion.
- Grouped analyses of the coronal plane range of moment and angle did not present
any significant responses to the tape.
- The coronal plane mean knee moment and mean knee angle did demonstrate
significant changes, but with marginal mean differences and large standard
deviations the results should be contextualised with clinical meaning in mind, where
0.45 degrees is unlikely to provide any impact, especially with the observed non-
uniformity in the response when looking at individual subjects.
- Individual analyses of subjects provided evidence of a non-uniform response with
mean differences exhibiting changes within coronal and transverse range of
moment and range of motion, some increasing and others decreasing.
7.9.2 Surface EMG Summary
- Grouped analyses did not present any significant changes in muscle activity in
Gastrocnemius, Bicep Femoris, Rectus Femoris or Gluteus Medius.
- The grouped analysis did highlight that there may be large variability in muscle
activity and its response to tape with the large standard deviations reported.
- Individual analyses of each subject provided further evidence of inter-subject
variability with mean differences exhibiting changes within all muscles in differing
directions and magnitudes.

147
7.9.3 Mean Firing Rate Summary
- Grouped analysis of the non-symptomatic subjects showed marginal responses to
the tape with a 4.5% increase in the Vastus Medialis and a 3.3% decrease in MFR
to the Vastus Lateralis. The parametric analyses did not exhibit any statistical
significant differences.
- Individual analyses showed large inter-subject variability with the responses or lack
of to the taping condition. Some individuals Vastus Medialis increasing MFR
whilst others lacked any response to tape.
- If results are analysed within a group then subtle strategies and responses may not
be exposed as the data is pooled together masking individuals unique responses,
when viewing as individual responses it is apparent that large modifications can be
seen in response to tape either increasing or decreasing their MFR
7.9.4 Common Drive Summary
- Grouped analysis of the non-symptomatic subjects showed that the common drive
to the Vastus Medialis exhibited a marginal 2.4% reduction with the Vastus
Lateralis not exhibiting any response to the taping condition.
- Analyses of individual subjects showed that there are differing responses and
strategies of motor unit control through the common drive of the Vasti muscles,
which are seemingly masked during grouped analyses.
- Grouping the cross-correlation results may mask the unique common drive
strategies individuals present in response to the tape condition.
7.9.5 Recruitment Summary
- Grouped analyses exhibited significant changes in the recruitment gradient and
intercept point for the VM muscle, thus suggesting that tape may alter the
recruitment strategy of motor unit pool. However, the mean differences of 1.4pps
questions the clinical significance of such a change.

148
- As with other results the individual analyses demonstrated that there seems to be
different strategies and responses to the tape intervention, where subjects
demonstrated surprisingly difference strategies. This then questions the grouped
data significant results.
- Another key finding is that subjects present with a never seen before strategy where
with the application of tape either additional or less excitation/force is required in
order to recruit the motor unit pool.
- The motor unit recruitment results suggest that the recruitment strategy can be
altered with the application of tape in non-symptomatic subjects, and altered using
different strategies, which have not previously been shown.
7.9.6 Implications for Symptomatic Study
The results from the non-symptomatic study show that there are key changes to the joint
kinetics and kinematics in response to the taping condition, that has previously been shown
(Selfe et al. 2008; Selfe et al. 2011), but also that they can offer different responses amongst
subjects, which has not previously been considered. It was also clear that there are significant
and new changes to the motor unit pool and its control, with the application of the tape,
suggesting altered force production and control of the Vasti muscles. These findings offer
tantalizing potential in understanding how a patient population may present with their motor
unit control and joint control strategies. Perhaps more interestingly it may offer insight into
how the relationship between these variables and their response to a previously misunderstood
clinical intervention.

149
8. Method - Symptomatic Subjects
8.1 Introduction
This chapter provides the pertinent information relating to the symptomatic subjects data
collection methods and procedures.
8.2 Symptomatic Subjects
Subjects were recruited from a population of staff and students at the University of Central
Lancashire (UCLan) and patients attending the Lancashire Teaching Hospitals NHS
Foundation Trust. Subjects were provided with a ‘Patient Information Sheet’ prior to attending
any testing session, the patient information sheet provided study information and what was
expected of them (see appendix 12.2). ). Based on previous study by Selfe et al. (2008) who
investigating the effect of proprioceptive bracing on biomechanical parameters, mean
differences were greater than the standard deviations. The knee transverse plane range of
moment yielded a mean difference 0.035 Nm/kg with a standard deviation of 0.03 Nm/kg
during a step-down task. A statistical power calculation yields that with an 80% statistical
power and a significance level of 5% the sample size needs 12 subjects to detect any significant
changes in the biomechanical parameters to be investigated. Patellofemoral Pain subjects
(n=15) were enrolled onto the study, with two subjects omitted from the results due to poor
data quality (see appendix 12.1.1 for details), leaving thirteen patellofemoral pain subjects for
data processing (5 females and 8 males, age 25.2 years (SD 4 years), mean weight 71.4 kg (SD
12.9 kg)).
8.3 Ethical Approval
The study was approved by the Built Sport Health (BuSH) ethics committee, University of
Central Lancashire (Proposal no. 149) for data collection on symptomatic staff and students at
the university (see appendix 12.5.2). The study was also approved by National Research Ethics
Service (NRES) committee North West (REC reference: 13/NW/0405) for data collection on
patients attending Lancashire Teaching Hospitals NHS Foundation Trust, for which NHS
Research and Development permission was granted (PIC reference: 017). Prior to data
collection written informed consent (see appendix 12.3) was gained from all subjects.

150
8.4 Recruitment Criteria
The complex and multifactorial aetiology of Patellofemoral Pain makes examination and
diagnosis difficult, which consequently creates challenges to the researcher in including a ‘true
PFP’ homogenous group to study. However, research has shown that using multiple clinical
and functional tests can assist in diagnosing PFP (Haim et al. 2006; Nijs et al. 2006; Cook et
al. 2010). The study used a strict and peer-reviewed inclusion and exclusion criteria that was
enforced by the researcher, whom is a trained clinician, to ensure a homogenous group were
enrolled onto the study.
8.4.1 Inclusion Criteria
The inclusion criteria of symptomatic subjects being eligible to participate in the study is based
upon Cowan et al. (2002), Syme et al. (2009), Cook et al. (2010), for which can be seen listed
below:
- Males and Females to be included
- Age Range 18-40 years old
- Anterior or Retropatellar pain reported on at least 2 of the following activities:
Prolonged sitting, ascending or descending stairs, squatting, kneeling, running and
hopping/jumping
- In addition to the above, at least 2 of the following clinical examination findings: Pain
during resisted quadriceps contraction (static and/or dynamic), Pain during palpation of
medial and/or lateral facets of patella, Pain during squatting, Pain during step ascent
and/or descent.
- Unilateral or Bilateral Patellofemoral Pain longer than 3 months
- Able to hold a static squat position for at least 8 seconds
8.4.2 Exclusion Criteria
The exclusion criteria of symptomatic subjects being unable to participate in the study is based
upon Cowan et al. (2002), Syme et al. (2009), Cook et al. (2010), for which can be seen below:
- Recent knee surgery or trauma (within 3 months)
- Ligamentous instability and/or internal derangement (Subjects should be referred for
arthroscopy or Magnetic Resonance Imaging (Acton & Craig 2000)
- History of patella subluxation or dislocation

151
- Confirmed osteoarthritis of tibiofemoral and/or patellofemoral joints
- Joint effusion when the mid-patellar girth is 5% or more than the non-involved knee
- True knee joint locking and/or giving way
- Co-existent acute illness or chronic disease
- Bursitis, patella or iliotibial tract tendinopathy, Osgood Schlatter’s disease, Sinding-
Larsen Johansson Syndrome, muscle tears or symptomatic knee plicae
- Pregnant or breast feeding
8.5 Data Collection
Testing of the symptomatic subjects mimicked the testing of the non-symptomatic subjects and
used the same data collection procedures (see section 6.5). The symptomatic subject testing
also included additional recordings to understand the clinical presentation, namely the use of
the Movement Specific Reinvestment Scale (MSRS) and the Numerical Rating Scale (NRS)
(see appendix 12.4). The MSRS and NRS were completed by subjects prior to any other data
collection measurements to ensure their responses were not affected by the testing protocols.

152
9. Results – Symptomatic Subjects
9.1 Overview
As with the investigations of the non-symptomatic subjects a host of differing
neurophysiological and biomechanical variables were investigated with the symptomatic
subjects, with the addition of clinical measures. Figure 9-1 shows a graphical representation
of these measures. Details of each parameter and their respective findings can be seen in the
following chapter for both grouped and individual analyses.
Figure 9-1 Graphical representation of the variables investigated in PFP group
9.2 Knee Joint Biomechanics
In order to investigate the mechanical control of the knee joint kinematic and kinetic data were
calculated and extracted for the three planes of movement. For the sagittal plane the mean
moment (Nm/kg) and mean angle (degrees) from the constant force region were extracted to
provide information on the position of the squat position between the two conditions.
Investigations into the coronal and transverse planes of mechanics explored the range of
moment (Nm/kg) and range of motion (degrees) from within the constant force region.
Movement Strategy
Motor Unit Firing Rate
Common Drive
Motor Unit Recruitment
Surface EMG
Knee Joint Moment
Knee Joint Angle
Numerical Rating Scale
Movement Specific
Reinvestment

153
9.2.1 Grouped Analyses
9.2.1.1 Sagittal Plane
A paired samples t-test was performed on the sagittal plane mean knee joint moment and the
sagittal plane mean knee joint angle. The results showed no significant differences between
the two conditions for the mean moment (p= 0.40) but interestingly the mean angle exhibited
a significant change (p=0.01). Descriptive statistics of the mean moment and angle can be seen
in Table 9-1. As the mean knee moment did not exhibit any change in response to the tape it
infers that any change or differences seen in other variables is not due to different load through
the knee.
Table 9-1 Sagittal plane knee joint moment and angle descriptive statistics
Sagittal Plane
Symptomatic
Subjects
No Tape Tape
Mean
Difference
Confidence
Interval of the
difference (95%)
p-Value
Mean (SD) Mean (SD)
Mean Moment
(Nm/kg)
1.18
(0.21)
1.15
(0.23) 0.027 -0.04 to 0.09 0.40
Mean Angle
(Degrees)
57.11
(8.66)
53.12
(8.12) 3.98 1.34 to 6.63 0.01
9.2.1.2 Coronal Plane
A paired samples t-test was conducted on the coronal plane range of moment and range of
motion. Results did not indicate any significant differences between the two conditions for
range of moment, mean moment, range of motion or the mean angle. Table 9-2 presents the
descriptive statistics for the range of moment and range of motion for the coronal plane knee
joint mechanics.

154
Table 9-2 Coronal plane knee joint moment and angle descriptive statistics
Coronal Plane
Symptomatic
Subjects
No Tape Tape
Mean
Difference
Confidence
Interval of the
difference (95%)
p-Value
Mean
(SD)
Mean
(SD)
Mean Moment
(Nm/kg)
-3.68
(13.11)
-4.07
(12.49) 0.39 -1.82 to 2.59 0.71
Range of Moment
(Nm/kg)
0.12
(0.06)
0.11
(0.06) -0.004 -0.02 to 0.01 0.59
Mean Angle
(Degrees)
0.96
(4.86)
1.04
(4.77) 0.08 -0.82 to 0.66 0.82
Range of Angle
(Degrees)
2.37
(0.93)
2.20
(0.78) -0.167 -0.42 to 0.09 0.17
9.2.1.3 Transverse Plane
Paired samples t-test conducted on the transverse plane range of moment and range of motion
showed that there was a significant decrease (p=0.03) with the application of the tape.
However, the mean moment, mean angle and range of motion for the transverse plane did not
show any significance. Descriptive statistics of the transverse plane range of moment and
range of motion can be seen in Table 9-3.

155
Table 9-3 Transverse plane knee joint moment and angle descriptive statistics
Transverse Plane
Symptomatic
Subjects
No Tape Tape
Mean
Difference
Confidence
Interval of the
difference (95%)
p-Value
Mean
(SD)
Mean
(SD)
Mean Moment
(Nm/kg)
0.77
(2.29)
0.54
(2.47) 0.23 -0.05 to 0.52 0.10
Range of Moment
(Nm/kg)
0.07
(0.03)
0.06
(0.02) -0.01 -0.02 to -0.001 0.03
Mean Angle
(Degrees)
2.00
(6.99)
2.17
(6.53) 0.17 -1.23 to 0.89 0.73
Range of Angle
(Degrees)
2.49
(0.78)
2.57
(1.04) 0.06 -0.39 to 0.54 0.72
9.2.2 Individual Analyses
The range of moment and range of motion with their respective standard deviations were
reported (see appendix 12.1.2) for each subject in the tape and no tape conditions. The results
demonstrated great inter-subject variability in the response to the tape condition, for example
subject 4 exhibited a 64.1% increase in range of moment in the coronal plane in the tape
condition (Figure 9-2). However, subject 11 conversely showed a 69.5% decrease in the
coronal range of moment (Figure 9-3). The variability was also shown in the transverse planes
range of moment.

156
Time (seconds)
Nm
/kg
Figure 9-2 Example of a subject increasing the range of moment in the coronal plane with
the application of tape (red) compared to no tape (blue)
Time (seconds)
Nm
/kg
Figure 9-3 Example of a subject decreasing the range of moment in the coronal
plane with the application of tape (red) compared to no tape (blue)

157
Similar variability was also evident in the angular data with the range of motion demonstrating
increase and decreases in response to tape, for example subject 6 showed a decrease of 37.4%
in coronal plane range of motion (Figure 9-4), whereas subject 4 showed an increase of 61.7%
in the coronal plane range of motion (Figure 9-5).
Time (seconds)
Deg
rees
Figure 9-4 Example of a subject decreasing the range of motion in the coronal plane
with the application of tape (red) compared to no tape (blue)
Time (seconds)
Deg
rees
Figure 9-5 Example of a subject increasing the range of motion in the coronal plane
with the application of tape (red) compared to no tape (blue)

158
9.3 Surface EMG
The normalised Root Mean Square (RMS) EMG data from the constant force region were
extracted from EMGworks Analysis to quantify the muscle activity from the Gastrocnemius,
Bicep Femoris, Rectus Femoris and Gluteus Medius.
9.3.1 Grouped Analyses
A paired samples t-test conducted on the EMG data showed that the Biceps Femoris was the
only muscle which presented significantly (p=0.03) altered muscle activity following the taping
intervention with a 2.2% reduction. The Gastrocnemius, Rectus Femoris and Gluteus Medius
exhibited a non-significant response to the tape. Table 9-4 presents the mean EMG activity,
standard deviation and p-value for the four muscles in the tape and no tape condition.
Table 9-4 sEMG results from grouped analysis of the symptomatic subjects showing the
mean EMG activity, standard deviation, mean difference, 95% confidence intervals and
p-values.
Mean Surface EMG
Activity (% MVC)
Symptomatic
Subjects
No Tape
Tape
Mean
Difference
Confidence
Interval of the
difference (95%)
p-Value
Mean
(SD)
Mean
(SD)
Gastrocnemius 11.2
(5.7)
11.5
(5.9) -0.33 -1.44 to 0.78 0.53
Bicep Femoris 17.7
(6.3)
15.5
(7.2) 2.19 0.24 to 4.15 0.03
Rectus Femoris 18.1
(6.5)
17.7
(4.7) 0.43 -2.13 to 2.99 0.72
Gluteus Medius 17.7
(3.9)
16.5
(4.2) 1.12 -0.42 to 2.66 0.14

159
9.3.2 Individual Analyses
The mean difference between the two conditions were calculated for each subject for all four
muscles to investigate individuals’ response to the tape condition. The results (see appendix
12.1.3) present that only marginal responses were found in the Gastrocnemius, Biceps Femoris,
Rectus Femoris and Gluteus Medius muscle activity in response to the tape condition. The
results show differing responses, in magnitude and direction, to the taping intervention with
the symptomatic subjects. For example PFP subject 12 showed an increase of 8.3% in their
Rectus Femoris, whereas subject 4 decreased by 7.7%.

160
9.4 Mean Firing Rate
The average MFR was entered into SPSS for descriptive analysis, extracting the mean, standard
deviation and range for the tape and no tape condition in both Vasti. As the data was normally
distributed the mean, standard deviation and ranges were reported. It was deemed
inappropriate for the mean firing rate to be subjected to statistical analyses beyond descriptive
analysis because the mean firing rate is a detailed and sensitive measure and computing
statistical analyses may mask the subtle and intricate information it provides.
9.4.1 Grouped Analyses
Grouped analysis of the symptomatic subjects showed similar results to the non-symptomatic
subjects with marginal responses to the taping condition, as shown in Table 9-5. The Vastus
Medialis showed an increase in the firing rate from 17.5 pps to 18.2 pps represented as a 4%
change in response to tape. Although interestingly the maximum firing rate showed a 1.1 pps
decrease whilst the average MFR increased. The Vastus Lateralis showed a reduction in firing
rate of 0.6 pps, represented by a 3.2% decrease in response to tape.
Table 9-5 Grouped analysis of all symptomatic subjects average MFR, standard
deviations and MFR minimum and maximum values
Mean Firing Rate
Symptomatic
Subjects
Average
MFR (pps)
(SD)
Mean
Difference
Confidence
Interval of the
difference (95%)
Range MFR
p-Value
Vastus Medialis
No Tape
17.5
(4.7)
0.72 -2.85 to 1.40
6.5 - 33.8
0.47
Vastus Medialis
Tape
18.2
(4.9) 6.5 – 32.7
Vastus Lateralis
No Tape
18.9
(4.9)
0.51 -0.53 to 1.55
6.9 – 31.2
0.30
Vastus Lateralis
Tape
18.3
(5.2) 7.3 – 32.7

161
9.4.2 Individual Analyses
The symptomatic subjects’ data were analysed individually following the results of the grouped
analysis. The average MFR and standard deviation values were extracted from SPSS (see
appendix 12.1.4) for the tape and no tape conditions for the Vastus Medialis and Vastus
Lateralis. Symptomatic subjects showed a non-uniform response to the taping condition with
large increases or decreases in the motor unit firing rate for the Vastus Medialis and/or Vastus
Lateralis. For example PFP subject 6 exhibited an increase of 8.9 pps in the Vastus Medialis
in response to take which is equivalent to a 72.3% change (Figure 9-6), however the Vastus
Lateralis showed a marginal decrease of 0.4 pps. Although some subjects were showing
exponential responses to the taping condition in altering their MFR others seemingly did not
respond to the taping condition at all or at least marginally such as PFP subject 5 with only a
0.5 pps change in firing rate of either Vastus Medialis or Vastus Lateralis (Figure 9-7).

162
Mea
n F
irin
g R
ate
(Puls
es P
er S
eco
nd)
Figure 9-6 An example of a subject whom increases the Vastus Medialis firing rate in the tape condition
(red) compared to the no tape (blue)
Mea
n F
irin
g R
ate
(Puls
es P
er S
eco
nd)
Figure 9-7 An example of a subject whom shows no change in the Vastus Lateralis firing rate in the tape
condition (red) compared to the no tape (blue)

163
9.5 Common Drive
The Vastus Medialis and Vastus Lateralis peak cross-correlation values were extracted from
EMGworks Analysis and entered into SPSS for each subject.
9.5.1 Grouped Analyses
Frequency statistics were used to calculate the median, inter-quartile range (IQRs), and the
skewness of the data for the tape and no tape condition for the VM and VL. Table 9-6 shows
the median and IQR (25th and 75th percentiles) values for each of the two conditions in the two
muscles. The median cross-correlation results for the grouped PFP analysis show that the
common drive increases (0.02) to the Vastus Medialis in the tape condition. Whilst the Vastus
Medialis exhibits an increase in common drive the Vastus Lateralis cross-correlation results
show a reduction (0.04) in common drive in the tape condition. These common drive changes
can also be represented by a percentage change between the two conditions and are represented
by a 5.1% increase and 9.1% decrease for the Vastus Medialis and Vastus Lateralis
respectively.
Table 9-6 Grouped common drive results from the symptomatic subjects showing the
median and inter-quartile range (25th and 75th percentile)
Common Drive
Vastus Medialis
(IQR)
Vastus Lateralis
(IQR)
No Tape Tape No Tape Tape
Symptomatic
Subjects
0.39
(0.25-0.54)
0.41
(0.26-0.55)
0.44
(0.28-0.58)
0.40
(0.25-0.56)
Figure 9-8 and Figure 9-9 present the normalised cross-correlation data for the Vastus Medialis
and Vastus Lateralis respectively, with each figure showing the two conditions. Figure 9-8
shows the grouped symptomatic subjects cross-correlation results from the Vastus Medialis
and presents the increase in common drive as shown in Table 9-6 with the peak cross-
correlation being shifted to the right in the tape condition. Figure 9-9 shows the grouped
symptomatic subjects cross-correlation results from the Vastus Lateralis and presents the
decrease in common drive as shown in Table 9-6 with the peak cross-correlation being shifted
to the left in the tape condition.

164
Figure 9-8 Cross-correlation data from grouped symptomatic subjects in the Vastus Medialis in the two
different conditions.
Figure 9-9 Cross-correlation data from grouped symptomatic subjects in the Vastus Lateralis in the two
different conditions.

165
9.5.2 Individual Analyses
As with the individual analysis of the non-symptomatic subjects, the median and IQRs were
extracted for each PFP subject to explore the inter-subject variability. Similar to the non-
symptomatic subjects’ results (see appendix 12.1.5) the symptomatic subjects have different
responses and strategies to the taping condition. For example, PFP 13 exhibited a 0.10 increase
in the cross-correlation function to the Vastus Medialis in the taping condition, representing a
31.3% increase in common drive (Figure 9-10). Conversely, PFP 8 exhibited a 0.04 decrease
in cross-correlation function in the Vastus Medialis, representing a 10.5% decrease in common
drive (Figure 9-11).
Figure 9-10 An example of a subject increasing the common drive to the Vastus
Medialis

166
9.6 Recruitment Threshold
To calculate the recruitment threshold, the excitation point of the muscle at which the motor
unit becomes active, the first firing of each motor unit was found and the corresponding MVC
percent of the peak knee moment was established. The MUAT calculation script within
EMGworks Analysis was used to calculate the recruitment threshold for each motor unit for all
subjects. The recruitment threshold of each motor unit and the motor unit mean firing rate
were extracted from EMGworks Analysis and a linear regression was performed within SPSS
with the recruitment threshold being the independent variable and mean firing rate as the
dependent variable. The linear regression will provide information on the recruitment strategy
of the muscle and its response to the taping intervention.
9.6.1 Grouped Analyses
The R Squared results show that although the relationship between the recruitment threshold
and the mean firing rate is still inversely related, although relatively weak with 0.11 and 0.10
for the Vastus Medialis and Vastus Lateralis respectively. The results for the slope and
intercept with their respective significance values, as seen in Table 9-7, show that no significant
differences can be identified in the grouped analysis.
Table 9-7 Recruitment threshold results from the symptomatic subjects showing the
intercept and slope values for the tape and no tape condition from the Vastus Medialis
and Vastus Lateralis.
Figure 9-11 An example of a subject decreasing the common drive to the Vastus
Medialis

167
9.6.2 Individual Analyses
The intercept and slope with their respective p-values were computed within SPSS through
linear regression for both Vasti muscles. The grouped analyses of the symptomatic subjects
did not show any significant differences in the regression lines for both muscles, however the
individual analyses (see appendix 12.1.6) show that some subjects were responding to the
taping condition with significant changes exhibited in both the slope and intercept. For
example PFP 6 significantly responded to the tape condition within both the Vastus Medialis
(p<0.001) (Figure 9-12) and Vastus Lateralis (p<0.05) in the slope and intercept. However,
PFP 2 did not exhibit any significant changes in either variable for either muscle (Figure 9-13).
Whereas some subjects exhibited significant changes within one of the two muscles, PFP 3 for
instance showed a change in the Vastus Lateralis. These results clearly demonstrate that
although the grouped analyses did not show any significant changes there are evidently subtle,
yet significant, changes amongst the individuals. This suggests for the first time that
symptomatic individuals are presenting with different recruitment strategies and consequently
may be able to modulate the force and control to the muscle with the application of tape.
Recruitment Threshold
Symptomatic Subjects
Vastus Medialis Vastus Lateralis
No Tape Tape p-Value No Tape Tape p-Value
Intercept (pps) 19.8 20.4 0.52 20.6 20.7 0.80
Slope (Gradient) -0.06 -0.06 0.25 -0.06 -0.05 0.23
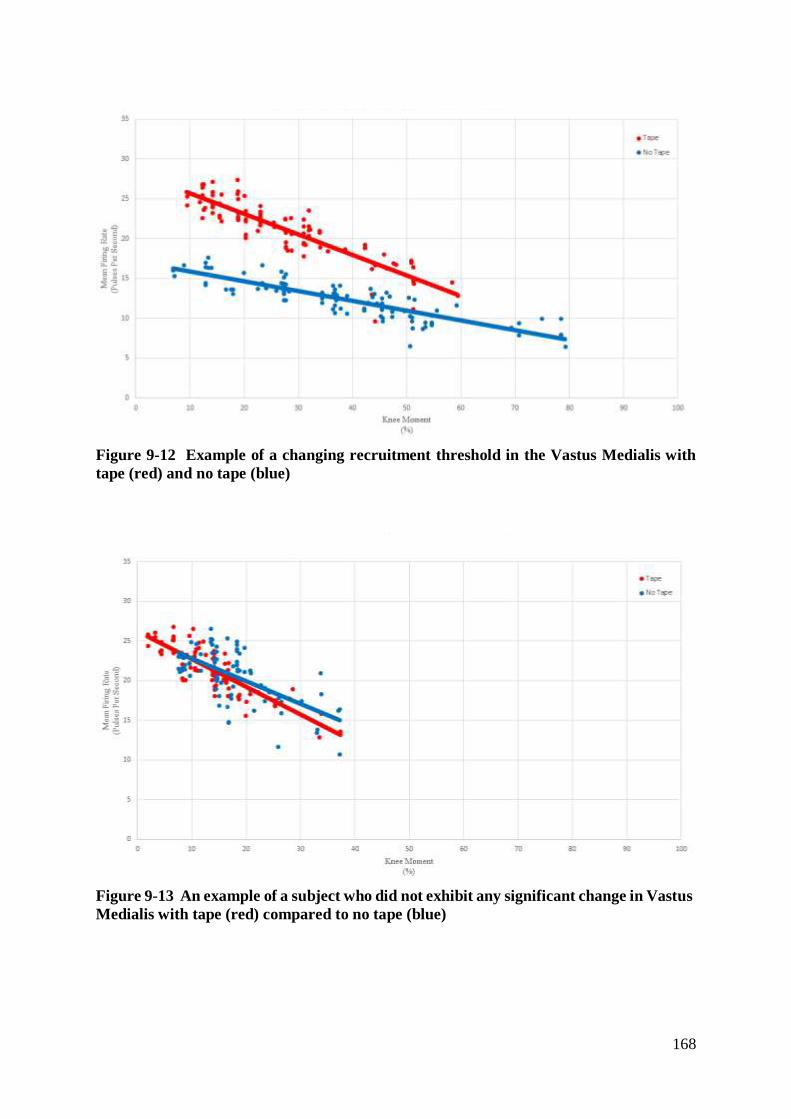
168
Figure 9-12 Example of a changing recruitment threshold in the Vastus Medialis with
tape (red) and no tape (blue)
Figure 9-13 An example of a subject who did not exhibit any significant change in Vastus
Medialis with tape (red) compared to no tape (blue)

169
9.7 Recruitment Operating Point
The recruitment operating point is defined as the force or excitation level when the first motor
unit in the contraction is recruited. The data was extracted from the previously stated
Recruitment Threshold calculation (see section 4.6). The recruitment operating point for each
contraction were calculated and the three contractions for each condition were averaged,
providing an average excitation point for the tape and no condition for the Vastus Medialis and
Vastus Lateralis. These results are the first of their kind to provide information on the motor
unit recruitment timing in relation to joint moment/force, also offering a unique insight into the
response to a therapeutic intervention.
9.7.1 Grouped Analyses
A paired samples t-test was performed on the average operating point for the Vastus Medialis
and Vastus Lateralis in the tape and no condition. No significant differences were found
between the tape and no condition for each of the Vasti muscles. The descriptive statistics for
the symptomatic subjects can be seen in Table 9-8 below.
Figure 9-14 Example of a subject who demonstrated significant changes in Vastus
Lateralis in response to tape (red) compared to no tape (blue)

170
Table 9-8 Descriptive statistics for the grouped recruitment operating point from the
symptomatic subjects.
Recruitment Operating Point
(% Knee Moment)
Symptomatic Subjects
No Tape Tape
Mean
(SD)
Mean
(SD)
Vastus Medialis 15.5
(19.9)
12.9
(14.5)
Vastus Lateralis 11.5
(13.8)
11.5
(10.8)
9.7.2 Individual Analyses
The recruitment operating point results from each of the symptomatic subjects (appendix
12.1.7) show, as with the recruitment threshold results, that there is a non-uniform response to
the tape intervention. Subjects seem to be presenting with differing responses to the tape
condition, where some subjects present with a strategy to recruit the motor unit pool requiring
less force/excitation (subject 1 for example, Figure 9-). Conversely some subjects can be seen
to present with a strategy to require additional force/excitation to recruit the motor unit pool
(Subject 12 for example, Figure 9-).

171
Figure 9-15 An example of a symptomatic subject Vastus Lateralis requiring less
force/excitation in the tape condition (red) compared to the no tape condition (blue)
Subject 12 Vastus Lateralis Recruitment Operating Point
Figure 9-14 An example of a symptomatic subject Vastus Medialis requiring less
force/excitation in the tape condition (red) compared to the no tape condition (blue)
Subject 1 Vastus Medialis Recruitment Operating Point

172
9.8 Movement Specific Reinvestment Scale
To understand the propensity for conscious involvement in movement the Movement Specific
Reinvestment Scale (MSRS) was used. The scale consists of two five-item subscales, one scale
measuring the conscious motor processing and the other subscale measuring the movement
self-consciousness. The Likert-type scale ranging from one (strongly disagree) to six (strongly
agree), with the total for each factor out of 30.
9.8.1 Grouped Analyses
Mean and standard deviations for the conscious motor processing and movement self-
consciousness were calculated and reported for 12 symptomatic subjects, one subject not
completing the questionnaire. The mean conscious motor processing score was 18.8 units or
expressed as 62.7% whilst the movement self-consciousness was 11.3 units or 37.7% in
patients with patellofemoral pain.
Table 9-9 Mean and standard deviation values for the conscious motor processing and
movement self-consciousness in the symptomatic subjects.
MSRS
Symptomatic
Subjects
Conscious Motor Processing Movement Self-Consciousness
Mean
(SD)
Mean
(SD)
18.8
(6.5)
11.3
(4.7)
9.8.2 Individual Analyses
Grouped data was further explored by extracting individual scores for symptomatic subjects
for both the conscious motor processing and movement self-consciousness (see appendix
12.1.8). The mean and standard deviation showed that 66.7% of subjects (8/12 subjects) were
above 19.5 units on the conscious motor processing scale, previously been seen as a clinically
significant finding in subjects with knee pain (Selfe et al. 2014). The movement self-
consciousness results showed large inter-subject variability ranging from 5 up to 20 units on
the subscale, with no relationship between the movement self-consciousness and conscious
motor processing evident.

173
9.9 Numerical Rating Scale
The Numerical Rating Scale (NRS) was used to measure the average pain intensity of the
symptomatic subjects during the past week. The pain rating from each PFP subject was
averaged and provided a mean pain rating of 4.2 (SD 1.9), with 0 being “no pain” and 10 being
“the worst possible pain imaginable”. Individual pain rating scores (Table 9-10) were extracted
in order to appreciate the inter-subject variability. Results showed a range of 1-7 on the NPRS
and thus demonstrated that the PFP cohort measured had variable levels of knee pain.
Table 9-10 Numerical Pain Rating Scale results from symptomatic subjects
NPRS
Symptomatic Subjects Pain Rating
Subject 1
Subject 2 7
Subject 3 5
Subject 4 2
Subject 5 3
Subject 6 3
Subject 7 1
Subject 8 7
Subject 9 4
Subject 10 6
Subject 11 6
Subject 12 3
Subject 13 3

174
9.10 Traffic Light Results – Symptomatic Subjects
To explore the relationships between the biomechanical, neuromuscular and clinical changes
in individual symptomatic subjects a ‘traffic light’ results table was created (Figure 9-14). As
with the non-symptomatic subjects (see section 7.8) the variables were highlighted as either
increasing (green), decreasing (red) or no change (amber). The threshold values to determine
the increase or decrease in response to tape using the same rationale as with the non-
symptomatic subjects. The addition of the Movement Specific Reinvestment Scale (MSRS)
and Numerical Rating Scale (NRS) provided two clinically orientated measures, which were
not taken with the non-symptomatic subjects. The NRS was a single measure of average pain
the subjects experienced and thus a percentage change could not be reported like the other
variables. The MSRS also did not present any data for change between the conditions, however
a study by Selfe et al. (2014) stated that a score of 19.5 on the Conscious Motor Processing
factor of MSRS represented individuals who had experienced knee pain (symptomatic)
compared to individuals whom did not have knee pain (non-symptomatic). Therefore a score
of 19.5 or greater was highlighted (green) in the ‘traffic light’ results table as a propensity to
consciously control movements. Presenting the results of neuromuscular, biomechanical and
clinical variables in this method is a new and novel feature aiming at appreciating and
understanding the subtle portfolio of strategies symptomatic subjects present with.

175
* *
Figure 9-14 'Traffic Light' results for symptomatic subjects
* Significant results from grouped analyses
** From recruitment threshold calculation
* *
*

176
9.11 Results Summary – Symptomatic Subjects
9.11.1 Knee Joint Biomechanics Summary
- Grouped analyses of the coronal plane range of moment and angle did not present
any significant responses to the tape.
- Grouped analyses of the transverse plane range of moment exhibited a significant
decrease in response to the taping condition. No significant changes were found in
the transverse plane range of motion.
- Individual analyses of subjects provided evidence of inter-subject variability with
mean differences exhibiting changes within coronal range of moment and range of
motion, some increasing and others decreasing
- Similar inter-subject variability was found in the transverse plane range of moment
and range of motion.
9.11.2 Surface EMG Summary
- Grouped analyses of the muscle activity from the Gastrocnemius, Biceps Femoris,
Rectus Femoris and Gluteus Medius showed that only the Biceps Femoris exhibited a
significant, but subtle, response to the taping intervention. The clinical significance of
such a response should be questioned as this unlikely to provide any real change to a
patient group.
- Analyses of each individual PFP subject exposed the makeup of the grouped data for
each of the muscles, showing little response to tape but with differing strategies by
marginally increasing or decreasing the different muscles.
- Minimal changes in the muscle activity shown in these muscles highlight that changes
seen in the Vasti muscles are not necessarily due to these muscles compensating.
9.11.3 Mean Firing Rate Summary
- Patellofemoral Pain grouped analyses exhibited a discrete increase in the firing rate
in the Vastus Medialis with a 4% change in response to tape. However, the Vastus

177
Lateralis showed a 3.2% decreased MFR in response to the tape. The parametric
testing did not demonstrate any statistical significance when pooling the data for
analyses, however this type of analysis may not demonstrate any individual
differences that could be present.
- Investigating each individual PFP subject showed differing responses and
strategies, where the Vastus Medialis increased by 72.4% in one subject it decreased
in others. Similar findings were also seen for the Vastus Lateralis.
- As with other results the individual analyses exposed the different motor unit firing
rate strategies and responses to tape, demonstrating that subjects have the ability to
make large modifications in their motor unit firing rate and consequently the force
contribution from that muscle.
9.11.4 Common Drive Summary
- Grouped analyses of the symptomatic subjects showed that there was an increase in
common drive to the Vastus Medialis by 5.1% and decreased in the Vastus Lateralis
by 9.1% in response to tape.
- Individual analyses showed that the symptomatic subjects presented with varying
responses to the taping condition, where some subjects exhibited significant
increases (31%) in common drive and others significant decreases (10%), whilst
others did not respond.
- Common drive results clearly demonstrate that not only the motor units within the
Vastus Medialis and Vastus Lateralis are firing in unison but also that the taping
intervention can alter the common drive.
9.11.5 Recruitment Summary
- Patellofemoral pain grouped analyses did not present any significant changes in the
regression lines between the tape and no tape condition.
- 11/13 symptomatic subjects exhibited significant changes to tape, although no
significant changes were identified within the grouped analyses.

178
- Individual analysis of the recruitment threshold results provide further rationale for
exploring individuals’ response to the taping intervention and their respective
strategies.
- These results show that patellofemoral pain subjects modify the recruitment
strategy of the motor unit pool in response to the taping intervention.
9.11.6 Movement Specific Reinvestment Scale Summary
- Grouped analyses showed there is a propensity for conscious involvement in
symptomatic subjects’ movements, but not for movement self-consciousness.
- Individual analyses also showed that there is a propensity for conscious
involvement in movement in most (66.7%) of the subjects with the remaining
exhibiting low scores.
- Exploration of individual symptomatic subjects’ results showed, as with other
results, variability amongst subjects showing different conscious involvement.
9.11.7 Numerical Rating Scale Summary
- The grouped analyses of the pain rating showed a mean score of 4.2/10, showing
that the pain levels during the week prior to testing were relatively low but yet still
experiencing obvious levels of discomfort
- Exploration of the individuals’ pain rating showed that there were variable levels of
pain being presented across the subject group, ranging from 7/10 to 1/10.
- Further investigation suggested there were no obvious relationships between the
subjective pain rating scale and the objective neuromuscular and biomechanical
measures.

179
9.11.8 Clinical Implications
The findings from the biomechanical investigations show that the symptomatic subject group
present with a statistically significant reduction in the transverse plane knee moment with the
application of a taping intervention. This suggests that taping could offer a clinical change to
the torsional mechanics of the knee joint, as seen in previous publication (Selfe et al. 2008),
perhaps offering an insight into the previously reported reduction in symptoms. These findings
are complimented by the modifications in the neuromuscular system through the motor unit
control, again suggesting that tape is altering the force and control contributions within and
across the Vasti muscles. As we are at the advent of furthering our understanding of the
complex and delicate neuromuscular system through measurement of large groups of
individual motor units, using surface EMG decomposition, the minimal clinical differences are
still debatable and relatively unknown. However, within this work a criteria for percentage
was devised in an attempt at justifying the changes we have observed (see sections 7.8 and
9.10) whereby depending on the variable a percentage level change was judged as being a
potentially clinically important change in the subjects control or behaviour.
This demonstrates a clinically important response to the taping intervention, which have
previously eluded researchers and clinicians alike. Although the subjective measures of
conscious motor processing and pain do not appear to present distinct strategies they do show
that they are important considerations in the management of patellofemoral pain and the
relationship to objective measures. The multi-disciplinary approach, aiming at understanding
the control of the knee joint, shows that real and clinically significant responses can be seen in
response to a common clinically applied taping intervention.

180
9.12 Comparison of Non-symptomatic and Symptomatic Subjects
The biomechanical and neuromuscular variables from the non-symptomatic and symptomatic
subjects were compared in order to understand whether symptomatic subjects exhibited
differing control mechanisms or strategies with no intervention being applied.
9.12.1 Knee Joint Biomechanics
An independent samples t-test of the sagittal plane knee joint mean moment and mean angle
can be seen in Table 9-11. The results show that there was a significant difference between the
two subject groups with the mean angle. However, there was no significant difference in the
mean moment between the groups. The latter result demonstrates that the same mechanical
load is experienced through the knee joint. The coronal and transverse plane knee joint range
of motion or range of moment did not show any differences between the non-symptomatic and
symptomatic subjects as can be seen in Table 9-12 and Table 9-13.
Table 9-11 Sagittal plane results from the mean moment and mean angle comparing the
non-symptomatic and symptomatic subjects
Sagittal Plane
Non-
Symptomatic
Subjects
Symptomatic
Subjects Mean
Difference
Confidence
Interval of the
difference (95%)
p-Value
Mean
(SD)
Mean
(SD)
Mean Moment
(Nm/kg)
1.04
(0.22)
1.18
(0.21) 0.14 -0.37 to 0.09 0.22
Mean Angle
(Degrees)
47.8
(5.9)
57.11
(8.66) 9.31 -18.73 to -2.99 0.01

181
Table 9-12 Coronal plane results from the range of moment and range of angle comparing
the non-symptomatic and symptomatic subjects
Coronal Plane
Non-
Symptomatic
Subjects
Symptomatic
Subjects Mean
Difference
Confidence
Interval of the
difference (95%)
p-Value
Mean
(SD)
Mean
(SD)
Range of Moment
(Nm/kg)
0.11
(0.04)
0.12
(0.06) 0.006 -0.05 to 0.06 0.8
Range of Angle
(Degrees)
1.99
(0.77)
2.37
(0.93) 0.38 -0.39 to 1.16 0.3
Table 9-13 Transverse plane results from the range of moment and range of angle
comparing the non-symptomatic and symptomatic subjects
Transverse Plane
Non-
Symptomatic
Subjects
Symptomatic
Subjects Mean
Difference
Confidence
Interval of the
difference (95%)
p-Value
Mean
(SD)
Mean
(SD)
Range of Moment
(Nm/kg)
0.07
(0.02)
0.07
(0.03) 0.001 -0.02 to 0.02 0.9
Range of Angle
(Degrees)
1.99
(0.48)
2.49
(0.78) 0.500 -0.10 to 1.10 0.1

182
9.12.2 Surface EMG
An independent samples t-test was conducted on the Gastrocnemius, Biceps Femoris, Rectus
Femoris, and Gluteus Medius sEMG results comparing the non-symptomatic and symptomatic
subjects. It was found that the sEMG amplitude for all four muscles were significantly (p<0.01)
lower in the symptomatic subjects compared to the non-symptomatic subjects. Table 9-14
below shows the significantly lower mean EMG amplitude for the Gastrocnemius, Biceps
Femoris, Rectus Femoris and Gluteus Medius in the symptomatic subjects. These results
suggest that symptomatic subjects may use a different strategy to manage the same level of
load being applied through the knee joint compared to the non-symptomatic subjects, perhaps
favouring the Vasti muscles.
Table 9-14 Surface EMG amplitude results for non-symptomatic and symptomatic
subjects
Mean Surface EMG
Activity (% MVC)
Non-
Symptomatic
Subjects
Symptomatic
Subjects Mean
Difference
Confidence
Interval of the
difference (95%)
p-Value
Mean
(SD)
Mean
(SD)
Gastrocnemius
29.3
(8.1)
12.5
(5.7) 16.8 11.2 to 22.5 <0.0001
Bicep Femoris
35.2
(11.4)
17.1
(6.2) 18.1 10.3 to 25.9 <0.0001
Rectus Femoris
36.7
(12.6)
18.4
(6.6) 15.1 8.7 to 27.9 0.002
Gluteus Medius
40.1
(13.5)
17.9
(3.9) 22.1 12.5 to 31.8 <0.0001

183
9.12.3 Mean Firing Rate
A comparison of the non-symptomatic and symptomatic subjects mean firing rate did not show
any differences between the groups for either the Vastus Medialis or Vastus Lateralis as can be
seen in Table 9-15 . In the no tape condition both groups exhibited similar MU firing rates,
17.7pps and 17.5 pps for the non-symptomatic and symptomatic groups respectively. The tape
condition response both showed a similar increase to 18.3pps and 18.8pps for the non-
symptomatic and symptomatic groups respectively.
Table 9-15 Inferential analyses of the motor unit firing rate comparing non-symptomatic
and symptomatic subjects
Mean Firing Rate
Average MFR
(pps)
(SD)
Mean
Difference
Confidence Interval of
the difference (95%) p-Value
Vastus Medialis
Non-Symptomatic
17.7
(3.2) 0.13 -2.03 to 2.29 0.89
Vastus Medialis
Symptomatic
17.5
(2.7)
Vastus Lateralis
Non-Symptomatic
18.3
(2.6) 0.52 -2.2 to 1.18 0.52
Vastus Lateralis
Symptomatic
18.8
(3.9)
9.12.4 Common Drive
A comparison of the median cross-correlation values from the non-symptomatic and
symptomatic subjects was conducted to explore whether the common drive differed between
the two subject groups assessing whether there were any changes to the control of the motor
unit pool. The results show that the Vastus Medialis in the symptomatic subjects had a lower
degree of cross-correlation compared to the non-symptomatic subjects demonstrating that the
symptomatic subjects exhibited less common drive to the Vastus Medialis. Conversely the
Vastus Lateralis showed a higher degree of cross-correlation in the symptomatic subjects
compared to the non-symptomatic subjects, thus demonstrating that symptomatic subjects have
higher common drive to the Vastus Lateralis. These results (Figure 9-15) are the first of their

184
kind in being able to demonstrate disproportional control in the motor unit pool between the
Vasti muscles in symptomatic subjects and potentially offers key insights into the presentation
of symptomatic subjects.
9.12.5 Recruitment Threshold
In order to explore the differences between non-symptomatic and symptomatic subjects a linear
regression of the motor unit recruitment threshold and the mean firing rate was performed,
comparing the regression lines between the two groups. The results (Table 9-16) show that the
symptomatic group recruitment intercept was significantly lower (p<0.0001) than the non-
symptomatic subjects indicating that the early recruited motor units for the Vastus Medialis
were being recruited at a lower firing rate in the symptomatic subjects. However, the
significantly flatter slope gradient (p<0.0001) for the Vastus Medialis in the symptomatic
subjects describes that the remainder of the motor unit pool were being recruited at a higher
firing rate compared to the non-symptomatic subjects. The results suggest that the Vastus
Medialis in the symptomatic subjects is exhibiting an altered recruitment strategy by driving
Figure 9-15 Common drive for non-symptomatic and symptomatic subjects for Vastus Medialis
(Red) and Vastus Lateralis (Blue)

185
the later recruited motor units to fire faster compared to the non-symptomatic subjects at the
same relative force levels (Figure 9-16). These findings show for the first time that the motor
unit pool of the Vastus Medialis in symptomatics subjects have a different recruitment strategy
compared to non-symptomatic subjects, suggesting an increased force contribution within the
muscle. The results from the Vastus Lateralis show that there is no change in the recruitment
intercept (p=0.27) between the non-symptomatics and symptomatics, however the slope
gradient shows that it is significantly flatter in the symptomatic subjects (p<0.0001). This
shows that the Vastus Lateralis, like the Vastus Medialis, is driving the later recruited motor
units to fire at a faster rate consequently suggesting that there is an increased level of force
generated within the muscle in symptomatic subjects compared to non-symptomatic subjects
(Figure 9-17).
Table 9-16 Recruitment threshold results comparing the regression lines between the
non-symptomatic and the symptomatic subjects with no intervention for the Vastus
Medialis and Vastus Lateralis.
Recruitment
Threshold
Vastus Medialis Vastus Lateralis
Non-Symp. Symp. p-Value Non-Symp. Symp. p-Value
Intercept (pps) 21.5 19.8 <0.0001 20.9 20.6 0.27
Slope (Gradient) -0.13 -0.06 <0.0001 -0.11 -0.06 <0.0001

186
Figure 9-16 Recruitment Threshold for Vastus Medialis for Non-Symptomatic subjects (Blue)
and Symptomatic subjects (Red) with no intervention
Figure 9-17 Recruitment Threshold for Vastus Lateralis for Non-Symptomatic subjects
(Blue) and Symptomatic subjects (Red) with no intervention

187
9.12.6 Clinical Implications
A challenge often faced is understanding whether there are any differences in the presentation
and behaviour between non-symptomatic and symptomatic subjects. Findings from the
comparisons made in this study between non-symptomatic and symptomatic subjects offer
several unique differences in the motor control strategy that have not before been seen. The
neuromuscular strategies exhibited by symptomatic subjects present for the first time
suggestively clinically important differences between the two subject groups and offer a
tantalising insight into the presentation of symptomatic subjects.
The significant lower muscle activity of the Gastrocnemius, Biceps Femoris, Rectus Femoris
and Gluteus Medius suggests that patients may be preferentially using other muscles, such as
the Vasti, to control and distribute the load in comparison to non-symptomatic subjects. This
has important clinical implications and perhaps indicating that clinicians should consider
directing their treatments at increasing the contribution of the surrounding musculature and/or
exploring the control strategies of the Vasti muscles. The findings from the common drive
between the non-symptomatic and symptomatic subjects suggest and provide evidence for the
Vasti muscles receiving a disproportion level of motor unit pool control. The Vastus Medialis
demonstrated receiving a lower level of common drive in the symptomatic subjects compared
to the non-symptomatics and a higher level of common drive to the Vastus Lateralis in
comparison. These findings show that there may be a clinical difference in the organisation of
the motor unit pool of the Vastus Medialis and Vastus Lateralis in symptomatic subjects where
clinicians should perhaps consider an intervention such as tape, which is shown to adjust the
common drive contribution to the Vasti (see section 9.5). Another key difference presented by
the symptomatic subjects is the strategy used to recruit the Vasti, the results showing that
symptomatic subjects later recruited motor units were firing at a higher rate and therefore
suggesting a modification in the force contribution of the muscles. Complimentary to the
significant differences seen in the reduced muscle activity from the Gastrocnemius, Biceps
Femoris, Rectus Femoris and Gluteus Medius both the Vastus Medialis and Vastus Lateralis
seem to be increasing the force contribution within the muscles, suggesting that the
symptomatic subjects are biasing the Vasti muscles to control the knee joint. The advent of
the novel methods of exploring the sensory-motor control, and specifically being the first work
to explore the clinical questions using these methods, means that the Minimal Clinical
Important Differences (MCID) are yet to fully explored. This work expressed the changes

188
observed with the percentage change in response to the intervention and chose an appropriate
percentage criteria to illustrate a suggesting clinically important change in the behaviour of the
subjects’ mechanical, neuromuscular and clinical measures. This coupled with the multi-
disciplinary approach the project took allows the exploration of the sensory-motor control and
behaviours from different perspectives in an attempt at isolating the important changes, which
can be clinically applicable.
These findings for the first time present empirical evidence demonstrating key and suggestively
clinically important differences between a non-symptomatic and symptomatic subject
consequently offering an insight into the direction and focus of clinical interventions.

189
10. Discussion
Motor activities in general comprise of unique and complex sensory-motor processes, which
when pain and disorder are introduced leads to further complications in understanding the
delicate mosaic of pathophysiological processes. Patellofemoral Pain (PFP) is not well
understood due to its inherent intricacies and unique presentation among PFP sufferers. In
reflection of the known complexities this thesis aimed to better understand PFP and the
responses to a common clinical intervention with an inter-disciplinary approach investigating
the biomechanical, psychosocial and neuromuscular elements.
10.1 Biomechanical
The biomechanical approach to Patellofemoral Pain can offer detailed insight into the efficacy
of clinical interventions by studying the 3-dimensional joint mechanics and their respective
responses. In order to achieve such insight this study aimed to determine the mechanical
control of the knee joint during a single limb isometric squat and its response to a taping
intervention, in both non-symptomatic and symptomatic subjects.
Studying the coronal and transverse planes of the knee is a feat that is not often undertaken,
especially within the Patellofemoral Pain research where the sagittal plane has for many years
been the main focus. The control of the knee has previously been considered as a simple flexion
and extension movement with researchers purporting a change in control through a knee
flexion-extension moment or angle (Nadeau et al. 1997; Powers et al. 1999; Salsich et al. 2001)
without consideration of the other degrees of freedom acting upon the knee. It was found that
there were no significant differences in the sagittal plane knee moment between the tape and
no tape conditions for both the non-symptomatic and symptomatic subjects. This shows that
the flexion moment and consequent load at the knee remained the same regardless of the
intervention or subject group, thus indicating that any changes seen in other biomechanical or
neuromuscular variables are not due to increased load being applied to the knee in the sagittal
plane. Several researchers have however highlighted the importance of studying the coronal
and transverse planes of motion when investigating the knee mechanics (Kowalk et al. 1996;
Selfe et al. 2008; Karamanidis & Arampatzis 2009; Paoloni et al. 2010; Selfe et al. 2011) where
it has been shown that they are key components in understanding the mechanisms involved in
the control of the knee joint. Previous work commonly reports maximum or peak values for
the kinetic and kinematic outcomes, however in studying the coronal and transverse plane the

190
maximum value may not provide an accurate representation or indication of control. It has
previously been shown (Selfe et al. 2008; Selfe et al. 2011) that studying the range of the kinetic
and kinematic variables during the task is a sensitive enough measure to demonstrate a
clinically important change. This study therefore measured the range of moment and range of
motion in the coronal and transverse plane knee joint biomechanics to determine the
mechanical control and response to a commonly applied clinical taping intervention.
The results of this study show that the application of the tape intervention significantly
decreased the range of moment in the transverse plane for both non-symptomatic and
symptomatic subjects during a single limb isometric squat. These findings suggest that the
tape intervention can offer increased torsional control in either non-symptomatic or
symptomatic subjects. This is in agreement with previous work (Selfe et al. 2008) where tape
was also seen to offer a significant decrease in torsional range of moment during step descent
for non-symptomatic subjects. The increase in torsional control found in this study are
complimentary to the findings from Selfe et al. (2008) where a neutral taping technique and
knee brace were used. However, unlike Selfe et al. (2008) this study did not observe any
significant changes in the coronal plane knee range of moment or range of motion for either
subject group. Although not significant both subject groups did exhibit a reduction in the
coronal plane knee moment in the taping condition, thus complimenting the reduction in
transverse plane range of moment. It is thought that these changes may have not exhibited
such clear and significant changes as seen in other similar work (Selfe et al. 2008; Selfe et al.
2011) because of the different task that was undertaken. The previous work has typically
investigated the knee joint mechanics under dynamic conditions such as walking, running, and
step descent where gross dynamic movements occur, with knee range of motion angles in the
transverse plane being reported at 8.6 degrees for the step-descent (Selfe et al. 2008). However,
this current work explored the knee joint mechanics under semi-static conditions where
minimal movement was expected and consequently only reported 2.1 degrees range of motion
during the single limb isometric squat in comparison to the step-descent in Selfe et al. (2008).
Therefore with this in consideration the significant mechanical changes observed in this study
with the tape intervention was rather surprising. As Selfe et al. (2008 & 2011) are the only
papers, to the authors knowledge, to measure the range of moment and range of motion in the
coronal and transverse planes as an indicator to knee joint control it is difficult to compare
results to other work. But importantly the findings do provide complimentary evidence to the

191
work from Selfe et al. (2008 & 2011) that the application of a taping intervention can provide
a clinically important response to the biomechanical control of the knee joint.
Considering the potentially different biomechanical mechanisms and presentations between the
two subject groups the data from the non-symptomatic and symptomatic subjects were
compared. Significant differences were observed between the two groups with the sagittal
plane mean knee angle, which could offer some explanation for differences observed between
the groups such as the surface EMG from surrounding muscles. However, there were no
significant differences seen in the sagittal plane mean knee moment between the groups and
thus offering evidence to demonstrate there was no load difference in the knee joint between
the groups. There were no significant differences in the range of moment or range of motion in
the coronal and transverse planes could be distinguished between the two subject groups. This
is not in agreement with Paoloni et al. (2010) who found that symptomatic subjects, 9 PFP
subjects, exhibited an increased knee abductor moment and external rotator moment compared
to non-symptomatic subjects. However, these changes were observed during gait where the
movements are gross and dynamic compared to the current study that investigated an isometric
squat, which by definition did not involve any grossly dynamic movements. The findings
suggest that the selected isometric task does not offer any significant or clinically important
biomechanical differences when comparing the two subject groups. This has an interesting
clinical implication as the mechanical stability/control of an individual is often used as part of
a clinical decision process, but these findings using detailed 3-dimensional joint kinematics
and kinetics were unable to distinguish any differences between a non-symptomatic and
symptomatic subject. Although no differences were found in the biomechanical variables
other motor control systems, such as the neuromuscular system may offer further insight into
the potential different presentation between the two subject groups.
This study further explored the biomechanical changes already seen in the grouped data by
investigating each individuals’ response to the taping intervention as it was thought that when
grouping the data any subtle or opposing individual responses could have been masked. It was
found that individuals from both subject groups had a non-uniform response to the taping
condition in the coronal and transverse planes. Surprisingly subjects were sometimes showing
complete opposite responses to the tape condition, for example one subject may present with a
decreased range of moment in the coronal plane by a large degree (0.07 Nm/kg) whereas
another subject may present with an increase in the range of moment in the tape condition by

192
a large degree (0.06 Nm/kg). The same disparity can be also be seen in the range of motion
for the coronal and transverse planes. To the authors knowledge no previous investigation into
the biomechanical control of the knee has considered the individuals behaviour or response to
a clinical intervention, instead have always presented grouped data. However, these results
suggest that both symptomatic and non-symptomatic subjects can present with varying and
opposing strategies in response to a tape condition. Similar considerations have been reported
in the spine and lower back pain (Mok et al. 2007) where patients presented with variable
mechanisms in an attempt to control spinal posture.
The study shows agreement with previous literature (Selfe et al. 2008) presenting a significant
reduction in the torsional range of moment within the tape condition, illustrating that clinically
important changes can be induced with the application of a taping intervention in both non-
symptomatic and symptomatic subjects and perhaps an indication to greater stability.
However, no biomechanical differences can be distinguished between the two groups in the
isometric squat position. Yet for the first time instead of viewing a subject group as being
homogeneous who adapt similarly the biomechanical analysis considered individual variation
and their response to a tape intervention. The disparity found with the knee joint biomechanics
may be interpreted as there is not a clear and obvious response to the tape intervention, however
instead it is being proposed that the results are offering a fascinating insight into potential knee
joint control strategies perhaps indicating there may be subgroups or phenotypes. Information
about the subjects conscious motor processing and neuromuscular responses, complimentary
to the knee joint biomechanics data, could offer additional insight and understanding of the
motor control system in both non-symptomatic and symptomatic subjects alike.

193
10.2 Psychosocial
Historically movement control and related disorders have been questioned through mechanical
and neuromuscular measurements with less consideration to the psychosocial features.
However, it has been shown that psychosocial elements, in-particular pain and fear of pain, can
have distinct influences on motor control (Lethem et al. 1983). The premise that pain and
movement are inter-related is a well-established phenomenon (Melzack & Wall 1965), which
has remained largely unquestioned. This postulate has been the foundation to various proposed
theories of the body’s response and adaptation to pain, explicitly the Vicious Cycle theory
(Roland 1986) and the Pain Adaptation theory (Lund et al. 1991). This study aimed to explore
the psychosocial elements of knee pain and movement control using validated and clinically
appropriate measures of pain rating (Pagé et al. 2012) and theory of reinvestment (Masters &
Maxwell 2008).
The Numerical Rating Scale (NRS) was used in order to gather an understanding of the
perceived severity of pain the symptomatic subjects experienced and also whether it would
provide any relationship with the objective measures. As a homogeneous group the
symptomatic subjects reported with a mean pain rating of 4.2 (1.9)/10, which presents a similar
pain rating shown to have altered Vasti motor unit recruitment (Tucker & Hodges 2010). These
findings show that subjects had experienced a moderate level of pain during the previous 7
days, including the day of testing, confirming the presence and severity of symptomatic knee
pain. Though by averaging across the group it assumes that the symptomatic subjects are all
presenting with similar pain and according to previous models, Vicious Cycle and Pain
Adaptation, the subjects would present with stereotypical responses. Hodges and Tucker
(2010) build upon previous models presenting a new theory of the adaptation to pain that
attempts to account for individual and non-uniform responses to pain and/or fear of pain.
Findings from this work are in-line with this theory that there may be individual presentations
and responses to pain, this is evident by the pain scores reported by symptomatic subjects
ranging from 1/10 up to 7/10. Complimentary to this is the individual biomechanical responses
found within the symptomatic subject group, yet interestingly there did not seem to be any
obvious relationship between the level or even presence of pain and the biomechanical
responses. An understanding on the conscious motor processing in addition to the pain rating
may offer further insight into the different presentations of the symptomatic group and their
individual responses.

194
The findings show that symptomatic subjects demonstrate a propensity to consciously control
their movements, consequently suggesting that Patellofemoral Pain subjects are concerned
with the execution and control of their movements. These findings are in agreement with Selfe
et al. (2014) whom found that subjects presenting with self-reported knee pain have a higher
propensity for conscious motor involvement than their pain-free counterparts. The mean score
of 18.8/30 on the Movement Specific Reinvestment Scale (MSRS) (Masters & Maxwell 2008)
is below the mean score of 19.5 from Selfe et al. (2014) for symptomatic subjects, however it
is confounded by a single subject which when removed would raise the mean score to 20.1 and
therefore in-line and in fact higher than the results from Selfe et al. (2014). The evident
tendency in this study for the symptomatic subjects to consciously monitor and control their
movements has been suggested to disrupt more effective automatic control processes (Masters
& Maxwell 2008), which has also been in seen in higher falls in the elderly (Wong et al. 2008)
and movement impairments in stroke subjects (Orrell et al. 2009). It has also previously been
described that individuals may display different psychological traits and responses to pain or
the fear of pain, with extreme examples described as being ‘confrontation’ and ‘avoidance’,
although is often a mixture of the two (Lethem et al. 1983). The findings from the MSRS show
that several subjects reported lower than average scores on the conscious motor processing
factor, which could indicate that these individuals are not as concerned with the control and
execution of their movements and could be leaning more towards to the ‘confrontation’ trait as
described by Lethem et al. (1983). Although perhaps not causative factors in developing or
worsening symptoms of Patellofemoral Pain the conscious motor processing and psychological
traits should be a point of consideration and reflection in clinical decision processes and form
part of the multi-disciplinary and holistic approach.
The psychosocial responses seem to be complimentary to the joint biomechanics findings in
that there may be individual and non-uniform responses, although not a complete description
it does add to the seductive muse that there may be variable and preferential strategies. A more
comprehensive insight could be deduced with the addition of an understanding of the role and
involvement of the neuromuscular system.

195
10.3 Neuromuscular
By far, the majority of the studies investigating PFP and its neuromuscular components have
done so by observing the gross changes of the surface EMG signal. The heterogeneous findings
and purported relationships between and within the Vastus Medialis and Vastus Lateralis have
long been studied in an attempt to understand the ‘control’ of the muscles and their respective
behaviour (Cowan et al. 2001; Herrington et al. 2005; Rainoldi et al. 2008; Cowan & Crossley
2009; Cavazzuti et al. 2010). However, the gross sEMG measurements typically taken may
not be able to offer the intricate details required to understand the control and behaviour of the
Vasti muscles, instead these have been sought after through investigations at the single motor
unit level (Mellor & Hodges 2005a; MacGregor et al. 2005). Recent developments have
allowed the exploration of a larger yield of motor unit and consequently greater representation
of the motor unit pool (Nawab et al. 2010). Investigating the voluntary behaviour of individual
motor units allow several key features to be explored, namely the firing rate, recruitment
strategy and neural drive.
10.3.1 Gross Muscle Activity
In general more than a single muscle is required to produce a joint moment and the joints
consequent movements. This is certainly the case when investigating a closed chain exercise
such as the investigated single limb isometric squat in this work where multiple joints and
consequently multiple muscles are involved. Therefore four muscles, in addition to the two
Vasti, were investigated providing gross muscle activity information on the role of the Medial
Gastrocnemius, Biceps Femoris, Rectus Femoris and Gluteus Medius. The muscle activity was
normalised to a reference contraction, the maximal observed signal, so that data are comparable
between subjects and trials, was used (as detailed in section 4.7.3).
10.3.1.1 Non-Symptomatic
It was found that there were no significant differences in the muscle activity within the tape
condition for the Gastrocnemius, Biceps Femoris, Rectus Femoris or Gluteus Medius. There
was a trend however to marginally reduce the activity in all muscles in the tape condition, apart
from the Gastrocnemius (Figure 10-1). The Gluteus Medius showed the largest response with
a 4.8% reduction in muscle activity in the tape condition. The reduction of the Gluteus Medius
muscle activity with the tape intervention, although not significant, is interesting as it’s in
opposition to the observed significant reduction in the knee joint torsional range of moment.

196
Previous work (Souza & Powers 2009) would suggest that a reduction of muscle activity at the
hip would cause an internal rotation of the femur, which may consequently cause an increased
torsional moment at the knee, yet this was not seen within these results. However, the clinical
importance of a 4.8% reduction in the Gluteus Medius should be considered as without
information on the other muscles surrounding the hip and also with the relatively high
contribution of Gluteus Medius EMG activity (approximately 40%) it is questionable whether
a <5% change would be of any clinical significance. Nevertheless, the reduction in muscle
activity with the application of tape shows that some load may have been re-distributed to other
structures or muscles in response to tape.
The individual variance should be noted though, as represented by the standard deviations
(section 7.3.1) and the error bars in Figure 10-1, it reveals that subjects may have different
contributions from the different muscle groups and demonstrate opposing strategies.
Exploration of the individuals muscle activity and their response to the tape condition showed
a level of disparity. For example Subject 6 presented with similar findings to the grouped
analysis, including a large reduction (23%) in Gluteus Medius activity (Figure 10-3). Whereas
other subjects presented with varying responses in both magnitude and direction and for
different muscles, subject 10 for example demonstrates a large increase (21%) in
Gastrocnemius activity and reductions in the other 3 muscles in response to tape (Figure 10-2).
Figure 10-1 The normalised mean EMG activity for the non-symptomatic subjects from the
Gastrocnemius, Biceps Femoris, Rectus Femoris and Gluteus Medius and their respective responses to tape
(red) compared to no tape (blue)

197
These findings demonstrate that the major muscle groups involved in the single limb isometric
squat respond to the taping intervention, which has not previously been investigated or
considered before even though many therapeutic treatments are directed at stretching,
strengthening or massage of these muscle groups. However, the response to tape seems to be
non-uniform with varied magnitudes and direction in the different muscle groups. These
findings begin to provide evidence that subjects may utilise different muscle strategies in
response to tape.
Figure 10-3 An example of a subject decreasing muscle activity with tape (red) compared
to no tape (blue)
Figure 10-2 An example of a subject with differing results from the group in response to
the tape (red) compared to the no tape (blue)

198
10.3.1.2 Symptomatic
It was found that when viewed as a homogenous group the symptomatic subjects significantly
(p=0.03) reduced the muscle activity of the Biceps Femoris by 2.2% in response to the tape
intervention. Whereas the Gastrocnemius showed a marginal increase and the Rectus Femoris
and Gluteus Medius demonstrated a marginal decrease in response to the tape intervention
(Figure 10-4). Although the Biceps Femoris was found to be significantly reduced with the
application of tape, the descriptive analyses showed the mean difference was a negligible 2.2%.
An important consideration here is whether the reduction in Biceps Femoris activity is
clinically significant and whether a 2.2% change in a single muscle truly reflects all the
symptomatics subjects’ responses to the tape condition.
Exploration of the mean differences in individual symptomatic subjects showed there was a
degree of variability in the response to the tape condition. However, interestingly the responses
did not show the same disparity as the non-symptomatic subjects with only 8/52 muscles
showing a <5% mean difference response to the tape condition (Figure 9-14). The marginal
response of the Gastrocnemius, Biceps Femoris, Rectus Femoris and Gluteus Medius is
somewhat surprising after the disparity found in the biomechanical coronal plane and
transverse plane knee moment and knee angles. As there is evidently little response in these
muscles with the application of tape, yet largely variable biomechanical responses, there may
be other neuromuscular responses and strategies present, such as the involvement and role of
the Vastus Medialis and Vastus Lateralis.
Figure 10-4 The normalised mean EMG activity for the symptomatic subjects from the Gastrocnemius,
Biceps Femoris, Rectus Femoris and Gluteus Medius and their respective responses to tape (red)
compared to no tape (blue)

199
10.3.1.3 Non-Symptomatic vs Symptomatic
It was found that when comparing the non-symptomatic and symptomatic subject groups the
muscle activity from the Gastrocnemius, Biceps Femoris, Rectus Femoris and Gluteus Medius
were all significantly less (p<0.05) in the symptomatic subjects. Figure 10-5 shows the EMG
differences between the subject groups where the clearly lower muscle activity can be seen.
To the authors knowledge no other work has considered the relative muscle activity between
symptomatic and non-symptomatic individuals, even though a plethora of work has focussed
on physical therapy treatments directed at these muscle groups (Crossley et al. 2002; Sacco et
al. 2006; Kaya et al. 2010) and the highlighted importance of the surrounding musculature
influencing the control of the knee joint (Andriacchi et al. 1984). With no significance found
in the sagittal plane knee moment between the non-symptomatic and symptomatic subjects it
suggests that the same load, flexion moment, was being applied to the knee. It is therefore
reasonable to infer from these findings that other structures may have a greater responsibility
in the movement strategy for symptomatic individuals. These findings show important clinical
implications by highlighting the fact that symptomatic subjects present with reduced muscle
activity in contributory muscles thought to be involved in the control of the knee. Therefore a
strategy may be presenting a disproportionate load to other structures involved in knee control,
which should be considered in a clinical decision process such as directing treatments in
increasing the contribution of surrounding muscles and/or altering the role of the Vasti.
Figure 10-5 Mean EMG from Gastrocnemius, Biceps Femoris, Rectus Femoris and Gluteus
Medius in the non-symptomatic (blue) and symptomatic (red) subjects.

200
10.3.2 Motor Unit Firing Rate
The firing rate, or discharge rate, of a motor unit is one of the determining factors in producing
force within the muscle (Burke 1981). It has previously been shown that the firing rate may
be a modifiable factor with taping intervention causing a differential increase in the Vastus
Medialis (MacGregor et al. 2005). However, this was severely limited by studying only a
small representation of the motor unit pool (5 motor units per subject), and at a low level of
force (4 N), with experimentally induced pain and using an invasive EMG procedure. Stock
et al. (2012) is the only study to use surface EMG Decomposition methods to simultaneously
measure the Vastus Medialis and Vastus Lateralis motor unit behaviour, in doing so was able
to analyse a greater representation of the motor pool and up to a maximum force level, but
investigated the effects on fatigue on motor unit behaviour in a closed kinetic chain condition.
Therefore no previous work has been able to determine the motor unit firing behaviour from a
representative motor unit pool in the Vasti, its response to a therapeutic intervention and its
relevance in a functional and clinical environment. This work aimed to provide insight by
investigating the mean firing rate of the Vastus Medialis and Vastus Lateralis using surface
EMG Decomposition methods in both non-symptomatic and symptomatic individuals
exploring the firing rate responses to a taping intervention.
10.3.2.1 Non-Symptomatic
The average MFR showed a marginal response in the non-symptomatic subjects when data
were grouped. The Vastus Medialis firing rate showing a 4.5% increase (0.8 pps), whilst the
Vastus Lateralis showing a 3.3% decrease (0.6 pps) in response to the taping intervention
across all non-symptomatic subjects. Although the relative changes were discrete, not
forgetting that these results are from a non-symptomatic population performing a single limb
isometric task, it does indicate that there is a trend in non-symptomatic subjects to increase VM
and decrease VL firing rates with the application of tape and perhaps suggesting a novel re-
distribution of load. The parametric statistical analyses did not exhibit any significant
differences between the two conditions, however this type of analysis may not demonstrate any
individual differences that could be present. These results are not in agreement with
MacGregor et al. (2005) who showed that there was no net increase in the motor unit firing
rate, although a trend to increase, from the Vastus Medialis with the application of tape,
although changes in individual subjects were seen with approximate 1-2 Hz increases in firing
rate. The mean firing rate of a muscle has a relationship with ‘gross’ sEMG measurements

201
amplitude of a signal, where the higher MFR could be seen in a higher amplitude sEMG signal.
The increase in sEMG signal amplitude has been reported previously in PFP research,
MacGregor et al. (2005) for example showed that as well as changes in motor unit firing rate
the overall amplitude increased marginally. However, the comparison of the amplitude of a
sEMG signal to the motor unit firing rate of individual motor units should be approached with
caution as there are more factors that could demonstrate an increase in the amplitude of a signal,
such as recruit in new motor units, change in MU force twitch, measurement differences etc.
and therefore arguably not a sensitive enough measure to understand the complexities of the
neuromuscular system, which is also reflected by the lack of consensus in the PFP literature
with sEMG.
It has been demonstrated that cutaneous stimulation of the foot can contribute to the excitation
of agonist motor units whilst causing an inhibition to the antagonist motor units (Hargbarth
1952). The term ‘inhibition’ of a muscle is a well-studied neurophysiological area, which has
been an attractive notion for clinicians and researchers alike in an attempt to explain the effects
of different taping techniques. The therapeutic investigations have often attempted to
substantiate the claims of an inhibited muscle by demonstrating a simple reduction in the
surface EMG amplitude (Tobin & Robinson 2000; McCarthy Persson et al. 2009), which
arguably is too much of a gross measure to demonstrate such a discrete variable. Instead it is
suggested, in combination with the findings from this work, that the behaviour of the motor
unit pool is a more sensitive measure in understanding the response of a muscle to a taping
intervention and that the term inhibition of a single muscle may be too simplistic to explain the
complex and intricate characteristics of the motor control system. Findings from this study
suggest that there may be a shift in force contribution between the Vasti muscles with the
application of tape, albeit a marginal response, which in combination with other motor unit
control strategies could provide new and novel insights.
The individual analyses showed that the VM and VL responses were non-uniform with subjects
sometimes showing complete opposing responses to the application of tape. Responses to the
tape in some subjects showed large changes in the MFR with increases in the VM by 23.4%
(Figure 10-6) yet decreases in VM by 19.1% in another subject (Subject 8). Interestingly the
recruitment gradient of the motor unit firing in the tape condition seems to be steeper and could
indicate another strategy at work.

202
The non-uniform responses in the MFR from the Vastus Medialis and Vastus Lateralis were
not expected to be seen in such diverse and opposing ways, especially within the non-
symptomatic subject population. Previous work (MacGregor et al. 2005) only demonstrated
small changes (1-2 Hz) in response to a similar taping technique, but was limited to studying
only a small selection of motor units, at a low level force and in symptomatic subjects. Whereas
this study demonstrated subjects can exhibit firing rate changes up to 4 pulses per second (pps)
(Figure 10-6) in response to tape. The firing rate of a motor unit is one of the key determining
factors in the generation of force in the muscle (Burke 1981), thus a change in the motor unit
firing rate infers a change in the force produced by the muscle. The findings from this work
therefore suggest that non-symptomatic subjects alter the force contributions within each, and
sometimes both, of the Vasti muscles in response to a taping intervention. The combination of
an increase or decrease in the motor unit firing rate could consequently subtly alter the joint
biomechanics and increase the overall stability at the knee.
Mea
n F
irin
g R
ate
(Puls
es P
er S
eco
nd)
Figure 10-6 Example of change in Vastus Medialis Mean Firing Rate in response to tape in non-
symptomatic subject

203
10.3.2.2 Symptomatic
The average MFR for all the symptomatic subjects, similarly to the non-symptomatic subjects,
showed a marginal change in response to the taping intervention. The Vastus Medialis
exhibiting a 4% increase in MU firing rate with the taping intervention, whereas the Vastus
Lateralis MU firing rate not showing any response in the taping intervention when the results
are pooled. These findings indicate, as with the non-symptomatic subjects, that the force
contribution within the Vastus Medialis is marginally increased following the application of
the taping intervention.
Upon further exploring the MFR results for each symptomatic individual it is evident that the
MU firing rate response to tape is non-uniform. Subjects clearly demonstrate different
responses to the taping intervention, often in different magnitudes and directions. For example
one symptomatic subject responded with a 72.3% increase in VM MU firing rate (Figure 10-7)
whilst another subject exhibited a 30.5% decrease in MFR in their VM MU firing rate. These
examples seem to again display a steeper recruitment slope in the recruitment of the motor
units and suggesting that a different strategy may be in use. Other subjects can also be seen
to either increase, decrease or no change with the MU firing rate. It should be noted that no
changes in the knee flexion moment were found, suggesting that the same load was subjected
to the knee joint, and only motor units with an accuracy of <90% were included in the analysis,
therefore the changes seen can confidently be assumed to be true physiological changes rather
than measurement error. The only other evidence to present such dramatic changes in firing
rate with an intervention using surface EMG decomposition is when measuring the
microgravity induced changes in the motor unit control of astronauts (De Luca et al. 2003).
These findings are the first of their kind to present empirical evidence that tape can alter the
motor unit firing rate within individuals, suggesting that different subjects’ nervous systems
maybe offering different strategies in modifying the force contribution within the muscles.
This offers key insights into the clinical response of tape seen in symptomatic individuals and
provides evidence that tape can perhaps offer a clinically important change.

204
10.3.2.3 Non-Symptomatic vs Symptomatic
As can be seen from the previous discussion it is apparent that both non-symptomatic and
symptomatic subjects exhibited non-uniform and individualistic responses to the taping
intervention, regardless whether they were pain-free or presented with knee pain. Interestingly
though when comparing the grouped data from the two subject groups the Vastus Medialis
average MFR presented with similar pre and post tape intervention firing rates. In the no tape
condition both groups exhibited similar MU firing rates, 17.8pps and 17.6pps for the non-
symptomatic and symptomatic groups respectively. The tape condition response both showed
a similar increase to 18.4pps and 18.6pps for the non-symptomatic and symptomatic groups
respectively. This is, to the authors’ knowledge, the first empirical evidence to compare Vasti
motor unit firing rate between non-symptomatic and Patellofemoral Pain subjects. Trevino et
al. (2014) recently demonstrated in a single case study showing significant differences in
comparing healthy subjects to a spinal poliomyelitis subject with the firing rate of the Vastus
Lateralis being 7.8pps higher in healthy subjects. This demonstrates that the surface EMG
decomposition measurements are able to establish clinically important change between non-
symptomatic and symptomatic subjects, providing reassurance that the lack of difference
between the subject groups in this study is a true physiological. These findings are for the first
time able to indicate that the Vastus Medialis MU firing rates, and consequently a method of
generating force within the muscle, is the same between non-symptomatic and symptomatic
subjects and that perhaps other motor unit strategies are apparent between the subject groups.
Mea
n F
irin
g R
ate
(Puls
es P
er S
eco
nd)
Figure 10-7 Example of change in Vastus Medialis Mean Firing Rate in response to tape in symptomatic
subject

205
10.3.3 Motor Unit Common Drive
It has been shown that motor units rather than being controlled individually are in fact receiving
a ‘common drive’ and are being controlled in unison (De Luca & Erim 1994), most likely
mediated centrally (De Luca et al. 2009). Erim et al. (1999) eloquently presented the effects
of aging on motor unit properties by showing that there is a significantly decreased
commonality in the firing of the motor units in the elderly, compared to young subjects,
suggesting a less efficient strategy from the CNS. Complimentary to this work De Luca &
Erim (2002) demonstrated that common drive exists between motor units belonging to two
synergistic muscles and in agreement with earlier work that common drive exists between
antagonist muscles (De Luca & Mambrito 1987). Understanding the presence and degree of
common drive in the Vastus Medialis and Vastus Lateralis has not before been explored, or has
it been considered in Patellofemoral Pain subjects or with a clinical intervention. The notion
of a disrupted commonality in the firing rates of symptomatic subjects and the response to a
taping intervention is clinically a tantalising prospect, potentially providing information on the
control and efficiency of the muscle. This study investigated the presence and degree of
common drive in non-symptomatic and symptomatic subjects and their response to a taping
intervention.
10.3.3.1 Non-Symptomatic
It was found that the both the Vasti muscles exhibited evidence of a common drive to the pool
of motor units, however no significant responses to the taping intervention were found when
grouping the data (see section 9.5.1). The Vastus Medialis showed a 2.4% reduction in
common drive with the application of tape and the Vastus Lateralis showing the same values
between the tape and no tape conditions. These findings indicate that the motor units in the
Vasti are controlled through a common drive, evident by the degree of cross-correlation and
thus commonality in motor unit firings, however the taping intervention does not offer any
significant modification to the common drive in non-symptomatic subjects. It was thought that
the taping intervention may, through cutaneous stimulation, offer an altered and perhaps
enhanced common drive strategy due to the proprioceptive feedback. However, it may be that
the non-symptomatic subjects, as with the young subjects in Erim et al. (1999), already present
with the optimal common drive strategy.

206
As the MU firing rate data presented non-uniform responses and strategies with the application
of tape, and the common drive is calculated using the firing rate, the grouped common drive
was exposed to investigate individual’s responses. It was found that subjects demonstrated
differing responses to the application of tape, whereas some subjects were showing large
increases in common drive others were showing large decreases. For example subject 4
increased the common drive by 17.1% in the Vastus Medialis, indicating that more motor units
were firing in unison with the application of tape. It could then be inferred that this is a more
efficient solution provided by the nervous system for this subject. However, the opposite
behaviour was also seen where for example subject 5 decreased the common drive by 14.3%
in the Vastus Medialis with the application tape, indicating less motor units were firing in
unison and a perhaps less efficient solution. No relationship was evident with increasing or
decreasing in one muscle and the opposite behaviour seen in the other muscle in individuals.
These findings exhibit for the first time that individuals present with variable responses to a
clinical intervention in the degree of common drive consequently suggesting that tape can alter
the neural drive to the motor unit pool and inferring an altered motor unit control mechanism.
The clinical implication of this is that the application of tape cannot just modify the amount of
force generated within a muscle but also the amount of control within the generation of force
within the muscle. The ‘control of a movement’ or the ‘quality of a movement’ is often a
mantra heard within clinical practice that is typically not complimented in the variables
measured in the research field with studies taking relatively gross measurements such as peak
angle and moments, maximum strength and often considered to be more sensitive sEMG
measures. These variables are arguably not in line with the clinical message of ‘control’ and
‘quality’. The introduction of the common drive in response to a clinical intervention offers a
unique concept and it can be seen from these findings that it presents clinically meaningful
differences.
10.3.3.2 Symptomatic
The grouped analyses of the symptomatic subjects found that the Vasti muscles common drive
responded with opposing behaviour. The Vastus Medialis increased the common drive by
5.1% across the group of symptomatic subjects, again demonstrating that common drive is
present but more interestingly that the taping intervention is modifying the control of the motor
unit pool. The Vastus Lateralis presented, opposing the Vastus Medialis behaviour, with a
decrease in common drive with the application tape by 9.1%. These fascinating findings

207
provide additional support for the fact that a taping intervention can alter the control of the
motor unit pool either by increasing or decreasing the commonality of the motor unit firings,
inferring a more or less controlled generation of force within the muscle. However, the most
interesting finding is the increase in the Vastus Medialis and the decrease in the Vastus
Lateralis as this infers that there may be a disproportional control response between the Vasti
with the application of a taping intervention. The findings would suggest that with the
application of tape more Vastus Medialis motor units are firing or ‘working’ in unison thus
seemingly being more efficient when generating force within the muscle. However, at the
same time the Vastus Lateralis has less motor units firing in unison and seemingly becoming
less efficient at generating force within the muscle. These findings may be presenting an
indication as to the inhibition of Vastus Lateralis and complimentary excitation to the Vastus
Medialis in response to the application of tape. De Luca et al. (2009) found that the decrease
in the degree of motor unit common drive may not necessarily be an indication of decreased
common drive from the central nervous system, but rather an inhibitory influence from the
peripheral nervous system. It was proposed that the inhibition is being influenced by the
proprioceptive feedback with the muscle spindles being primarily responsible, which was also
shown in other work (Garland & Miles 1997). These findings could offer an attractive insight
into the observed decrease in Vastus Lateralis common drive seen in the taped condition, rather
than a centrally mediated decrease in common drive to the motor unit pool the tape is providing
feedback to the muscle spindles which in turn the peripheral nervous system modifies the
control to the motor unit pool with an inhibitory mechanism.
Individual analyses of the symptomatic subjects highlighted the evidence of some
individualistic responses with differing directions and degrees of common drive to the Vasti.
Some subjects demonstrated large increases in common drive with the application of tape, a
31.3% in the Vastus Medialis was found in one subject (PFP 13). Yet, other subjects responded
with a large decreases in common drive, for example PFP 7 exhibited a 10.5% decrease in the
degree of common drive in the Vastus Medialis. Similar findings are also seen in the Vastus
Lateralis with a non-uniform response to tape amongst the subject group. These findings
again bring to light the importance of an individualistic response and contributes to the thought
that there may be different strategies available and actioned in response to the tape intervention.
This holds clinical importance as it demonstrates that both groups of and individual
symptomatic subjects can present with a form of plasticity within the motor control system.

208
10.3.3.3 Non-Symptomatic vs Symptomatic
The grouped common drive data highlight some tantalising differences between the subject
groups. The Vastus Medialis common drive shows that there is a lesser degree of common
drive in the symptomatic subjects compared to the non-symptomatics. However, following the
application of the tape the common drive in the Vastus Medialis increases to match the same
degree of common drive seen in the non-symptomatics. The Vastus Lateralis is also reduced
in the symptomatic subjects to match the same common drive in the non-symptomatics. These
findings are shown in Figure 10-8 and highlight the apparent adjustment of the common drive
to the Vasti muscles in the symptomatic subjects to match the non-symptomatics with the tape
intervention.
Although less of an effect, the differences seen in this study between the non-symptomatic and
symptomatic subjects demonstrating a lesser degree of motor unit firing commonality and
consequent common drive in the symptomatic subjects Vastus Medialis displays similarities to
the findings and considerations of Erim et al. (1999) where there seems to a be disruption in
the motor unit control. However, the taping intervention then demonstrates a reversal of the
disproportion control of the Vasti motor units, presented by an increase in common drive to the
Vastus Medialis and decrease in Vastus Lateralis, suggesting that the taping intervention may
be causing inhibition of the Vastus Lateralis and excitability of the Vastus Medialis to match
Figure 10-8 Common drive results from both subject groups before and after the
application of tape.

209
that of the non-symptomatic subjects. These findings are the first of their kind to be able to
demonstrate firstly the disproportionate control of the Vasti between non-symptomatic and
symptomatic subjects and secondly that a taping intervention can alter the motor unit control
mechanisms. The deduction of the apparent modifications are difficult to establish, however
it is speculated that the tape on the skin through cutaneous stimulation, skin stretch (MacGregor
et al. 2005) or more vaguely proprioception provides feedback to the muscle spindles which
through afferent feedback influences both the central and peripheral nervous systems to alter
the motor unit firing and their control (De Luca et al. 2009). The findings suggest that the
application of tape can modify the control of the motor units to the symptomatic subjects so
that it equals the common drive seen in the non-symptomatic subjects. The pre-tape
mismatched distribution and degree of common drive to the Vasti suggests that symptomatics
subjects may have less efficient organisation of motor unit control, which is consequently
modified to be more efficient with the application of tape demonstrating key clinical
implications.

210
10.3.4 Motor Unit Recruitment Strategy
Another mechanism of changing the force level of a muscle in a voluntary contraction is the
recruitment of motor units (Adam & De Luca 2003) and the strategy used to achieve this. It is
well documented that the recruitment of the motor units and the modulation of firing rates is
structured and inversely proportional to the mean firing rate of motor units (De Luca & Erim
1994; Erim et al. 1999; De Luca & Hostage 2010; Stock et al. 2012; De Luca & Contessa
2012). The recruitment threshold provides information on the recruitment of the motor unit
pool and its strategy to generate force within the muscle through either an altered motor unit
firing rate and/or the level of force required to recruit the motor units. Tucker and Hodges
(2010) showed that the recruitment strategy of the Vasti motor units changed during pain which
then altered the direction of muscle force, however the study was limited as they were only
able to measure a small number of motor units at a low level of force and in a non-functional
or challenging task. Stock et al. (2012) using surface EMG decomposition methods found that
the recruitment threshold of the Vastus Lateralis was altered in a fatigued muscle,
demonstrating that the fatiguing protocol either recruited higher threshold motor units or
increased the firing rate of the existing higher threshold motor units. These findings once again
provide evidence that the Vasti muscles can demonstrate clinically important changes and do
so in the presence of pain or fatigue. However, no previous work has investigated the
recruitment strategy using surface EMG decomposition methods in Patellofemoral Pain
subjects or the effect of a therapeutic intervention such as taping.
10.3.4.1 Non-Symptomatic
It was found that in the taped condition the Vastus Medialis motor units were being recruited
driving the motor units to fire faster, represented by a significantly different regression
intercept (p<0.001) and slope gradient (p<0.05). These findings suggest that in response to the
tape intervention the motor unit pool is being driven to fire quicker at the same level of
excitation/force, consequently suggesting that the force within the Vastus Medialis may have
increased. Although the analyses demonstrated significant statistical changes the mean
differences of 1.4pps for the motor unit intercept should be considered for its clinical
significance and whether this marginal, albeit it significant, change represents a true
physiological change for the group. The Vastus Lateralis conversely did not exhibit any
significant changes in the tape condition and the recruitment strategy remained unaltered. The
strategy of the Vastus Medialis motor unit pool to be recruited with higher firing rates presents

211
a unique and seemingly efficient strategy by the CNS to modify the control of the knee joint in
response to tape by altering the force within the muscle, this is the first time that this has been
investigated or shown before.
It was found that, like the mean firing rate and common drive, the recruitment threshold
strategies differed amongst the non-symptomatic subjects. Although the grouped analyses of
the non-symptomatic subjects presented with significant changes towards motor units being
driven at a higher firing rate there were subjects within the group who presented with the
opposite behaviour. Subject 9 for example presented with a significantly lower intercept
(p<0.001) and significantly flatter slope gradient (p<0.001) with the application of tape in the
Vastus Medialis. However, this subject instead presented a different strategy of recruiting the
Vastus Medialis.
An alternative motor unit recruitment strategy was observed for the first time where the motor
unit pool was being recruited at a different level of force/knee moment in response to the taping
intervention. In the example of Subject 9 they required less force/knee moment to recruit the
Vastus Medialis motor unit pool with the taping intervention. This strategy, termed the
recruitment operating point, presents a novel finding that in the same subject and the same
muscle the operating point, defined as the firing rate versus the recruitment threshold line (De
Luca & Hostage 2010), is able to decrease or increase the required force/knee moment to recruit
the motor unit pool in response to the taping intervention. The same hierarchical organisation
of the motor unit pool recruitment is still retained as shown by De Luca & Hostage (2010), but
perhaps demonstrates the plasticity of the operating point in being able to shift. The adjustment
of the muscles operating point seems to be a strategy from the CNS to manipulate the timing
of the force production within a muscle and allow the force to be generated earlier or later.
This findings have not directly been observed or considered previously and shows for the first
time a novel and unique strategy in the response of the muscle in symptomatic subjects and
with the application of tape. A plethora of previous work may have found indications of this
phenomenon when studying the onset timing of the muscle using traditional surface EMG
measurements (Gilleard et al. 1998; Cowan et al. 2001; Cowan et al. 2002; Cavazzuti et al.
2010; Aminaka et al. 2011) showing the onset timing of the Vasti was altered in Patellofemoral
Pain subjects and in response to tape. However, the techniques in exploring the timings have
been questioned to their validity (Uliam Kuriki et al. 2011) showing that the different methods
of establishing the onset show variable and inconsistent findings suggesting that traditional

212
surface EMG may not be sensitive enough to establish the discrete differences in motor unit
recruitment. However, in being able to study individual motor units and their firings it offers
a more sensitive measure in determining the onset of the muscle, and perhaps more importantly
being able to relate to a physiological measure, the level of knee moment, opposed to a measure
of time. Similarities can be drawn between the recruitment threshold and the muscle onset
timing, but arguably are unable to be compared due to the galactically different sensitivities in
the measurement and outcome variable. As Uliam Kuriki et al. (2011) reported there are
various techniques in trying to understand the onset of the muscle, all of which offer difference
outcomes depending on the calculation, but by using EMG decomposition to investigate the
muscle onset through using recruitment threshold the onset of the muscle is identified by
studying the first firing of the first motor unit and uniquely is then able to study the remaining
recruitment of the consequently recruited motor units. So although the measures have a
relationship it would be unfair to directly compare as would comparing the knee angle from a
handheld goniometer to a 3D motion capture system.
These methods and consequent findings provide for the first time a detailed explanation and
insight into various methods of recruiting motor units within subjects and their responses to a
taping intervention offering potentially key clinical insights into both the presentation and
possible responses that subjects display.
10.3.4.2 Symptomatic
Grouped results of the recruitment threshold did not show any significant changes with the
application of tape in the symptomatic subjects. Both the regression intercept and slope
gradients did not present any significant changes (p=0.52 and p=0.25) for the Vastus Medialis
respectively or the Vastus Lateralis (p=0.80 and p=0.23) respectively. These results infer that
as a group the symptomatics subjects do not change their recruitment strategy with the
application of tape. These findings are interesting as it was expected that like the non-
symptomatic subjects the Vasti would respond to the application of the tape suggesting a degree
of plasticity in the symptomatics motor unit recruitment strategy. Instead they did not offer
any significant change with the application of tape, which however does offer an interesting
finding in that symptomatic subjects may not have the ability to use a different recruitment
strategy. However, when investigating the individuals response it became apparent that
although no significant changes were seen looking at the grouped data, individuals presented
with variable responses to the taping intervention with 9/13 subjects exhibiting a significant

213
response (p>0.05) to the tape. Similar to the non-symptomatics subjects there were individual
subjects who had a significantly altered recruitment strategy in either in the Vastus Medialis or
Vastus Lateralis, or sometimes both of the Vasti muscles. The two strategies being used were
either to alter the firing rates by driving them quicker at the same force/knee moment, or the
motor units were being recruited at a lower or higher force/knee moment as seen in the non-
symptomatic subjects.
Subject PFP 1 for example demonstrated a 9.6% change in recruitment operating point with
the Vastus Medialis muscle being recruited with less force/knee moment requirement, causing
force within the muscle to be generated at any earlier point with the application of tape.
However, subject PFP 12 demonstrated a different strategy and to reduce the force/knee
moment to the Vastus Lateralis, by 8.8% in this example. Both strategies demonstrate that
there are various methods the nervous system employs to alter the recruitment of the
contributing muscles
10.3.4.3 Non-Symptomatic vs Symptomatic
Significant differences were found when comparing the motor unit recruitment threshold for
the non-symptomatic and symptomatic subjects in the Vastus Medialis and Vastus Lateralis
(see section 9.12.5). The regression intercept indicated that the Vastus Medialis in
symptomatic subjects was being recruited at a significantly (p<0.001) lower firing rate
compared to the non-symptomatics subjects. An equally fascinating finding was that the
Vastus Medialis in the symptomatic subjects exhibited a significantly (p<0.001) flatter slope
gradient, indicating that the later recruited motor units in the Vastus Medialis were firing at a
significantly higher rate for the same level of force/knee moment compared to the non-
symptomatic subjects. Interestingly the Vastus Lateralis showed the opposite behaviour to the
Vastus Medialis. This was evident by the significantly (p<0.001) lower intercept and slope
gradient (p<0.005). Never before has the recruitment thresholds of the Vasti been compared
between non-symptomatic and symptomatic subjects so these findings provide the first
evidence that symptomatic subjects may present with a different and potentially clinically
significant alteration in the strategy of recruiting the Vasti muscles. The changes exhibited
between the subject groups are similar to the findings by Stock et al. (2012) after investigating
fatigue of the Vasti it was found that the Vastus Lateralis presented with significantly flatter
slope gradient and significantly lower slope intercept in the fatigued condition compared to the

214
pre-fatigue condition thus demonstrating that the later recruited motor units had a significantly
higher firing rate at the same level of force in the fatigued condition. Although Stock et al.
(2012) did not see any changes in the Vastus Medialis, this could be due to the open kinetic
chain knee extension task performed and perhaps lacking the involvement or stability challenge
to the Vastus Medialis, unlike in this study where subjects performed a stability challenging
closed kinetic chain exercise.
These findings indicate that both the Vastus Medialis and Vastus Lateralis in the symptomatic
subjects present with significantly different motor unit recruitment strategies compared to the
non-symptomatic subjects. The strategy of the symptomatic subjects is to increase the firing
rate of the later recruited motor units at the same respective level of knee moment, which would
consequently offer an increased level of force within the two Vasti muscles. These results are
in agreement with the previous observations (see section 0) that the surrounding musculature
is less active in the symptomatic subjects and consequently the Vasti have a greater
responsibility to manage the load of the knee joint, which could cause a greater patellofemoral
joint reaction force and consequently pain. These findings perhaps further demonstrate a
strategy of the symptomatic subjects to disproportionally bias towards the Vasti compared to
the non-symptomatic subjects, regardless it does offer a novel and clinically important
presentation of symptomatic subjects and the apparent different strategies.

215
10.3.5 Motor Unit Control Strategy
It is evident from the previous sections that the nervous system presents various strategies in
controlling the motor unit pool to the Vastus Medialis and Vastus Lateralis and how it responds
to the taping intervention. However, it is also evident that the motor unit firing rate, common
drive and recruitment strategy present variable responses amongst individuals which could be
offering a portfolio of solutions to achieve the same goal, increasing the force and its control
within the muscle.
The different motor unit control strategies can be likened to a cyclist’s strategy, whereas ones
goal is to increase force and control the other is to increase speed and efficiency. In road
cycling the goal is often to cycle the fastest, in order to achieve this there are many factors
involved (athlete, conditions, equipment etc.) but for this analogy the athlete, being the most
deterministic in achieving the goal, is the discussed factor. In order for the cyclist to be the
fastest depends on speed and efficiency, the former of which can described in terms of cadence
and gear selection. For example if the cyclist wants to go quicker they can increase the cadence
and/or change to a higher gear, consequently leading to an increase in speed. This is similar to
increasing the force within a muscle where the CNS can increase the MU firing rate and/or
adjust the MU recruitment, both of which will result in an increased force. The other factor to
consider is feedback, in road cycling the team will be in constant communication with the
support car feeding back information verbally and through an array of sensor technologies,
whom in turn instruct the rest of the team. This can be related to the nervous system as the
muscles are providing constant feedback to the CNS via various sensory components which,
through common drive, provide instruction to the motor unit pool. Both examples can be
improved with more effective and efficient feedback, of which tape may offer significant
improvements to the feedback of the nervous system and consequently leading to enhanced
control.
The complex inter-relationship between the motor unit firing rate, motor unit recruitment
threshold and the common drive offer unique strategies at achieving the same objective in the
generation of force and its control within the muscle. As with cycling, individuals may be
instructed to ride in a lower gear with a higher cadence and be given constant adjustment
through feedback. Similar to how an individuals’ CNS instruct muscles to alter the recruitment
of the motor units, the mean firing rate and/or common drive (Figure 10-9).

216
Figure 10-9 Graphical representation of the inter-relationships and contributing factors to force
generation and control within the motor unit pool

217
10.4 Neuromuscular, Biomechanical and Clinical Relationship
Each discipline has its own complex and intricate inter-relationships such as the relationship
between an adducting knee moment and internally rotating hip or motor unit firing rate and
recruitment strategy. However, instead of considering these differing disciplines to be
independent they should be considered as being delicately inter-related and weaved as one
multifaceted and redundant motor control system.
It has previously been shown that the knee joint mechanics offers subtle yet significant
improvements in movement control with the application of various proprioceptive orientated
interventions in non-symptomatic (Selfe et al. 2008) and symptomatic (Selfe et al. 2011)
subjects. Following on from previous work this study studied the knee joint biomechanics with
a common clinical taping intervention. It was found that the application of the taping
intervention offered significant improvements in the knee joint control across the subject
groups, however interestingly there was a non-uniform response when exploring the subjects
as individuals. Regardless of the direction of the response it shows that a seemingly simple
clinical taping intervention has a significant effect on the knee joint mechanics but offers little
in understanding on how the changes in mechanics occur.
An often understated factor to movement control and its response to pain are the psychological
mechanisms and specifically the conscious motor processing involvement. Selfe et al. (2014)
found that subjects presenting with self-reported knee pain have a higher propensity for
conscious motor processing than there pain free counterparts, suggesting that subjects
experiencing pain have a tendency to consciously control their movements. This study found
similar results to Selfe et al. (2014) where symptomatic subjects showed a trend towards
consciously controlling their movements, suggesting they are concerned with the execution of
their movements. These findings are also in agreement with other work that suggests subjects
respond to pain and fear of pain developing avoidance mechanisms (Lethem et al. 1983).
Lethem et al. (1983) also suggests that the response may be individualistic with either an
‘avoidance’ or ‘confrontation’ response. These suggestions are complimentary to individuals’
strategies found within this study, where subjects employed different movement control
strategies seen in the biomechanical and neuromuscular findings.
Studying the neuromuscular system, being primarily responsible for movement and control of
the joint mechanics, is commonly undertaken to better understand the underlying mechanisms

218
associated with Patellofemoral Pain. However, previous work has typically taken
measurements from just the Vasti and seemingly ignoring the potential importance from
surrounding musculature. It was found in this work, through gross EMG amplitude
measurements that the Gastrocnemius, Biceps Femoris, Rectus Femoris and Gluteus Medius
are all involved in the control of the lower limb and offer marginal yet non-uniform responses
to the application of the taping intervention. However, investigating the relationships between
the knee joint mechanics and the gross EMG measurements it is apparent that the two subject
groups offer distinctly differing strategies. Whereas the non-symptomatic subjects present with
variable EMG responses across the muscles and consequently more controlled joint mechanics,
the symptomatics present with less variable EMG responses and consequently more variable
knee joint mechanics. These findings show firstly that studying surrounding musculature is an
important factor to consider in a movement and condition where multiple muscles are involved,
but secondly that symptomatics subjects offer less muscle activity and less flexibility in
modifying the activity of the muscles surrounding the knee. However, the mechanisms as to
how the change in muscle activity and apparent different strategies are managed cannot be fully
determined from monitoring gross EMG and joint mechanics changes. Instead it becomes
necessary to gain insight into how the brain and nervous system responds to the effect of a
proprioceptive orientated intervention.
Thijs et al. (2010) using functional magnetic resonance imaging (fMRI) investigated levels and
areas of brain activation with a knee brace, knee sleeve and without any application. It was
found that higher levels of cortical activation were present with the application of the two
interventions. Similar findings were later found by Callaghan et al. (2012) with a taping
intervention, where significant increase in blood oxygenation level-dependent (BOLD) were
found in the taped condition. Both of these studies present evidence suggesting that a
peripheral proprioceptive intervention, such as tape or knee braces, influence brain activity in
areas of the brain thought to be responsible for proprioception. These findings coupled with
previous work investigating the changes with joint mechanics, gross muscular changes and
conscious motor processing involvement suggest that tape and other proprioceptive orientated
interventions are capable of modifying the sensory-motor processes but still lacks information
on the mechanisms of force and control.
MacGregor et al. (2005) investigated the effect of a taping intervention on the motor unit
activity, using intramuscular EMG, finding that a small proportion of Vastus Medialis motor

219
units increased the firing rate in the taped condition. Similarly Mellor and Hodges (2005a)
found that the motor unit synchronisation was reduced in Patellofemoral Pain subjects
compared to controls. Both these studies suggest that changes can be found in the control of
individual motor units, which suggest that the force generation and control within the motor
units and consequently the muscle can be altered. However, both studies were severely limited
due to the yield of motor units for study, the lack of a function and clinically relevant task but
more importantly the relationship between the different sensory-motor systems. The findings
from this work provides evidence of different motor unit control strategies through
modifications in the firing rate, common drive and/or recruitment of the motor unit pool in the
Vastus Medialis and Vastus Lateralis. It was found that the nervous system offers a portfolio
of strategies in order to alter the force and control of the motor units to both symptomatic and
non-symptomatic subjects in response to a taping intervention. These findings and postulates
are in agreement with recent work by Hodges et al. (2013) in the investigation of muscle control
and spine stability during experimentally induced lower back pain. It was found that lower
back pain caused a variable pattern of increasing and decreasing trunk muscle activity, leading
to an increased estimated spine stability. Suggesting that, unlike previous theories (Roland
1986; Lund et al. 1991), there are many ‘solutions’ available to increase stability rather than a
stereotypical response, and perhaps a redistribution of activity within and between muscles
(Hodges & Tucker 2011).
The underlying mechanism for the observed findings are unable to be expressed definitively,
however it can be deduced from the findings that the application of the tape may be presenting
a form of feedback to the muscle, most likely the muscle spindles (De Luca et al. 2009), which
both the central and peripheral nervous systems alter the motor unit pool by adjusting the force
and its control within the muscle that may consequently adjust the joint mechanics. The key
clinical implications for these findings is that the application of tape can offer clinically
meaningful change to the motor control system. However, researchers and clinicians should
consider the individualistic responses with data analyses and clinical decision processes
respectively.
Previous investigations have found significant and clinically important changes in the joint
biomechanics, psychosocial factors, brain activity, gross neuromuscular activity and limited
findings in the motor unit control, which have all often been studied in isolation. This study’s
unique and inter-disciplinary investigation provided a detailed and novel insight into the motor

220
unit control, biomechanical, neuromuscular and psychosocial factors in understanding the
movement control of Patellofemoral Pain subject and the response to a common clinical
intervention. The delicate and proposed inter-related motor control system, as first described
in section 2.7, can now be seen to hold a fuller description by contributing the novel aspects of
the motor unit control strategies (Figure 10-10)
Motor Unit Control
Strategy
Behaviour
Ventral
Horn
sEMG
Muscle Behaviour
Joint
Biomechanics
Motor Unit
Behaviour
Central Nervous
System
Muscle Spindles
Free Nerve
Endings
Figure 10-10 Graphical representation of systems involved in movement control including new
motor unit control strategy findings
Steven
Stamp

221
11. Conclusions
11.1 Summary
In conclusion, this study investigated the neuromuscular, biomechanical and clinical changes
associated with control of the knee joint and the response to a taping intervention, in both non-
symptomatic and Patellofemoral Pain subjects. The study applied novel methods and
techniques to determine the motor unit control of the Vasti muscles combining with a host of
complimentary biomechanical and psychosocial measurements to provide a unique insight into
the redundantly complex sensory-motor control system.
The application of the taping intervention exhibited significant reductions in the torsional joint
range of moment in non-symptomatic and symptomatic subjects, suggesting that tape can offer
clinically meaningful improvements in joint stability and control. Non-uniform responses to
the tape application in the coronal and transverse planes were observed, indicating
individualistic biomechanical schemes form part of the motor control strategy. Significant
reductions in the activity from the muscles proximal, distal and surrounding the knee were
found in the symptomatic subjects compared to the non-symptomatics, suggesting a
disproportion bias to other structures and explicitly the Vastus Medialis and Vastus Lateralis.
Complimentary to the objective neuromuscular and biomechanical findings the symptomatic
subjects demonstrated a propensity to consciously control their movements indicating that they
are concerned and aware of the execution and the movements they carry out. Although no
obvious relationships were found with the objective measures it does propose the importance
of the psychosocial features in understanding the presentation and subsequent clinical
management of Patellofemoral Pain subjects.
The study supplemented the investigations of the joint biomechanics and surrounding
musculature with novel explorations of the unique motor unit control schemes and their
strategies used to generate, modify and control force within the Vastus Medialis and Vastus
Lateralis. It was found that the motor unit firing rate can be manipulated and is responsive to
the application of tape demonstrated by an increase in firing rate for the Vastus Medialis and
decrease in Vastus Lateralis. Accompanying the change in firing rate it was found that the
symptomatic subjects demonstrated an increase in common drive to the Vastus Medialis with
the application of tape, indicating more motor units were been controlled in unison and
suggesting a more efficient solution in controlling the muscle. The Vastus Lateralis however

222
displayed the opposite behaviour in response to the application of tape with a decreased
common drive, which may be due to an inhibitory mechanism from the peripheral nervous
system and suggesting both findings indicate an overall strategy in re-distributing the
contribution of Vasti motor unit control with the application of tape. Symptomatic subjects
demonstrated significant differences to the recruitment threshold by showing the later recruited
motor units were being driven to fire faster compared to non-symptomatic subjects at the same
level of force/knee moment. Some subjects also displayed a different and/or accompanying
recruitment behaviour by shifting the recruitment operating point so that less or more
force/knee moment was required to recruit the motor unit pool. However, as with the
biomechanical responses the motor unit responses exhibited individualistic responses to the
application of tape. Individuals from both non-symptomatic and symptomatic groups
displayed a disparity of increasing and decreasing motor unit firing, common drive and
recruitment strategies, suggesting that tape can dramatically and individualistically modify the
control and generation of force in the Vastus Medialis and Vastus Lateralis.
The unique explorations and novel findings from this work suggests that the nervous system
offers various strategies in order to generate and control the force of the muscles surrounding
the knee, also demonstrating its plasticity by offering significant and clinically meaningful
responses to a clinical intervention. In combination with the biomechanical responses and
psychosocial features this work offers a key insight into the sensory-motor control system
which seemingly presents a portfolio of strategies.

223
11.2 Clinical Contributions
The aim of this work was not only to contribute to the research knowledge gap in
Patellofemoral Pain, but of equal importance was to contribute to clinical practice providing
clinicians with pertinent information about the presentation and observed responses to a
therapeutic intervention. Although the methods and equipment used within this work are
beyond the scope of most clinical practice the findings from this work can provide clinicians
with key insights into some of the potential sensory-motor strategies patients may present with
and how they may respond to a therapeutic intervention. A summary of the key clinical
messages can be found below:
- Although established anatomical and morphological evidence exists to suggest that
the Vastus Medialis has two distinct portions, Obliquus and Longus, explorations
into the motor unit control behaviour between the two portions suggest that the
muscle is in fact a single functional unit. Indicating that any treatments directed at
the Vastus Medialis will affect the whole muscle rather than portions of the muscle.
- Patellofemoral Pain patients present with significantly reduced muscle activity in
the Medial Gastrocnemius, Biceps Femoris, Rectus Femoris and Gluteus Medius
compared to non-symptomatic individuals. Suggesting that PFP patients may bias
other structures, such as the Vasti, potentially increasing the patellofemoral joint
reaction force. Treatments should possibly be directed towards enhancing the
contribution of the surrounding muscles and/or re-distributing the Vasti load.
- Rotational control of the knee joint mechanics can be enhanced with the application
of tape, suggesting that the knee joint may be more stable in a taped condition.
- Patellofemoral Pain patients present with a significantly altered motor unit
recruitment strategy in the Vasti, suggesting a higher force contribution from within
the Vasti. This may imply that the Vasti muscles in PFP patients are being
disproportionally worked in comparison to other muscles.
- Application of the taping intervention increased the control of the motor units in the
Vastus Medialis and simultaneously decreased the control to the Vastus Lateralis.
The findings suggest the tape provides feedback to the nervous system, which in

224
turn modifies the controlled firing of motor units possibly by exciting the VM and
inhibiting the VL.
- The psychosocial features should be considered in the clinical decision and
management, as these findings show that the majority of PFP patients consciously
control their movements and is an important contribution towards movement
control.
- The presentation of PFP and non-symptomatic subjects and their responses to a
taping intervention appear to be individualistic and variable. At this time
phenotypes of motor control and responses cannot be established, but it is clear that
the sensory-motor control system offers a portfolio of strategies. Management and
treatment should consider the presentation and response of each individual subject.
As with all clinically orientated research the clinical significance should be contextualised with
the Minimal Clinical Important Differences (MCID) in mind where possible, and
understanding the justification if an observed change is clinically significant or could be
masked by measurement error, reliability or variability. As the thesis presents new and novel
techniques at exploring the neuromuscular system the MCID’s have are still debatable, within
this work the clinically significant changes were framed within a percentage change (see
sections 7.8 and 9.10) and differing criteria depending on the outcome variable. The study
design being a combination or biomechanical, neuromuscular and clinical measures allows a
fuller description of the behaviour but also confidence in changes observed.
225
11.3 Research Limitations
As with all research there are limitations that need to be announced and considered, and
importantly how these were minimised and can be improved in future works. The study
counteracted many of the potential limitations by performing a rigorous literature review and
a host of complimentary pilot studies, yet some variables could not be controlled.
Static Task: The goal of the research was to explore the sensory-motor control processes and
their response to a taping intervention, to do which a task that could challenge the stability of
the knee joint needed to be used. One of the key limitations is that the task required to be
isometric due to the surface EMG decomposition technology unable to resolve the complexities
of an EMG signal during dynamic movements. The study used a single limb isometric task that
was found to be sufficiently challenging to the subjects whilst at the same time abiding by the
limitations of the surface EMG decomposition system. However, this limits the application of
the findings of the work to static isometric movements rather than the dynamic, concentric and
eccentric, movements that are more functionally placed in normal daily activities and causes
of PFP. Future work will be able to make use of the technological evolutions of the surface
EMG decomposition technology that will be upon us in the near future. But it should not be
forgotten that the static task provides us with a grounding of work in understanding the change
in control that can be elicited during non-dynamic situations.
Algorithm based processing: Naturally a discussed limitation with advanced technologies is
the understanding and trust placed in their complex signal processing, whereby raw data is fed
into an algorithm that processes the data and automatically provides a data output. To
counteract arguments and suggestions of this as a limitation the researcher should ensure robust
and appropriate validation has been undertaken. The technology involved in decomposing the
surface EMG signal used within this project has been in development for over 20 years and has
a host of technical and application based publications to provide confidence in the data output.
Future research should still consider the accuracy and validation with these technologies and
understand their limitations, using them in the recommended and appropriate manner.
Subject numbers: The study abided by the calculated sample size with having 13 subjects in
each group and so was powered adequately, however as can be seen from the individual results
additional subject numbers could have assisted with the potential identification of sub-groups
with the sensory-motor control strategies. The volume of data collected from an individual

226
subject (500,000 data points) placed large time constraints on the data collection and processing
steps. It is hoped that future work can be more directed in the data processing steps by
eliminating the non-significant findings to make the analyses more targeted and reducing the
computation times or using new analysis tools that are being developed.
Intervention effects: The study was designed to evaluate the immediate changes to the subjects’
sensory-motor control behaviours, but we are unable to elicit whether the changes observed
have any effects are maintained after removal of the intervention or they have any longer term
benefits. Future work should establish whether the subjects’ are able to modify their movement
control after the removal of the tape and therefore make permanent alterations to the control
processes.
dEMG Reliability: There is currently no literature on the within-session or between-session
reliability of the surface EMG decomposition variables, nor did this work quantify the
reliability. Although anecdotal evidence suggests within and between session data provides
consistency in the reported outcome variables empirical evidence is needed. The results of the
thesis should be viewed with this point in mind.

227
11.4 Further Work
The findings from this work have shown tantalising insights into the sensory-motor control
system and its presentation within a Patellofemoral Pain subject group, which creates additional
avenues for future research.
11.4.1 Current Data Set
The data collection from this work produced a vast and rich set of data that was then segregated
for analyses and produced the findings of the thesis, however there remains a host of additional
data which may provide further insights into the current findings. A summary of the planned
exploration of the current data set is listed below:
- Explore the biomechanical control of the ankle and hip joints and its relationship to
the already established findings.
- Further explore the pilot study data (section 5.2) of the Vastus Medialis motor units
using two methods:
i) Determine the cross-correlation for both portions and whether there
may be any differences in common drive between the two portions of
the VM.
ii) Explore the single motor unit action potential (MUAP) shapes for
evidence of the same MUAP in the two portions.
- Determine the cross-correlation of the Vastus Medialis and Vastus Lateralis in
relation to the coronal and transverse plane knee moments in order to explore the
control of the motor units versus control of knee moment.
11.4.2 Future Directions
- The findings would suggest that the tape has a proprioceptive effect, therefore
exploring other proprioceptive orientated interventions such as neoprene sleeves,
knee braces and/or kinesiology tape may provide interesting and complimentary
insights.

228
- The longer term effects of the taping application could be explored to see whether
the sensory-motor control system can be re-educated.
- In combination with the above, the effects of differing rehabilitation protocols on
the sensory-motor control system could be explored.
- Although current work was specific to Patellofemoral Pain, the findings suggest
similar explorations would be applicable in other patient population groups such as
lower back pain or knee osteoarthritic in understanding the motor control and
response to clinical interventions.
- Technological advancements in surface EMG decomposition will soon provide the
ability to expand the application from isometric muscle contractions to include the
facility to decompose both concentric and eccentric muscle contractions. The
advent of these significant advancements will open up new possibilities to study the
sensory-motor control system in a dynamic situation and building upon the current
findings. Explicitly it would be possible to mimic the protocol from Selfe et al.
(2008 and 2011) in studying the stability challenging and functional step descent,
but with the key addition in being able to study the eccentric muscle behavioural
characteristics and its response to various therapeutic interventions.
- The future decomposition developments may also allow the investigation of other
high loading activities such as walking and running, perhaps even the possibility of
the measurements of more than two simultaneously recorded muscles and in real-
world environments.

229
11.5 Final Conclusions
This work, in addition to the main study, offered various insights and contributions to the
understanding of the motor control system and the application of novel methods, which could
be applicable to future work. A summary of the key contributions can be found below:
- Demonstrating empirical evidence that the Vastus Medialis should be treated as a
single functional unit instead of two differing portions through evidence of
comparable motor unit behaviour between the Obliquus and Longus portions of the
muscle.
- Providing evidence that surface EMG decomposition methods can, through careful
thought and consideration, be used in closed kinetic chain exercises rather than
previous work which have applied the decomposition methods to open kinetic chain
exercises.
- Presenting a method to normalise the motor unit pairing cross-correlation results to
provide an accurate and comparable representation of common drive.
- Relating the recruitment of motor units to a more sensitive physiological
measurement, knee joint moment, opposed to previous work where it has been
related to a gross measurement of force.
- Approaching Patellofemoral Pain with an inter-disciplinary approach by co-
investigating the biomechanical, neuromuscular and psychosocial features and their
response to a clinical intervention using advanced technologies.

230
12. Appendices
12.1 Appendix A – Individual Results
12.1.1 Omitted Data
Following the processing of the data set it was found that 5 subjects, 3 subjects from the non-
symptomatic subject group and 2 subjects from the symptomatic group, data did not meet the
criteria for motor unit quality as specified in motor unit selection section (4.3.3). The majority
of the accuracy values for the motor unit firings were found to be <90%. Consequently the
firing rate accuracy indicated that the motor units may not reflect the true behaviour of the
motor units and may skew the grouped analyses. The cause of the poor quality data was most
likely due to a change in the skin-electrode interface, such as the skin drying out.
12.1.2 Kinematic and Kinetic Results
Table 12-1 Kinematic and Kinetic results of the non-symptomatic subjects showing the
range of moment and range of motion in the coronal and transverse planes
Biomechanics
Non-symptomatic
Subjects
Coronal Plane Transverse Plane
Range of Moment Range of Motion Range of Moment Range of Motion
Subject 1 0.36 -0.13 -0.84 0.13
Subject 2 -0.03 0.29 -0.70 -0.19
Subject 3 0.42 0.37 0.26 -0.10
Subject 4 2.0 0.36 0.32 0.75
Subject 5 -2.35 -0.24 -0.85 0.18
Subject 6 2.14 -0.06 0.21 0.01
Subject 7 -0.78 -0.30 -0.60 -0.26
Subject 8 -3.50 0.13 -3.61 -0.14
Subject 9 -1.66 0.43 -0.98 0.13
Subject 10 -3.20 -0.48 -2.42 -0.72
Subject 11 -1.14 -0.18 -3.81 0.50
Subject 12 0.49 0.07 -0.31 0.38
Subject 13 -0.91 0.41 -1.52 -0.11

231
Table 12-2 Kinematic and Kinetic results of the symptomatic subjects showing the range
of moment and range of motion in the coronal and transverse planes
Biomechanics
Symptomatic
Subjects
Coronal Plane Transverse Plane
Range of Moment Range of Motion Range of Moment Range of Motion
PFP 1 -0.01 -0.08 -0.03 -0.54
PFP 2 -0.02 -0.06 -0.02 -0.28
PFP 3 0.01 0.71 0.01 0.02
PFP 4 0.06 -0.19 0.01 1.20
PFP 5 0.02 -0.44 -0.01 -0.50
PFP 6 -0.02 0.40 -0.01 0.58
PFP 7 0.00 -0.38 -0.01 -0.45
PFP 8 0.74 -0.13 0.77 0.10
PFP 9 -0.04 -0.17 -0.02 -0.64
PFP 10 -0.07 -0.03
PFP 11 0.01 -0.72 -0.02 -0.73
PFP 12 -0.02 -0.62 0.00 1.24
PFP 13 0.00 -0.35 -0.05 0.93
12.1.3 Surface EMG Results
Table 12-3 sEMG results from the non-symptomatic subjects showing the mean
difference % MVC values for each subject.
sEMG
Non-symptomatic
Subjects
Mean Difference (% MVC)
Gastrocnemius Bicep Femoris Rectus Femoris Gluteus Medius
Subject 1 - 16.1 - 6.8 - 4.0 - 1.7
Subject 2 - 0.5 - 3.3 - 2.3 - 3.5
Subject 3 0.5 5.4 4.5 0.1
Subject 4 0.5 5.9 9.9
Subject 5 1.0 3.0 4.7
Subject 6 - 1.0 - 7.4 - 4.9 - 23.0
Subject 7 - 6.3 - 0.9 - 3.9 - 6.3
Subject 8 9.7 1.8 3.2 - 9.1
Subject 9
Subject 10 20.7 - 6.2 - 6.2 - 2.7
Subject 11 - 5.2 - 4.0 - 4.7 - 15.1
Subject 12 - 1.7 4.6 5.8 4.0
Subject 13 - 3.4 - 8.2 - 4.4 - 5.7

232
Table 12-4 sEMG results from the symptomatic subjects showing the mean difference %
MVC values for each subject.
sEMG
Symptomatic
Subjects
Mean Difference (% MVC)
Gastrocnemius Bicep Femoris Rectus Femoris Gluteus Medius
PFP 1 - 1.9 0.4 - 0.7 - 0.7
PFP 2 2.7 - 6.1 - 2.5 - 3.1
PFP 3 2.0 - 1.8 0.0 0.4
PFP 4 0.7 - 0.5 - 1.0 3.1
PFP 5 0.4 - 2.9 0.4 - 2.7
PFP 6 2.0 - 6.5 - 1.6 - 0.6
PFP 7 - 1.3 - 1.3 1.9 1.4
PFP 8 2.7 - 3.2 - 3.5 - 2.3
PFP 9 - 1.2 3.5 2.3 0.5
PFP 10 - 1.5 - 5.0 5.0 - 5.0
PFP 11 1.1 - 3.1 - 5.9 - 0.3
PFP 12 1.1 8.3 - 3.1
PFP 13 - 2.6 - 3.2 - 7.7 - 4.2

233
12.1.4 Mean Firing Rate Results
Table 12-5 Mean Firing Rate for the Vastus Medialis and Vastus Lateralis in the tape
and no tape condition for non-symptomatic subjects
Mean Firing Rate
Non-symptomatic
Subjects
Average MFR (pps)
SD
VM No Tape VM Tape VL No Tape VL Tape
Subject 01 22.9
(3.3) 26
(3.3) 25.1
(4.2) 25.3
(2.9)
Subject 02 18.2
(2.4) 18.3
(2.6) 18.4
(2.4) 17.1
(2.5)
Subject 03 15.1
(2.1) 14.3
(2.9) 17.4
(3.2) 16
(3.9)
Subject 04 17.6
(2.5) 21.7
(3.2) 16.8
(4.1) 15.4
(3.6)
Subject 05 15.6
(2.5) 16.8
(2.1) 20.6
(2.8) 19.7
(2.4)
Subject 06 13.1
(3.1) 16.9
(4.7) 14.7
(2.5) 14.2
(2.5)
Subject 07 16.4
(3.9) 16
(4.2) 16.7
(3.5) 18.4
(2.9)
Subject 08 18.3
(3.3) 14.8
(4) 17.7
(2.9) 14.9
(4.6)
Subject 09 18.5
(5.1) 21
(5.3) 19.8
(2.3) 20.1
(2.6)
Subject 10 15.7
(3.1) 18.7
(3.3) 16.3
(3.2) 14.6
(2.4)
Subject 11 24
(5.4) 24.1
(5.2) 16.4
(2.6) 15.4
(2.7)
Subject 12 14
(1.9) 16.3
(2.6) 18.3
(2.6) 19.8
(2.7)
Subject 13 20.1
(3.7) 18.3
(3.5) 20
(3.1) 19.3
(3.5)

234
Table 12-6 Mean Firing Rate for the Vastus Medialis and Vastus Lateralis in the tape
and no tape condition for symptomatic subjects
Mean Firing Rate
Symptomatic Subjects
Average MFR (pps)
SD
VM No Tape VM Tape VL No Tape VL Tape
PFP 01 19.1
(2.5) 17.2
(2.5) 24.1
(3.6) 25.3
(2.8)
PFP 02 20.5
(3.3) 21.5
(2.9) 19.9
(3.2) 19.4
(2.7)
PFP 03 13.6
(1.7) 12.1
(2) 13.5
(1.9) 14.9
(1.9)
PFP 04 19.4
(4.9) 22.6
(4.9) 15.6
(3.6) 17.1
(3.5)
PFP 05 19.6
(4.2) 20.1
(3.4) 23.9
(3.4) 23.4
(3.2)
PFP 06 12.3
(2.4) 21.2
(3.6) 15.6
(2.5) 15.2
(2.4)
PFP 07 14.1
(4.2) 14.9
(3.8) 15.7
(2.5) 14.5
(3.2)
PFP 08 18.4
(1.9) 20.5
(2.9) 22.1
(2.5) 20.2
(2.9)
PFP 09 17.3
(2.9) 14.6
(2.4) 20.3
(2.9) 16.7
(3.8)
PFP 10 17.4
(4.9) 19
(4.7) 18.9
(3.6) 19.7
(4.4)
PFP 11 15.9
(2.4) 17.6
(3.8) 15.9
(2.7) 14.9
(2.7)
PFP 12 20.1
(5.9) 14
(4.5) 14.5
(4.2) 11.1
(2.6)
PFP 13 20.1
(5.3) 21.9
(3.4) 25
(3.4) 26
(2.9)

235
12.1.5 Cross–Correlation Results
Table 12-7 Cross-correlation results for the Vastus Medialis and Vastus Lateralis in the
tape and no tape condition for non-symptomatic subjects
Cross-Correlation
Non-symptomatic
Subjects
VM_NO_TAPE VM_TAPE VL_NO_TAPE VL_TAPE
Subject 01 0.50
(0.31-0.63)
0.46
(0.31-0.63)
0.45
(0.27-0.64)
0.45
(0.27-0.61)
Subject 02 0.43
(0.28-0.60)
0.39
(0.24-0.55)
0.43
(0.30-0.56)
0.41
(0.26-0.56)
Subject 03 0.46
(0.26-0.62)
0.42
(0.26-0.53)
0.44
(0.29-0.61)
0.40
(0.24-0.54)
Subject 04 0.41
(0.26-0.55)
0.48
(0.29-0.60)
0.38
(0.26-0.54)
0.40
(0.25-0.57)
Subject 05 0.42
(0.24-0.59)
0.36
(0.23-0.51)
0.39
(0.24-0.54)
0.43
(0.27-0.56)
Subject 06 0.36
(0.27-0.52
0.39
(0.21-0.55)
0.37
(0.23-0.54)
0.41
(0.26-0.54)
Subject 07 0.37
(0.22-0.51)
0.36
(0.22-0.52)
0.42
(0.25-0.57)
0.39
(0.24-0.57)
Subject 08 0.43
(0.28-0.55)
0.42
(0.25-0.55)
0.37
(0.22-0.49)
0.47
(0.32-0.60)
Subject 09 0.40
(0.23-0.53)
0.40
(0.23-0.57)
0.44
(0.31-0.56)
0.39
(0.23-0.53)
Subject 10 0.43
(0.27-0.60)
0.39
(0.23-0.54)
0.39
(0.25-0.55)
0.39
(0.23-0.54)
Subject 11 0.42
(0.25-0.53)
0.38
(0.23-0.53)
0.41
(0.25-0.55)
0.40
(0.26-0.55)
Subject 12 0.39
(0.26-0.56)
0.46
(0.31-0.61)
0.41
(0.27-0.53)
0.43
(0.30-0.60)
Subject 13 0.43
(0.27-0.56)
0.45
(0.29-0.59)
0.40
(0.24-0.56)
0.44
(0.29-0.58)

236
Table 12-8 Cross-correlation results for the Vastus Medialis and Vastus Lateralis in the
tape and no tape condition for symptomatic subjects
Cross-Correlation
Symptomatic
Subjects
VM_NO_TAPE VM_TAPE VL_NO_TAPE VL_TAPE
PFP 01 0.42
(0.29-0.58) 0.45
(0.30-0.58) 0.40
(0.25-0.55) 0.41
(0.26-0.57)
PFP 02 0.39
(0.20-0.53) 0.37
(0.19-0.52) 0.37
(0.21-0.52) 0.39
(0.21-0.52)
PFP 03 0.37
(0.25-0.53) 0.38
(0.25-0.52) 0.45
(0.29-0.60) 0.40
(0.23-0.56)
PFP 04 0.38
(0.23-0.57) 0.40
(0.27-0.55) 0.43
(0.26-0.55) 0.39
(0.23-0.51)
PFP 05 0.42
(0.28-0.56) 0.41
(0.29-0.56) 0.52
(0.34-0.66) 0.42
(0.27-0.55)
PFP 06 0.41
(0.23-0.57) 0.37
(0.23-0.52) 0.44
(0.29-0.56) 0.41
(0.27-0.57)
PFP 07 0.38
(0.24-0.53) 0.34
(0.18-0.53) 0.38
(0.21-0.50) 0.38
(0.22-0.53)
PFP 08 0.44
(0.27-0.56) 0.39
(0.25-0.55) 0.43
(0.28-0.57) 0.40
(0.29-0.55)
PFP 09 0.41
(0.28-0.54) 0.43
(0.28-0.61) 0.40
(0.31-0.52) 0.42
(0.23-0.56)
PFP 10 0.45
(0.22-0.59) 0.43
(0.27-0.56) 0.47
(0.30-0.62) 0.41
(0.24-0.57)
PFP 11 0.39
(0.25-0.51) 0.47
(0.28-0.60) 0.41
(0.25-0.55) 0.43
(0.26-0.58)
PFP 12 0.41
(0.26-0.56) 0.44
(0.28-0.56) 0.38
(0.28-0.57) 0.38
(0.29-0.65)
PFP 13 0.32
(0.19-0.50) 0.42
(0.26-0.55) 0.38
(0.21-0.52) 0.39
(0.21-0.57)

237
12.1.6 Recruitment Threshold Results
Table 12-9 Recruitment Threshold results for the Vastus Medialis and Vastus Lateralis
showing comparison regression lines with their intercept and slope values for non-
symptomatic subjects
Recruitment Threshold
Non-symptomatic
Subjects
Vastus Medialis
Vastus Lateralis
Intercept Slope Intercept Slope
Value p-
value Value p-value Value
p-
value Value p-value
Subject 1 3.23 <0.001 -0.06 0.21 0.81 0.54 0.02 0.81
Subject 2 -0.19 0.79 0.07 0.81 0.08 0.88 -0.08 <0.001
Subject 3 1.12 0.13 -0.03 0.33 0.07 0.89 0.08 <0.001
Subject 4 4.24 <0.001 -0.05 <0.05 -0.77 0.38 -0.04 0.20
Subject 5 4.85 <0.001 -0.11 <0.05 -1.64 <0.001 0.15 <0.001
Subject 6 10.15 <0.001 -0.11 <0.001 -1.01 0.88 -0.00 0.99
Subject 7 2.4 <0.001 -0.03 0.09 3.78 <0.001 -0.04 <0.05
Subject 8 -2.83 0.07 -0.10 0.23 -4.92 <0.001 0.11 <0.05
Subject 9 -5.68 <0.001 0.11 <0.001 0.06 0.93 0.08 <0.05
Subject 10 -0.33 0.68 0.05 <0.05 -2.96 <0.001 0.03 0.09
Subject 11 -1.89 0.09 -0.14 0.08 -1.69 <0.001 0.024 <0.05
Subject 12 4.67 <0.001 -0.04 0.29 0.39 0.66 0.08 <0.05
Subject 13 -1.32 0.26 0.01 0.78 2.76 0.062 -0.17 <0.001

238
Table 12-10 Recruitment Threshold results for the Vastus Medialis and Vastus Lateralis
showing comparison regression lines with their intercept and slope values for
symptomatic subjects
Recruitment Threshold
Symptomatic Subjects
Vastus Medialis
Vastus Lateralis
Intercept Slope Intercept Slope
Value p-
value Value p-value Value p-value Value p-value
PFP 1 2.07 0.10 -0.21 <0.001 -0.84 0.18 0.10 <0.05
PFP 2 0.57 0.48 -0.06 0.17 -1.39 0.09 -0.05 0.33
PFP 3 -0.57 0.31 -0.03 0.19 3.16 <0.001 -0.05 <0.001
PFP 4 -0.73 0.36 0.02 0.24 1.73 <0.05 -0.01 0.34
PFP 5 -0.94 0.05 0.00 0.99 0.04 0.94 -0.06 <0.05
PFP 6 11.20 <0.001 -0.34 <0.001 -1.73 <0.05 0.04 <0.05
PFP 7 -0.83 0.38 0.02 0.19 1.53 <0.05 0.02 0.33
PFP 8 3.01 <0.001 0.06 <0.05 -2.10 <0.001 0.20 <0.001
PFP 9 -3.6 <0.001 0.07 <0.05 -1.73 <0.05 0.00 0.99
PFP 10 3.05 <0.001 0.01 0.53 -1.98 <0.05 0.04 <0.05
PFP 11 0.93 0.21 0.00 0.99 -2.80 <0.001 0.18 <0.05
PFP 12 -8.12 <0.001 0.05 <0.05 -2.01 0.10 -0.12 0.50
PFP 13 7.47 0.07 -0.08 0.14 1.39 0.38 -0.02 0.27

239
12.1.7 Recruitment Operating Point Results
Table 12-11 Recruitment operating point results for the Vastus Medialis and Vastus
Lateralis showing the percentage at which the first motor units were recruited for the
non-symptomatic subjects
Recruitment
Operating Point
Non-Symptomatic Subjects
Vastus Medialis Vastus Lateralis
No Tape
(% Force)
Tape
(% Force)
No Tape
(% Force)
Tape
(% Force)
Subject 1 3.07 3.61 3.94 6.23
Subject 2 12.34 12.06 10.13 7.02
Subject 3 9.91 10.44 4.02 7.39
Subject 4 0.43 8.22 1.12 4.01
Subject 5 7.52 17.12 4.28 9.8
Subject 6 12.87 17.73 17.03 4.65
Subject 7 8.64 11.7 6.14 5.69
Subject 8 11.57 10.17 7.34 9.75
Subject 9 16.17 5.83 6.67 12.19
Subject 10 18.45 13.54 10.37 10.28
Subject 11 4.87 4.34 4.68 6.82
Subject 12 3.89 8.21 11.97 9.26
Subject 13 7.13 9.15 10.18 11.96

240
Table 12-12 Recruitment operating point results for the Vastus Medialis and Vastus
Lateralis showing the percentage at which the first motor units were recruited for the
symptomatic subjects
Recruitment
Operating Point
Symptomatic Subjects
Vastus Medialis Vastus Lateralis
No Tape
(% Force)
Tape
(% Force)
No Tape
(% Force)
Tape
(% Force)
PFP 1 17.94 8.43 6.24 5.16
PFP 2 9.65 5.4 7.17 3.42
PFP 3 8.4 6.64 8.83 9.45
PFP 4 22.81 18.78 15.36 17.76
PFP 5 4.56 4.13 2.37 4.9
PFP 6 10.74 11.95 8.8 11.27
PFP 7 19.96 22.41 10.5 18.08
PFP 8 3.54 7.94 2.85 5.56
PFP 9 2.11 4.13 4.46 4.91
PFP 10 9.36 7.05 10.81 3.46
PFP 11 2.29 2.87 3.37 3.46
PFP 12 12.84 10.71 12.63 21.39
PFP 13 77.85 57.16 55.64 40.72

241
12.1.8 Movement Specific Reinvestment Scale Results
Table 12-13 Results from the Movement Specific Reinvestment Scale (MSRS) for the
movement self-consciousness and conscious motor processing
MSRS
Symptomatic Subjects
Factor 1
Movement Self-Consciousness
Factor 2
Conscious Motor Processing
Subject 1
Subject 2 16 24
Subject 3 16 28
Subject 4 20 22
Subject 5 5 14
Subject 6 7 11
Subject 7 11 21
Subject 8 10 21
Subject 9 12 13
Subject 10 5 5
Subject 11 8 22
Subject 12 17 26
Subject 13 9 19
12.1.9 Numerical Rating Scale
Table 12-14 Numerical Rating Scale results from symptomatic subjects
NPRS
Symptomatic Subjects Pain Rating
Subject 1
Subject 2 7
Subject 3 5
Subject 4 2
Subject 5 3
Subject 6 3
Subject 7 1
Subject 8 7
Subject 9 4
Subject 10 6
Subject 11 6
Subject 12 3
Subject 13 3

242
12.2 Appendix B – Patient Information Sheet

243

244

245

246

247
12.3 Appendix C – Consent Form

248
12.4 Appendix D – Patellofemoral Pain Questionnaires

249

250
12.5 Appendix E – Ethical Approval

251
12.5.1 University of Central Lancashire – Non-symptomatic Subjects

252
12.5.2 University of Central Lancashire – Symptomatic Subject

253
12.5.3 National Research Ethics Service

254

255
12.5.4 NHS Research & Development Permission

256

257
13. References
Acton, D. & Craig, D., 2000. Should I scan or should I scope? The Knee, 7(4), pp.245–248.
Adam, A. & De Luca, C.J., 2003. Recruitment order of motor units in human vastus lateralis
muscle is maintained during fatiguing contractions. Journal of neurophysiology, 90(5),
pp.2919–27.
Adam, A., De Luca, C.J. & Erim, Z., 1998. Hand Dominance and Motor Unit Firing
Behavior Hand Dominance and Motor Unit Firing Behavior. Journal of
neurophysiology, 80, pp.1373–1382.
Aglietti, P., Insall, J. & Cerulli, G., 1983. Patellar pain and incongruence. I: Measurements of
incongruence. Clinical Orthopaedics and Related Research, 176, pp.217–24.
Aglietti, P. & Menchetti, P., 1995. Biomechanics of the patellofemoral joint. In G. Scuderi,
ed. The Patella. New York: Spinger Wein, pp. 25–48.
Ahmed, A. & Burke, D., 1987. Force analysis of the patellar mechanism. Journal of
orthopaedic research, 5, pp.69–85.
Albertus-Kajee, Y. et al., 2011. Alternative methods of normalising EMG during running.
Journal of Electromyography and Kinesiology, 21(4), pp.579–86.
Alexander, C., Stynes, S. & Thomas, A., 2003. Does tape facilitate or inhibit the lower fibres
of trapezius? Manual therapy, 8, pp.37–41.
Aminaka, N. et al., 2011. Patellofemoral pain syndrome alters neuromuscular control and
kinetics during stair ambulation. Journal of electromyography and kinesiology, 21(4),
pp.645–51.
Andriacchi, T.P. et al., 1984. A study of factors influencing muscle activity about the knee
joint. Journal of orthopaedic research, 1(3), pp.266–75.
Antonsson, E.K. & Mann, R.W., 1985. The Frequency Content of Gait. Journal of
biomechanics, 18(I), pp.39–47.
Barton, C.J. et al., 2013. Gluteal muscle activity and patellofemoral pain syndrome : a
systematic review. British journal of sports medicine, 47, pp.207–214.
Basmajian, J. & De Luca, C.J., 1985. Muscles alive 5th ed., Balitmore, MD: Williams and
Wilkins.
Beck, T.W. et al., 2011. Effects of resistance training on force steadiness and common drive.
Muscle & nerve, 43(2), pp.245–50.

258
Bell, A., Pedersen, D. & Brand, R., 1990. A comparison of the accuracy of several hip center
location prediction methods. Journal of biomechanics, (November), pp.0–4.
Biedert, R.M. & Gruhl, C., 1997. Axial computed tomography of the patellofemoral joint
with and without quadriceps contraction. Archives of orthopaedic and trauma surgery,
116(1-2), pp.77–82.
Bockrath, K. et al., 1993. Effects of patella taping on patella position and perceived pain.
Medicine and science in sports and exercise, 25(9), pp.989–92.
Bolgla, L.A. & Boling, M.C., 2011. An update for the conservative management of
patellofemoral pain syndrome: A systemic review of the literature from 2000 to 2010.
The International Journal of Sports Physical Therapy, 6(2), pp.112–125.
Boling, M. & Padua, D., 2010. Gender differences in the incidence and prevalence of
patellofemoral pain syndrome. Scand. Journal Med Science Sports, 20(5), pp.725–730.
Boling, M., Padua, D. & Marshall, S., 2009. A prospective investigation of biomechanical
risk factors for patellofemoral pain syndrome: the Joint Undertaking to Monitor and
Prevent ACL Injury (JUMP-ACL) cohort. American Journal of Sports Medicine,
37(2108-16).
Boling, M.C. et al., 2009. A Prospective Investigation of Biomechanical Risk Factors for
Patellofemoral Pain Syndrome The Joint Undertaking to Monitor and Prevent ACL
Injury (JUMP-ACL). The American journal of sports medicine, 37(11), pp.2108–2116.
Bowyer, D. et al., 2008. The vastus medialis oblique:vastus lateralis electromyographic
intensity ratio does not differ by gender in young participants without knee pathology.
Physiotherapy, 94(2), pp.168–173.
Brechter, J. & Powers, C., 2002. Patellofemoral joint stress during stair ascent and descent in
persons with and without patellofemoral pain. Gait & posture, 16(2), pp.115–23.
Bremner, F.D., Baker, J.R. & Stephens, J.A., 1991. Correlation between the discharges of
motor units recorded from the same and from different finger muscles in man. The
Journal of Physiology , 432 (1 ), pp.355–380.
Burden, A., 2010. How should we normalize electromyograms obtained from healthy
participants? What we have learned from over 25years of research. Journal of
Electromyography and Kinesiology, 20(6), pp.1023–1035.
Burke, R., 1981. Motor units: anatomy, physiology and functional organisation. In Handbook
of physiology the nervous sytem motor control. Bethesda, MD: V.B. Brooks, pp. 345–
422.
Burke, R.E., 2007. Sir Charles Sherrington’s the integrative action of the nervous system: a
centenary appreciation. Brain, 130(Pt 4), pp.887–94.
Callaghan, M. et al., 2002. The effects of patellar taping on knee joint proprioception.
Journal of athletic training, 37(1), pp.19–24.

259
Callaghan, M.J. et al., 2012. Effects of patellar taping on brain activity during knee joint
proprioception tests using functional magnetic resonance imaging. Physical therapy,
92(6), pp.821–30.
Callaghan, M.J. & Selfe, J., 2007. Has the incidence or prevalence of patellofemoral pain in
the general population in the United Kingdom been properly evaluated? Physical
Therapy in Sport, 8(1), pp.37–43.
Cappozzo, a et al., 1995. Position and orientation in space of bones during movement:
anatomical frame definition and determination. Clinical biomechanics, 10(4), pp.171–
178.
Cappozzo, A. et al., 2005. Human movement analysis using stereophotogrammetry. Part 1:
theoretical background. Gait & posture, 21(2), pp.186–96.
Carlsoo, S., Fohlin, L. & Skiglund, G., 1973. Studies of Co-contraction of knee muscles. In
New Developments in Electromyography and Clinical Neurophysiology. Basel: Karger,
pp. 648–655.
Cavazzuti, L. et al., 2010. Delayed onset of electromyographic activity of vastus medialis
obliquus relative to vastus lateralis in subjects with patellofemoral pain syndrome. Gait
& posture, 32(3), pp.290–5.
Chang, S.-S., De Luca, C.J. & Nawab, S., 2008. Aliasing rejection in Precision
Decomposition of EMG signals. In IEEE EMBS Conference. pp. 4972–5.
Chapman, A., Vicenzino, B. & Blanch, P., 2010. Intramuscular fine-wire electromyography
during cycling: repeatability, normalisation and a comparison to surface
electromyography. Journal of Electromyography and Kinesiology, 20(1), pp.108–117.
Chester, R. et al., 2008. The relative timing of VMO and VL in the aetiology of anterior knee
pain: a systematic review and meta-analysis. BMC musculoskeletal disorders, 9, p.64.
Christou, E. a, 2004. Patellar taping increases vastus medialis oblique activity in the presence
of patellofemoral pain. Journal of electromyography and kinesiology, 14(4), pp.495–
504.
Citaker, S. et al., 2011. Static balance in patients with patellofemoral pain syndrome. Sports
health, 3(6), pp.524–7.
Clément, J. et al., 2014. Comparison of quasi-static and dynamic squats: A three-dimensional
kinematic, kinetic and electromyographic study of the lower limbs. Gait & posture.
Contessa, P., Adam, A. & Luca, C.J. De, Motor Unit Control and Force Fluctuation during
Fatigue. , p.50111.
Cook, C. et al., 2012. Best tests/clinical findings for screening and diagnosis of
patellofemoral pain syndrome: a systematic review. Physiotherapy, 98(2), pp.93–100.

260
Cook, C. et al., 2010. Diagnostic accuracy and association to disability of clinical test
findings associated with patellofemoral pain syndrome. Physiotherapy Canada, 62(1),
pp.17–24.
Cools, A., Witvrouw, E. & Danneels, L., 2002. Does taping influence electromyographic
muscle activity in the scapular rotators in healthy shoulders ? Manual therapy, 7,
pp.154–162.
Costigan, P., Deluzio, K. & Wyss, U., 2002. Knee and hip kinetics during normal stair
climbing. Gait & posture, 16, pp.31–37.
Cowan, S. et al., 2001. Delayed onset of electromyographic activity of vastus medialis
obliquus relative to vastus lateralis in subjects with patellofemoral pain syndrome.
Archives of Physical Medicine and Rehabilitation, 82(2), pp.183–189.
Cowan, S.M., Bennell, K.L. & Hodges, P.W., 2000. The test–retest reliability of the onset of
concentric and eccentric vastus medialis obliquus and vastus lateralis electromyographic
activity in a stair stepping task. Physical Therapy in Sport, 1(4), pp.129–136.
Cowan, S.M., Bennell, K.L. & Hodges, P.W., 2002. Therapeutic patellar taping changes the
timing of vasti muscle activation in people with patellofemoral pain syndrome. Clinical
journal of sport medicine, 12(6), pp.339–47.
Cowan, S.M. & Crossley, K.M., 2009. Does gender influence neuromotor control of the knee
and hip? Journal of electromyography and kinesiology, 19(2), pp.276–82.
Crossley, K. et al., 2001. A systematic review of physical interventions for patellofemoral
pain syndrome. Clinical journal of sport medicine, 11(2), pp.103–10.
Crossley, K. et al., 2000. Patellar taping: is clinical success supported by scientific evidence?
Manual therapy, 5(3), pp.142–50.
Crossley, K. et al., 2002. Physical Therapy for Patellofemoral Pain A Randomized, Double-
Blinded, Placebo-Controlled Trial. The American journal of sports medicine, 30(6),
pp.857–865.
Crossley, K.M. et al., 2004. Knee flexion during stair ambulation is altered in individuals
with patellofemoral pain. Journal of orthopaedic research, 22(2), pp.267–74.
Dallal, G., 2013. www.randomization.com. Available at: Randomization.com [Accessed
January 1, 2012].
DeHaven, K. & Lintner, D., 1986. Athletic injuries: comparison by age, sport, and gender.
American Journal of Sports Medicine, 14(3), pp.218–24.
Derasari, A. et al., 2010. McConnell taping shifts the patella inferiorly in patients with
patellofemoral pain: a dynamic magnetic resonance imaging study. Physical therapy,
90(3), pp.411–9.

261
Descartes, R., 1662. L’homme et un traitté de la formation du foetus du mesme autheur,
Paris: C Angot.
Devereaux, M. & Lachmann, S., 1984. Patello-femoral arthralgia in athletes attending a
Sports Injury Clinic. British journal of sports medicine, 18(1), pp.18–21.
Dillon, P.Z., Updyke, W.F. & Allen, W.C., 1983. Gait analysis with reference to
chondromalacia patellae. The Journal of orthopaedic and sports physical therapy, 5(3),
pp.127–31.
Dixon, J. & Howe, T.E., 2007. Activation of vastus medialis oblique is not delayed in
patients with osteoarthritis of the knee compared to asymptomatic participants during
open kinetic chain activities. Manual therapy, 12(3), pp.219–25.
Dye, S.F., 2005. The Pathophysiology of Patellofemoral Pain. Clinical Orthopaedics and
Related Research, &NA;(436), pp.100–110.
Dye, S.F. & Vaupel, G., 1994. The pathophysiology of patellofemoral pain. Medicine and
Arthroscopy Review, 2(3), pp.203–10.
Erim, Z. et al., 1999. Effects of aging on motor-unit control properties. Journal of
neurophysiology, 82(5), pp.2081–91.
Farina, D. & Enoka, R.M., 2011. Surface EMG decomposition requires an appropriate
validation. Journal of neurophysiology, 105(2), pp.981–2; author reply 983–4.
Ferrari, D., Kuriki, H. & Silva, C., 2014. Diagnostic Accuracy of the Electromyography
Parameters Associated With Anterior Knee Pain in the Diagnosis of Patellofemoral Pain
Syndrome. Archives of Physical Medicine and Rehabilitation, 95(8), pp.1521–6.
Ficat, P. & Hungerford, D., 1977. Disorders of the Patello-femoral Joint, Williams and
Wilkins.
Fukuda, T., Rossetto, F. & E, M., 2010. Short-term effects of hip abductors and lateral
rotators strengthening in females with patellofemoral pain syndrome: a randomized
controlled clinical trial. Journal of orthop sports phys ther, 40, pp.736–42.
Fulkerson, J., 2004. Disorders of the Patellofemoral Joint 4th ed., Lippincott Williams and
Wilkins.
Fulkerson, J. & Shea, K., 1990. Disorders of patellofemoral alignment. The Journal of Bone
& Joint Surgery, 72(9), pp.1424–1429.
Galtier, B., Buillot, M. & Vanneuville, G., 1995. Anatomical basis of the role of vastus
medialis muscle in femoro-patellar degenerative arthropathy. Surgical and Radiologic
Anatomy, 17(1), pp.7–11.
Garland, S.J. & Miles, T.S., 1997. Control of motor units in human flexor digitorum
profundus under different proprioceptive conditions. The Journal of physiology, 502 ( Pt
3, pp.693–701.

262
Garnett, R. & Stephens, J., 1981. Changes in the recruitment threshold of motor units
produced by cutaneous stimulation in man. The Journal of physiology, 311, pp.463–473.
Gill, H. & O’Connor, J., 1996. Biarticulating two-dimensional computer model of the human
patellofemoral joint. Clinical biomechanics, 11(2), pp.81–89.
Gilleard, W., McConnell, J. & Parsons, D., 1998. The effect of patellar taping on the onset of
vastus medialis obliquus and vastus lateralis muscle activity in persons with
patellofemoral pain. Physical therapy, 78(1), pp.25–32.
Grabiner, M., Koh, T. & Draganich, L., 1994. Neuromechanics of the patellofemoral joint.
Medicine and science in sports and exercise, 26(1), pp.10–21.
Grelsamer, R. et al., 2009. The patellofemoral syndrome; the same problem as the Loch Ness
Monster? The Knee, 16(5), pp.301–2.
Grelsamer, R.P., 2005. Patellar Nomenclature. Clinical Orthopaedics and Related Research,
&NA;(436), pp.60–65.
Grigg, P., 1994. Peripheral neural mechanisms in proprioception. Journal of Sports
Rehabilitation, 3, pp.2–17.
Haffajee, D., Moritz, U. & Svantesson, G., 1972. Isometric knee extension strength as a
function of joint angle, muscle length and motor unit activity. Acta orthopaedica
Scandinavica, 43(2), pp.138–47.
Haim, A. et al., 2006. Patellofemoral pain syndrome: validity of clinical and radiological
features. Clinical Orthopaedics and Related Research, 451, pp.223–238.
Halaki, M. & Ginn, K., 2012. Normalization of EMG Signals : To Normalize or Not to
Normalize and What to Normalize to ? In Computational Intelligence in
Electromyography Analysis - A Perspective on Current Applications and Future
Challenges.
Hargbarth, K.E., 1952. Excitatory and inhibitory skin areas for flexor and extensor
motoneurons. Acta Physiologica Scandinavica Supplementum, 26(94), pp.1–58.
Heino, J. & Powers, C., 2002. Patellofemoral stress during walking in persons with and
without patellofemoral pain. Medicine and science in sports and exercise, 34(10),
pp.1582–93.
Heit, E., Lephart, S. & Rozzi, S., 1996. The effect of ankle bracing and taping on joint
position sense in the stable ankle. Journal of Sports Rehabilitation, 5, pp.206–213.
Hermens, H.J.H. et al., 2000. Development of recommendations for SEMG sensors and
sensor placement procedures. Journal of Electromyography and Kinesiology, 10(5),
pp.361–374.

263
Herrington, L., Malloy, S. & Richards, J., 2005. The effect of patella taping on vastus
medialis oblique and vastus laterialis EMG activity and knee kinematic variables during
stair descent. Journal of electromyography and kinesiology, 15(6), pp.604–7.
Hodges, P. et al., 2013. New insight into motor adaptation to pain revealed by a combination
of modelling and empirical approaches. European Journal of Pain, 17, pp.1138–1146.
Hodges, P.W., 2011. Pain and motor control: From the laboratory to rehabilitation. Journal of
electromyography and kinesiology, 21(2), pp.220–8.
Hodges, P.W. & Tucker, K., 2011. Moving differently in pain: a new theory to explain the
adaptation to pain. Pain, 152(3 Suppl), pp.S90–8.
Holroyd, K. a et al., 1984. Change mechanisms in EMG biofeedback training: cognitive
changes underlying improvements in tension headache. Journal of consulting and
clinical psychology, 52(6), pp.1039–53.
Hu, X., Rymer, W.Z. & Suresh, N.L., 2013a. Assessment of validity of a high-yield surface
electromyogram decomposition. Journal of neuroengineering and rehabilitation, 10(1),
p.99.
Hu, X., Rymer, W.Z. & Suresh, N.L., 2013. Motor Unit Pool Organization Examined Via
Spike Triggered Averaging of the Surface Electromyogram. Journal of neurophysiology.
Hu, X., Rymer, W.Z. & Suresh, N.L., 2013b. Reliability of spike triggered averaging of the
surface electromyogram for motor unit action potential estimation. Muscle & nerve,
pp.1–42.
Insall, J., 1979. “Chondromalacia patellae”: patellar malalignment syndrome. The Orthopedic
Clinics of North America, 10(1), pp.117–127.
Javadpour, S.M., Finegan, P.J. & O’Brien, M., 1991. The Anatomy of the Extensor
Mechanism and its Clinical Relevance. Clinical Journal of Sport Medicine, 1(4), p.229.
Kamen, G., Greenstein, S.S. & De Luca, C.J., 1992. Lateral dominance and motor unit firing
behavior. Brain research, 576(1), pp.165–7.
Kannus, P. et al., 1987. Computerized recording of visits to an outpatient sports clinic.
American Journal of Sports Medicine, 15(1), pp.79–85.
Karamanidis, K. & Arampatzis, A., 2009. Evidence of mechanical load redistribution at the
knee joint in the elderly when ascending stairs and ramps. Annals of biomedical
engineering, 37(3), pp.467–76.
Karlsson, J. & Andreasson, G., 1992. The effect of external ankle support in chronic lateral
ankle joint instability: an electromyographic study. American Journal of Sports
Medicine1, 20, pp.257–26.

264
Karst, G. & Willett, G., 1995. Onset timing of electromyographic activity in the vastus
medialis oblique and vastus lateralis muscles in subjects with and without patellofemoral
pain syndrome. Physical therapy, 75, pp.813–23.
Kaya, D. et al., 2010. The effect of an exercise program in conjunction with short-period
patellar taping on pain, electromyogram activity, and muscle strength in patellofemoral
pain syndrome. Sports health, 2(5), pp.410–6.
Kim, W. et al., 2004. A new biomechanical model for the functional assessment of knee
osteoarthritis. The Knee, 11(3), pp.225–231.
Koenig, G., 1924. Mikroskipische Beobachtungen am Knorpelgewebe mit ultra-violettem
Licht. Physikalisch-medizinishen Gesellschaft zu Wurzburg, (49), pp.160–162.
Kowalk, D., Duncan, J. & Vaughan, C., 1996. Abduction-adduction moments at the knee
during stair ascent and descent. Journal of biomechanics, 29(3), pp.383–388.
Larsen, B. et al., 1995. Patellar taping: a radiographic examination of the medial glide
technique. American Journal of Sports Medicine, 23(4), pp.465–71.
Last, R., 1952. On the form and structure of muscles. Journal of Bone & Joint Surgery,
British Volume, 34B, pp.295–305.
Laurin, C. et al., 1978. The abnormal lateral patellofemoral angle: a diagnostic
roentgenographic sign of recurrent patellar subluxation. The Journal of Bone &
Joint Surgery, 60(1), pp.55–60.
Lee, S. & Cho, S., 2013. The effect of McConnell taping on vastus medialis and lateralis
activity during squatting in adults with patellofemoral pain syndrome. Journal of
exercise rehabilitation, 9(2), pp.326–330.
LeFever, R.S. & De Luca, C.J., 1982. A procedure for decomposing the myoelectric signal
into its constituent action potentials--Part I: Technique, theory, and implementation.
IEEE transactions on bio-medical engineering, 29(3), pp.149–57.
Lesser, V., Nawab, S. & Klassner, F., 1995. IPUS: an architecture for the integrated
processing and understanding of signals. Artificial Intelligence, 3702(94), pp.129–171.
Lethem, J. et al., 1983. Outline of a fear-avoidance model of exaggerated pain perception—I.
Behaviour research and therapy, 21(4), pp.401–408.
Lieb, F. & Perry, J., 1968. Quadriceps function. An anatomical and mechanical study using
amputated limbs. The Journal of bone and joint surgery. American volume, 50(8),
pp.1535–48.
Lin, F. et al., 2010. In vivo patellar tracking induced by individual quadriceps components in
individuals with patellofemoral pain. Journal of biomechanics, 43(2), pp.235–41.
Lindahl, O. & Movin, A., 1967. The mechanics of extension of the knee-joint. Acta
orthopaedica Scandinavica, 38, pp.226–234.

265
De Luca, C., Roy, S. & Adam, A., 2003. Microgravity induced changes in the control of
motor units. In USRA Bioastronautics Investigators Workshop. Galveston, TX.
De Luca, C.J. et al., 1982. Control scheme governing concurrently active human motor units
during voluntary contractions. The Journal of physiology, 329, pp.129–142.
De Luca, C.J. et al., 2006. Decomposition of surface EMG signals. Journal of
neurophysiology, 96, pp.1646–1657.
De Luca, C.J. et al., 2010. Filtering the surface EMG signal: Movement artifact and baseline
noise contamination. Journal of biomechanics, 43(8), pp.1573–9.
De Luca, C.J. et al., 2012. Inter-electrode spacing of surface EMG sensors: reduction of
crosstalk contamination during voluntary contractions. Journal of biomechanics, 45(3),
pp.555–61.
De Luca, C.J. et al., 2009. Motor unit recruitment and proprioceptive feedback decrease the
common drive. Journal of neurophysiology, 101(3), pp.1620–8.
De Luca, C.J., 1997. The use of surface electromyography in biomechanics. Journal of
applied biomechanics, 13(2), pp.135–163.
De Luca, C.J. & Contessa, P., 2012. Hierarchical control of motor units in voluntary
contractions. Journal of neurophysiology, 107(1), pp.178–95.
De Luca, C.J. & Erim, Z., 2002. Common drive in motor units of a synergistic muscle pair.
Journal of neurophysiology, 87(4), pp.2200–4.
De Luca, C.J. & Erim, Z., 1994. Common drive of motor units in regulation of muscle force.
Trends in neurosciences, 17(7), pp.299–305.
De Luca, C.J. & Hostage, E.C., 2010. Relationship between firing rate and recruitment
threshold of motoneurons in voluntary isometric contractions. Journal of
neurophysiology, 104(2), pp.1034–46.
De Luca, C.J. & Mambrito, B., 1987. Voluntary control of motor units in human antagonist
muscles: coactivation and reciprocal activation. Journal of neurophysiology, 58(3),
pp.525–42.
De Luca, C.J. & Nawab, S.H., 2011. Reply to Farina and Enoka: The Reconstruct-and-Test
Approach Is the Most Appropriate Validation for Surface EMG Signal Decomposition
to Date. Journal of Neurophysiology, 105(2), pp.983–984.
De Luca, C.J., Roy, A. & Erim, Z., 1993. Synchronization of motor-unit firings in several
human muscles. Journal of neurophysiology, 70(5), pp.2010–23.
Lund, J. et al., 1991. The pain-adaptation model: a discussion of the relationship between
chronic musculoskeletal pain and motor activity. Canadian Journal of Physiology and
Pharamacology, 69(5), pp.683–94.

266
Lutz, G. et al., 1993. Comparison of tibiofemoral joint forces during open-kinetic-chain and
closed-kinetic-chain exercises. Journal Bone Joint Surgery, 75, pp.732–739.
MacGregor, K. et al., 2005. Cutaneous stimulation from patella tape causes a differential
increase in vasti muscle activity in people with patellofemoral pain. Journal of
orthopaedic research, 23(2), pp.351–8.
Makhsous, M. & Lin, F., 2004. In vivo and noninvasive load sharing among the vasti in
patellar malalignment. Medicine and science in sports and exercise, 36(10), pp.1768–75.
Mambrito, B. & Luca, C.J.D.E., 1984. A Technique for the Detection, Decomposition and
Analysis of the EMG Signal. Electroencephalography and Clinical Neurophysiology,
58, pp.175–188.
Mascal, C., Landel, R. & Powers, C., 2003. Management of patellofemoral pain targeting hip,
pelvis, and trunk muscle function: 2 case reports. Journal of orthop sports phys ther, 33,
pp.647–60.
Masters, R. & Maxwell, J., 2008. The Theory of Reinvestment. International Review of Sport
and Exercise Psychology, 1(2), pp.160–183.
Masuda, T., Miyano, H. & Sadoyama, T., 1985. A surface sensor array for detecting action
potential trains of single motor units. Electroencephalography Clinical
Neurophysiology, 60, pp.453 – 443.
McCarthy Persson, U., Fleming, H.F. & Caulfield, B., 2009. The effect of a vastus lateralis
tape on muscle activity during stair climbing. Manual therapy, 14(3), pp.330–7.
McConnell, J., 2013. Management of a difficult knee problem. Manual therapy, 18(3),
pp.258–63.
McConnell, J., 1986. The management of chondromalacia patellae: a long term solution. The
australian journal of physiotherapy, 32(4), pp.215–223.
McNally, E.G. et al., 2000. Assessment of patellar maltracking using combined static and
dynamic MRI. European Radiology, 10(7), pp.1051–1055.
McNulty, P., Turker, K. & Macefield, V., 1999. Evidence for strong synaptic coupling
between single tactile afferents and motoneurones supplying the human hand. Journal of
Physiology, 518, pp.883–93.
Mellor, R. & Hodges, P.W., 2005a. Motor unit synchronization is reduced in anterior knee
pain. The journal of pain, 6(8), pp.550–8.
Mellor, R. & Hodges, P.W., 2005b. Motor unit synchronization of the vasti muscles in closed
and open chain tasks. Archives of physical medicine and rehabilitation, 86(4), pp.716–
21.
Melzack, R., 1999. From the gate to the neuromatrix. Pain, Suppl 6, pp.S121–6.

267
Melzack, R., 2001. Pain and the neuromatrix in the brain. Journal of dental education,
65(12), pp.1378–82.
Melzack, R. & Wall, P., 1965. Pain mechanisms: a new theory. Science, 150(3699), pp.971–
9.
Merchant, A. et al., 1974. Roentgenographic Analysis of Patellofemoral Congruence. The
Journal of Bone & Joint Surgery, 56(7), pp.1391–1396.
Merletti, R., 1999. Standards for Reporting EMG Data. Journal of Electromyography and
Kinesiology, 9(1), pp.III–Iv.
Merskey, H. & Bogduk, N., 1994. Classification of Chronic Pain Second., Seattle, WA:
IASP Press.
Milgrom, C. et al., 1991. Patellofemoral pain caused by overactivity. A prospective study of
risk factors in infantry recruits. The Journal of Bone and Joint Surgery: American
Volume, 73(7), pp.1041–3.
Mok, N.W., Brauer, S.G. & Hodges, P.W., 2007. Failure to use movement in postural
strategies leads to increased spinal displacement in low back pain. Spine, 32(19),
pp.E537–43.
Morrish, G. & Woledge, R., 1997. A comparison of the activation of muscles moving the
patella in normal subjects and in patients with chronic patellofemoral problems.
Scandinavian Journal of Rehabilitation Medicine, 29, pp.43–8.
Mostamand, J., Bader, D.L. & Hudson, Z., 2011. The effect of patellar taping on EMG
activity of vasti muscles during squatting in individuals with patellofemoral pain
syndrome. Journal of sports sciences, 29(2), pp.197–205.
Muhle, C., Brossmann, J. & Heller, M., 1999. Kinematic CT and MR imaging of the
patellofemoral joint. European Radiology, 9(3), pp.508–518.
Murray, H. & Husk, L., 2001. Effect of Kinesio taping on proprioception in the ankle.
Journal of Orthopedic Sports Physical Therapy, 31, p.A–37.
Nadeau, S. et al., 1997. Gait study of patients with patellofemoral pain syndrome. Gait &
posture, 5, pp.21–27.
Näslund, J. et al., 2006. Comparison of symptoms and clinical findings in subgroups of
individuals with patellofemoral pain. Physiotherapy Theory and Practice, 22(3),
pp.105–118.
Nawab, S. et al., 2002. Next-generation decomposition of multi-channel EMG signals. In 2nd
Joint Meeting IEEE Engineering in Medicine and Biology Society and Biomedical
Engineering Society, Houston, TX. pp. 36–37.
Nawab, S.H., Chang, S.-S. & De Luca, C.J., 2010. High-yield decomposition of surface EMG
signals. Clinical neurophysiology, 121(10), pp.1602–15.

268
Nawab, S.H., Chang, S.-S. & De Luca, C.J., 2009. Surface EMG signal decomposition using
empirically sustainable biosignal separation principles. Conference proceedings : ...
Annual International Conference of the IEEE Engineering in Medicine and Biology
Society. IEEE Engineering in Medicine and Biology Society. Conference, 2009,
pp.4986–9.
Nawab, S.H., Wotiz, R. & De Luca, C.J., 2004. Improved resolution of pulse superpositions
in a knowledge-based system EMG decomposition. In Engineering in Medicine and
Biology Society. pp. 69–71.
Neptune, R.R., Wright, I.C. & van den Bogert, a J., 2000. The influence of orthotic devices
and vastus medialis strength and timing on patellofemoral loads during running. Clinical
biomechanics, 15(8), pp.611–8.
Nijs, J. et al., 2006. Diagnostic value of five clinical tests in patellofemoral pain syndrome.
Manual therapy, 11(1), pp.69–77.
Nissel, R. & Ekholm, J., 1985. Patellar forces during knee extension. Scandinavian Journal
of Rehabilitation Medicine, 17(2), pp.63–74.
Noehren, B. et al., 2012. A comparison of tibiofemoral and patellofemoral alignment during a
neutral and valgus single leg squat: an MRI study. The Knee, 19(4), pp.380–6.
Ohkoshi, Y. et al., 1991. Biomechanical analysis of rehabilitation in the standing position.
American Journal of Sports Medicine, 19, pp.605–611.
Orrell, A., Masters, R. & Eves, F., 2009. Reinvestment and movement disruption following
stroke. Neurorehabilitation Neural Repair, 23, pp.177–183.
Pagé, M., Katz, J. & Stinson, J., 2012. Validation of the numerical rating scale for pain
intensity and unpleasantness in pediatric acute postoperative pain: sensitivity to change
over time. The journal of Pain, 13(4), pp.359–369.
Paoloni, M. et al., 2010. Kinematic and kinetic features of normal level walking in
patellofemoral pain syndrome: more than a sagittal plane alteration. Journal of
biomechanics, 43(9), pp.1794–8.
Papadopoulos, K. et al., 2014. Clinical tests for differentiating between patients with and
without patellofemoral pain syndrome. Hong Kong Physiotherapy Journal, (6), pp.1–9.
Patil, S. et al., 2011. An electromyographic exploratory study comparing the difference in the
onset of hamstring and quadriceps contraction in patients with anterior knee pain. The
Knee, 18(5), pp.329–32.
Petersen, W. et al., 2013. Patellofemoral pain syndrome. Knee surgery, sports traumatology,
arthroscopy.
Powers, C., 2010. The influence of abnormal hip mechanics on knee injury: a biomechanical
perspective. Journal of orthop Sports Ther, 40, pp.42–51.

269
Powers, C. et al., 1999. The influence of patellofemoral pain on lower limb loading during
gait. Clinical Biomechanics, 14, pp.722–728.
Powers, C., Landel, R. & Perry, J., 1996. Timing and intensity of vastus muscle activity
during functional activities in subjects with and without patellofemoral pain. Physical
therapy, 76(946-55).
Prins, M. & van der Wurff, P., 2009. Females with patellofemoral pain syndrome have weak
hip muscles: a systematic review. Australian Journal of Physiotherapy, 55, pp.9–15.
Rainoldi, A. et al., 2008. Myoelectric manifestations of fatigue in vastus lateralis , medialis
obliquus and medialis longus muscles. Journal of Electromyography and Kinesiology,
18(6), pp.1032–1037.
Rathleff, M. et al., 2013. Neuromuscular activity and knee kinematics in adolescents with
patellofemoral pain. Medicine and science in sports and exercise, 45(9), pp.1730–9.
Rich, C., O’Brien, G. & Cafarelli, E., 1998. Probabilities associated with counting average
motor unit firing rates in active human muscle. Canadian Journal of Applied
Physiology, 23(1), pp.87–94.
Richards, J. et al., 2008. A biomechanical investigation of a single-limb squat: implications
for lower extremity rehabilitation exercise. Journal of athletic training, 43(5), pp.477–
82.
Richards, J., 2008. Biomechanics in Clinic and Research 1st ed., Churchill Livingstone
Elsevier.
Richards, J. & Selfe, J., 2011. EMG Decomposition of Vastus Medialis and Vastus Lateralis
in normal subjects and patellofemoral patients : A new way of assessing the balance of
muscle function ? In International Patellofemoral Research Retreat.
Richards, J.G., 1999. The measurement of human motion: A comparison of commercially
available systems. Human Movement Science, 18(5), pp.589–602.
Riemann, B. & Lephart, S., 2002. The sensorimotor system, Part II: The role of
proprioception in motor control and functional joint stability. Journal of athletic
training, 3, pp.80–84.
Robbins, S., Waked, E. & Rappel, R., 1995. Ankle taping improves proprioception before
and after exercise in young men. British Journal of Sports Medicine, 29, pp.242–247.
Roland, M., 1986. A critical review of the evidence for a pain-spasm-pain cycle in spinal
disorders. Clinical Biomechanics, 1(2), pp.102–109.
Roy, S.H., De Luca, C.J. & Schneider, J., 1986. Effects of electrode location on myoelectric
conduction velocity and median frequency estimates. Journal of applied physiology,
61(4), pp.1510–7.

270
Sacco, I.D.C.N. et al., 2006. Functional and EMG responses to a physical therapy treatment
in patellofemoral syndrome patients. Journal of Electromyography and Kinesiology,
16(2), pp.167–74.
Salsich, G. et al., 2002. The effects of patellar taping on knee kinetics, kinematics, and vastus
lateralis muscle activity during stair ambulation in individuals with patellofemoral pain.
Journal of Orthopaedic Sports Physical Therapy, 32(1), pp.3–10.
Salsich, G.B., Brechter, J.H. & Powers, C.M., 2001. Lower extremity kinetics during stair
ambulation in patients with and without patellofemoral pain. Clinical biomechanics,
16(10), pp.906–12.
Salsich, G.B., Graci, V. & Maxam, D.E., 2012. The effects of movement pattern modification
on lower extremity kinematics and pain in women with patellofemoral pain. Journal of
orthopaedic and sports physical therapy, 42(12), pp.1017–24.
Sanchis-alfonso, V., 2010. Pathophysiology of Anterior Knee Pain. Patellofemoral Pain,
Instability and Arthritis, pp.1–16.
Sanchis-Alfonso, V. & Roselló-Sastre, E., 2005. Histologic retinacular changes associated
with ischemia in painful patellofemoral malalignment. Orthopedics, 28(6), pp.593–9.
Selfe, J. et al., 2011. A clinical study of the biomechanics of step descent using different
treatment modalities for patellofemoral pain. Gait & posture, 34(1), pp.92–6.
Selfe, J. et al., 2014. Do people who consciously attend to their movements have more self-
reported knee pain? An exploratory cross-sectional study. Clinical Rehabilitation.
Selfe, J. et al., 2001. Four Outcome Measures for Patellofemoral Joint Problems.
Physiotherapy, 87(10), pp.507–515.
Selfe, J., 2000. Peak 5 motion analysis of an eccentric step test performed by 100 normal
subjects. Physiotherapy, 86(5), pp.241–247.
Selfe, J. et al., 2008. The biomechanics of step descent under different treatment modalities
used in patellofemoral pain. Gait & posture, 27(2), pp.258–63.
Selkowitza, D., Chaney, C. & Stuckey, S., 2007. The effects of scapular taping on the surface
electromyographic signal amplitude of shoulder girdle muscles during upper extremity
elevation in individuals with suspected shoulder impingement syndrome. Journal Ortho
Sports Phys Ther, 37, pp.694–702.
Semmler, J.G., Nordstrom, M. a & Wallace, C.J., 1997. Relationship between motor unit
short-term synchronization and common drive in human first dorsal interosseous
muscle. Brain research, 767(2), pp.314–20.
Shannon, C.E., 1948. A Mathematical Theory of Communication. The Bell System Technical
Journal, 27, pp.379–423.

271
Shelbourn, K. & Nitz, P., 1990. Accelerated rehabilitation after anterior cruciate ligament
reconstruction. American Journal of Sports Medicine, 18, pp.292–299.
Simoneau, G. et al., 1997. Changes in ankle joint proprioception resulting from strips of
athletic tape applied over the skin. Journal of athletic training, 32, pp.141–147.
Smart, K.M. et al., 2012. Mechanisms-based classifications of musculoskeletal pain: part 3 of
3: symptoms and signs of nociceptive pain in patients with low back (± leg) pain.
Manual therapy, 17(4), pp.352–7.
Smith, T.O. et al., 2009. Can vastus medialis oblique be preferentially activated? A
systematic review of electromyographic studies. Physiotherapy theory and practice,
25(2), pp.69–98.
Smith, T.O. et al., 2009. Do the vastus medialis obliquus and vastus medialis longus really
exist? A systematic review. Clinical anatomy, 22(2), pp.183–99.
Somes, S. et al., 1997. Effects of Patellar Taping on Patellar Position in the Open and Closed
Kinetic Chain: A Preliminary Study. Journal of Sports Rehabilitation, 6, pp.299–308.
Souza, R. & Powers, C., 2009. Differences in hip kinematics, muscle strength, and muscle
activation between subjects with and without patellofemoral pain. journal of
orthopaedic & sports physical therapy, 39(1), pp.12–9.
Stinson, J.N. et al., 2006. Systematic review of the psychometric properties, interpretability
and feasibility of self-report pain intensity measures for use in clinical trials in children
and adolescents. Pain, 125(1), pp.143–157.
Stock, M.S., Beck, T.W. & Defreitas, J.M., 2012. Effects of fatigue on motor unit firing rate
versus recruitment threshold relationships. Muscle & nerve, 45(1), pp.100–9.
Stuart, M. et al., 1996. Comparison of intersegmental tibiofemoral joint forces and muscle
activity during various closed kinetic chain exercises. American Journal of Sports
Medicine, 24, pp.792–799.
Sung, P.S. & Lee, D.C., 2009. Gender differences in onset timing and activation of the
muscles of the dominant knee during stair climbing. The Knee, 16(5), pp.375–80.
Suresh, N. et al., 2011. Examination of motor unit control properties in stroke survivors using
surface EMG decomposition: a preliminary report. Conference proceedings : ... Annual
International Conference of the IEEE Engineering in Medicine and Biology Society.
IEEE Engineering in Medicine and Biology Society. Conference, 2011, pp.8243–6.
Syme, G. et al., 2009. Disability in patients with chronic patellofemoral pain syndrome: a
randomised controlled trial of VMO selective training versus general quadriceps
strengthening. Manual therapy, 14(3), pp.252–63.
Tang, S.F. et al., 2001. Vastus medialis obliquus and vastus lateralis activity in open and
closed kinetic chain exercises in patients with patellofemoral pain syndrome: an

272
electromyographic study. Archives of physical medicine and rehabilitation, 82(10),
pp.1441–5.
Taunton, J. et al., 2002. A retrospective case-control analysis of 2002 running injuries. British
journal of sports medicine, 36(2), pp.95–102.
Teitge, R. a., 2001. Plain patellofemoral radiographs. Operative Techniques in Sports
Medicine, 9(3), pp.134–151.
Thijs, Y. et al., 2010. Does bracing influence brain activity during knee movement: an fMRI
study. Knee surgery, sports traumatology, arthroscopy, 18(8), pp.1145–9.
Van Tiggelen, D. et al., 2009. Know the Risk Factors for Patellofemoral Pain Delayed Vastus
Medialis Obliquus to Vastus Lateralis Onset Timing Contributes to the Development of
Patellofemoral Pain in Previously Healthy Men: A Prospective Study. American journal
of sports medicine, 37(6), pp.1099–105.
Tobin, S. & Robinson, G., 2000. The Effect of McConnell’s Vastus Lateralis Inhibition
Taping Technique on Vastus Lateralis and Vastus Medialis Obliquus Activity.
Physiotherapy, 86(4), pp.173–183.
Toumi, H. et al., 2013. The role of muscle strength & activation patterns in patellofemoral
pain. Clinical biomechanics, 28(5), pp.544–8.
Tucker, K.J. & Hodges, P.W., 2010. Changes in motor unit recruitment strategy during pain
alters force direction. European Journal of Pain, 14(9), pp.932–8.
Uliam Kuriki, H. et al., 2011. Comparison of different analysis techniques for the
determination of muscle onset in individuals with patellofemoral pain syndrome.
Journal of Electromyography and Kinesiology, 21(6), pp.982–987.
Voight, M. & Weider, D., 1991. Comparative reflex response times of the vastus medialis
and the vastus lateralis in normal subjects and subjects with extensor mechanism
dysfunction. American Journal of Sports Medicine, 10, pp.131–7.
Wahrenberg, H., Lindbeck, L. & Ekholm, J., 1978. Dynamic load in the human knee joint
during voluntary active impact to the lower leg. Scandinavian Journal of Rehabilitation
Medicine, 10, pp.93–98.
Westgaard, R.H. & De Luca, C.J., 2001. Motor control of low-threshold motor units in the
human trapezius muscle. Journal of neurophysiology, 85(4), pp.1777–81.
Wiberg, G., 1941. Roentgenographic and anatomic studies on the femoropatellar joint. Acta
orthopaedica Scandinavica, 12, pp.319–410.
Wilson, N. a et al., 2009. In vivo noninvasive evaluation of abnormal patellar tracking during
squatting in patients with patellofemoral pain. The Journal of bone and joint surgery.
American volume, 91(3), pp.558–66.

273
Wilson, N. a & Sheehan, F.T., 2009. Dynamic in vivo 3-dimensional moment arms of the
individual quadriceps components. Journal of biomechanics, 42(12), pp.1891–7.
Winter, D. et al., 1980. Units, Terms and Standards in the Reporting of EMG Research. A
report of the ad hoc committee of the International Society of Electrophysiology
Kinesiology.
Winter, D., Sidwall, H. & Hobson, D., 1974. Measurement and reduction of noise in
kinematics of locomotion. Journal of biomechanics, 7, pp.157–159.
Witrouw, E., Lysens, R. & Bellemans, J., 2000. Intrinsic risk factors for the development of
anterior knee pain in an athletic population. American Journal of Sports Medicine,
28(4), pp.480–489.
Witvrouw, E. et al., 1996. Reflex response times of vastus medialis oblique and vastus
lateralis in normal subjects with patellofemoral pain syndrome. Journal Ortho Sports
Phys Ther, 24, pp.160–5.
Wong, W. et al., 2008. Reinvestment and falls in community-dwelling older adults.
Neurorehabilitation Neural Repair, 22, pp.410–414.
Wong, Y., 2009. Recording the vastii muscle onset timing as a diagnostic parameter for
patellofemoral pain syndrome: fact or fad? Physical therapy in sport, 10(2), pp.71–4.
Wong, Y.-M. & Ng, G.Y.F., 2006. Surface electrode placement affects the EMG recordings
of the quadriceps muscles. Physical Therapy in Sport, 7(3), pp.122–127.
Wood, L., Muller, S. & Peat, G., 2011. The epidemiology of patellofemoral disorders in
adulthood: a review of routine general practice morbidity recording. Primary health care
research & development, 12(2), pp.157–64.
Yack, H., Collins, C. & Whieldon, T., 1993. Comparison of closed and open kinetic chain
exercise in the anterior cruciate ligament-deficient knee. American Journal of Sports
Medicine, 21, pp.49–54.
Zaheer, F., Roy, S.H. & De Luca, C.J., 2012. Preferred sensor sites for surface EMG signal
decomposition. Physiological measurement, 33(2), pp.195–206.