The Nepal Tourism(Cluster
32
1 The Nepal Tourism Clus ter Project Team: Miya Cain | Samantha Hackney | Upasana Khadka Sean Park | Boban Paul Microeconomics of Competitiveness May 7, 2015 Faculty Instructor: Jorge RamirezVallejo
Transcript of The Nepal Tourism(Cluster

1
The Nepal Tourism Cluster
Project Team: Miya Cain | Samantha Hackney | Upasana Khadka
Sean Park | Boban Paul
Microeconomics of Competitiveness
May 7, 2015
Faculty Instructor: Jorge Ramirez-‐Vallejo

2
EXECUTIVE SUMMARY
Nepal is a country that has lagged behind economic performance, relative to its South
Asian, but is capable of becoming a global player in the tourism cluster if there is a coordinated
effort between government, business, and IFCs. Nepal’s low GDP growth, labor productivity and
ranking in innovation measures can be partially attributed to the low level of labor productivity,
low innovation, and a predominantly agrarian economy. Nepal’s macroeconomic policies remain
stable, but with the future economic performance uncertain due to a growing trade imbalance and
inflation. Nepal has several endowments that benefit its economic competitiveness including its
natural and cultural endowments which serve as tourist attractions, and its location between two
of the world’s fastest growing economies in India and China. On the other hand, Nepal ranked
101 out of 111 countries in its quality of business environment due to its challenging
infrastructure, weak local demand, many barriers for businesses, and weak cluster development
efforts.
The tourism cluster is a promising burgeoning cluster with a unique value proposition
due to the Himalayan Mountains for trekking and cultural heritage sites. Growth is hampered by
the seasonality of tourists, as the cluster has failed to mature by offering activities for tourists
during the off-season. While tourists’ arrivals have been increasing at 7% per annum since 2010,
the total duration of visits have decreased, along with a small number of repeat visits. The
tourism cluster is supported by a large number of Institutes for Collaboration IFC), the IFCs are
more focused on government policy formulation than on improving the competitiveness of the
other actors in the industry. If the government, IFCs, and key actors make the necessary
improvements to the quality, safety, and the branding of the cluster, the team believes that the
cluster can attract year-around, higher value tourists interested in adventure and a rich cultural
immersion experience.

3
1. NEPAL COUNTRY COMPETITIVENESS 1.1 Country and Regional Context
Nepal is a landlocked country nestled between India and China in South Asia. It occupies
an area of 147,181 square kilometers with a population of about 30.1 million people as of 2014.
Nepali is the official language nationwide. Many in government and business speak English in
addition to Nepali, and there are about 123 other mother tongues spoken throughout the country.
1.2 History and Political System
Nepal was ruled by a Hindu monarchy for over 200 years. In 1996, there was a Maoist
rebellion in Nepal that sparked a ten year civil war. The war ended in 2006, when a
Comprehensive Peace Accord set the foundation for a democratic transition. While the transition
has not been marked by violence, the frequent changes in political leadership and policy
uncertainty have negative impacts on Nepal’s economic competitiveness. A new Constituent
Assembly (CA) was elected in 2013.
1.3 Economic Performance and Growth
Nepal lags behind all of its key neighbors in
GDP growth, labor productivity and innovation
measures. Beginning in 2000s other South Asian
economies accelerated and surpassed Nepal. While
Nepal’s GDP growth improved from 3.9% in 2013 to
5.5% in 2014, it still lagged behind many of the
neighboring countries (Figure 1). This low GDP
growth can be partially attributed to the low level of
Figure 1: South Asia GDP growth
Source World Bank World Development Indicators
Source Euromonitor International
Figure 2: Labor Productivity in South Asia

4 Figure 4: Map of Nepal. Source:http://college.holycross.edu/projects/himalayan_cultures/2011_plans/gwollak/images/nepal-‐map.jpg
labor productivity, low innovation levels, and the
agrarian economy. First, the labor productivity in
Nepal is US$1785.9 per person employed, which
is very low relative to other South Asian Countries
(Figure 2). Secondly, agriculture still accounts for
almost a third (34.33%) of GDP (Figure 3) and
agriculture is the base of the economy, providing
livelihood for more than 70% of the population.
Finally, on the Global Innovation Index for
Innovation Output, Nepal is ranked at 136, which is
the lowest in the region (Figure 4).
1.4 Endowments
Nepal has several endowments that benefit its economic competitiveness. First, it is
located between two of the world’s fastest growing economies, India and China. Second, Nepal
has many natural and cultural endowments. For instance, the Himalayan range in Nepal has 8 of
the world’s 10 largest peaks. Nepal also hosts the birthplace of Buddha, a World Heritage Site,
and the Kathmandu Valley also has many religious and cultural centers. Additionally, Nepal has
strong opportunities for hydropower development due to the wide elevation change and water
resources. Only 700MW of over 40,000 MW of potential hydropower is developed. Finally,
Nepal has very favorable microclimates for agricultural products such as rice, sugarcane, and
oilseed.
On the other hand,
Nepal has several risk
Figure 3: Nepal Economy as share of GDP and Growth Rate
Figure 4: Global Innovation Index for Innovation Output
Source Government of Nepal Central Bureau of Statistics
Source Global Innovation Index

5
factors to economic competitiveness. Nepal is prone to natural disasters as it ranks 11th in the
world in vulnerability to earthquakes. The country is also susceptible to landslides and floods
due to steep terrain and heavy rainfall. The most recent earthquake has drastically impacted the
country, and it will be important for humanitarian response to be forward thinking, considering
sustainable development solutions. Perhaps Nepal can also leverage the international attention to
rebuild in a way that promotes dignity and prosperity for the people of Nepal. Nepal’s status as a
landlocked country is also a challenge. It means that the country must rely on its neighbors for
trade access. Nepal uses the Indian port, Kolkata, because the Himalayas are a barrier to the
north. Moreover, the large changes in elevation greatly increase infrastructure costs (ex. roads
and electricity lines). Nepal has three different major topographical regions, the mountainous
Himalayas in the North, the hilly midsection, and the Terai in the south.
1.5 Macroeconomic & Fiscal Policies
While Nepal’s macroeconomic
fundamentals remain stable, the future of
the economy remains uncertain as many
vulnerabilities exist. First, Nepal’s rate of
inflation rose in 2013 to 9.9% reversing a trend
of a steady decrease since 2009 (Figure 5).
Secondly and more positively, Nepal has been successful in decreasing its overall public
debt to 30.8% of GDP from 33.6% the previous year, due to strong revenue growth and limiting
government expenditures. However, while the Nepalese government has been able to decrease
debt, it has come at a price, as the government has failed to invest in infrastructure despite
having the fiscal flexibility. Actual spending reached only 90.5% of the plan for recurrent
Figure 5: Nepal's Rate of Inflation
Source World Bank World Development Indicators

6
expenditures and only 81% of the plan for the capital expenditures, which is indicative of the
Nepalese government’s recognition of the high level of public debt, as well as its chronic neglect
of public infrastructure. (World Bank, 2013) As
a result this has hindered cluster development
and local industries.
Finally, the Nepalese government has
been grappling with a growing trade deficit,
reaching 27.1% of GDP in FY13. Exports were
10.7% of GDP and imports rose to 37.5% of GDP,
up from 33.6% in the previous year (Figure 6). Moving forward, the Nepalese government must
vigilantly monitor these sources of monetary vulnerability to maintain economic stability.
1.6 Human Development and Effective Public Institutions
Nepal’s political instability has hampered development within the country, creating high
levels of poverty and low life expectancy. First, according to the Human Development Index
(HDI), which measures education, health, and poverty, Nepal’s HDI value for 2013 was a 0.540,
which is categorized as low on human development and it is currently ranked at 145 out of 187
countries on the HDI, below many of its South Asian neighbors. (UNDP, 2014) This is partially
due to poor educational system, where the mean years of schooling is only 3.2, producing low
levels of literacy across the population (57.4%). (CIA World Factbook, 2011) This literacy rate
is low compared to Sri Lanka’s 10.8 years, and the overall average of other low HDI countries at
4.2 years. (UNDP, 2041)
Secondly, despite the low level of socioeconomic development in the country, the
government has been pursuing an aggressive poverty reduction strategy. As a result, between
Figure 6: Nepal's imports and exports
Source World Bank World Development Indicators

7
2006 and 2011 Nepal was a top performer out of 22 countries in decreasing multidimensional
poverty as measured by the Oxford Poverty & Human Development Initiative. This overall
reduction in poverty along with other factors has also translated to a decrease in inequality, and
Nepal is currently on par with many of its neighbors for income inequality as measured by the
GINI index with a rating of 0.328 out of 1, where 0 is perfect equality.
Another major concern for
businesses in the country is the political
instability that continues to plague the
country. The transition process since the
civil war and the Comprehensive Peace
Accord of 2006 has been difficult, with
frequent changes in political leadership
and high levels of violence. This political
upheaval has dramatically affected
investor sentiment and business
operations. In the World Bank Enterprise
Survey of Nepal in 2013, almost half of
the 482 Nepal firms surveyed cited political instability as the top obstacle to their business. In
particular businesses pointed to the uncertainty around security of property rights, uncertainty
about policy implementation and direction and a lack of a focus on long-term strategy (Figure 7).
The political instability has also produced a weak rule of law with high levels of
corruption. Nepal was ranked 116 out of 177 countries on Transparency International’s
Corruption Index in 2013. This endemic corruption can be seen in the lack of prosecution for
Figure7: Nepal's top business constraints
Source World Bank Enterprise Survey Nepal 2013

8
high-level officials accused of corruption, regular pay-outs to judges, and alleged police force
involvement with organized crime. Furthermore the rule of law is not evenly enforced with
inefficient and often excessive regulation.
1.7 Cluster Analysis
Figure 8 shows the
diamond analysis
for the country
cluster in Nepal. As
per the framework,
we have divided up
the chart into 4
sections with
strengths and
weaknesses in each
of these sections and
an endowments section. In blue are the points we will explore in greater depth in the following
sections. Our emphasis will be on the weaknesses, rather than strengths, because Nepal because
had a very poor ranking in quality of business environment, ranking 101 out of 111 countries.
From our analysis, we will provide recommendations to four particular challenges Nepal faces in
the country diamond.
1.71 Factor conditions
1. Electricity not widely available and shortages force significant costs for businesses
Figure 8: Country Diamond

9
Nepal has low quality and expensive electricity and frequent power outages. The lack of quality
electricity infrastructure imposes significant costs to businesses as found, in a survey of 483
businesses in Nepal, where nearly 17% of sales lost due to power outages which is nearly double
that of South Asia and other Low Income Countries. In the region Nepal has one of the worst
rankings in terms of quality of electricity supply (136 out of 144). The country faces a continual
shortage of energy as there is a 982.48GWh energy gap between annual energy demanded, 4,833
GWh, and annual energy generated, 3,850 GWh. Nepal has strong opportunities for hydropower
development, yet only 700MW of over 40,000 MW of potential hydropower is developed. One
reason Nepal has not developed its hydropower potential is the lack of a power purchase
agreement (PPA) between the Nepal Electric Authority (NEA) and the Ministry of Energy. This
agreement has been postponed because of the inability to provide transmission lines to the
projects and the long timeframe (about five years) of hydropower construction. (Kanipur
Publications 2013)
2. Mountainous terrain creates logistical difficulties
Nepal ranks 147th out of 155 countries in the Logistics Performance Index due to the poor
quality of roads and seasonal variability. Although the presence of the Himalayan Mountains are
a positive in the sense that they serve as a natural tourist attraction, but they are also a negative
because it makes road infrastructure more costly. The cost of road transit services is expensive in
many parts of Nepal because of poor road maintenance and increased seasonal costs.
Transportation costs are reasonable during the dry season because it is less risky; however,
during the other seasons, freight transit services can cost up to 3.33 times the average minimum
rate. “This high degree of variability can undercut pricing and production consistency for
producers and reduces planning capability for firms.” (Government of Nepal, 2014)

10
1.72 Context for Firm Strategy and Rivalry
1. Frequent Strikes Hamper Businesses
Next, under context for firm strategy and rivalry, a big barrier for businesses that is uniquely tied
to Nepal’s political instability is the prevalence of strikes. It is common for political parties to go
on strike, there were 1205 general strikes in 2010 alone, and the entire economy shuts down
whenever this happens. Strikes impose a huge cost to local businesses estimated to be $1.2
billion from 2008 to 2013, a deceleration of annual GDP growth rates between 0.6 percentage
point and 2.2 percentage points during this period. (Shretha, 2014) Although this cost has
trended downwards in recent years, the prevalence of strikes makes Nepal businesses a more
risky investment, and hinders competition between locally-based rivals.
2. High trade barriers and rigid regulations hinder local business competition
In today’s globalized world, trading across borders is vital for economic development and
growth. Heavy regulation and inefficiencies have led to increased costs and extra time needed for
exports and imports, limiting the potential growth of trade in Nepal. This is partially due to
excessive document requirements needed for importing and exporting, the inefficiencies at the
port operations and the burdensome customs procedures. Furthermore, high trade barriers due to
inland transportation and handling expenses comprise more than 65% of the trade costs. In-land
transportation adds an additional 14 days to trade costs and costs an additional US$1,800.
1.73 Related and Supporting Industries
1. Lack of partnership between government and businesses on Cluster Development
Under related and supporting industries, there is poor collaboration between business and
government to promote clusters. There are a limited number of cluster development initiatives,
such as Invest Nepal and the Centre for Economic Development and Administration, but these

11
efforts have low capacity and are predominantly government led. Combined with this is the
popular notion amongst businesses that government is not doing enough for businesses. A recent
survey found that 86.6% Nepalese firms agree that “There are not enough initiatives at the
district level to support private sector development.”
2. Nepal has relatively
shallow clusters with limited
supporting industries
Nepal ranks 103 out of 143
countries in the state of
cluster development, worst in
the South Asia region. The
average World Export Share
of clusters is only 0.00084%
with negative cluster growth
of -0.00048%. The key
clusters in Nepal are
hospitality textiles, business services, agricultural products and metal & mining clusters, with
hospitality as the largest and fastest growing cluster making it the most promising (Figure 9).
1.74 Demand conditions
1. Remittance flows drive transport and retail growth, but also hinders local job creation.
Local demand is significantly
impacted by 1700 Nepalese
migrating from the country
Figure 10: Remittances Growth versus Manufacturing and Exports
Figure 9: Cluster Development
Source World Bank World Development Indicators
12
every day. (Figure 10) Remittances have trended upward and are correlated with a downward
trend in exports and local manufacturing. Remittances now contribute close to 30% of Nepal’s
GDP and Nepal is facing a growing dependence on remittances that crowd out manufacturing
and exports. An increase in remittance flows can cause other sectors of the economy to
disintegrate, rather than promoting development. It is caused by both the influx of foreign
currency and the movement of resources. First, the influx of foreign currency causes an
appreciation of the domestic currency, thereby decreasing a country’s competitive advantage in
other sectors. Secondly, the economic promise of the natural resources leads to a movement of
resources and labor away from the other industries. If it is the case that the positive change in the
poverty rate in recent years is due to money flowing into the country via remittances rather than
local economic growth, this will perpetuate an unsophisticated local demand.
2. Unsophisticated demand due to high concentration of poverty and small middle class
Nepal has a one of the smallest middle classes in Asia by population share at 5.3% of the
population, which appears even smaller compared to its neighbors like Sri Lanka where the
middle class comprises 18.7%. (Asian Development Bank, 2010) The middle class is often seen
as important prerequisite for stronger, more sustainable economic growth and development.
Furthermore the middle class is more likely to invest in the health and education of the
generation, which can be seen in Nepal, as the middle class households ($4–$10) spend 14.2% of
their total expenditure on health and education services, but that share is 9.3% among the poor.
(Asian Development Bank, 2010) A strong middle class can also help to increase local demand.
1.8 Recommendations
#1: Create a Public-Private partnership on increasing Hydropower Capacity

13
There is a very strong local demand for alternative sources of electricity, given that the country
faces an annual shortage of 982.48GWh in energy, and that businesses lose a significant portion
of sales due to power outages. Investing in the untapped hydropower potential will not only help
to power Nepal and address the lack of electricity, but also position Nepal as the hydropower
center in South Asia to power its’ neighbors including India and Bangladesh. Nepal has been
hampered in taking this step because the government has been unable to bring together the
private sector, the Nepal Electric Authority, and the Ministry of Energy in a common interest.
Leaders in the private sector would benefit greatly from having greater hydropower access
instead of having to rely on generators that run on imported fuel; thus they should assume a
leading role in this project, tailoring the increased power supply to meet the needs of businesses
and increasing investment in infrastructure. The purchase power agreement with the Nepal
Electric Authority (NEA) and Ministry of Energy (ME) has not been signed due to the lack of
transmission lines to the project. (Government of Nepal, 2014) The government needs to invest
in the necessary hydropower infrastructure to have both the NEA and ME on board and create
policies which will aid the development of this sector.
#2: Redesign remittances to help local businesses rather than increase consumption
Currently, remittance contributes to 25.5 per cent of the GDP in Nepal, making it the fifth largest
remittance recipient in the world as a share of GDP (World Bank, 2011). According to the latest
household survey, remittances are spent mostly on consumption (80 per cent) followed by loan
repayment (7 per cent). The government should redesign remittances so that it improves access
to finance, increase investment, and make the local demand more sophisticated. One way the
government could do this is by facilitating remittance-backed lending at reasonable interest rates.
These loans would greatly address the debt traps migrant households are stuck in given they

14
borrow from informal lenders at very high interest rates. Secondly, channeling the remittance
funds through microfinance institutions could create incentives for rural Nepalese to stay in the
country and create new enterprises. Lastly, In order to encourage formal savings and formal
transfer of funds, it is important that the financial institutions are made more robust and that the
remitting process is transparent, less cumbersome and cheap. The high inflow of remittances
should be used to productively to lay the groundwork for high, sustainable growth in the long run
rather than a temporary solution to poverty.
#3: Improve cumbersome regulations that hinder businesses
To address the inefficiencies in trade regulation significant improvements are needed to the
inland transportation, as well as to the heavy regulation that increases the time necessary for
importing and exporting goods. In the Nepal to prepare the 11 documents it currently takes an
excess of 14 days, therefore by decreasing the number of necessary documents and streamlining
the process will dramatically bring down the number of days for trade. This is particularly
important considering the growing trade imbalance in Nepal, which could potentially increase
the number of exports. Secondly the Nepalese government needs to invest in public
infrastructure to improve the poor quality of the roads and other transportation infrastructure.
This investment will help to bring down the in-land transportation costs. Furthermore
improvements to the road quality will also help to increase the number of trucking firms as it will
increase the ability of truckers to navigate roads safely during the rainy season.
#4: Private sector led cluster development
The Private Sector in Nepal should take the lead in cluster development activities. Cluster groups
should be made up of key private sector players in the major clusters identified above, such as
tourism, textiles, and agriculture, as well as the nascent hydropower cluster. These private sector

15
players should collaborate regularly with high level government officials in order to inform the
government about regulatory issues and other constraints to cluster development. Government
policies about economic competitiveness should be created in collaboration with the private
sector.
The private sector players should also work closely with local research and educational
institutions, designing specialized programs that address cluster needs while building local
capacity and strengthening local demand. Additionally, businesses can build relationships with
local and regional suppliers and attract foreign suppliers.
Finally, the private sector should form a consortium that meets regularly and has a mechanism
for annual or regular reporting and accountability, both for themselves and the government.

16
2. CLUSTER ANALYSIS
Between 2010 and 2013, the global tourism sector grew at 3% per annum (arrivals) and 6% per
annum (receipts) to become 1.2 billion travelers accounting for $1.4 trillion in revenue receipts.
Of these, Europe and Asia are the major destinations followed by the Americas. There is a
positive trend in revenue receipt per traveler, driven both by the rise in prices and the evolution
of the sector to constitute more sophisticated activities. Nepal’s industry, though, forms only a
small segment of the worldwide industry despite the endowments it has in terms of some of the
highest peaks in the world (8 out of 10) as well as many cultural and heritage sites as will be
discussed later.
2.1 Evolution of the Nepal Tourism sector:
Tourism in Nepal started emerging as a result of the successful expeditions of 7 out of 8 peaks in
the 1950s. This includes the expedition of Annapurna in 1950 and Mt. Everest in 1953. Two
years later, Nepal received the membership of the United Nations which further led to increased
international exposure. Due to the increased interest in tourism from the international
community, the government formed the Nepal Tourism Board (as Tourism Development Board)
in 1957, which later was upgraded to the Tourism Department in 1959. In the same year, Nepal
joined the World Tourism Organization. All of these policy level initiatives gave the country
greater international exposure as well as credibility. Recognizing the high potential of tourism in
Nepal as well as the lack of quality manpower in the industry, United Nations Development
Programme (UNDP) and International Labor Organization (ILO) set up the Nepal Academy of
Tourism and Hotel Management or NATHM (set up as Hotel Management and Tourism
Training Council) in 1972. In 1977, the Ministry of Tourism was formed by the government to
provide a bigger thrust to the sector and in recognition of the growth it had already achieved.

17
0
50
100
150
200
250
300
350
0
20000
40000
60000
80000
100000 Seasonality in Tourism sector
Average tourist arrivals (2010-‐2013) Average Rainfall in mm (1990-‐2009)
Source: Nepal Tourism Statistics 2013; World Bank Climate Change Knowledge Portal
Since the 2000s, the industry has seen some setbacks due to domestic as well as international
issues. In 2001/02, there was a dip in tourist arrivals due to the hijacking of an Indian Airlines
flight from Kathmandu, increasing maoist insurgency and the Royal family massacre. Later
again, 2008/09 saw a slight dip in tourist arrivals due to the economic recession.
2.2 Industry Performance:
1. Seasonality is a key feature:
A salient feature of Nepal’s tourism sector is
the seasonality it faces due to the weather
conditions. As we see in the figure alongside,
the peak seasons for tourism in Nepal are
March/ April and October/ November. The
existence of seasonality, to a certain extent, points to the lack of maturity of the industry as
Nepal is not able to capture tourists for other activities during the off-seasons when
mountaineering or trekking are not feasible.
2. Tourist Arrivals have grown consistently to be 80,000 tourists in 2013:
18
0
100
200
300
400
2010 2011 2012 2013
Revenue ($ million)
5%
Note: financial year mentioned here – 2010 is FY2010 (April 2009 to March 2010); Source: Nepal Tourism Statistics 2013
Source: Nepal Tourism Statistics 2013
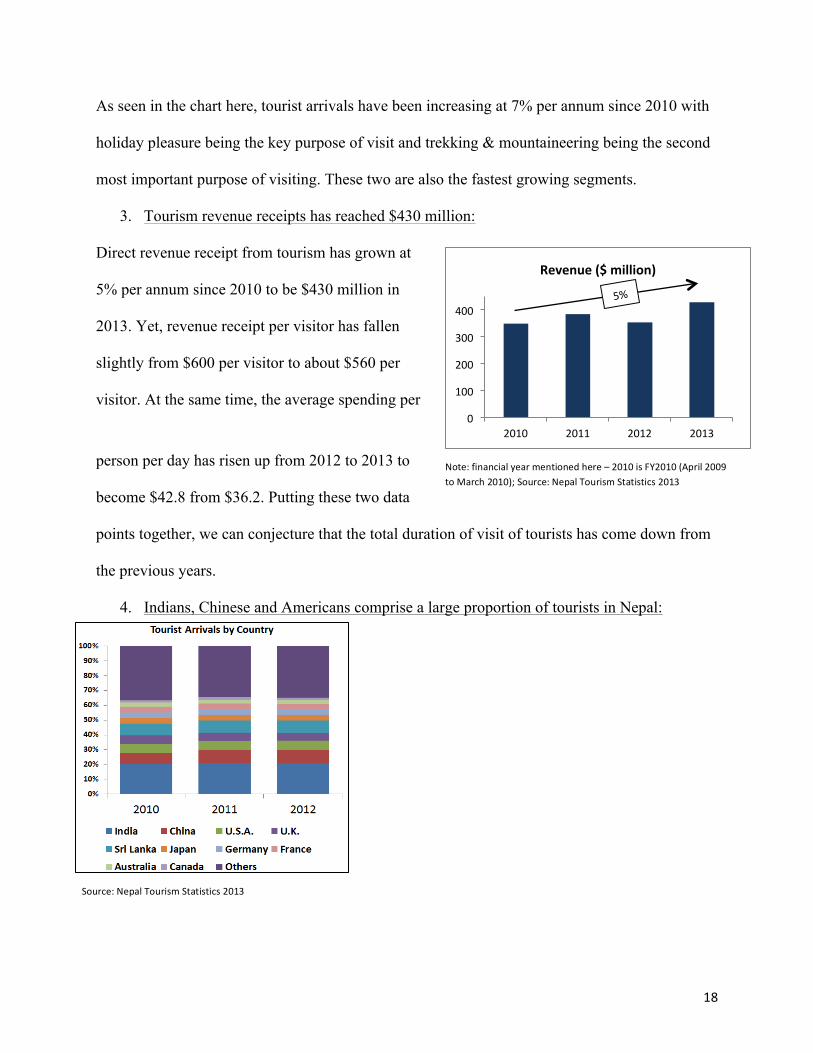
As seen in the chart here, tourist arrivals have been increasing at 7% per annum since 2010 with
holiday pleasure being the key purpose of visit and trekking & mountaineering being the second
most important purpose of visiting. These two are also the fastest growing segments.
3. Tourism revenue receipts has reached $430 million:
Direct revenue receipt from tourism has grown at
5% per annum since 2010 to be $430 million in
2013. Yet, revenue receipt per visitor has fallen
slightly from $600 per visitor to about $560 per
visitor. At the same time, the average spending per
person per day has risen up from 2012 to 2013 to
become $42.8 from $36.2. Putting these two data
points together, we can conjecture that the total duration of visit of tourists has come down from
the previous years.
4. Indians, Chinese and Americans comprise a large proportion of tourists in Nepal:

19
Source: Nepal Tourism Statistics 2013
As seen in the chart alongside, Indians, Chinese
and Americans form a large proportion of the
tourists coming to Nepal for tourism purposes.
This is an important point to note for two reasons.
First, over the last 6 decades, the tourism sector
has had very limited success in attracting large
numbers of tourists from regions beyond South
Asia. This could be due to limited marketing efforts. As we will see below, the marketing efforts
are not rightly focused on consumers through online campaign, etc. but rather through trade
shows which typically is attended by foreign companies involved in tourism. Second, Indians are
typically ‘low spending’ type1 and hence new product innovation would require the country to
reach out to destinations of high spending tourists from developed countries such as UK, Japan,
Germany and France, where they have some presence through existing clients. Only through
such innovation can this sector provide more sophisticated products yielding higher value and
revenue.
5. Low destination loyalty:
According to Yoon and Uysal (2005)2, destination loyalty refers to the repeat visitation
frequency or the desire to visit the same destination repeatedly. This reflects the level of
satisfaction with the services provided in the sector. In the case of Nepal we see (chart alongside)
that destination loyalty is on average low at 17% return visits in 2013. Austria, Norway and
Netherlands have the highest repeat rate. Inspite of this satisfaction level, the number of tourists
1 Trekking agent interview 2 Yoon, Y. and Uysal, M., “An examination of the effects of motivation and satisfaction on destination loyalty: A Structural Model”, Tourism Management, 2005.

20
from these countries is relatively low as seen in the section above. On the other hand, India, USA
and China have low repeat rates but high volume of tourism. This again points to the Nepal
Tourism sector’s inability to capture these other markets.
2.3 Tourism cluster agents:
The key agents in the
tourism cluster are given
in the chart above. We
have highlighted each of
these agents by level of
importance defined by the
criticality of its existence
for the growth of the
tourism industry. We see that following the endowments in the country, food suppliers, travel
agents, trekking agents, hotels and local transporter are the most important agents in the industry.
At the same level, Institutions for Collaboration, Educational Institutions, the Ministry and Nepal
Tourism Board provide policy support and quality labor. In addition, there are four key related
industries, agriculture, textile, handicraft and culinary. These related industries directly feed into
promoting tourism although this full potential is yet to be explored.
2.4 Institutions For Collaboration (IFC):
Institutions for Collaboration in the tourism sector exist primarily as industry associations for
different agents in the sector. These IFCs work very closely with the government to identify
areas for improving the policy environment. For example, the Trekking Agencies’ Association of
Nepal provides inputs to the Tourism Ministry on the minimum wages for trekking porters and

21
guides. In other words, the sphere of influence of IFCs is more on the government for policy
formulation and less on the actual actors in industry. This implies that while policies are framed
well, their implementation remains limited as the ability of the IFCs and the government to
enforce them is limited to only providing directives. This impedes any form of quality upgrading,
product innovation, or efforts that require a concerted effort from all players in an industry. The
following chart summarizes some of the key IFCs in the tourism sector and the roles they play:
Institutions for
Collaboration Mission/ Objective
Hotel Association of Nepal
HAN's mission is to facilitate Nepal's hotel and tourism industry by
raising concerted voice to make conducive environment for growth of this
sector.
Nepal Mountaineering
Association
Its primary objective is to work for the welfare of travel and tour
operators while improving the standard and quality of travel trade
industry in Nepal.
Trekking Agencies’
Association of Nepal
Umbrella organization of more than 1200 formally registered trekking
agencies and aims to develop and promote adventure tourism in Nepal.
Nepal Association of Tour
and Travel Agents
Works for the welfare of River Guides who offer services for river rafting
and associated enterprises.
Restaurant and Bar
Association of Nepal
Umbrella organization of classified tourist hotels, resorts and lodges with
objective of improving welfare of restaurant operators while improving
standard &quality of restaurant services.
2.5 Diamond Analysis:

22
The chart below shows the diamond analysis for the tourism cluster in Nepal. As per the
framework, we have divided up the chart into 4 sections with strengths and weaknesses in each
of these sections and an endowments section. In blue are the points we will delve into greater
depth in the following sections. Our emphasis will be on the weaknesses because Nepal will be
able to fully capture the benefits from its strengths, including endowments, only when it is able
to address some of the weaknesses urgently. Without doing so, the strengths we highlight will be
of limited utility to the sector.
2.51 Factor Conditions:
One of the biggest strengths of Nepal is the existence of a highly diverse culture in Nepal. It
varies from the plains of the south to the mountains in the north. There are some major
challenges, though, in terms of factor conditions, that impedes the sector’s growth.
1. Poor maintenance and high pollution in touristic sites:

23
Over the years, tourism has been increasing as we saw above. Sustained development of tourism
requires that these sites are maintained sufficiently well – a responsibility of all actors including
tourists, tourism agents and the government. Without this, there is a huge risk of these sites being
treated as public good leading to the ‘tragedy of the commons’ or depletion of these resources/
endowments. Many of Nepal’s sites are currently at such a stage. For example, with the
increased number of climbers to the Mt. Everest, there is an exponential rise in the amount of
human waste and frozen corpses that lay in the mountain. This has led to a stench in the region,
especially when the snow recedes due to warmer temperatures. Similarly, there are various
reports of bad quality air at Lumbini (UNESCO World Heritage Site) – finer Particulate Matter
2.5 recorded at 270 µg/m3 against the permissible level of 25 µg/m3.
2. Weak quality of labor in the Tourism industry:
Quality of labor is a crucial factor in determining the quality of services provided in the tourism
sector. Although, the Nepal Academy of Training and Hotel Management (NATHM) was set up
in 1972 to provide trained labor to the industry, there is a huge shortage of skilled and trained
labor. According to Sedai (2013)3, only 35 percent of tourism workers surveyed had any formal
training related skills. Most of the learning happens on-the-job. The Travel & Tourism
Competitiveness Report 2013 ranks Nepal as 125 out of 140 in availability of human resources.4
This issue has been exacerbated by huge migration of human resource to countries such as
Malaysia, Saudi Arabia, etc.
3. Low quality hotels especially outside major cities:
A common complaint of trekkers who visit Nepal is about the low quality of hotels in the key
trekking regions. It is interesting to note that the National hotel rating system is outdated by 16 3 Ram Chandra Sedai, “A Study of Informality in Tourism Sector in Nepal”, International Labor Organization, July 2013 4 “The Travel & Tourism Competitiveness Report 2015”, World Economic Forum, 2015
24
Source: Nepal Tourism Statistics 2013
years. This system is focused very much on inputs and availability of hotels, and less on the
quality of hotels. At the same time, there is a severely limited capacity for food quality
monitoring in that Nepal has only 40 food inspectors as of 2011. Hence, it is imperative that the
government first upgrade the system to include quality as an important metric and invest in
increased capacity for implementing this.
2.52 Context for Firm Strategy and Rivalry:
The general message in this section is that neither the government nor the private sector is doing
enough to increasing the size of the market substantially. While the government’s marketing
efforts are inappropriately focused, the private sector tries to out-compete each other on price
creating a zero-sum game.
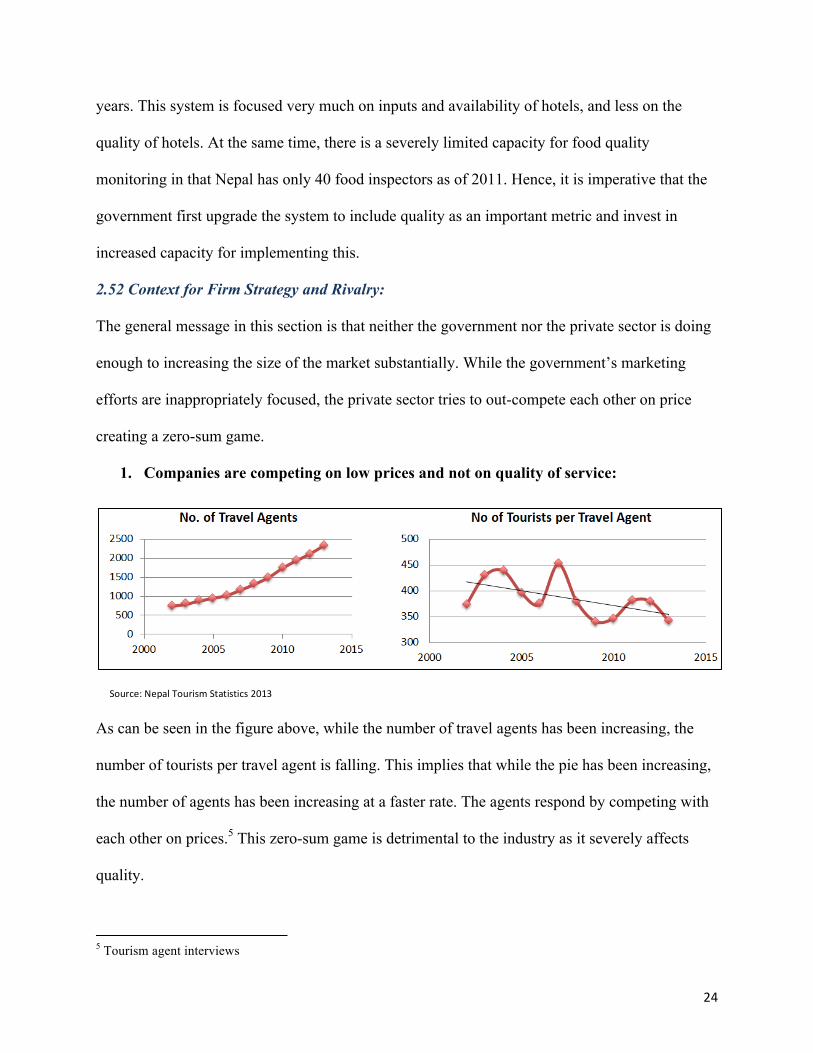
1. Companies are competing on low prices and not on quality of service:
As can be seen in the figure above, while the number of travel agents has been increasing, the
number of tourists per travel agent is falling. This implies that while the pie has been increasing,
the number of agents has been increasing at a faster rate. The agents respond by competing with
each other on prices.5 This zero-sum game is detrimental to the industry as it severely affects
quality.
5 Tourism agent interviews

25
0
20
40
60
80
100
2010 2011 2012 2013
Growth in tourists and hotel rooms
Number of tourists ('0000)
Number of rooms available ('000)
Source: Nepal Tourism Statistics 2013
2. Carrying capacity of hotels reached during peak seasons:
While the number of rooms remains flat across
the last four years, the number of tourists has
been increasing. Given that most tourists come
during the two main seasons, there is great strain
on the capacity of these hotels. Despite the
willingness to pay for individual rooms, guests
are often forced to share rooms during peak
seasons.
3. Limited Marketing efforts by firms and government:
Nepal Tourism Board (NTB) is responsible for all marketing efforts in the industry. Most of its
marketing effort has been on trade fairs, sales missions/ workshops in foreign countries - 40% of
2011/12 marketing budget was spent on these activities. On the other hand, only 1% of the
budget was spent online/ web marketing efforts, which has a much higher reach amongst
travelers. Marketing efforts also need to focus on upgrading Nepal’s image as a low cost
destination and take advantage of attractive locations in India, China and Tibet by setting up
coordinated regional efforts.
2.53 Demand Conditions:
The major weakness here is to do with attracting higher value tourists who usually require higher
quality and more sophisticated products.

26
Source: UNWTO Tourism Highlights, 2014 Edition
1. Low spending tourists attracted:
As seen in the figures above, Nepal attracts low
spending tourists. In the spending-volume matrix, Nepal features in the least favorable quadrant
of low volume and low spending per visitor. While being a low cost destination makes business
sense as long as the volume is high, in this case with low cost and low volume, the industry
players are prone to engage in competition on the basis of price.
2. Low enforcement of safety standards and lack of early weather warning system:
Safety is a large concern in the tourism sector especially for trekking activities. Yet, safety
standards are largely unenforced in Nepal. The lack of an early weather warning system was felt
during the Everest and Annapurna accidents in 2014 that killed many people including trekkers
and trekking staff.
2.54 Related and Supporting Industries:
In related and supporting industries we see weaknesses in two key areas, 1) limited efforts to
leverage related industries as part of Tourism experience, and 2) lack of research & development.
The Tourism Vision 2020 very broadly talks of augmenting economic opportunities and increase
27
employment in tourism sector to 1 million but does not mention any specific strategy to leverage
related industries such as food, handicrafts and retail. In terms of research and development,
while Nepal Tourism Board is supposed to have intelligence on the market (existing &
potential), customers, etc. there is no such information with them. The last visitor exit survey, in
fact, was done in 2008. In addition, most IFCs do not undertake any form of research although
NATHM does plan to set up a research institute in its academy.
2.6 Coordination with neighboring countries for a joint regional tourism cluster:
Nepal is geographically well positioned to benefit from concerted efforts with China, India and
Bhutan both to ease inter country tourism and to attract foreign tourists to the region. As of 2013,
China has the 4th largest number of tourist arrivals in the world and is the top country by
international tourism expenditure at $130 billion. China and India have about 30% of the world’s
population with a high proportion of middle class population. Attracting them would be a greatly
beneficial to Nepal in increasing volumes. At the same time, a joint effort with these countries
implies that Nepal can benefit from tourists interested in the region as a whole and not just
Nepal. Also, Nepal can benefit from the investments made by these countries in tourism.
Recently, some efforts have been put in motion though it needs to ramped up:
• Nepal and China have signed an agreement Dec 25, 2014 to enable their citizens to travel
to the border towns of each other for single-day visits without a visa.
• Nepal-India Joint Working Group held its first meeting in February of 2015 in New
Delhi, India. The working group aims to enhance cooperation in tourism.
2.7 Recommendation
The recommendations can be categorized into a strategic plan through the following diagram.
Here the blue boxes are domestic agent related changes that Nepal needs to make to its industry.

28
On the other hand, the red boxes are external agent related changes that the country needs to
make. While branding is inward out looking, market intelligence is outward in looking in that it
informs many of the changes that need to be made internally. With this framework in mind, let
us go through each recommendation within each segment of the diamond. As will be seen below,
a lot of the recommendations have got to do with quality, which therefore must be a crucial
priority of the government.
2.71 Factor Conditions:
Challenge Recommendation Responsibility Strategy segment
Weak quality of labor
1. Make training available outside capital. 2. Revise curricula with significant inputs from
industry actors such as hotels & travel companies. NATHM Quality
Poor maintenance & high pollution in touristic sites
1. Enforce regulations regarding trash removal after tourism activity especially treks.
2. Promote ecotourism amongst travel companies and trekkers.
3. Promote cleaning campaigns as CSR activities for tourism actors.
1. NMA, TAAN, MOCTCA
2. TAAN 3. MOCTCA
Quality
Low quality hotels especially outside capital
1. Upgrade hotel rating system and conduct ratings annually.
2. Upgrade hotel management curriculum to include current best practices in food safety.
1. NATHM/ HAN
Quality

29
2.72 Context for Firm Strategy and Rivalry:
Challenge Recommendation Responsibility Strategy segment
Companies are competing on low prices and not on quality of service.
1. Discussed in the “Demand Conditions” section. 2. Consumer driven quality enforcement mechanisms
should be developed. For example, consumer rating website for tourism companies.
NTB Quality
Carrying capacity of hotels reached during peak seasons
Incentivize investments in the hotel business in important touristic regions and expand current hotels to be able to accommodate more tourists
HAN Quality (volume)
Limited marketing efforts by firms and government
1. Reposition Nepal through online marketing and branding efforts, including as a location of adventure sports, diverse cuisine, lakes etc.
2. Capture high value tourists by upgrading its low cost destination image.
NTB Branding
2.73 Demand Conditions:
Challenge Recommendation Responsibility Strategy segment
Majority of tourists attracted are low-budget
1. Reposition Nepal internationally through marketing campaigns also focusing on high end activities (soft treks, pilgrimage).
2. Promote development of new high end activities such as skiing, mountain resorts with spas, golf.
1. NTB 2. TAAN
Branding and new product innovation
Low enforcement of safety standards and lack of weather early warning system
1. Invest in robust early warning system that ensures that individuals who are in inaccessible areas would also have access to information critical for their safety.
2. Promote the adoption of such technology via media outlets to ensure that the safety concerns trekkers have worldwide particularly after the two natural calamities this year will be quelled and Nepal has an image of a safe destination.
1. TAAN, NMA, MOCTCA
2. MOCTCA, TAAN, NMA
Safety

30
2.74 Related and Supporting Industries:
Challenge Recommendation Responsibility Strategy segment
Limited Efforts to leverage related industries as part of tourism experience
1. Develop tourism products that capture the unique value proposition in these industries and charge a premium for it.
2. Coordinate efforts with the food cluster to provide tourists a holistic experience including cuisine benefits from the diverse culture of the region.
1. MOCTCA/ NTB
2. TAAN/ NTB
Branding and new product innovation
Lack of research and development
1. Train NTB for tourism market research. 2. Invest in a robust information system that
includes feedback from visitors, information on source markets and potential growth markets.
3. Build NATHM’s research capacity develop internship programs in collaboration with NTB for students.
NTB, NATHM, MOCTCA
Market Intelligence

31
References:
Alkire, S. and Manuel Roche, J. (2013) How Multidimensional Poverty Went Down: Dynamics
and Comparisons, Oxford Poverty & Human Development Initiative Central Intelligence Agency (2015) The World Factbook. Washington DC Government of Nepal. (May 2014) Nepal Growth Diagnostic.
Kanipur Publications (2013) “Lack of political will, clear policy pegging back Nepal’s
hydropower sector.” Kathmandu, Nepal. Nepal Central Bureau of Statistics, (2013) Nepal Tourism Statistics 2013
Sedai, R., C. (July 2013). A Study of Informality in Tourism Sector in Nepal, International Labor
Organization
Shrestha, Min; Chaudhary, Shashi. (2014) The Economic Cost of General Strikes in Nepal Travers, R. (June 2004). Tourism Marketing Strategy for Nepal 2005-2020, UNDP.
UKAID, TAAN, NTB, UNWTO, et al (December 2013) National Tourism Strategy Plan for
Nepal 2014-2023.
Universa NA Primorskem, ZRS (2006-07). Nepal Tourism Sector analysis
UNDP (2014). Human Development Report 2014. New York: United Nations Development Programme.
UNWTO 2014 Edition (2014). UNWTO Tourism Highlights.
UNWTO Tourism Highlights, 2014 Edition
World Bank (2015), Doing Business Report. Washington DC World Bank (October 2013). Nepal Development Update: Poverty Reduction and Economic
Management South Asia Region, Washington DC.
World Economic Forum (2015). The Travel & Tourism Competitiveness Report 2015

32
Yoon, Y. and Uysal, M. (2005) An examination of the effects of motivation and satisfaction on
destination loyalty: A Structural Model, Tourism Management.