The Need for Enhanced Physical Infrastructure in the ...
56
Claremont Colleges Scholarship @ Claremont CMC Senior eses CMC Student Scholarship 2018 e Need for Enhanced Physical Infrastructure in the United States Tanvi Gandham Claremont McKenna College is Open Access Senior esis is brought to you by Scholarship@Claremont. It has been accepted for inclusion in this collection by an authorized administrator. For more information, please contact [email protected]. Recommended Citation Gandham, Tanvi, "e Need for Enhanced Physical Infrastructure in the United States" (2018). CMC Senior eses. 1761. hp://scholarship.claremont.edu/cmc_theses/1761
Transcript of The Need for Enhanced Physical Infrastructure in the ...
Claremont CollegesScholarship @ Claremont
CMC Senior Theses CMC Student Scholarship
2018
The Need for Enhanced Physical Infrastructure inthe United StatesTanvi GandhamClaremont McKenna College
This Open Access Senior Thesis is brought to you by Scholarship@Claremont. It has been accepted for inclusion in this collection by an authorizedadministrator. For more information, please contact [email protected].
Recommended CitationGandham, Tanvi, "The Need for Enhanced Physical Infrastructure in the United States" (2018). CMC Senior Theses. 1761.http://scholarship.claremont.edu/cmc_theses/1761

1
Claremont McKenna College
The Need for Enhanced Physical Infrastructure in the United States
Submitted to Professor William Ascher
by Tanvi Gandham
for Senior Thesis
Fall 2017 December 4, 2017

2

3
Acknowledgements I would like to express my sincere thanks and gratitude to Professor William Ascher – sorry, Bill. Without his guidance, mentorship, and green pen, I can honestly say it is unlikely that I would have had such a good time writing my Senior Thesis. Bill’s patience, kindness, and endless depth of knowledge have proved most invaluable throughout this process. Thank you for guiding me through the culmination of my liberal arts education. For most everything else, I would like to thank my family: Mama – for the chai and for always believing that I could achieve more than I could have ever dreamed of alone. Papa – for instilling in me a strong faith in civic institutions and pushing me to write about something I cared about. Bhaiya – for conversations that expand the boundaries of my known world and for being my constant in this wild human experience. My final thank you go to my friends, whose role cannot be understated. From Claremont to Copenhagen, you all give me life. To countless hours shared in Poppa to Facetimes from thousands of miles away, I could not be more grateful for your support, love, and compassion – both over the past semester and over the last four years.
4
Contents Chapter 1: Problem Orientation ................................................................................... 5
Introduction ................................................................................................................. 5
The Costs of Poor Infrastructure ................................................................................. 7
The Opportunities in Infrastructure Investment ...........................................................10
Chapter 2: Trends and Background ...........................................................................12
The Rise of American Infrastructure ...........................................................................12
The Fall of American Infrastructure ............................................................................14
Alternative Funding Routes ........................................................................................21
Chapter 3: Conditioning Factors ................................................................................23
Public Perception .......................................................................................................23
Proactive Infrastructure ..............................................................................................24
Political Costs and Benefits ........................................................................................25
Public Private Partnerships: Build, Operate, Transfer ................................................28
Chapter 4: Projections ................................................................................................35
Changes in Cars ........................................................................................................35
Changes in Infrastructure ...........................................................................................36
Data and Apps ...........................................................................................................38
Chapter 5: Recommendations and Concluding Thoughts .......................................44
Tradeoffs ...................................................................................................................44
Recommendations .....................................................................................................48
Final Thoughts ...........................................................................................................49
References ...................................................................................................................50

5
Chapter 1: Problem Orientation Introduction In 2016, the United States had the world’s largest GDP and was the world’s second
largest importer of goods (United States Census Bureau 2016). Moreover, the United
States was also ranked third in the world for Purchasing Power Parity and had the fourth
largest labor force (Central Intelligence Agency 2017). The country has access to
limitless resources and occupies a strategic and exceptionally powerful role on the
international stage. Despite these strong advantages, the United States has failed to
adequately invest in the country’s physical infrastructure.
The U.S is ranked thirteenth overall in road quality and twelfth in Quality of
Overall Infrastructure (World Economic Forum 2016, 357). In 2017, the American
Society of Civil Engineers (2017) (ASCE) gave the United States a rating of D+, based
on its analysis of issues such as the quality of transit, roads, inner waterways, ports,
aviation, rail, and bridges. ASCE (2017) estimates that the additional necessary
investment to raise each of these grades to at least a B by the year 2020 would be $2.06
trillion USD. The organization asserts that “[i]nfrastructure is also critical for long-term
economic growth, increasing GDP, employment, household income, and exports,” but
also emphasizes that “the reverse is also true – without prioritizing our nation’s
infrastructure needs, deteriorating conditions can become a drag on the economy” (ASCE
2013).

6
Figure 1.0: The United States’ Infrastructure Grades for 2017 (ASCE 2017)
The current state of American infrastructure is lacking and thoroughly
undeveloped. According to the National Economic Council and the Council of Economic
Advisors (2014), “there are more than 4 million miles of road, 600,000 bridges, and
3,000 transit providers in the United States. And yet, over the past 20 years, total federal,
state, and local investment in transportation has fallen as a share of GDP – while
population, congestion, and maintenance backlogs have increased.” A stunning 65
percent of all major American roads are in bad conditions and 25 percent of bridges
require repair in order to just keep up with today’s traffic (National Economic Council
and the President’s Council of Economic Advisers 2014).
Kearney, Hershbein, and Nantz (2015) outlined key figures in the debate over the
necessity for investments in our national infrastructure and transportation networks:

7
The facts make it clear that the state of public financing for transportation
infrastructure warrants serious attention. Federal spending as a share of GDP
has fallen and the federal Highway Trust Fund (HTF)—the designated source
of revenue for spending on our nation’s highways—is about to run out of
money. The primary source of funding for the HTF is the federal gas tax, but
that tax has not been raised since 1993. Of course, state and local governments
also play an active role in both the funding and building of infrastructure
projects.
The Costs of Poor Infrastructure The National Economic Council and the Council of Economic Advisors (2014) estimate
that Americans spent 5.5 billion hours in traffic every year, which creates a cost of $120
billion in lost fuel and time. Inadequate investments in infrastructure also lead to serious
safety concerns, contributing to the more than 33,000 traffic fatalities in 2014. These
crashes severely affect on the United States’ economy as well, “costing the United States’
economy $230 billion each year” (ASCE 2013). American businesses also take on
additional costs in freight transportation due to the state of American infrastructure, with
some estimates even as high as $27 billion a year (National Economic Council and the
President’s Council of Economic Advisers 2014). These costs are transferred to the
consumer in delayed shipping times and higher prices. ASCE (2016) predicts that if
preventative and necessary investment measures are not taken, between 2016 and 2025,
American household stand to lose up to $3,400 each year in disposable income and the
economy could lose $4 trillion in GDP and 2.5 million jobs.

8
Since a consensus clearly exists on the extent to which the United States is
lacking when it comes to investing in infrastructure and improving national transportation
systems and networks, why has the United States not taken active and steady steps to
resolve these problems? Perhaps it is because the costs of these infrastructural
inadequacies are less obvious, despite the effects they have on everyday Americans. The
social costs of insufficient infrastructure and underdeveloped transportation networks are
harder to measure, but equally striking. Motor vehicle crashes disproportionately affect
rural America, creating additional stress on underdeveloped areas of the country. Many in
this country long for functional public transportation system, but for those unable to
afford cars, the tolls and dysfunction of public transport is a very real and taxing problem.
White (2016) notes that “access to just about everything associated with upward mobility
and economic progress—jobs, quality food, and goods (at reasonable prices), healthcare,
and schooling— relies on the ability to get around in an efficient way, and for an
affordable price.”
Investing in infrastructure has direct impacts on economic growth. This is not
only because it brings more Americans into the economic fold, by allowing for access to
well-paying jobs and opportunity, but because it creates jobs and economic incentives for
businesses to disperse into less populated areas. The United States has historically used
focusing on infrastructure as a means to promote economic growth. This can be observed
when examining both the pre-Civil War era and measures of President Franklin D.
Roosevelt’s New Deal. Currently, the United States’ transportation networks have kept
pace with neither the country’s economic demands nor growth.

9
The National Economic Council and the Council of Economic Advisors (2014)
understand the economic advantages to investing in infrastructure. They outline the
specific ways in which the current state of transportation networks in the United States is
failing. They assert the inherent importance of a well-functioning, robust transportation
network in the United States:
A well-performing transportation network allows businesses to manage
inventories and transport goods more cheaply, access a variety of suppliers
and markets for their products, and get employees reliably to work. American
families benefit too: as consumers, from lower priced goods, and as workers,
by gaining better access to jobs. An efficient transportation network also
enables firms and people to locate near one another, so that they can benefit
from shared access to inputs of production… This is all the more vital as
regional economies with interdependent urban, suburban and rural areas
relying on each other for innovation, employment, and growth become more
important in manufacturing, energy, tourism, technology, and other US
industries.
Additionally, the report provides concrete evidence on how the United States is
falling behind other developed nations, further highlighting the need for increased
investment to ensure an effective, well maintained, and strong transportation system. The
National Economic Council and Council of Economic Advisors (2014, 4) also note the
social benefits to investing in transportation infrastructure, acknowledging that
investment can “benefit businesses and consumers alike through shorter and more
reliable travel times, resulting in direct and indirect benefits that ripple throughout the

10
economy.” Citizens of the United States rely on infrastructure for everything from clean
drinking water and stable flows of electricity to low transportation costs of goods.
Investing in physical infrastructure is a strong example of an inclusionary policy
that can revitalize underserved communities by more efficiently connecting them with
other urban areas, thus generating more economic growth. Kodrzycki and Muñoz (2015)
further emphasize the argument for long term infrastructure investment. The authors
explain: “The strongest influences on the relative fortunes of U.S central cities in the
second half of the twentieth century were their locations and economic histories – in
other words, predetermined attributes.” This supports the argument that physical location
often precludes cities from economic growth and therefore, increasing access to different
locations would ease these tensions. In examining cities that were able to recover, dubbed
“positive-turnaround cities,” Kodrzycki and Muñoz find that cities that are able to create
partnerships between the public and private sectors focused on long term goals, such as
“investing in public transportation and improving safety perception” were much more
likely to see effective and substantial recoveries. Therefore, the strategic importance of
investing in infrastructure and transportation networks can not only be used to grow the
economy, but can be used as a tool to specifically aid communities in distress.
The Opportunities in Infrastructure Investment As the United States prepares to adapt and capitalize on new technologies and
innovations to expand and grow our economy, there is another strong argument to be
made for investing in American infrastructure and transportation systems. Looking
forward, major executives at both Lyft and Uber have heightened the possibilities created
by the introduction of self-driving cars. Once heralded as an unlikely and utopian

11
technology, self-driving technology now promises to change the way American society
views transportation – and the main method of transportation – within the next decade.
Zimmer (2016) notes the how “[m]ost of us have grown up in cities built around the
automobile,” but implores his readers to imagine “what our world could look like if we
found a way to take most of these cars off the road. It would be a world with less traffic
and less pollution. A world where we need less parking — where streets can be narrowed
and sidewalks widened. It’s a world where we can construct new housing and small
businesses on parking lots across the country — or turn them into green spaces and parks.
That’s a world built around people, not cars.” Zimmer’s vision of the world is an
admirable one and one that, if carefully and intentionally implemented alongside the
massive reforms that need to occur in American infrastructure, could create economic
returns for this country.
If these changes are to take place, however, the United States will need to
intentionally increase investment in physical infrastructure in order to meet the country’s
growing needs. Actually investing in infrastructure is complicated and involves making
tradeoffs between different policy goals, bound by complex limitations. These tradeoffs
will be explored in this thesis. In particular, I will be examining the tradeoffs between
short termism and long term benefits, funding mechanisms and sources, and
distributional fairness as it relates to public private partnerships. Balancing these
considerations, along the need for both mass transit and solutions for individual car
owners, can be extraordinarily tricky. But if policy makers are cognizant of these
obstacles and can find success in hybrid policies, then the United States stands to see
substantial benefits for its citizens in both economic growth and opportunity.

12
Chapter 2: Trends and Background
The Rise of American Infrastructure During different eras, the United States has relied on investment in infrastructure to drive
economic growth and encourage economic activity. As the National Economic Council
and Council of Economic Advisors note, “investments by previous generations of
Americans – from the Erie Canal in 1807, to the Transcontinental Railroad in 1869, to the
Interstate Highway System in the 1950s and 1960s – were instrumental in putting the
country on a path for sustained economic growth, productivity increases, an unrivalled
national market for good and services, and international competitiveness” (National
Economic Council and the President’s Council of Economic Advisers 2014, 2). Historical
events and trends in the United States help explain the current state of infrastructure and
can serve provide useful context for policy makers who determined to forge a productive
path forward.
The first notable historical push for investment in infrastructure, with the specific
emphasis on spurring economic growth, was in the post-Great Depression era, fueled by
President Franklin Delano Roosevelt’s New Deal Program, specifically the Public Works
Administration (PWA) and the Works Progress Administration (WPA). While the
programs are often criticized for their inefficiencies and their inability to return the
country to pre-Depression levels of spending and financial stability, together, they were
responsible for over 480 airports, 78,000 bridges, and almost 40,00 public buildings
(Smith 2009, 2). What made the programs highly distinctive, however, was that funds
were spent in 3,068 out of the then 3,071 counties in the country (Smith 2009, 2). This
meant that these efforts included bridging counties together: in some cases, through
13
thousands of miles of highway construction. In investing in public works programs,
President Roosevelt and his administration focused on both relief and many believed that
“thanks to federally funded public works the nation was moving again, money was being
pumped into the economy, and people were going back to work” (Smith 2009, 8). While
most agree that the United States wartime production effort was what eventually pulled
the nation out of the Depression, the long-lasting infrastructure improvements made by
the PWA and WPA allowed for higher rates of efficiency and productivity for years to
come.
The second major push for increased infrastructure investment came after World
War II. President Eisenhower had become acutely aware of the need for improved
infrastructure and a better-connected country. He had seen the German “Autobahn” – the
highway system in Germany. The autobahn had provided Germans with strategic
advantages during the war but also allowed the Allied troops to swiftly move into
Germany and eventually win the war. President Eisenhower was determined to create an
equivalent American system of interstate highways and in the mid-1950s, upwards of 60
million motor vehicles had been registered in the United States, further emphasizing the
need for new roads (Petroski 2016, 48). Under President Eisenhower, the Federal-Aid
Highway Act was passed in 1956.
The Federal-Aid Highway Act of 1956 was an expansion of previous acts, such as
the Federal Aid Road Act of 1916, which allowed for the matching of state funds for
infrastructure purposes. Under the Federal-Aid Highway Act of 1956, $25 billion was
allocated to the construction of a “National System of Interstate and Defense Highways”.
This project was expected to take 12 years and pushed the federal share of costs to 90

14
percent. Additionally, the project “expedited the process of acquiring rights-of-way,
established standards for such physical features as lane and median width, and set a
completion date of 1972” (Petroski 2016, 48). Finally, the Federal-Aid Highway Act of
1956 established the Federal Highway Trust Fund. The Federal Highway Trust Fund is
increased through a federal tax on fuel. The original act was partly financed through the
Department of Defense budget for the year, emphasizing Eisenhower’s belief that an
efficient and highly interconnected transportation system was essential to the security of
the United States. It might be hard to imagine military vehicles traversing the now
familiar interstate system, but during the 1950s, the thought of warfare at home was a
tangible fear. The original interstate system was thought to be crucial for the movement
of military resources, personal, and materials. According to Lasswell’s garrison state
hypothesis (1941), this heightened awareness of national security increased national
deference to institutions such as the government and, in this way, worked to sway public
support of the project.
The Fall of American Infrastructure After the Federal-Aid Highway Act of 1956, federal spending continued to increase.
However, by the late 1950s and early 1960s, the cracks in the nation’s infrastructure
process were already starting to show. In 1959, President Eisenhower approved an
updated version of the Federal Aid High Way Act that increased the gas tax by 1 cent,
introduced after budget shortages just 3 years after the original bill was approved.
President Eisenhower, concerned about the long-term stability of the project, ordered a
study on the effectivity of the Interstate program, to “delineate Federal responsibility,
versus State and local responsibility, in financing, planning, and supervising the highway

15
program; and determine way of improving coordination between planning for Federal-aid
highways and State-local planning, especially urban planning” (Federal Highway
Administration). In the same year, Speaker of the House Sam Rayburn created a Special
Subcommittee on the Federal-Aid Highway Program to “investigate allegations of
corruption,” starting in Oklahoma, where State employees were facing allegations of
“double billing, improper wage practices, loose handling of public borrow pits, waste in
material flow, falsification of test samples, and gross laxity” (Federal Highway
Administration).
In the 1980s, it had become clear that there were systemic problems with
American infrastructure. In 1988, Governor Bill Clinton of Arkansas exclaimed, “Our
infrastructure is just barely adequate to support our current level of economic activity,
and our current rate of infrastructure improvement and investment falls vastly short of
tomorrow’s needs” (Petroski 2016, 14). In 1981, Choate and Walter released a report
titled, “America in Ruins: Beyond the Public Works Pork Barrel,” which drew public
attention to the issue at large and was eventually received front-page coverage by the
New York Times. In the report, Choate and Walter make an economic case for capital
investments in infrastructure to counteract cyclical financial distress and explained that
public facilities in America were decaying at a rate that was faster than they were being
maintained. Choate and Walter condemned the lack of spending in the 1970s, explaining
that they “undermined efforts to revitalize the economy and (threatened), in hundreds of
communities, the continuation of such basic services as fire protection, public
transportation, and water supplies” (Petroski 2016, 15).

16
The American Society of Civil Engineers (ASCE) had also begun to pay careful
attention to the state of infrastructure in the United States and issued its first “Report
Card for America’s Infrastructure” in 1998. This report has changed over the years but
has been updated often enough that it may be used as a measure of progress over the last
twenty years. The main changes have been to include different categories as they became
relevant and to remove categories that became redundant or unnecessary over time. For
example, in 2005, ASCE released a Report Card that included the category, “Security,”
as it was the first grade report released since the 9/11 attacks. However, this category was
later removed in 2009, as engineers had “begun to look at security in the context of
infrastructures overall resilience – or the ability to withstand and recover from both
natural and man-made hazards” (Petroski 2016, 23). Some additional categories,
however, have become permanent additions to the report, such as levees – added after
Hurricane Katrina caused unmeasurable damage in New Orleans. The introduction of
other categories, such as Rail in 2005, have been added to clarify subsections of other
categories. While commuter rail transit may be broken out from the Transit category
before 2005, the introduction of its own category allows Rail to include facets such as
freight railroad industry.

17
Figure 2.0. Infrastructure Report Card 1998 – 2017 (ASCE)
Category ASCE
1998
ASCE
2001
ASCE
2005
ASCE
2009
ASCE
2013
ASCE
2017
Roads D- D+ D D- D D
Bridges C- C C C C+ C+
Transit C C- D+ D D D-
Aviation C- D D+ D D D
Dams D D D D D D
Drinking Water D D D- D- D D
Wastewater D+ D D- D- D D+
Solid Waste C- C+ C+ C+ B- C+
Hazardous Waste D- D+ D D D D+
Schools F D- D D D D+
Inland Waterways D- D- D- D- D
Energy D+ D D+ D+ D+
Public Parks &
Recreation
C- C- C- D+
Rail C- C- C+ B
Levees D- D- D
Ports C C+
Average Grade D D+ D D D+ D+

18
The American Society of Civil Engineers was founded in 1852 and is the oldest
national engineering organization in the United States. Its members include “150,000
civil engineers in private practice, government, industry, and academia who are dedicated
to advancing the science and profession of civil engineering” (ASCE 2017). ASCE
assigns the grades in its report card based on a variety of different factors: capacity,
condition, funding, future need, operation and maintenance, public safety, resilience, and
innovation. ASCE scores each category of the Report Card in the context of demand for
that infrastructure – for example, the United States might have an objectively more
extensive transit network than it did in 1998, but the number of people who require transit
services is also disproportionately higher than it was in 1998. While some might argue
that ASCE has an incentive to skew perceptions of necessary investment such that it
members would benefit if investment was raised, ASCE extensively details its sources.
The sources include major government offices, such as the Congressional Budget Office,
the U.S. Department of Transportation, and the Environmental Protection Agency, who
all rely on their own measures of investment. The country’s infrastructure needs are hard
to measure for a variety of reasons, but the data presented by ASCE displays important
and notable trends.
The trends indicated through the progression of grades in ASCE’s Infrastructure
Report Card are abysmal to say the least. Only seven categories out of sixteen showed
any signs of improvement between 2013 and 2017. Moreover, only nine categories
showed improvement from between when they were first recorded and 2017. Among
these nine categories, the largest jump was from a C- to a B in Rail, which coincidentally
was highest grade in 2017. The categories that declined from 1998 to 2017 are Bridges,
19
Aviation, and Public Parks & Recreation. In 2017 Petroski rightfully observed “even the
casual observer, seeing…virtually all infrastructure categories receiving the mediocre and
poor grades in the C and D range since the late 1990s, cannot help but wonder why our
nation has not redoubled its efforts to improve our roads and bridges” (Petroski 2016,
25).
In 2009, the American Recovery and Reinvestment Act (ARRA) was passed.
ARRA had a variety of purposes, among which was long-term economic investment in
infrastructure, with $105.3 billion going to this end (Congressional Budget Office 2014).
Some of these transportation projects were financed in the form of Transportation
Investment Generating Economic Recovery (TIGER) grants, which allow for local and
state applications for funds for projects that “have a significant impact on the Nation, a
region, or metropolitan area” (United States Department of Transportation 2017).
However, federal funding of infrastructure has struggled to keep up with the country’s
transportation needs. The last federal bill to be passed authorizing funding for
infrastructure was the Fixing America’s Surface Transportation Act in 2015. The bill sets
aside an average of $56.2 billion per year for highway and transit programs over the
course of 2016-2020. The FAST Act has been criticized for “barely keep[ing] up with
inflation over this period of time,” thus meaning that the “overall federal transportation
funding level is close to flat” (ASCE 2016, 12). In inflation adjusted terms, the percent
change from 2008 to 2013 in funds available to States from the Federal Highway Trust
Fund is -10.9 percent. When adjusted to be a per capita basis, the percent change in
highway funding from 2008 to 2013 is -7.3 percent (The Associated Press 2013). In
2014, inflation-adjusted federal spending on highways was 23 percent of what it was in
20
2002 (ASCE 2016, 13). While at the state and local level funding for road maintenance
has been stable (inflation adjusted), the level of capital investment (new infrastructure
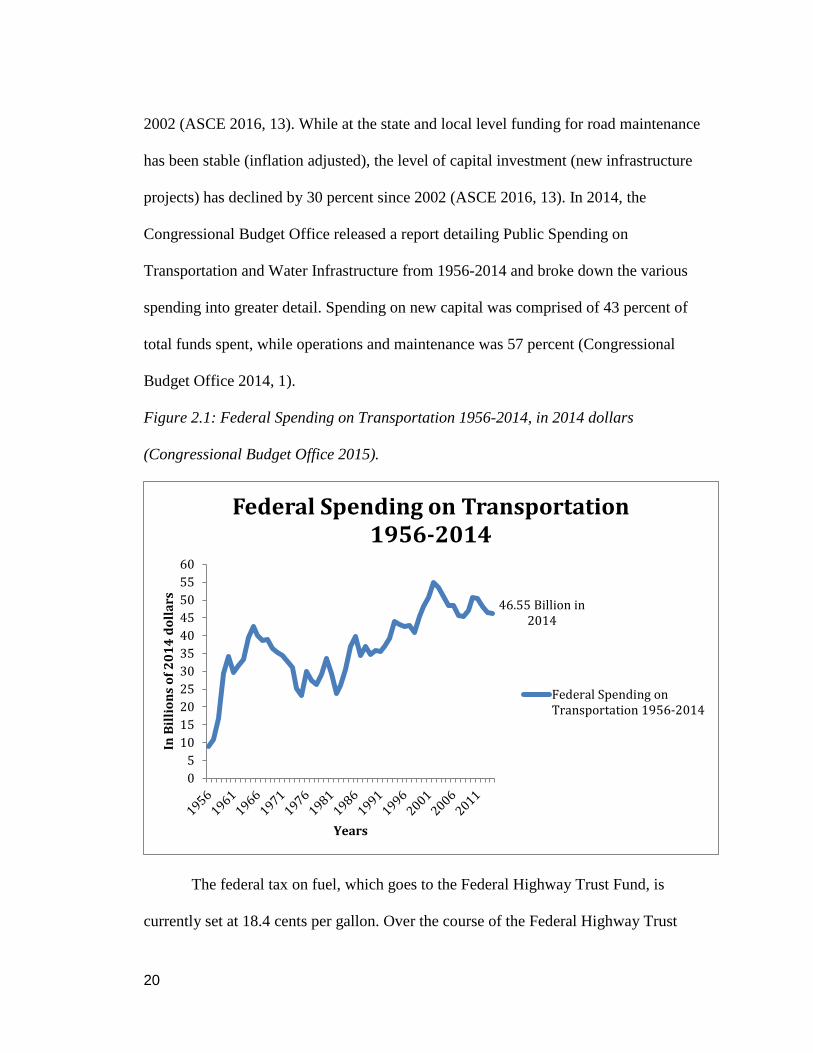
projects) has declined by 30 percent since 2002 (ASCE 2016, 13). In 2014, the
Congressional Budget Office released a report detailing Public Spending on
Transportation and Water Infrastructure from 1956-2014 and broke down the various
spending into greater detail. Spending on new capital was comprised of 43 percent of
total funds spent, while operations and maintenance was 57 percent (Congressional
Budget Office 2014, 1).
Figure 2.1: Federal Spending on Transportation 1956-2014, in 2014 dollars
(Congressional Budget Office 2015).
The federal tax on fuel, which goes to the Federal Highway Trust Fund, is
currently set at 18.4 cents per gallon. Over the course of the Federal Highway Trust
46.55 Billion in 2014
05
1015202530354045505560
In B
illio
ns o
f 201
4 do
llars
Years
Federal Spending on Transportation 1956-2014
Federal Spending onTransportation 1956-2014

21
Fund’s history, it has seen both surpluses and shortages. However, many believe that the
Federal Highway Trust Fund is problematic, as there is currently no mechanism to index
the gas tax to inflation or the amount that people are using the interstate system.
Additionally, as cars become increasing fuel efficient and many transition to electric cars,
the amount of fuel that is consumed in the United States will reduce substantially. Sales
of electric vehicles increased by 37 percent in the United States in 2016. Despite the
overall market share of electric vehicles is still low, many believe this market will
continue to grow (Forbes 2017). From 2010 to 2016, twenty-three states increased their
state gas taxes (thus increasing their state funding for highways), which has helped
counteract the overall federal reduction in investment (ASCE 2016, 13). In 2014,
Secretary Anthony Foxx, then Secretary of Transportation, noted that there was “still no
long-term certainty” regarding the future of the funding of the Federal Highway Trust
Fund.
Alternative Funding Routes As the United States continues to struggle with sustainable ways to fund infrastructure
expenditures, there are two other sources of funding to which people can turn. The first is
publicly owned toll roads. Public toll roads sound promising in theory, as the premise is
that the revenues earned from the tolls could be used to pay off the expenditures on that
specific highway project and eventually be reduced, and ultimately removed. However, in
practice, many projects require continued expensive maintenance and are therefore are
often difficult to completely “pay off.” This reality is often ignored by politicians and by
city planners who are optimistic about new projects, as it is unpleasant and does not
appeal to those who are used to not paying tolls on the existing roads. Additionally, once

22
tolls are established, if they start to provide revenue to the state beyond what the original
costs and current upkeep costs are, then it is in the state’s best interest to put that revenue
towards other infrastructure projects that it is looking to finance.
The second noteworthy source of funding is through public private partnerships
(PPP). Many believe that the private sector acts as a catalyst to make systems more
efficient and streamlined because actors in the private sectors often have one
straightforward motivator as opposed to the multitude of aims of the public sector. Public
private partnerships can be defined as, “a long-term contract between a private party and
a government entity, for providing a public asset or service, in which the private party
bears significant risk and management responsibility, and remuneration is linked to
performance" (World Bank Group 2015). There are many factors to consider when
contemplating whether PPPs can be a useful tool for improving infrastructure in the
United States. If it can be assumed that the chief incentive of a private sector organization
is to generate profit, what are the costs that are passed on to the “user” – in this case
citizens of the United States? Additionally, the profit incentive may lead to skewed
coverage of infrastructure projects, as private companies might only be interested in
higher income, more profitable areas of infrastructure rather than areas that are struggling
financially and could benefit from improved infrastructure. However, the profit incentive
for private corporations can also lead them to put up significant amounts of financing for
initial investments in projects, thus reducing the burden on government institutions to
provide capital up front.

23
Chapter 3: Conditioning Factors
Public Perception While investment in infrastructure is crucial for the United States, inefficient
infrastructure projects end up being unnecessarily costly and negatively affect public
perception of infrastructure projects. There are many examples of such projects in the
United States: Boston’s Big Dig, San Francisco’s Bay Bridge, the new Woodrow Wilson
Bridge in Washington D.C. (Flyvbjerg 2005). Flyvbjerg (2013) accounts for the approval
of such projects as due to inaccurate cost-benefit analyses, as well as inaccurate
environmental impact assessments. Many advocate for the increase for “shovel ready
projects,” but these – meant to describe projects that are for all intents and purposes ready
to go with the exception of adequate funding – are hard to define and often still are
subject to red tape. Petroski (2016, 142) notes shovel ready projects “may be politically
and economically expedient, but it is not necessarily going to result in any models of
engineering sense and architectural sensibility. It is true that there is much to repair and
replace in our aging infrastructure, but haste makes waste, and function without form
does not uplift the soul.”
When infrastructure projects experience failures, in the form of delays, additional
costs, and major disruptions, public perception of infrastructure projects is negatively
affected. Throughout the twentieth century, infrastructure projects have been notorious
for corruption, fraud, and waste. The expected inefficiency of infrastructure projects often
hides corruption: when people come to expect variances between budgeted estimates and
actual expenditures, fraud is easier to disguise. In the case of the San Francisco –
Oakland Bay Bridge, the preparatory process of repairing the bridge after the 1998 Loma
24
Prieta Earthquake was tedious and extremely lengthy. The California Department of
Transportation (Caltrans) went through a series of proposals, which increased in both
complexity and price with every passing year and it was not until 2013 that the newly
renovated bridge was completed. By the end of the process, Caltrans was undergoing a
thorough investigation for allowing taxpayer dollars to fund what its executives knew
was “substandard” work and actively working to hide the dysfunctions from public light.
The report led to public scrutiny of both Caltrans and the process by which infrastructure
projects are approved and awarded. After such disastrous projects, it truly is “no wonder
that the voting public, and by extension their representatives in Congress, lack
enthusiasm for raising taxes to fund infrastructure projects they might see as throwing
good money after bad” (Petroski 2016, 180).
Proactive Infrastructure Infrastructure does serve an important role in keeping American citizens safe during
unforeseen natural disasters. If infrastructure is not maintained properly and structurally
strong, then cities will take experiences longer times to full recovery. One example of this
can be seen through examining New Orleans and the levee failures it faced when
Hurricane Katrina hit in 2005. After multiple studies and investigations, it was found that
the city’s defense infrastructure, flood walls and levees, were poorly lacking in design
and construction. If the United States Army Corp of Engineers had invested more time
and consideration in building these original structures, then perhaps New Orleans might
not have suffered the catastrophic losses that it did. Other examples of infrastructure
failures include the I-35W Mississippi River Bridge in Minneapolis, the I-5 Skagit River
Bridge in Washington, and the San Francisco –Oakland Bay Bridge in 1989.

25
Infrastructure must be built with consideration for risk and “how infrastructure is built to
withstand (those risks) at a landscape level” (Miller 2017). In the event that the risks are
impossible to predict accurately, then the United States should consider “safe-to-fail”
designs which might not be fool proof, but do not make the problem worse either (Miller
2017).
Political Costs and Benefits Another obstacle many politicians must overcome for the United States to invest in
infrastructure projects is political “short termism.” Infrastructure projects, and especially
megaprojects, as defined by Flyvbjerg as costing one billion dollars or more, can often be
complex, operate across functional and organizational boundaries, and take much longer
than originally expected. Flyvbjerg argues that this is partially due to an
oversimplification of costs during the planning stage – companies that compete for large
project bids have incentives to be selective in how they measure costs, knowing that in
order to be chosen, they must keep costs within what they deem to be an acceptable
range, regardless of the true total cost (Flyvbjerg 2014). Additionally, “cost plus
contracts,” which allow for construction companies to be fully reimbursed for the
expenses they incur and then a set amount of profit, do very little to incentivize
construction companies to keep costs low and delays short. Since these infrastructure
projects are often multiyear affairs with high initial capital outlays, policy makers, whose
terms range from two to six years, might not see as much political gain in focusing on
infrastructure policy. Additionally, policy makers might have other priorities that they
deem more crucial than infrastructure investment. Many in the public sector face
constraints of time, money, and support from other funding sources and often these

26
constraints force tradeoffs among various goals. Without financial support from the
federal government, for example, the majority of major state and local infrastructure
projects are no longer feasible. Often, in highly contested campaigns, candidates feel
pressured to change their positions on issues based on the public perception and pander to
what they think is most likely to get them elected, even if they have access to or
knowledge of information that is contrary to those beliefs (Chipman 2016). Yet, if policy
makers can see political gain in investing in infrastructure, then they will be inclined to
work on these projects.
In order for infrastructure projects to be proposed and funded by policy makers, the
public must view these projects and investments favorably. Because public support
hinges on whether the perceived benefits of infrastructure projects outweigh the
perceived costs of the project, proponents of new initiatives must clarify the tradeoffs
between costs and benefits. While benefits might include shorter commute times, safer
routes, and many other positive changes in the long run, the immediate costs are obvious,
and problems of disruption are often highly visible. Poor management often leads to
delays and cost overruns. Insofar as citizens have short time horizons, anti-development
sentiment can arise. When groups from different areas have opposing beliefs about
proposed projects, due to differences in perceived costs, it leads to obvious social tension
over the project. Often residents believe that the proposed project should take place, but
in a way that does not affect them as much or as directly. Some have termed this
phenomenon “Not in My Back Yard” or “NIMBY-ism.” The costs of infrastructure
projects must be carefully considered – especially in cases where the groups who bear the
costs are not the groups who benefit from the projects.

27
In Los Angeles, there has been a tangible rise in NIMBY sentiment, with regard to
proposed light rails, high density housing, and other typical community improvement
measures. In some cases, affluent neighborhoods rally against proposed changes because
although changes might improve access for others, the affluent areas might bear the brunt
of cost. For example, many in Beverly Hills opposed the proposed Metro Purple Line
expansion, which would connect the traditionally high income Westside of Los Angeles
with Downtown. Los Angeles County Metropolitan Transportation Authority (Metro)
claims that the project is expected to “reduce reliance on automobiles, roadway
congestion and deterioration, and reduce travel times” (Los Angeles County Metropolitan
Transportation Authority 2015). Beverly Hills residents had claimed the main fault with
the proposed expansion is that the plans involved tunneling under Beverly Hills High,
which they believe to be a safety threat. The school commissioned two reports on the
projects, one of which, found that “the tunnel is therefore not likely to directly impact the
campus facilities (as we understand their current use)” (Shannon & Wilson Inc. 2012).
This finding is contrary to what residents claimed to be true. Additionally, Beverly Hill
High School leaders were strong advocates of moving one of the proposed stations to a
location in Santa Monica, but Metro officials refused because of concerns over a fault
line close to that location. In this example, Beverly Hill residents believed that the
imposed costs of construction on Wilshire Boulevard and perceived costs to Beverly Hills
outweighed the benefit of the expanded Purple Line for their own neighborhood and
therefore aggressively lobbied against the new project. After multiple lawsuits and a long
winded battle, Metro received $1.6 billion in Federal grants to move forward with the
project and aims to have parts of the project completed by 2024. Many in Los Angeles

28
have expressed frustration with Beverly Hill’s NIMBY behavior noting, “rich
neighborhoods waging expensive battles against public transit in L.A. remains a
questionable and disturbing endeavor” (Broverman 2017).
It is worth nothing that often public opinions of these projects can shift. While
neighborhoods might originally oppose infrastructure projects on the basis of its costs,
later the weight of various benefits might change. For example, while a group of people
might originally oppose the expansion of public transportation, deeming it unnecessary,
traffic might grow to be so unbearable that alternative transit options provide previously
unproductive benefits. Alternatively, environmental concerns could rise to be more
pertinent, thus increasing the need for mass transit options.
Public Private Partnerships: Build, Operate, Transfer If the public sector is unable to fund and effectively execute infrastructure projects, then
in order to maintain and keep up with the United States’ infrastructure needs, they will
have to look to private investment. One model of a public private partnership (PPP)
policy makers could investigate and encourage is the “Build, Operate, and Transfer”
(BOT) model. The BOT model might also involve other functions such as design or
ownership. Under the BOT model, private companies work with the government to
obtain any rights they might need, build infrastructure projects from start to finish,
operate the project and receive revenues from the project until a pre-determined date,
after which they transfer ownership to the government. In some cases, the revenues are
“obtained from user fees (as in toll roads) or from payments by the government’s
procuring authority” (Engel and Fischer and Galetovic 2010, 41). There are many
different variations of BOT projects as they are highly dependent on the “the fiscal, legal,

29
and physical pond the (private actor) swims in” and can be “different from day to day,
country to country, and projects,” but if successful, they provide a good model for what
mutual beneficial PPPs can look like (Walker and Smith 1995, 24).
Under successful PPPs, there are aligned incentives for both public and private sector
actors and BOT projects work to ensure such alignment. Private investment can provide
the initial capital outlays for projects, which is a highly significant obstacle for otherwise
entirely publicly funded projects to overcome. BOTS allow policy makers to move
forward with projects “without immediately raising taxes, tolls, or public debt” (Petroski
2016, 269). Private actors will be willing to take on initial costs because the initial
amount would still be less than “projections of revenue throughout the lifetime of the
agreement, which might run for fifty years or more,” thus creating a positive net present
value for the private actor (Petroski 2016, 264). The public sector would eventually gain
ownership of the project, in some cases with the private actor still responsible for upkeep
and maintenance of the project. This is symbolic on multiple fronts because the only
major cost that the public sector has incurred is giving the private actor the rights to use
the land and the permits for building, etc. Thus, it can appear that the government is
gaining “something for nothing,” as the private actor has built a public works project and
transfers it over without an exchange cost. This sort of transfer reinforces the idea that
infrastructure projects are intended to be public works projects and should eventually be
property of government entities.
Complexity of infrastructure projects is often exacerbated by interactions of the many
groups that are involved with projects. Such groups involve designers, contractors,
construction companies, various insurance companies, and regulatory agencies. These

30
groups might have different interests in the project’s long-term success and durability.
For example, unless the designers and their construction counterparts work closely
together, actual projects might deviate from their original proposed structure, in order to
minimize or alter a timeline in the face of costly delays. In BOTs, the incentives for
ensuring long-term success and durability are high – since the private actor will be
responsible for the upkeep for the length of the contract. In an effort to fight moral
hazard, the private financing entities “disburse funds only gradually as project stages are
completed” (Engel and Fischer and Galetovic 2010, 45). When construction and
operation considerations are taken into account together, it “forces investors to internalize
operation and maintenance costs sand generates incentives to design the project so that it
minimizes life cycle costs. But perhaps even more importantly, when builders are
responsible for enforceable service standards, they have an incentive to consider them
when designing the project” (Engel and Fischer and Galetovic 2010, 41).
BOT projects can also pose certain difficulties for policy makers. Because citizens
will not often be able to distinguish projects that are run by the public sector or the
private sector, if BOT projects hit obstacles and start to impose excessive costs on
citizens, they will, in turn, incorrectly retaliate against policy makers. Alternatively, this
could benefit policy makers by attributing successes of all infrastructure projects to the
public sector. To minimize public backlash, policy makers should work to ensure that
there are proper incentives for private actors to perform to predetermined standards. Of
course, private actors are already incentivized by on-time revenue payments.
The effectiveness of BOT projects also leads some to criticize the public sector for
not being able to undertake the same projects itself. One factor is that the cost of raising

31
capital for private actors is much higher than it would be for governments. Some refer to
this as the “PPP premium.” This is because private project finance interest rates are likely
to be much higher than the interest rates that the government pays. However, some
believe that the government is an anomaly in that the government will often be
considered “low risk” and therefore is privy to misleading interest rates that do not
accurately reflect the risk actually incurred in infrastructure projects. Another criticism is
that any benefit gained by the government by avoiding initial capital outlays is negated
by the relinquishment of future user fee revenues that it hands over to the private actor
(Engel and Fischer and Galetovic 2010, 65). However, since the scarcity of public funds
for initial capital outlays is one of the major hurdles to whether infrastructure projects
move forward at all, the benefits of having a private actor take on this responsibility are
multiplied. Additionally, the Secretary of Transportation can authorize “Private Activity
Bonds” (PABs), which are bonds that are “issued by a conduit on behalf of a private
entity for highway and freight transfer projects,” which allows for the private actors to
benefit from the lower interest rates typically allowed for a tax-exempt municipal bond
(Federal Highway Administration).
If policy makers look to BOT projects to serve the United States’ infrastructure
needs, then policy makers should ensure that they are approaching negotiations from a
position of strength rather than desperation. In some cases, if policy makers see the
urgent need for new infrastructure, but are severely limited in their funds then, “a
potential partnership with private investors can appear to be a godsend” (Petroski 2016,
269). In negotiating these contracts, however, obviously both sides are aiming to benefit.
When policy makers come to the table desperate for a solution, they are more likely to

32
agree to terms that might be beneficial in the short term, but detrimental in the long run.
For example, in 2009, Chicago entered into an agreement with an infrastructure
investment fund backed by Morgan Stanley, in which the fund would gain control of the
thirty-six thousand metered parking spots in the city for 75 years, in exchange for an
upfront fee of $1.2 billion. The initial influx of cash was quite welcome to the city, which
was facing a budget deficit, but half a year later, “a report revealed that, according to an
estimate made by the city’s inspector general, had Chicago retained control of the meters
and operate them itself, it could have realized almost 1 billion more than it would get
over the course of the lease” (Petroski 2016, 265).
While PPPs and BOTs provide a unique opportunity for policy makers to bypass
traditional public sector inefficiency and hurdles, it remains the ultimate responsibility of
the government to be able to fund and create infrastructure for all its citizens. BOT
projects are attractive to private actors because of the user-generated revenue they can
create in, for example, privately-operated toll roads. Therefore, private actors are unlikely
to be interested in projects located in in lower income areas that are unlikely to generate
such revenues. However, these areas might require heavy maintenance on existing
infrastructure or new projects most urgently. The government has a duty to provide for all
its citizens equally and fairly. If policy makers are heavily dependent on BOTs, some
areas will benefit more than others, and it remains the government’s job to balance out
these inequities out by being able to fund infrastructure projects themselves. As
previously discussed, however, the government is currently struggling to fund
infrastructure projects to adequately meet the public’s needs. The current funding
mechanism for the Federal Highway System is the Federal Highway Trust Fund, which

33
has been unable to keep up with current infrastructure needs. This funding mechanism,
therefore, is in dire need of updates and reform. If policy makers are able to increase
government spending on infrastructure to meet demonstrated public needs, then overall
government expenditures will increase, often improving economic performance. Keynes
argued that increased government expenditures would have multiplier effects on GDP,
due to an increase in aggregate demand. While some argue over the merits of Keynes’
argument and the size of the multiplier itself, the potential for short-term benefits of
increased investment in infrastructure need to be considered. These can be seen through
increased employment rates, especially in the wake of the 2008 housing crash and the
widespread unemployment of construction workers that followed. Additionally, spending
on infrastructure creates jobs in manufacturing, retail, and professional and business
services. This is because increased infrastructure investment requires a myriad of skills
and resources, such as “grading and paving equipment, gasoline or diesel to run the
machines, smaller hand tools of all sorts, raw inputs of cement, gravel, and asphalt,
surveyors to map the site, engineers and site managers, and even accountants to keep
track of costs” (Council of Economic Advisors 2014). Additionally, new infrastructure
often connects areas and create new centers of economic activity.

34
Figure 3.0: Distribution of Job Growth by Sector (Council of Economic Advisors
(2014) analysis of Bureau of Economic Analysis and Bureau of Labor Statistics (2012)
In a polarized and partisan era of politics, it is hard to find common ground
among policy makers. With parties disagreeing on a wide range of emotionally charged
issues, including immigration, foreign policy, and social issues, it is clear why
infrastructure and transportation policy has fallen by the wayside. The issue is not flashy
and understandably does not garner the same sort of media coverage or electorate
attention as other issues on the national spotlight. The problems with infrastructure might
not be highly contentious, but they do affect the everyday American on a significant and
consistent basis. If policy makers can find a way to gain public support and make
substantial changes to the current status quo, then the United States stands to see
substantial and tangible both economic and social benefits.
Professional and Business
Services, 6% Retail Trade, 6%
Manufacturing, 10%
Other, 10%Construction, 68%
Distribution of Jobs Created by Infrastructure Investment by Sector

35
Chapter 4: Projections The United States’ infrastructure is deficient in a myriad of ways: faulty bridges,
deteriorating roads, inefficient routing, and inaccurate and costly construction processes.
The current state of infrastructure poses seemingly endless challenges, but they also
provide a unique opportunity. Recent advances in technology present the ability not just
to build new infrastructure, but to build smarter infrastructure. These changes allow for
advances that could reduce maintenance costs, system inefficiencies, and increase safety
measures. In addition to the opportunity that these technological advances present, the
fact that the United States has such a high need for infrastructure investment provides an
opportunity to fundamentally redesign urban areas in a way that is more productive and
beneficial for society.
Changes in Cars There are two kinds of technical advancements that are important to note: ones that will
change cars and, in turn, change the way people drive and affect their infrastructure needs
and ones that change the way that infrastructure is built. Technologically advanced cars
are already hitting the market and becoming available to mass consumers. These
advances can take many forms from beeping noises that alert the driver, whose car is too
close to another car, to complete automation and self-driving technology. One innovation
is “connectivity zones” for cars, wireless networks within certain a radius around each
car. Cars would be fitted with computers and would connect to this wireless network.
Once part of the connectivity zone, each car’s location would be uploaded and thus, all
cars within the connectivity zone could interact with respect to other cars’ locations in
relation to their own. This could be particularly impactful, especially when scaled up and

36
adopted by all cars on the road. This can be used when cars are on the highway, for
example, to ensure that all cars in a certain area are traveling at the same speed for
maximum efficiency. When one car abruptly slows down, the following cars are instantly
alerted and can alter their speed to avoid any collisions. This connectivity is also useful in
an urban setting, where awareness of other vehicular behavior is paramount. For
example:
if all vehicles in the vicinity of an upcoming intersection were part of the
wireless network, the computer in a car approaching the intersection could
know whether there would be cross traffic. If so, the driver would be
alerted to approach with caution or stop, and perhaps even have a bright
electronic stop sign displayed on a navigation screen…If the intersection
is anticipated to be clear, no warning would appear and the car would not
even have to slow down (Petroski 2016, 275).
If all vehicles were equipped with this system, cities would have lower costs of enforcing
speed limits, maintaining roadway signs, and fewer traffic related casualties.
Additionally, citizens would experience immeasurable improvements in road safety and
countless hours saved in traffic.
Changes in Infrastructure Technological advances that affect the way that infrastructure is constructed will also
significantly benefit American infrastructure. One example is new types of “self-healing”
asphalt that are being tested in the Netherlands and China (Chen 2017). If these
inventions work as expected, initial capital outlays for road projects would be higher but
the long-term savings would be monumental for the United States. Another innovation
37
that could provide sizeable benefits is in sensors that monitor structural strength, in the
form of:
pieces of smart infrastructure that in essence monitor themselves
and alert engineers and others when they are in need of attention. A
roadway can be embedded with sensors that detect snow and ice
conditions, signaling when road crews should be dispatched. Bridges can
be fitted not only with sensors but also with devices controlled by the
sensors. Thus, when ice begins to develop on a bridge surface the sensors
that detect it can also trigger a system embedded in the curb or guardrail
that sprays anti-icing solution over the pavement without human
intervention (Petroski 2016, 273).
Additionally, sensors and devices, akin to those that “tell a smartphone or tablet
which way is up,” could be incorporated into bridge designs that would signal to
performance monitors when usage or unplanned events lead to structural deficiencies,
during routine passes over the bridge by “computer – and sensor – filled trucks” (Petroski
2016, 273). The introduction of such technology can have substantial cost-reduction
effects: decreasing the necessity of expensive exploratory measures, decreasing the
likelihood of bridge failures, and identifying causes of deficiencies. If maintenance crews
know exactly how the bridge is failing, then repair times are reduced and overall
efficiency of the maintenance process is increased.
In South Carolina, for example, at least eight bridges have been fitted with girder
sensors, for $50,000 per bridge. In 2014, these had already created cost savings for the
taxpayer of up to $5 million (Chieppo 2014). In addition to cost related benefits, South

38
Carolina Department of Transportation (SCDOT) has found the sensors to create other
efficiencies. For example, sensors are able to accurately measure wind speed, which
“allows SCDOT to know when to close a bridge without, for example, having to send an
employee to site during an approaching hurricane” (Chieppo 2014). Furthermore,
agencies can set up alerts if the bridges are facing certain conditions, such as drivers who
are driving vehicles above weight or height limits. In these cases, they can penalize those
drivers who might be causing the most harm to the structure in the forms of tickets and
fees, thus creating incentives to avoid risky behavior.
Data and Apps In addition to technology advancements that should eventually be built into both vehicles
and infrastructure, specific actions that are made possible by technological advancements
can be implemented currently at minimal cost. StreetBump, a mobile application
developed by the City of Boston’s Mayor’s Office of New Urban Mechanics, allows
volunteers to collect road condition data while traveling their normal routines. The
phone’s built in accelerometer “detects bumps, and software distinguishes a bump due to
hitting a pothole from one due to riding over a manhole or speed bump” Petroski 2016,
275). At the end of the trip, the data is collated with GPS locations and an alert is sent to
the city’s road maintenance department. In this way, potholes can be specially targeted
and repaired in a much more efficient manner. This sort of data crowd sourcing has
increasingly touted as a mechanism to measure infrastructure needs and growth.
Placemeter, a startup based in New York, pays users “up to $50 a month for street views
captured via old smartphones” (Jaffe 2014). The company then analyzes the footage from
people’s windows and turns it into data. These data are sold to companies for advertising

39
purposes and to make cities more efficient and functional places. Policy makers could
also use these data to “detect the use of benches or near misses at intersections – and
generally evaluation (and perhaps improve) public projects more quickly than they might
otherwise” (Jaffe 2014). Kansas City recently built a light rail line along which city
officials installed “computer-equipped sensors on streetlights,” which are able to “gather
information about traffic and available street parking along the corridor” (Totty 2017).
They have even made the data publicly available, in order for citizens to find open
parking spots and identify areas with heavy traffic (Totty 2017). The sensor can also
automatically dim if no one is around, and in this way conserve energy. Bob Bennet, the
Chief Innovation Officer of Kansas City, says that their goal is to “improve their
efficiency of service and ascertain what services we ought to be providing” (Totty 2017).
As society gains familiarity with technological advancements like machine
learning, humanized big data and the growth of cloud services, and the internet of things,
it is likely that our transportation systems will be built smarter and more efficiently (Totty
2017). This amplifies the imperative to invest in our systems now, since “whether our
roads and bridges can actually evolve to such an idyllic state in the foreseeable future will
depends upon how well we care for them in the interim... Almost every dollar budgeted
for roads and bridges, whether at the federal, state, or local level, will have to be
earmarked for repair and replacement work just to restore the status quo ante rather than
advance the technology and apply it broadly” (Petroski 2016, 278). A precondition for
being able to make the most of these advancements is not having urgent deficiencies and
repairs to crowd out any new or technologically motivated investments.
The Effects of Investing in Infrastructure on American Cities

40
The need for more productive physical infrastructure in the United States creates
an opportunity for civil engineers, city planners, and other policy makers to also
fundamentally reimagine what cities and urban areas look like. Currently, American
cities are characterized by wide streets and large parking lots and structures. They are
built around the country’s reliance on cars. As the automobile became more affordable
and common place in the United States, roads became increasingly relevant and
important in major cities. In some cases, this change had immediate effects on
communities: “…city planners wanted to make it as easy as possible for drivers to access
metropolitan areas. That often meant building highways straight through the centers of
our most vibrant cities. Neighborhoods were literally split in half, and many never
recovered” (Zimmer 2016). This is additionally reflected in just how much space is taken
up by parking lots, with some lower estimates being up to 3,590 square miles – greater
than the combined areas of Delaware and Rhode Island (Kimmelman 2012).
Technological advancement can decrease the country’s dependence on automobiles – and
that can have tangible and discernable effects on what American cities can look like.
With the introduction and normalization of self-driving cars, American car
ownership could dramatically decrease. The average car owner in America is spending
around $8,500 annually on car ownership, based on estimates of 15,000 miles driven
annually (AAA 2017). Collectively, “Americans spend more than $2 trillion every year
on car ownership – more money than (Americans) spend on food” (Zimmer 2016). With
the rise of ride-share technology (and trends of urbanization), fewer people are buying
cars than before. Some do not bother learning how to drive – the number of 18 year olds
who have their driver’s licenses is down 20 percent from 1983 to 2017(Sivak, Schoettle

41
2016). The downward trend is consistent across all other ages as well, except for those
older than 50 (Sivak, Schoettle 2016). Some estimates even have Millennials as 29
percent less likely to purchase cars (Cortright 2015).
Without lower rates of individual ownership of cars, cities will look be palpably
different. This change has already started to take root and can be seen around the world,
in addition to the United States. In New York City, Mayor Bloomberg has worked to
convert spaces traditionally reserved for cars or parking to public or community areas. In
addition to building community, these transitions have secondary benefits for the areas
they are located. For example, the “parking lot below the Manhattan Bridge, is now a
plaza where New Yorkers go to eat lunch and spend time with friends. Just five years
after reclaiming this space from cars, retail sales in the surrounding area increased 172%”
(Sadik-Khan and Solomonow 2017, 254). This presents an important opportunity to
policy makers in the United States. There is a need to invest in productive physical
infrastructure – but can they do this while designing cities that meet citizen’s need for
infrastructure, but also other needs as well?
One technological advancement that could have extreme effects on the way that
American cities look is self-driving technology, and, with it, the automation of parking
and parking lots. When self-driving technology becomes fully street legal – and it will, by
many estimations, far sooner than often believed – then the need for parking lots will
potentially be greatly diminished. This is because when passengers reach their
destination, they could choose to rent out the services of their fully capable and self-
driving vehicles, instead of, by default, parking their vehicle for the duration that they
will be staying at their destination. As of 2013, the average automobile is parked for

42
around 95% of the time (Barter 2013). Of course, there will be a need for parking lots,
but with the car to car connectivity zones discussed previously, parking lots could be
made far more efficient and automated. They could be underground and more compact
without needing to account for human error.
Some infrastructure improvements will happen slowly – cities are unlikely to
retrofit their bridges, roads, and cities without compelling inadequacies and adequate
funding. But as routine maintenance is performed, hopefully over time, cities will start to
opt for technologically savvy solutions to the problems they have been experiencing for
decades. Others have lofty plans to build entirely new cities from scratch – and use them
as a model to learn about what works and what does not. This begs the question: How can
policy makers be sure that the technology that they might pay millions to install now will
not be over shadowed by advances made tomorrow?
This dilemma will likely continue. It is a challenging and complex problem to
solve, but there are two paths that policy makers can take to alleviate the effects. First,
policy makers can determine what areas are of most concern to them. Then, policy
makers should follow advancements that are in the most urgent areas. For example, if a
state has a lot of waterways and spends a large portion of its budget on bridge
maintenance, it could prioritize incorporating technological advancements that would
allow it to reduce maintenance costs and build structures that are more physically
durable. Alternatively, if a state is characterized by large urban centers, policy makers
could look at technological advancements that reduce congestion, streamline traffic, and
making parking more efficient. After explicitly outlining their priorities, policy makers
should decide on specific measurable outcomes and then confer with independent experts

43
to determine what sorts of advancements would meet these goals. In this way, policy
experts continue to make progress within pre-determined guidelines on what is “good
enough,” rather than being directionless and overwhelmed by choices. These priorities
and guidelines should be periodically updated and reviewed, in order to ensure that they
stay relevant. Additionally, in the face of ever evolving technology, outcomes that were
previously thought to be unachievable might become more plausible.
Another path policy makers can take is through using technology that allows for
periodic updates. Since many advances would be accomplished through computerizing
everyday devices when improvements are made to that technology, the cars could
download those improvements. These updates will be of the utmost importance,
especially with regard to self-driving cars and automated vehicular processes, as
engineers continue to improve the systems based on the influx of data that will come with
mass use. By adopting technology with open architecture, policy makers can ensure that
their systems and infrastructure will stay up to date and will continually improve.
The secondary effects from investing in infrastructure are remarkable and should
remind policy makers and citizens why investing in infrastructure poses such a crucial
opportunity. Technological advances also provide a compelling reason to start now. By
funding and solving the country’s most urgent infrastructure needs now, policy makers
set the stage for more durable, efficient, and technologically advanced infrastructure later.
And by phasing in those technological advancements where feasible now, policy makers
reduce the need for increased infrastructure later.

44
Chapter 5: Recommendations and Concluding Thoughts As outlined in previous chapters, the costs and opportunities associated with
infrastructure investment are numerous. They are well documented, notable, and urgent.
Many agree that the United States needs to invest a significant amount in order to bring
infrastructure to an acceptable level. However, policy makers face major obstacles in
trying to strengthen physical infrastructure in the United States. These obstacles are
mostly in the form of tradeoffs and limitations. The tradeoffs and limitations are intricate
and pose a challenge for policy makers, who must balance the United States’
infrastructure needs alongside many other needs. In order to create good policies, policy
makers must balance these tradeoffs and carefully consider the effects they can have on
implemented policies. Understanding the tradeoffs involved with constructing effective
infrastructure policy is also valuable for policy makers because it allows them to clarify
their problem definitions. More specific and nuanced problem definitions allow policy
makers to craft effective and detailed solutions, rather than broad, one-size-fits-all
policies.
Tradeoffs One tradeoff policy makers must carefully consider is the targeting of funding.
First, policy makers must decide what types of projects take precedence – should new
capital expenditures be prioritized over maintenance and upkeep of older infrastructure?
How should policy makers value the utility that created by new roads, when there is
barely enough available funding for the upkeep of already constructed roads? From here,
policy makers might struggle to determine how these funds should be raised in the first
place. Many state and local projects are unlikely to be completed without some federal

45
assistance. But should federal taxes be spent on projects that do not benefit all taxpayers?
For example, if a mass transit project is planned in an urban area, what benefits are
created for taxpayers who live in rural areas far from the city? The alternative to using
federal funding would be to specifically pass all upfront costs to the users of the system
in, for example, the form of increased ticket prices or toll roads. These users, however,
might not be able to afford these excessive costs.
This dilemma is central to the next major tradeoff that policy makers face when
considering investing in infrastructure, which revolves around distributional justice. How
can policy makers ensure that every citizens’ infrastructure needs are met? PPPs and
BOTs create a compelling opportunity for policy makers, by allowing private entities to
finance, build, and operate infrastructure projects and receive revenues from the project,
before eventually transferring ownership to the government. These projects are important
for policy makers to consider because they essentially remove the need for initial capital
expenditures for government entities, which is one of the largest hurdles potential
projects face. However, as discussed in Chapter 3, revenue streams are essential to
incentivizing private actors to put up the initial costs of the problem. Low-income areas,
which will likely be unable to generate these revenue streams, are unlikely to appeal to
private entities as areas for possible infrastructure investment. This is a problem because
low-income areas are often the areas that have the most urgent infrastructure needs. How
should policy makers utilize BOT projects, while ensuring that the utility created by those
projects benefits all citizens fairly?
Another component of distributional justice is the tradeoff between investment in
mass transit, in lieu of infrastructure investments in roads and bridges that would benefit

46
individual drivers more. Since policy makers are limited by both federal and sub-national
budgets, they need to prioritize certain projects over others. Investing in mass transit is
important, as it reduces congestion, harmful environmental effects, and allows citizens
more choice and flexibility. However, it is complex to introduce comprehensive mass
transit systems to already developed cities. For example, if a mature city wants to
introduce an underground transit system, it would have to incur extreme costs and likely
face many regulatory hurdles along the way. Investing in mass transit also prioritizes the
needs of citizens who live in areas that can easily access the system. And while
infrastructure investments in roads and bridges are important, they prioritize the needs of
those who can afford cars and further emphasize the pervasive idea that car ownership is
paramount in the United States.
In addition to distributional fairness, another tradeoff that policy makers face is
balancing short term costs with long-term benefits. This is especially relevant when
considering public perception and support for projects. Most infrastructure projects are
lengthy and are characterized by delays and costly overruns. Therefore, these projects,
which might lead to substantial improvements for the community, are often hard to
digest, as people tend to have short time horizons and are usually fixated on the costs
incurred upfront. Additionally, policy makers face challenges regarding the timing of
capital outlays. There are myriad ways that a given proposal for an infrastructure project
could be improved and developed further. Some of these additions might substantially
reduce the cost of maintenance further down the line. So should policy makers spend
more money now to reduce costs later and build American infrastructure to last? Or
should policy makers delay the costs and gain more support for less expensive projects

47
now? Policy makers often issue bonds in an effort to generate capital for investment in
infrastructure projects as well. The government is responsible for paying the bonds off at
the end of their terms. In this way, policy makers often delay the costs of investing in
infrastructure. But if policy makers prioritize balanced budgets, then during the terms of
the bond, the government must find a way to raise that capital and the interest that has
accrued. Policy makers also face the dilemma of balancing short-term costs with long
term benefits when examining potential BOT projects. When government actors agree to
BOT projects, they forgo revenue streams generated by the project in the future for a
fixed number of years.
If policy makers have a detailed understanding of these nuanced tradeoffs and
limitations, then they will be able to craft accurate problem definitions. Geva-May (1997,
2) explains how complicated this can be: “First, a problem situation implies a discrepancy
between needs and wants, or between expectations and possibilities; some problems may
infer more than one cause for the problem. Second, clients tend to present ‘symptoms’ or
troubling alternatives rather than formulate the overall problem in a coherent analytic
way that allows a follow-up examination.” Appropriate definitions are paramount for
policy makers to be able to create functional solutions to complex policy problems. For
example, if the problem definition is simply “The United States is facing serious
deficiencies in the country’s infrastructure,” then the solution might be so simple as, “The
United States should invest in the country’s infrastructure and solve those deficiencies.”
However, as outlined above, that is an oversimplified response and does very little in
terms of developing equitable, durable, and robust policies that meet citizens’ needs.

48
Recommendations What should policy makers do in face of such challenging tradeoffs? It is likely that
policy makers will find the most success in the hybridizations of different options. For
example, rather than considering BOT projects as the be-all and end-all to solve the
United States’ infrastructure crisis, policy makers should only consider engaging in BOT
projects in parts of the country that can afford them. At the same time, policy makers
should focus on reforming the Highway Trust Fund, by indexing the tax it imposes to gas
prices. This would generate funds for publicly-funded infrastructure investment, where
BOTs are not feasible.
Additionally, it is of the utmost importance that policy makers engage and
educate the public regarding these nuanced challenges surrounding the urgent need for
increased infrastructure investment. While a poll conducted in 2017 showed that 79
percent approve of increased infrastructure spending, these sentiments are not reflected in
voting results. It is important for the public to reconcile that those same projects might
impose costs on citizens in the short term (Agiesta 2017). Without public support, it is
unlikely that policy makers will be able to be as effective and accomplish as much as
possible. Policy makers can invoke certain appeal principles, in order to effectively
engage the public and build public support (Lasswell 1932). This education can come in
the form of explicitly outlined policy priorities or in town halls held to explain proposed
projects to the public. When citizens feel they have been included in the policy process, it
is more likely that they will support proposed infrastructure projects.

49
Final Thoughts Infrastructure investment is a challenging topic to take on because the tradeoffs that
policy makers need to consider are elaborate. It can be daunting to create solutions and
the pursuit of perfect policies is endless. But the difficulty inherent in policy process is
matched by the opportunity that infrastructure presents. The current inadequate
infrastructure of the United States affects most Americans on a daily basis and, if policy
makers can raise enough public support, policy makers can affect real change in the
United States, especially through technologically advanced and exciting new innovations
in infrastructure. As Petroski (2016, 278) notes, “Neither voters nor elected officials
should be satisfied with or tolerate the mediocre to poor infrastructure that we are told
our nation now possesses. In fact, we should be embarrassed. We as a nation should want
our public works to be better than they are.” Petroski is right – while the United States
succeeds by many different measures on a global scale, the country is failing its citizens
at home by not adequately investing in infrastructure.

50
References “An economic analysis of transportation infrastructure investment." 2014. Accessed November 4, 2016. https://obamawhitehouse.archives.gov/sites/default/files/docs/economic_analysis_of_transportation_investments.pdf "2013 Report Card for America's Infrastructure." 2013 Report Card for America's Infrastructure | Books. Accessed December 01, 2017. http://ascelibrary.org/doi/book/10.1061/9780784478837. Agiesta, Jennifer. “CNN/ORC poll: Most back boost in infrastructure spending, oppose growing military budget.” CNN, Cable News Network, 8 Mar. 2017, www.cnn.com/2017/03/08/politics/donald-trump-poll-spending-defense-infrastructure/index.html?adkey=bn. "America's Grades." ASCE's 2017 Infrastructure Report Card. 2016. Accessed October 17, 2017. https://www.infrastructurereportcard.org/. Barter, Paul. ""Cars are parked 95% of the time". Let's check!" Reinventing Parking. February 22, 2013. Accessed December 01, 2017. http://www.reinventingparking.org/2013/02/cars-are-parked-95-of-time-lets-check.html. Broverman, Neal. "Bev Hills-Funded Study Favors Tunneling Under BH High, City Still Up to Fight It." Curbed LA. April 05, 2012. Accessed November 12, 2017. https://la.curbed.com/2012/4/5/10381984/bev-hillsfunded-study-favors-tunneling-under-bh-high-city-still. Broverman, Neal. "Beverly Hills Finally Loses Its Crazy, Stupid Subway Battle." Los Angeles Magazine. January 05, 2017. Accessed November 12, 2017. http://www.lamag.com/driver/beverly-hills-finally-loses-crazy-stupid-subway-battle/.
Canning, David, and Marianne Fay. The Effect on Transportation Networks on Economic Growth. Report. Economics, Columbia University. 1993. Chandra, Amitabh, and Eric Thompson. "Does public infrastructure affect economic activity?" Regional Science and Urban Economics30, no. 4 (2000): 457-90. doi:10.1016/s0166-0462(00)00040-5.
Chen, Angela. "Have scientists discovered the cure for potholes?" The Verge. May 04, 2017. Accessed November 19, 2017. https://www.theverge.com/2017/5/4/15544156/potholes-self-healing-materials-infrastructure-transportation.

51
Chieppo, Charles. "How Technology Can Stretch Infrastructure Dollars." Governing magazine: State and local government news for America's leaders. July 9, 2014. Accessed December 01, 2017. http://www.governing.com/blogs/bfc/col-infrastructure-maintenance-cost-south-carolina-bridge-monitoring.html.
Chipman, Ian. "Political Machinations: How Candidates Cater to — and Shape — Public Opinion." Insights by Stanford Business. February 2016. Accessed November 12, 2017. https://www.gsb.stanford.edu/insights/political-machinations-how-candidates-cater-shape-public-opinion.
Cortright, Joe. "Young People Are Buying Fewer Cars." City Observatory. April 23, 2015. Accessed December 01, 2017. http://cityobservatory.org/young-people-are-buying-fewer-cars/.
Coughlin, Cletus C., Joseph V. Terza, and Vachira Arromdee. "State Characteristics and the Location of Foreign Direct Investment within the United States." The Review of Economics and Statistics73, no. 4 (1991): 675. doi:10.2307/2109406. Delgadillo, Natalie. "The Neighborhood That Went to War Against Gentrifiers." CityLab. March 09, 2017. Accessed November 12, 2017. https://www.citylab.com/equity/2017/03/the-neighborhood-that-went-to-war-against-gentrifiers/518181/. "Failure to Act: The Impact of Current Infrastructure Investment on America's Economic Future." Failure to Act | Books. 2016. Accessed December 01, 2017. http://ascelibrary.org/doi/book/10.1061/9780784478820. Flyvbjerg, Bent, Design by Deception: The Politics of Megaproject Approval (June 2005). Harvard Design Magazine, Spring/Summer, no. 22, pp. 50-59. https://ssrn.com/abstract=2238047
Flyvbjerg, Bent, Massimo Garbuio, and Dan Lovallo. 2013. Delusion and deception in large infrastructure projects: Two models for explaining and preventing executive disaster. California Management Review 51(2): 170-193.
Flyvbjerg, Bent, Nils Bruzelius, and Werner Rothengatter. 2003. Megaprojects and risk: An anatomy of ambition. Cambridge: Cambridge University Press.
Flyvbjerg. Bent, “What you should know about mega projects and why: An Overview.” Project Management Journal 2014, Volume 45, Number 2, pp. 6-19.
Flyvbjerg, Bent. "Machiavellian Megaprojects." Antipode37, no. 1 (2005): 18-22. doi:10.1111/j.0066-4812.2005.00471.x. "Foreign Trade ." Official Source US Export and Import Statistics - Foreign Trade - US Census Bureau. 2016. Accessed October 17, 2017. https://www.census.gov/foreign-trade/.

52
Geva-May I. (1997) Problem Definition in Policy Analysis. In: An Operational Approach to Policy Analysis: The Craft. Springer, Boston, MA
"The Global Competitiveness Report 2016–2017." World Economic Forum. 2017. Accessed December 01, 2017. https://www.weforum.org/reports/the-global-competitiveness-report-2016-2017-1. "GPA: D." ASCE's 2017 Infrastructure Report Card. Accessed December 01, 2017. https://www.infrastructurereportcard.org/. Grabar, Henry. "Can Google Build a City? We’re About to Find Out." Slate Magazine. October 25, 2017. Accessed December 01, 2017. http://www.slate.com/articles/technology/metropolis/2017/10/sidewalk_labs_quayside_development_in_toronto_is_google_s_first_shot_at.html. “Guiding Principles for the Nation’s Critical Infrastructure” 2009. Accessed December 1, 2017. https://www.asce.org/uploadedFiles/Issues_and_Advocacy/Our_Initiatives/Infrastructure/Content_Pieces/critical-infrastructure-guiding-principles-report.pdf. Hawkins, Andrew J. "Alphabet's Sidewalk Labs strikes deal to turn 800 acres of Toronto into an 'internet city'." The Verge. October 17, 2017. Accessed December 01, 2017. https://www.theverge.com/2017/10/17/16488942/alphabet-sidewalk-labs-toronto-quayside. Jaffe, Eric. "The View From Your Window Is Worth Cash to This Company." CityLab. August 04, 2014. Accessed December 01, 2017. https://www.citylab.com/life/2014/08/the-view-from-your-window-is-worth-cash-to-this-company/375471/.
Kearney, Melissa S., Brad Hershbein, and Greg Nantz. "Racing Ahead or Falling Behind? 6 Economic Facts about Transportation Infrastructure in the United States." Brookings. May 8, 2015. Accessed December 05, 2016. https://www.brookings.edu/research/racing-ahead-or-falling-behind-6-economic-facts-about-transportation-infrastructure-in-the-united-states/. Kimmelman, Michael. "Taking Parking Lots Seriously, as Public Spaces." The New York Times. January 06, 2012. Accessed December 01, 2017. http://www.nytimes.com/2012/01/08/arts/design/taking-parking-lots-seriously-as-public-spaces.html. Kodrzycki, Y. K., and A. P. Munoz. "Economic Distress and Resurgence in U.S. Central Cities: Concepts, Causes, and Policy Levers." Economic Development Quarterly 29, no. 2 (2015): 113-34. doi:10.1177/0891242414565696.

53
Lasswell Harold D., "The Garrison State," American Journal of Sociology 46, no. 4 (Jan., 1941): 455-468. https://doi.org/10.1086/218693 Marshall, Aarian. "Alphabet Is Trying to Remake the Modern City, Starting With Toronto." Wired. October 19, 2017. Accessed December 01, 2017. https://www.wired.com/story/google-sidewalk-labs-toronto-quayside/
Munnell, Alicia H. "Policy Watch: Infrastructure Investment and Economic Growth." The Journal of Economic Perspectives 6, no. 4 (1992): 189-98. http://www.jstor.org/stable/2138275.
Nicklas Garemo, Stefan Matzinger, and Robert Palter. "Megaprojects: The good, the bad, and the better." McKinsey & Company. July 2015. Accessed November 12, 2017. https://www.mckinsey.com/industries/capital-projects-and-infrastructure/our-insights/megaprojects-the-good-the-bad-and-the-better. "Private Activity Bonds (PABs)." U.S. Department of Transportation/Federal Highway Administration. Accessed December 01, 2017. https://www.fhwa.dot.gov/ipd/finance/tools_programs/federal_debt_financing/private_activity_bonds/.
"Public Spending on Transportation and Water Infrastructure." Congressional Budget Office. December 28, 2016. Accessed October 17, 2017. https://www.cbo.gov/publication/21902.
"Purple Line Extension." LA Metro Home. Accessed December 01, 2017. https://www.metro.net/projects/westside/. Rapier, Robert. "U.S. Electric Vehicle Sales Soared In 2016." Forbes. February 06, 2017. Accessed November 01, 2017. https://www.forbes.com/sites/rrapier/2017/02/05/u-s-electric-vehicle-sales-soared-in-2016/#5c93fd93217f.
Sadik-Khan, Janette, and Seth Solomonow. Streetfight: handbook for an urban revolution. NY, NY: Penguin Books, 2017. Pg. 254 "Seasonally Adjusted - Exports, Imports, and Balance of Goods by Selected Countries and Areas - Census Basis." The United States Census Bureau. 2016. Accessed December 1, 2017. https://www.census.gov/https://www.census.gov/foreign-trade/statistics/country/exh19hist.pdf.
Shannon & Wilson, Inc. "Preliminary Review Comments of Century City Area Fault Investigation Report Westside Subway Extension Project Century City and Beverly Hills, CA." News release, March 8, 2012. Beverly Hills Unified School District. Accessed November 15, 2017.https://www.bhusd.org/pdf/seismic_reports//___3_City%20of%20BH_Shannon%20_%20Wilson%20Preliminary%20Review%20Comments%20of%20MTA%20CCFI%20Report_3-8-12.pdf.
54
Sivak, Michael, and Brandon Schoettle. "More Americans of all ages spurning driver's licenses." More Americans of all ages spurning driver's licenses | UMTRI - University of Michigan Transportation Research Institute. January 20, 2016. Accessed December 01, 2017. http://www.umtri.umich.edu/what-were-doing/news/more-americans-all-ages-spurning-drivers-licenses.
Skelton, George. "California Republicans say raising gas taxes is a bad thing. GOP politicians in some red states don't agree." Los Angeles Times. October 26, 2017. Accessed October 30, 2017. http://www.latimes.com/politics/la-pol-sac-skelton-california-gas-tax-republicans-20171026-story.html.
"Status of the Highway Trust Fund Based on CBO's August 2016 Baseline." Congressional Budget Office. September 27, 2017. Accessed October 17, 2017. https://www.cbo.gov/publication/52307.
"Street Bump." Street Bump. Accessed December 01, 2017. http://www.streetbump.org/about.
Totty, Michael. "The Rise of the Smart City." The Wall Street Journal. April 16, 2017. Accessed December 01, 2017. https://www.wsj.com/articles/the-rise-of-the-smart-city-1492395120.
Walker, C., and A. J. Smith. Privatized infrastructure: The Build Operate Transfer approach. London: T. Telford, 1995. "Where Is the Land of Opportunity: The Geography of Intergenerational Mobility in the United States." Where Is the Land of Opportunity: The Geography of Intergenerational Mobility in the United States. 2014. Accessed December 06, 2016. http://scholar.harvard.edu/hendren/publications/economic-impacts-tax-expenditures-evidence-spatial-variation-across-us.
White, Gillian B. "Stranded: How America's Failing Public Transportation Increases Inequality." The Atlantic. May 15, 2015. Accessed December 05, 2016. http://www.theatlantic.com/business/archive/2015/05/stranded-how-americas-failing-public-transportation-increases-inequality/393419/. "White House Report: Economic Analysis of Transportation Infrastructure Investment." National Archives and Records Administration. July 2014. Accessed October 17, 2017. https://obamawhitehouse.archives.gov/sites/default/files/docs/economic_analysis_of_transportation_investments.pdf. Winston, Clifford. "Efficient Transportation Infrastructure Policy." The Journal of Economic Perspectives 5, no. 1 (1991): 113-27. http://www.jstor.org/stable/1942705.

55
"The World Factbook: United States." Central Intelligence Agency. October 04, 2017. Accessed October 17, 2017. https://www.cia.gov/library/publications/the-world-factbook/geos/us.html. "World Bank Open Data." World Bank 2016. Accessed October 17, 2017. https://data.worldbank.org/. "Your Driving Costs." AAA NewsRoom. Accessed December 01, 2017. http://newsroom.aaa.com/auto/your-driving-costs/.
Zimmer, John. "The Third Transportation Revolution." Medium. September 18, 2016. Accessed December 07, 2016. https://medium.com/@johnzimmer/the-third-transportation-revolution-27860f05fa91.