The Nature of Training and Motivation to Train in Small Firmsdera.ioe.ac.uk/4691/1/RR330.pdf · The...
113
The Nature of Training and Motivation to Train in Small Firms John Kitching and Robert Blackburn Small Business Research Centre Kingston University Research Report RR330 R ESEARCH
Transcript of The Nature of Training and Motivation to Train in Small Firmsdera.ioe.ac.uk/4691/1/RR330.pdf · The...
The Nature of Training andMotivation to Train inSmall FirmsJohn Kitching and Robert Blackburn
Small Business Research CentreKingston University
Research Report RR330
RESEARCH

ii
CONTENTS LIST OF TABLES v ACKNOWLEDGEMENTS vii EXECUTIVE SUMMARY viii CHAPTER 1 TRAINING AND SMALL ENTERPRISES: CONTEXT AND RESEARCH FRAMEWORK 1 The Context 1 Research Objectives 2 Methodology 2 Structure of the Report 3 CHAPTER 2 THE PROVISION OF TRAINING FOR NEW RECRUITS,
ESTABLISHED STAFF AND OWNER-MANAGERS 4 Introduction 4
Defining Training 4 The Provision of Training 5
The Content of Training 10 The Duration of Training 13 Summary 14 CHAPTER 3 EMPLOYER MOTIVATIONS TO TRAIN 16 Introduction 16 Employer Motives to Train 16 In-House Training and External Training: Employer 20
Preferences Use of External Training Providers 22 Reasons for Preferring In-House Training 25 Reasons for Preferring External Training 26 Summary 27 CHAPTER 4 DETERMINANTS OF TRAINING PROVISION 28 Introduction 28 Product Market Competition and Training Provision 28 Organisational Change and Training Provision 29 Training Provision and Employment Change 33 Training Provision and Financial Performance 33 Developing a Multivariate Framework 34 Training Index 34 Training Activity and Employment Categories 35 Summary 36

iii
CHAPTER 5 TRAINING AND BUSINESS PERFORMANCE 37 Introduction 37 Problems With Existing Research 37 Evaluating the Training-Business Performance Link: Some 38
Findings Summary 40 CHAPTER 6 A STRATEGIC APPROACH TO TRAINING? 41 Introduction 41 Variations in Small Employers’ Orientation to Training: A 41 Typology Orientation to Training and Size of Enterprise 44
Orientation to Training and Industry Sector 44 Orientation to Training and Organisational Change 44 Orientation to Training and Product Market Competition 48 Orientation to Training and Employment Change 48 Orientation to Training and Changes in Financial Performance 48 Orientation Towards Training and Training Provision 49
Multivariate Analysis of the Training Orientation of SME 49 Owner Managers Summary 54
CHAPTER 7 BARRIERS TO TRAINING 55 Introduction 55 Barriers to Training or Lack of Perceived Need to Train? 55
Training Barriers and Enterprise Size 59 Training Barriers and Business Sector 60
Training Barriers and Organisational Change 61 Training Barriers and Orientation to Training 64 Training Barriers Among Trainers and Non-Trainers 64 Summary 66 CHAPTER 8 GOVERNMENT POLICY AND SMALL BUSINESS 68
TRAINING Introduction 68 Take Up of Government Training Initiatives 68 Owner-Managers’ Experiences of Government Training 70
Initiatives Barriers to Participation in Government Training Initiatives 73 Government Assistance for Training Provision in Small 78
Enterprises Summary 82
CHAPTER 9 CONCLUSIONS AND POLICY IMPLICATIONS 83 Key Findings and Themes 83 Policy Implications 88

iv
APPENDIX 1 METHODOLOGICAL APPENDIX 91 REFERENCES 96

v
List of Tables Table 2.1 Training Provision for New Recruits, Established Staff and Owner-Managers
During the Past Year by Size of Enterprise Table 2.2 Training Provided for New Recruits, Established Staff and Owner-Managers
During the Past Year by Industry Group Table 2.3 Provision of Training by Occupational Group Table 2.4 Content of Training Table 3.1 Benefits of Workforce Training Table 3.2 Benefits of Training For Owner-Managers Table 3.3 NVQs and Other Qualifications: Achieved and Current Table 3.4 Location of Training For Established Staff Table 3.5 Location of Training For Owner-Managers Table 3.6 External Providers of Training for Established Staff and Levels of Satisfaction Table 3.7 External Providers of Training Used by Owner-Managers and Levels of
Satisfaction Table 3.8 Reasons for Preferring Off-the-Premises Training For Established Staff Table 3.9 Reasons for Preferring Off-the-Premises Training For Owner-Managers Table 4.1 Comparison of Training Providers and Others by Reported Level of Product
Market Competition Table 4.2 Incidence of Training Provision for New Recruits, Established Staff and Owner-
Managers During the Past Year by Type of Organisational Change Table 4.3 Incidence of Training Provision for New Recruits, Established Staff and Owner-
Managers During the Past Year by Extent of Organisational Change Table 4.4 Equation for Training Index Table 5.1 Perceived Impact of Workforce Training on Business Performance Table 6.1 Attitudes to Training Provision Table 6.2 Indicators of Attitudes to Training Provision Table 6.3 Orientation to Training by Size of Enterprise Table 6.4 Orientation to Training by Industry Group Table 6.5 Incidence of Organisational Changes by Orientation to Training Table 6.6 Types of Training Provided During the Past Year by Orientation to Training Table 6.7 Location of Training For Established Staff Provided During the Past Year by
Orientation to Training Table 6.8 Multinomial Logit Regressions for Training Orientations

vi
Table 7.1 Reasons for Not Providing More Training for Established Workers Table 7.2 Reasons for Not Providing More Training for Owner-Managers Table 7.3 Main Reason for Not Providing More Training by Size of Enterprise Table 7.4 Main Reason for Not Providing More Training by Industry Group Table 7.5 Main Reason for Not Providing More Training by Incidence of Organisational
Change Table 7.6 Main Reason for Not Providing More Training by Orientation to Training Table 7.7 Main Reason for Not Providing More Training for Trainers and Non-Trainers Table 8.1 Participation in Government Training Initiatives by Size of Enterprise Table 8.2 Participation in Government Training Initiatives by Industry Group Table 8.3 Participation in Government Training Initiatives by Orientation to Training Table 8.4 Reasons for Not Participating in Government Training Initiatives More Table 8.5 Main Reason for Not Participating in Government Training Initiatives More by
Current Involvement in Government Training Initiatives Table 8.6 Main Reason for Not Participating in Government Training Initiatives More by
Orientation to Training Table 8.7 Main Reason for Not Participating in Government Training Initiatives More for
Trainers and Non-Trainers Table 8.8 Proposals for Reform of Government Training Initiatives Table 8.9 Proposals for Reform of Government Training Initiatives by Orientation to
Training Table A1.1 Outcomes of All Contacts Made: Telephone Survey and Personal Interviews Table A1.2 Telephone Sample Characteristics: Enterprise Size and Industry Group (Interview
Quotas and Interviews Achieved) Table A1.3 Telephone Survey: Weighting Multipliers by Industry Group and Enterprise Size Table A1.4 Workforce Composition by Industry Group

vii
ACKNOWLEDGEMENTS The authors would like to thank the following for their help in the various stages of the research and analysis on which this report is based. Our thanks go to Phil Roe and the telephone interviewers at Prism Research for conducting the telephone fieldwork. We are also grateful to staff in the SBRC for their assistance. We especially appreciate the help from our colleague, Professor Mark Hart, for undertaking the multivariate analysis discussed in Chapters 4 and 6. We would also like to thank members of the Steering Committee at the DfES for their advice and feedback on earlier drafts of the report and especially to Rob Hardcastle, for his advice and encouragement throughout the whole project. Finally, we would like to thank the business owner-managers for giving up their valuable time without which this research would not have been possible. Professor Robert Blackburn Dr John Kitching Small Business Research Centre January 2002

viii
EXECUTIVE SUMMARY Context and Research Objectives • There is considerable evidence that smaller employers provide less formal training than
larger companies and are less likely to participate in government training initiatives. Policymakers and others often regard this as evidence that small employers provide insufficient training. Increasing employers’ training efforts is seen as a key means of raising levels of productivity and national economic performance
• Small employers are perceived as facing particularly difficult barriers to providing training.
Examples include lost working time arising out of releasing staff to undertake training and the financial costs of attending external training courses. The important role that small business plays in the UK economy, as job creators, leads policymakers to have an interest in reducing any barriers to training.
• The study has a number of objectives: to understand the issues small employers face in
making decisions about training; to examine training provision for owner-managers, new recruits and established employees; to gauge the importance of formal and informal training; to identify employers’ motives to provide training; and to assess whether small businesses’ informal training can be assessed more formally than at present. Implications for policy are also suggested.
• This report is based on a two-stage study of small businesses, defined for the purposes of the
study as those with 2-49 employees. The first stage aimed to provide quantitative data on a sufficiently large sample to be able to generalise the findings to the broader business population. Results have been weighted to reflect the structure of the industry and size structure of the small business population. The second stage entailed face-to-face interviews with 50 employers. The purpose of this phase was to provide qualitative data on employers’ definitions of training, their motivations for undertaking training and the barriers to providing training.
Defining Training • Previous research has shown that employers often define ‘training’ in very narrow terms, to
refer to formal courses or events. Yet research has also shown that small employers particularly tend to rely heavily on informal types of learning and training.
• The issue of definition was tackled in different ways in the two stages of the study. In the
telephone survey, respondents were invited to think of training “to include any activities at all through which managers and workers improve their work-related skills and knowledge”. This phrase was repeated periodically throughout the interview to encourage respondents to think in broad terms about training. In the face-to-face interviews, respondents were initially allowed to define training as they wished, although where a narrow definition was adopted, interviewers were instructed to subsequently encourage respondents to think of training in broad terms.

ix
• Initially, respondents often claimed they provided no training or were apologetic about the
training they did provide because of its informal, on-the-job character. Such practices were often not defined initially as training as they were an integral part of customary working routines. These practices contrast sharply with more formal practices which were felt to be ‘proper training’. Once encouraged by interviewers, respondents were often able to discuss their informal training practices and their motives for engaging in them.
The Provision of Training for New Recruits, Established Staff and Owner-Managers • The incidence of training provision in the year prior to interview varied with the recipient:
82% provided initial training for new recruits, 59% provided training for established staff, and 40% of owner-manager respondents undertook training.
• A training index value was calculated for each enterprise which provides an approximate
measure of the proportion of the established workforce receiving training during the previous 12 months i.e. the ‘intensity’ of training. The weighted index value of 0.27 suggests that slightly more than a quarter of the workforce in small firms received training in the year before the survey. Amongst those employers reporting any training provision in the previous year, the index value is 0.47. Higher than average figures were found in particular sectors (‘business and professional services’, ‘other services); where businesses employed ‘professional and technical’ staff and ‘employed managers’; and in businesses introducing new products or services, major pieces of equipment and major changes in working methods or workforce organisation.
• The typical format of training provision, particularly initial training, included on-the-job
demonstrations by others of the tasks the new recruit would be required to perform, meeting with other members of the workforce and provision of information concerning the firm’s internal administrative procedures. This training was usually provided at the workplace by other members of the workforce; very little involved external organisations. Training for established staff, and particularly that for owner-managers, was more likely to involve formal training episodes with external providers.
• The period of initial training was highly variable, depending on both the characteristics of the
job and the recruit. Where jobs made relatively few demands of new recruits, initial training was of a few minutes duration. Conversely, where the skills required were complex, the training took place over a number of years in what might best be seen as a period of ‘informal apprenticeship’.
• For some employers, initial training for new recruits was the only form of workforce training
provided. This was especially likely in ‘distribution, hotels and catering’ where there are a higher proportion of semi-skilled jobs. Another possible reason may be the relatively high rates of labour turnover in this sector. For many such workers, employers may regard continuing training as unnecessary.

x
• Larger employers were more likely to report the provision of training for all three types of recipient. However, examining trainers only, larger employers were no more likely, on average, to train a higher proportion of their workforces than smaller employers.
• The incidence of training provision varied between sector groups. For all three types of
recipient (new recruits, established staff, owner-managers), employers in ‘other services’, ‘business and professional services’ and ‘primary and construction’ were most likely to provide training. Conversely, employers in ‘manufacturing’, ‘distribution, hotels and catering’ and ‘transport and communications’ were the least likely.
Employer Motivations To Train • Workforce training had two purposes: technical, to equip new recruits with sufficient
knowledge and skills to enable them to perform their new work roles to some minimum standard; and social, to secure new recruits’ co-operation with the employer’s aims and the working relations into which they enter. This latter objective was particularly important for new recruits.
• Specifically, employers provided workforce training to provide workers with skills required
in their current jobs and to improve business performance. Together, these two motives accounted for 71% of the most important reasons for training. Goals such as training in order to introduce new equipment or software, or to meet legal obligations such as health and safety regulations, were also perceived as important. Other objectives such as providing workers with skills required in future jobs or to provide qualifications were much less important. About one in ten employers felt that training offered no benefits.
• The qualitative data, suggested that the ‘default position’ for the provision of training was in-
house training, primarily for reasons of relevance (because training could be tailored to employers’ specific needs) and convenience (training could be undertaken at times chosen by the employer and not to suit an external provider’s schedule). Employers provided external training where they lacked adequate knowledge and skills in-house or because there was no option. Many employers attempted to combine the advantages of both methods by bringing external providers in-house to deliver tailored training. In contrast, the quantitative telephone survey data suggested that the sample was evenly divided between those preferring to provide training in-house and those preferring to provide training externally. Again, the reason for the difference might relate to respondents, despite the prompts and exhortations of the interviewer, reverting to a narrower definition of training in the quantitative survey, associating it with formal, external training and excluding in-house or informal types of training.
Correlates of Training Provision • The incidence of training provision is associated with businesses which are larger, are in
‘business and professional’ and ‘other’ services. The composition of the labour force was also important. Those employers with workforces comprising higher proportions of professional and technical workers were most likely to provide some training in the previous

xi
12 months. Those providing training were also more likely to report changes in the workplace in the past year, either as a result of new products and services and/or organisational changes.
• Data was inconclusive regarding the links between the provision of training and employment
growth (actual and anticipated), sales turnover growth (actual and anticipated) or profit performance. The relationship between each of these factors and each type of training provision is complex; there is no simple positive association between them.
• An exploratory multivariate analysis helped ‘unpack’ the relationships between the incidence
and intensity of training provision and business characteristics. Overall, this confirmed the relationship between the incidence and intensity of training provision for established employees and organisational change and product/service developments. However, it also showed that the correlates of training provision for different groups of employees (owner-managers, recruits and established staff) and enterprise characteristics varied.
Training and Business Performance • Recent debate concerning the link between training and business performance has suggested
that available evidence does not demonstrate a clear and unambiguous relationship between the two1. Furthermore, it has been argued that the absence of such a link might deter small employers from providing training. Such arguments, however, may be missing the point. Most employers felt that training did provide benefits for the business yet most did not attempt to measure the impact, at least in any formal sense. Qualitative data showed that most employers based their opinions on observation of employees working and the ‘outputs’ of their work performance. Employers adopted such ‘rules of thumb’ almost universally. Judgements were not made on the basis of impacts on the bottom-line; indeed, employers felt these were very difficult, if not impossible, to make. Other evidence from this survey e.g. on the relative lack of importance attached to potential ‘informational’ barriers to training also suggests this argument has been overstated.
A Strategic Orientation to Training? • Employers were grouped into three distinctive groups based on the extent to which they
varied in their orientation to training. Strategic (30% of firms), tactical (55%) and low (15%) trainers were identified on the basis of answers to questions concerning their attitudes to training provision and whether they had a dedicated training budget. The purpose of the distinction is to show the variation in small employers’ approaches to training and to act as a possible basis for explaining differences in firms’ training activities.
• A relationship existed between orientation towards training and both the incidence of training
provision and training index values. Strategic trainers were more likely to report training for
1 This may be partly due to the absence of a clear exposition of such a link (an ‘information gap’) or in part to the evidence that is available being inconclusive.

xii
all three types of recipient (new recruits, established staff, owner-managers) than tactical trainers who, in turn, reported a higher incidence of training than low trainers. Strategic trainers provided further training to twice as many established staff as tactical trainers (training index = 46% for strategic vis-à-vis 23% for tactical trainers) and to seven times as many staff as low trainers during the previous year.
• Strategic trainers reported a higher number of benefits of training, were more likely to
measure the effects of training and more convinced of the value of training. They were also more likely to have a more favourable view of qualifications.
• Strategic trainers tended to be larger than other businesses, to be located in ‘other services’
rather than other sectors, to operate in slightly more competitive product market conditions than low trainers, and to compete on the basis of non-price factors more commonly than low trainers.
• Strategic trainers were more likely than tactical and low trainers to report employment
growth over the previous two- and five-year periods, to anticipate employment growth over the next two years, to have experienced real sales growth over the previous two years, and to expect real sales growth over the next two years. There was, however, no link found between orientation towards training and profit performance over the previous two years.
• Strategic trainers were more likely to report genuine barriers to further training such as
financial cost, lost working time and a failure to find suitable training opportunities. Low trainers, in contrast, were more likely to give reasons reflecting the lack of a perceived need for further training. Instead, they claimed that staff were fully trained before they arrived at the firm and that training would not produce any benefits for their businesses. Tactical trainers were more evenly divided on their reasons for not providing additional training.
• A multi-nomial regression model confirmed the robustness of the three-fold typology and
demonstrated that both strategic and tactical trainers were significantly different from low Trainers. Further, the model highlighted the relevance of the introduction of new products and services as the key influence separating strategic trainers from tactical trainers.
Barriers to Training • Employers were divided into two groups: those emphasising the importance of various
boundaries in constraining training activity and those emphasising reasons indicating a lack of any perceived need to provide (or undertake) additional training.
• For workforce training (established employees), most employers reported that they perceived
no need for further training (52%); only 43% emphasised real barriers to training. For owner-manager training, real barriers were commonly reported (50%); only 45% emphasised the lack of any perceived need for further training.

xiii
• Employers emphasising no perceived need for further training were able to meet their skills requirements either through recruitment or through prior training. Additional training was viewed as unlikely to benefit the business. This viewpoint was more common when employers perceived their skill requirements as relatively limited; when they believed they could recruit the skills they needed from the labour market; if they were operating in relatively stable product markets, with little emphasis on product innovation as a competitive strategy; or, had few plans to expand their businesses.
• For workforce training, among those emphasising reasons indicating a lack of perceived
need, the major reason related to providing staff with sufficient training after they had been recruited into the business; for owner manager training, respondents were more likely to claim the owner-manager was already fully skilled and did not need any training.
• Among those employers emphasising barriers to training, lost working time (27% as the main
barrier amongst those reporting a barrier) and the financial cost of training (37%) were the most frequently reported barriers for workforce training; for owner-manager training, lost working time was by far the most important constraint. Supply side deficiencies in the availability, quality and location of training were relatively unimportant constraints.
• A relatively low proportion of employers (2% as the main reason amongst those reporting a
barrier2 ) reported the threat of trained workers being ‘poached’ or quitting the business as a barrier to training provision. Contrary to what many commentators have argued, few small business owners acknowledge this as a major constraint. The need to provide some training, particularly for new recruits, and the specific character of much of that training, in particular the need to inculcate firm-specific values and practices, means that the threat of poaching does not severely constrain employers’ training activities.
• Employers were more likely to cite barriers to training rather than any lack of a perceived
need to train where they reported the introduction of new products, services or major pieces of equipment, or major changes in skills or workforce; they were in ‘other services’ and to a lesser extent in ‘business and professional’ services; they reported the provision of training in the year prior to interviews; they held a strategic trainer orientation to training. There were few differences in employers’ reasons for not wanting to provide further training associated with enterprise size.
Government Policy and Training • Take up of government training initiatives (excluding NVQs) was generally at a low level.
Only 13% of businesses reported current involvement in an initiative. The most commonly reported initiative was Modern Apprenticeships, cited by 5% of respondents. Fewer than 2% of employers reported current involvement in all other specified initiatives.
2 Only 9% of all employers reported the fear of poaching as a reason for not training, with less than 1% quoting it as the main reason.

xiv
• Approximately 11% of firms reported that at least one worker had achieved an NVQ during the year prior to interview and a further 13% reported that someone was currently working towards an NVQ.
• Larger employers were more likely to be involved in at least one government training
initiative (around a quarter of those with 20-49 employees), though this relationship did not hold across each individual initiative. In part, this reflects the higher incidence of all forms of training among larger employers.
• Current participation in government training initiatives was higher for employers in larger
businesses; in ‘other services’ and ‘primary and construction’ industries; and with a strategic trainer orientation. For employers in ‘other services’ this mirrors their more general greater training provision; for those in ‘primary and construction’ it reflects the greater importance of Modern Apprenticeship training in comparison with other sectors.
• Employers’ experiences of participation in government training initiatives were mixed.
Those receiving funding were generally pleased with these arrangements, as were the small number of employers reporting involvement in Investors in People.
• The great majority of employers were indifferent to participation in government initiatives.
Most felt them to be irrelevant to their training needs or they did not perceive a need for further training from any source (nearly half quoted these as the two main reasons for not getting involved more). In other cases, employer indifference was due to respondents’ lack of awareness of the purpose and content of initiatives. Others were critical of the procedures for accessing training or of the perceived poor quality of initiatives.
• The two most common reasons to further participation in government training initiatives
were lack of relevance to the employer’s training needs (28% reported this as the main reason) and lack of information about available initiatives (25%). Policymakers may need to adopt a range of strategies to encourage higher take up of initiatives. Many of those employers reporting lack of information may be amenable to becoming involved in initiatives if sufficient effort is spent explaining their character and the potential benefits to employers. In contrast, among those employers reporting lack of relevance, policymakers may need to focus resources on encouraging employers to change their broader competitive strategies, in particular, using whatever influence they have to foster a shift towards higher quality products. Employers may then see the virtues of increasing their training efforts. It has to be said that the former approach is the easier and less costly one.
• The perceived lack of relevance of many initiatives was also reflected in employers’ views
on what government could do to assist them in regard to their training and development. More than a third felt that government could do nothing to help. But this was no major cause for regret on the part of respondents. This merely reflected the fact that employers either believed that further training was unnecessary, or that government was not widely perceived as a primary provider of training. Not surprisingly, the most common suggestions as to what government could do to assist were providing funding for workforce training and increasing information on available initiatives.

1
CHAPTER 1
TRAINING AND SMALL ENTERPRISES: CONTEXT AND RESEARCH FRAMEWORK
The Context Small enterprises constitute the vast majority of the UK business stock – 99% of UK enterprises employ fewer than 50 employees (DTI 2001a) - and this is reflected in the attention policymakers have given to training for small business owner-managers and their employees (DTI 1998). Government supports training in the small enterprise through various targeted policy initiatives, such as Small Firms Training Loans, as well as encouraging their participation in wider initiatives such as Investors in People (IiP). New initiatives announced in the recent white paper Opportunities for All (DTI 2001b) and the budget are also likely to have an impact on small enterprises. Examples include the provision of funding to support shared training arrangements and facilities for small employers. Most studies report that small businesses provide less formal training than larger organisations (e.g. Cambridge Small Business Research Centre 1992; Kitson and Wilkinson 2000; Curran et al., 1996; Johnson 1999; IFF Research Ltd 2000; National Skills Task Force 2000a, 2000b) and are less likely to participate in national training initiatives (Curran et al., 1996; Matlay and Hyland, 1997; Johnson 1999; IFF Research Ltd 2000). Such evidence is often cited to support arguments that small employers provide insufficient training for their workforces (e.g. National Skills Task Force 2000b). Low take up of formal training by small business owners, some argue, is not the result of owner-manager ignorance of the benefits of training but instead reflects the rational interplay of market forces (Storey and Westhead, 1997). For reasons related to size of enterprise, both the demand for training by small employers and its supply are lower than for larger employers. On the demand side, uncertainty about the future might lead small employers to adopt shorter time horizons regarding investment decisions including training, leading to lower investment. Second, the cost of training may be greater for the small employer, particularly the opportunity cost of working time lost but also training fees and the fixed costs of training. Third, small employers often feel that formal training courses are too general and not sufficiently tailored to suit their particular training needs. Fourth, the absence of any demonstrated connection between training provision and improved business performance may also deter some employers from providing training. On the supply side, training providers may be less willing to offer training to small business owners because of the higher costs of organising and tailoring training specific to the customer’s needs (Storey and Westhead 1997; Kitching and Blackburn 1999). Much research has, however, been rather narrow in its focus. Studies have often limited themselves to formal training (e.g. Westhead and Storey 1997; Cosh et al. 1998; Patton et al. 2000), thereby ignoring informal types of training. Recent studies show that many small employers rely heavily on in-house, on-the-job training (Vickerstaff 1992; Johnson and Gubbins 1992; Curran et al. 1993, 1996). Other studies have confined their scope to particular occupational groups, particularly managers (or aspiring managers), neglecting the training

2
experiences of other categories of worker (e.g. Storey and Westhead 1996; Loan-Clarke et al. 1999; Patton et al. 2000). Other researchers have conducted evaluations of particular training initiatives which though often insightful may not be typical of most small businesses (e.g. Cushion 1995; Marshall et al. 1995; Westhead 1997). It is questionable whether the findings of these studies ought to be generalised to the broader small business population. These restrictions on the scope of studies may limit our understanding of the motivations for, processes of, and consequences of training provision for small employers and their workforces. Small businesses exist in all industries and vary widely in their training needs and practices. Training activity can vary in terms of its quality (substantive content, mode of organisation and delivery, location, accreditation), its quantity (number of employees receiving training, duration and intensity of training episodes) and its purposes. That small business owners provide little or no formal training does not necessarily mean their workforces, or themselves, are poorly trained or lack appropriate skills. An adequate understanding of training provision in the small enterprise must acknowledge that the experience of training is highly variable in terms of quantity, quality and purpose. Research Objectives The study has a number of related objectives: 1. To improve understanding of the issues small employers face with regard to decisions about
training. In particular, the study addresses the barriers to undertaking training, especially formal training.
2. To gauge the relative extent of formal and informal training in small businesses. What are
the owner-managers’ perceptions of formal and informal training? 3. To identify the influences motivating small employers to provide formal training, and to
investigate the perceived and actual benefits. 4. To assess how training provision differs for owner-managers, new recruits, and established
employees. 5. To contrast the training approaches, activities and benefits of training for small businesses
with those of larger enterprises reported in other studies. 6. To assess whether and how small business’s informal training can best be classified and
structured, and whether it can be recognised and assessed more formally than is currently the case.
Methodology The study comprised two stages conducted concurrently with distinct samples: a national telephone survey of 1005 small business respondents; and a face-to-face interview study of 50 respondents. All fieldwork was conducted between November 2000 and February 2001. Details of the sample structure can be found in Appendix 1.

3
Telephone Survey A nationally representative survey of 1005 small business owners in England was conducted; the response rate achieved was 67% (Table A1.1 in Methodological Appendix). Respondents were owner-managers in most cases (792); other respondents were managers, owners’ spouses and other non-managerial employees. The purpose of the telephone survey was to provide quantitative data on a sufficiently large sample to be able to generalise confidently the study findings to the broader business population and to smaller sub-groups within this population. The quantitative data permit the production of descriptive statistics that are representative of some broader population; they allow associations between specific variables to be identified and their strength measured; and, they provide indications of causal relationships between variables. Face-to-face Interview Sample Face-to-face interviews were conducted with 50 small business respondents (response rate 52%). The purpose of these interviews was to investigate, in greater depth than is possible using telephone survey data, employers’ definitions of training, whether training is treated by employers as a strategic activity, employer motivations to train, the perceived barriers to training, and employers’ experiences of participation in government training initiatives. Such qualitative data provide stronger evidence for causal relationships between employers’ motivations and behaviour, and the wider context. Employer decisions to train and their experiences of training need to be related to the particular pressures and opportunities to train faced by individual employers. Data analysis The quantitative data were analysed using SPSS and STATA packages. The qualitative data were analysed interpretively to explore the varying meanings of training for employers. While the statistical data analysis permits patterns or associations between variables to be identified, the qualitative data offers greater insights into training processes and the causal connections between employers’ motivations, practices and the barriers they face in engaging (or trying to engage) in these practices. The data on causal relationships within specific business contexts complements the cross-sectional data derived from the telephone survey. Structure of the Report Chapters 2–5 present the empirical material relating to the provision of training, employer motives to train, the correlates of training provision, and the link between training and business performance. Chapter 6 sets out a typology, the purpose of which is to distinguish employer orientations to training provision. Strategic, tactical and low trainers are distinguished and related to the empirical material. Chapter 7 focuses on the reasons why business owners do not train more; in particular, the issue of whether small employers face training barriers is considered. In Chapter 8 we examine take-up and employer experiences of government training initiatives. Chapter 9 provides a summary of the key findings and offers some thoughts as to how policymakers might proceed.

4
CHAPTER 2
THE PROVISION OF TRAINING FOR NEW RECRUITS, ESTABLISHED STAFF AND OWNER-MANAGERS
Introduction This chapter provides data on the provision of initial training for new recruits, established staff and owner-managers. Quantitative data on owner-managers’ training provision derives from the 792 unweighted responses from respondents who were owner-managers, partners or directors; non-owner-manager respondents such as employed managers, principals’ spouses, or other employees are excluded. Defining Training Defining training broadly could encompass all experiences through which employers and workers increase their job-related knowledge and skills. Conversely, restricting the definition to formal, structured courses might exclude most of the job-related learning that takes place. This study adopts a broad definition in order to capture both formal and informal types of training. The issue of definition was tackled in different ways in the two stages of data collection. To encourage respondents to think of training in broad terms, the preamble to the telephone survey invited respondents to think of ‘training’:
“to include any activities at all through which managers and workers improve their work-related skills and knowledge. These activities may occur on- or off-the-job. They may occur in short bursts or be over a longer period of time. They may be linked to a qualification or not.”
During the telephone survey interview, this phrase (or shorter variants of it) was repeated by interviewers to remind respondents to think of training in the broad terms outlined above. Many of the questions asked reinforced this broader conception of training. For instance, respondents were asked whether they had provided various types of training including ‘learning on the job’ and ‘on the job training’. Face-to-face interview respondents were encouraged initially to discuss ‘training’ as they themselves defined it. Employers using external training providers generally found it easier to talk about training. But where employers relied solely or predominantly on in-house training, initial responses varied. Some respondents were able to discuss these training practices ‘spontaneously’, possibly because when contacted initially they were assured that in-house training was relevant to the study. Other respondents, however, were reluctant initially to define their activities as training.3 Several reasons for this can be suggested. First, the informal character of these activities - often such activities were an integral part of customary working 3 Campanelli et al. (1994) found that employers interpreted ‘training’ quite narrowly, in comparison with training professionals, to refer to formal courses especially those leading to qualifications.

5
routines and therefore indistinguishable from them - contrasted sharply with more formal, structured types of training. Some employers implicitly assume that ‘proper training’ needs to be provided in a formal, off-the-job setting, away from the workplace, by an external provider, possibly involving qualifications or accreditation of some kind. Failure to meet these criteria encouraged some employers initially either to deny providing training at all or to be apologetic about their training practices, tacitly defining them as inferior. Comparison with what they perceive to be customary practice in larger organisations and government training initiatives may well reinforce this apologetic stance. In these circumstances, considerable interviewer effort was required to encourage elaboration of in-house practices. Once encouraged by interviewers that in-house training arrangements were of interest, employers were generally able to discuss them in more positive terms as having important benefits for their businesses; indeed, they were able to assert their superiority in the context of their own enterprises. The Provision of Training Bearing this important caveat in mind, the majority of respondents (75%) reported the provision of workforce training, either initial training for new recruits and/or continuing training for established staff, during the past year. Comparisons with other recent studies (e.g. IFF Research Ltd 1999) are difficult because results for that study are not disaggregated on a basis that would allow direct comparison. Both the quantitative telephone survey data and the qualitative face-to-face interview data suggest that the practice of providing some form of initial or induction training is very widespread. In the telephone survey, of those reporting any recruitment in the year to interview (59% of the weighted sample), 82% provided initial training (Table 2.1).4 Of those providing initial training, most (92%) reported that all new recruits received it. The high incidence of initial training provision tallies with the findings of Johnson and Gubbins (1992). For many employers, initial training for new recruits was the most important form of training provided. Indeed, for 16% of the sample, initial training was their only workforce training provision. The proportion rises to 31% if only those employers reporting both the provision of any workforce training and any recruitment in the year prior to interview are considered. Smaller employers were most likely to rely solely on initial training. A third (34%) of employers with 2-9 workers reported only initial training; for employers with 20 or more workers, the figure was 14%.
4 Questions concerning the provision of initial training were only asked of employers reporting at least one new recruit in the year prior to interview. Data is not therefore available regarding initial training for employers not recruiting in the previous year.

6
Table 2.1 Training Provision For New Recruits, Established Staff and Owner-Managers During the Past Year
by Size of Enterprise (weighted)
% of employers reporting initial training
for new recruits
% of employers reporting
further training for established staff
% of owner-managers reporting undertaking
training themselves
Training Index (whole sample)
Training Index (trainers only)
2-9 workers 81.2 56.0 38.7 0.26 0.47 Weighted N 471 864 747 860 480
10-19 workers 81.5 73.8 50.2 0.34 0.46 Weighted N 80 99 81 99 73
20 or more workers 88.3 82.6 50.6 0.39 0.48 Weighted N 39 42 29 40 33
ALL 81.7 58.8 40.2 0.27 0.47 Weighted N 590 1005 857 999 585
Notes: Question concerning initial training only asked of employers reporting any recruitment during the year prior to interview (weighted N=590). Question concerning owner-manager training only asked of owner-manager respondents (weighted N=857). Column Ns do not always sum to ‘ALL’ row Ns due to rounding. Training index values are sample mean averages calculated by dividing the number of established workers receiving training in the year prior to interview by employment at the time of interview. Excludes cases for which data is missing for either number of established staff trained or workforce size.

7
The qualitative data also highlighted the importance of initial training. Employers often emphasised that their training effort was concentrated on the early period of employment; by contrast, further training for established staff was more irregular and infrequent. The qualitative data further indicated that initial training was provided irrespective of external labour market conditions. The very specific character of employers’ requirements meant that some form of guidance or instruction was given to nearly all new recruits to enable them to work and behave in a manner acceptable to their new employer. Two measures of training for established staff5 were used. The first records the incidence of training: 59% of telephone sample respondents reported such training, a lower proportion than for initial training (Table 2.1). A second, more sensitive, measure of training provision estimates the proportion of the established workforce receiving training during the year prior to interview, and is a measure of the ‘intensity’ of training provision. A training index for each telephone sample enterprise was calculated by dividing the number of established workers receiving training during the past year by the number of workers employed at the time of interview. The index gives an approximate measure of the proportion of established staff receiving training in the previous year. It can take a value of zero, where no training is provided, or a higher value for each employer. It is possible that the index value may exceed one where numbers trained are high and where workforce size has declined. In practice, this occurred in only a very small number of cases. As the index refers explicitly to training for established staff, it may understate numbers trained where employers concentrate their training effort on new recruits and provide little or no training for established staff. It seems likely, however, that some employers may have included those receiving initial training in their responses. Employer training index values varied from zero to 1.167, reflecting widespread variation in the proportion of established staff receiving training. For the telephone sample as a whole, the training index gives a weighted average (mean) figure of 0.27, suggesting approximately 27% of established staff in sample enterprises had received training. If only those employers reporting training for established staff in the year prior to interview are included, the index value was 0.47; this suggests that nearly half of trainers’ workforces received training. Among owner-managers, a smaller proportion (40%) reported undertaking any training themselves in the year prior to interview (Table 2.1). The lower reported incidence of owner-manager training may be for two reasons. First, the qualitative data suggested that owner-managers typically adopt a narrower definition of training when discussing their own learning than when discussing workforce training. Employers were less likely to describe informal practices and interactions with others at the workplace as training. Consequently, owner-managers may understate their own personal involvement as learners in training activities. Owner-managers tended to concentrate on training by external providers. Second, owner-managers may feel more constrained in the amount of training they undertake on the grounds that their absence would be more keenly felt than for other members of the workforce.
5 The definition of ‘established staff’ was left to respondents.

8
Of those owner-manager respondents who had founded their enterprises, about one in ten had undertaken some sort of training at the time they founded the business.6 This training took various forms, for example, formal training leading to formal qualifications such as City and Guilds through to more informal mentoring techniques. Levels of reported satisfaction with this training were variable with over 60% reporting they were ‘satisfactory’ or ‘very satisfactory’ and nearly a quarter reporting dissatisfaction. Among respondents who founded their businesses, those receiving start-up training were slightly more likely to report undertaking training in the year prior to interview (44%, compared to 37%). Respondents were asked to rate their satisfaction with the start-up related training they had received on a 5-point scale. Respondents reporting medium levels of satisfaction with start-up training were more likely to report undertaking training in the year prior to interview. Variation in Training Provision by Size of Enterprise Larger employers were more likely to provide training for new recruits, established staff and owner-managers (Table 2.1). The relationship was strongest for continuing training for established staff where 83% of employers with 20 or more workers reported the provision of training compared to only 56% of employers with 2-9 workers. Variations in the provision of initial training between enterprises of different sizes were much less marked because of the overall high incidence of initial training reported. For owner-managers, the positive relationship between training provision and size of enterprise may reflect a greater willingness among owner-managers to undertake training the larger the business; or, alternatively, it may reflect a perception that barriers to training are less restrictive in larger businesses. The relationship between size of enterprise and barriers to training is discussed in Chapter 7. Across the whole sample, training index values were also higher, on average, for larger employers (Table 2.1). Average training index values varied from 0.39 for employers with 20 or more workers down to 0.26 for micro employers. But such an association simply reflects the higher likelihood that larger employers provide training to at least one member of the workforce in any given time period. If only those providing training to established staff in the year prior to interview are examined, the relationship disappears. Among trainers, training index values are very similar whatever their size (0.46-0.48), indicating that where employers do provide training, very similar proportions of the workforce receive it. Sectoral Variation in Training Provision Reported incidence of training provision varied systematically with industry group (Table 2.2). Employers in ‘other services’, ‘business and professional services’ and ‘primary and construction’ were more likely to report training for all three categories of recipient than those in other sectors. For all types of training, these three sectors constituted the top three trainers. Conversely, employers in ‘transport and communications’, ‘distribution, hotels and catering’ and in ‘manufacturing’ constituted the bottom three sectors for all three types of recipient.
6 73% of owner-manager respondents reported they were the founder (or co-founder) of the business.

9
Table 2.2
Training Provided For New Recruits, Established Staff and Owner-Managers During the Past Year by Industry Group (weighted)
% of employers reporting
initial training for new recruits
further training for established staff
undertaking training themselves
Training Index (whole sample)
Training Index (trainers only)
Primary & construction 86.8 55.4 41.9 0.27 0.48 Weighted N 86 166 142 166 92 Other services 86.0 76.9 55.7 0.44 0.57 Weighted N 83 128 88 127 98 Business & professional services 83.5 74.0 63.4 0.33 0.45 Weighted N 131 240 202 237 174 Distribution, hotels & catering 82.4 46.9 22.8 0.20 0.43 Weighted N 205 327 296 325 152 Manufacturing 72.5 52.7 32.3 0.22 0.41 Weighted N 67 105 94 105 55 Transport & communications 51.1 36.7 29.2 0.16 0.44 Weighted N 18 39 34 39 14 ALL 81.7 58.8 40.2 0.27 0.47 Weighted N 590 1005 857 999 585
Notes: Industry groups based on Standard Industrial Classifications (SIC) 1992 industry groups. Question concerning initial training only asked of those employers reporting any recruitment during the past year (weighted N=590). Question concerning owner-manager training only asked of respondents who were owner-managers (weighted N=857). Column Ns do not sum to 857 due to rounding. Training index values are sample mean averages calculated by dividing the number of established workers receiving training in the year prior to interview by employment at the time of interview. The index numbers are the average for the whole sample or sub-samples shown. Training index values given for whole sample (weighted N=1005) and for employers reporting training for established staff only (weighted N=585). Excludes cases for which data is missing for either number of established staff trained or workforce size.

10
Training index values across the whole sample varied from 0.16 in ‘transport and communications’ to 0.44 in ‘other services’. Again, this reflects the variable incidence of training provision in different industries. But, taking only those firms reporting any training provision for established staff in the year prior to interview, the range of training index values is narrower though differences between industries remain. Employers in ‘other services’ report the highest index value (0.57); all other sectors, on average, provide training to fewer than half of their established workers. Variation in Training Provision by Occupational Group Incidence of training varied with occupational category (Table 2.3). By a considerable margin, professional and technical workers were more likely to receive training than other occupational groups. Sixty per cent of respondents employing this category of worker also reported providing training for at least one such worker. Conversely, only a third of employers employing clerical & secretarial staff reported providing training for that category of employee. If training indices are examined, we find that employers of professional and technical workers and of employed managers have the highest training indices (0.38 and 0.33 respectively). This suggests that in enterprises employing these categories of workers, 38% and 33% of established staff (in all occupational categories) received training during the past year respectively. Focusing only on those employers reporting training for established staff during the previous year shows a slightly different picture. Employers of employed managers and of professional and technical workers again have the highest training indices (though their rank order is reversed) (0.50 and 0.49); employers of semi- and unskilled manual workers also had a high training index (0.48). Because firms in different industries differ in their occupational composition (see Table A1.4 in Methodological Appendix), it is likely that variations in different occupational groups receiving training will feed through into sectoral differences. ‘Business and professional services’ and ‘other services’ employ higher proportions of professional and technical workers, and employers in these sectors were more likely to provide training for both workers and owner-managers (see Table 2.2). The Content of Training The content of training can be seen as having two dimensions: the format or means by which knowledge and skills are imparted to recipients; and the specific character of the knowledge and skills imparted. Much training in small businesses takes an informal character, with the emphasis on subtle forms of influence and guidance from employers and others at the workplace rather than structured forms of instruction. Training is often incorporated within routine working practices and is not an additional activity. To this extent, much learning is tacit: employers believed that workers themselves did not generally define these experiences as training. This is particularly the case with initial training but applies also to training for established staff and owner-managers. Consequently, many respondents did not initially describe these activities as ‘training’. With interviewer encouragement, respondents were able to discuss these practices and their benefits.

11
Table 2.3
Provision of Training to Established Workers by Occupational Group (weighted)
Occupational group % providing further training for established workers in occupational category
in past year (of those employing anyone in
this occupational group)
Training Index (of those employing
anyone in this occupational group)
Training Index (of those employing
anyone in this occupational group and
providing training to established staff)
Weighted N
Professional & technical 60.0 0.38 0.49 242 Semi & unskilled manual 42.2 0.27 0.48 522 Craft & skilled manual 37.5 0.23 0.40 373 Employed managers 37.1 0.33 0.50 311 Clerical & secretarial 33.5 0.28 0.43 496 Notes: Definition of occupational categories left to respondents. Ns apply to first column only; Ns are lower for training index columns.

12
Telephone survey data showed that initial training most frequently took the form of ‘learning on the job’ (84% of recipients of any initial training), informal conversations with the respondent (74%), ‘tours of the workplace’ (66%), or with other members of the workforce (62%). More formal methods were used less frequently: ‘reading manuals or other documents’ (51%), ‘off the job instruction by another member of staff’ (36%), ‘external training’ (4%) and use of videos (0.4%). On-the-job methods were also used by established staff and, to a lesser extent, by owner-managers themselves. The qualitative data clearly demonstrated the informal character of this kind of training. On the specific character of the knowledge and skills imparted, a distinction can be drawn between skills training, aimed at improving workers’ job performance, and non-skills training, the purpose of which is to provide knowledge and/or skills not directly related to specific work roles. Examples of non-skills training might be learning about working relationships, health and safety regulations and internal administrative procedures. Non-skills training is a particular feature of initial training where newcomers become acquainted with firm-specific systems of administration but there may be occasional need for established staff to undertake such training where internal procedures are changed. Turning to skills-related training, the content of training was very varied (Table 2.4). For each type of recipient (new recruits, established staff, owner-managers themselves), respondents were asked whether any of 14 different types of training had been provided in the year prior to interview. The proportion of employers reporting whether each type of training had been provided varied substantially for the three types of recipient but there were discernible similarities in their ranking. For all types of recipient, ‘working methods’ was ranked most important, and ‘health and safety’ and ‘product knowledge’ were also ranked highly. Together, this type of training content suggests a focus on operational matters concerned with enabling people to perform their jobs competently and safely, and with providing them with a knowledge of the business’s products and services. Perhaps the major qualification to this picture concerns ‘computing/IT’ training. For established staff and for owner-managers, this was the second most frequently cited source of training, whereas for initial training it was ranked sixth. Again, though, given the increasing business use of information and communication technologies, such training might easily have been subsumed under ‘working methods’ by other respondents. Fewer employers reported types of training content that might be considered relevant to managerial work roles. Training concerned with ‘business strategy or planning’, ‘personnel’, ‘finance or accounts’ or ‘legal’ matters were reported by fewer than one in ten for all three types of recipient, although they were more prevalent in larger enterprises. Interestingly, too, ‘customer relations’ and ‘communication skills’ were reported as training topics by fewer than one in ten respondents in relation to established staff and owner-managers themselves; only for new recruits, where these were reported by at least a third of respondents.

13
Table 2.4 Content of Training (weighted)
% reporting: Initial training
for new recruits Training for
established staff Training for
owner-managers Working methods 75.5 30.6 18.0 Health & safety 61.3 22.9 11.7 Product knowledge 48.4 24.6 10.4 Customer relations 38.5 9.1 6.1 Communication skills 27.7 8.2 3.6 Computing/information technology 27.2 25.4 17.7 Marketing or sales 18.9 8.6 6.7 Quality standards 18.8 5.4 4.6 Business strategy or planning 5.9 3.2 6.0 Finance or accounts 5.1 5.4 7.4 Personnel 4.3 1.0 2.5 Legal 2.9 4.3 7.0 Exporting 0.2 0.3 1.5 ‘Management’ N/a N/a 1.6 Professional development/CPD N/a N/a 1.5 Other type of training 0.5 3.2 1.4 Weighted N 590 1005 857
Notes: Question concerning initial training only asked of those employers reporting recruitment of new staff during the year prior to interview. Columns do not sum to 100% due to multiple response. Question on training for owner-managers based only on replies from owner-manager respondents. The categories ‘management’ and ‘professional development/CPD’ were coded after the interview, derived from replies originally classified as ‘other’.
The Duration of Training One important measure of training is the amount of time spent undertaking or providing it. However, given the informal character of much of it and the way it is often seen as an integrated feature of working rather than a distinct adjunct to it, there are great difficulties in developing a useful measure of it. Two attempts to provide some measure of the amount of training provision were made: first, quantitative data was obtained from owner-managers as to how many days training they personally had undertaken in the year prior to interview; second, data on the duration of training was obtained in the face-to-face interviews. Quantitative data on respondents’ own training is very difficult to interpret. Because the question covered both in-house and external training, there was a very wide variation in the number of days training reported. Respondents’ differed from 1- 120 days, though 70% of those

14
reporting any training reported 10 days or fewer. In-house training, particularly that which is part of everyday working routines, or is otherwise difficult to distinguish from them, is difficult to quantify in a meaningful way. Data from the face-to-face interviews suggests that most training episodes were of short duration, usually half a day to a few days. There were instances of trainees undertaking longer periods of training, often allied with formal study or training in external organisations. This usually applied to initial training for new recruits. The period of initial training varied considerably depending on the job and the worker. Invariably, employers claimed that the duration of initial training varied according to trainees’ capacity to learn what was expected of them. But, more fundamentally, the duration of initial training varied with the job. For semi-skilled jobs, such as retail sales assistants, the period of initial training might be only a few hours. But where the job made greater skill demands upon the new recruit, the period of initial training – some might call it a period of ‘informal apprenticeship’ - might be years. In these cases, because this period of initial training is so lengthy, it might be difficult to sustain the distinction between initial training for new recruits and training for established staff. Workplace-based training provided by employers and experienced staff was often combined with more formal instruction at educational institutions. This approach was more common for young people in their teens and early-20s. Examples include skilled manual jobs in building, printing and hairdressing as well as professional white-collar jobs such as accountants, surveyors and architects. Employers recognised that long-term investments in ‘informal apprentices’ were risky as they may not generate adequate returns for years, if at all, if they were unable to retain them in their employ. The content and quantity of initial training was clearly linked with employers’ recruitment practices. Where employers recruit people lacking skills and experience, some sort of training is essential, even for jobs where the skills demanded are limited. Conversely, where employers recruit more highly skilled or experienced staff, their consequent need to provide initial training may be reduced, though even in these cases, the employer will want to ensure that new staff work in the specific ways required by the employer. Summary For many employers, initial training for new recruits was seen as paramount. Not only was the reported incidence of initial training higher compared to training for established staff or for owner-managers themselves, but its importance was emphasised in the face-to-face interviews. About eight in ten employers had provided initial training in the year prior to interview compared with six in ten providing training for established staff and four in ten owner-managers undertaking training themselves. For many owner-managers their training effort was concentrated on new recruits; training for established staff and for owner-managers was viewed as less important. Initial training was very widespread though its specific content varied from one employer to another, reflecting their particular needs. Most initial training took the form of informal coaching from employers and other experienced members of the workforce as well as learning on-the-job rather than more structured forms of learning. The period of initial training varied from a few

15
hours to a few years depending on the skills required and the job-holder’s previous work experience and aptitude in learning their designated role. Fewer than half of owner-managers reported undertaking training during the year prior to interview. Owner-managers tended to adopt a narrower definition of ‘training’ when discussing their own behaviour than when discussing workforce training. They thereby understated their own personal involvement as learners, particularly in relation to experiences and interactions at the workplace. The content of most training suggested owner-managers, like their workforces, were concentrating on day-to-day operational matters concerned with enabling the workforce to perform jobs competently and safely. The incidence of training provision related to what might be termed managerial or strategic matters was lower for all categories of recipient. There were differences in the reported incidence of training provision associated with size of enterprise, industry sector and workforce composition. Larger employers were more likely to provide training than smaller employers, particularly for established staff, though where they did provide it, similar proportions of established staff received it. Employers in ‘other services’, ‘business and professional services’ and, to a lesser extent, ‘primary and construction’ were more likely to provide training than employers in other industries. Employers with professional and technical workers were more likely to provide training and to provide training to a higher proportion of staff. These two points are related.

16
CHAPTER 3
EMPLOYER MOTIVATIONS TO TRAIN Introduction Employers undertake and provide training for a variety of reasons (Green 1997). Possible objectives include: raising workforce skills; increasing labour productivity; facilitating the introduction of new products or working processes; enhancing worker commitment to the enterprise; rewarding employees; reducing labour turnover; and, complying with legal requirements. Ultimately, it can be argued that the primary rationale for employers to provide training is to improve business performance, as defined by employers, although the assumed positive relationship between training and business performance has been questioned (Storey and Westhead, 1994). Recent evidence suggests that employers provide or undertake training to achieve short-term objectives such as solving specific problems or to help them perform their current jobs more efficiently rather than to achieve longer-term objectives such as, for example, business growth (Curran et al., 1996; Kitching and Blackburn, 1999). Consequently, employers will provide or undertake training only where they wish to achieve one or more of the above objectives and where they perceive training as a feasible and desirable means of achieving them. This chapter examines: • employer motives for providing training to new recruits, established staff and owner
managers themselves; • respondents’ preferences for in-house and external provision of training; • employers’ reasons for their preferences.
Employer Motives to Train For employers, training serves two major purposes. First, it provides staff with the skills and knowledge technically required to perform their jobs competently and safely. A second, related, objective of training is social: to secure employee cooperation with the specific set of working practices and relations into which they enter. In short, training is intended to produce a labour force which is both able and willing to work in accordance with employers’ expectations. This second objective is particularly relevant to the initial training of new recruits in inculcating the desired attitudes and behavioural norms in new staff. Employers use initial training to encourage new staff to shed their attachment to workplace norms acquired during any previous employment. For established staff this objective may be less salient because employers believe that staff have already learned the ‘appropriate’ behavioural characteristics. Within the broad framework of the two types of objective sketched above, small business employers provide training to achieve a number of objectives. More specifically, respondents were asked whether any of ten specified potential benefits of workforce training (six for owner-manager training) were relevant for their particular businesses or, conversely, whether they did not see any benefits arising out of training. Over 90% of the entire telephone sample reported at least one benefit of workforce training; only 9% reported no benefits (Table 3.1). Respondents gave an average (mean) number of just under five benefits, suggesting that employers

17
experienced a range of benefits of training.7 In contrast, no owner-managers reported that training for themselves offered no benefits (Table 3.2).
Table 3.1 Benefits of Workforce Training (weighted)
% of sample
% reporting as
‘most important’ reason
To improve worker skills for their current jobs 77.0 35.9 To improve business performance or to help the business survive
70.0 34.8
To introduce new equipment or software within the business
53.4 8.5
To improve worker skills for future jobs 49.3 2.6 To cope with business growth 48.8 2.7 To solve a specific work problem 46.5 1.5 To meet legal obligations 44.2 7.9 To increase worker commitment to the business 42.7 3.2 As a reward/incentive for employees 31.3 0.7 To reduce labour turnover 30.7 0.2 Other reason 0.8 0.6 Don’t see any benefits from training 8.7 N/a No data 0.3 1.4 Weighted N 1005 914 Note: First column does not sum to 100% due to multiple response.
Understandably perhaps, the primary benefits of training cited by employers were ‘to improve worker skills for current jobs’ (cited by 77% of respondents) and ‘to improve business performance or help the business survive’ (cited by 70%) (Table 3.1). Together these two benefits were cited by 70% of the sample as the most important reasons for providing training. Clearly, these two responses were not mutually exclusive; many respondents gave both as an objective. Improving workers’ skills for the current jobs was a key means through which owner-managers believed business performance would be enhanced. Indeed, these two responses were strongly correlated: where respondents reported one of these benefits, they were very likely to report the other. For owner-managers too, the primary aim was to improve business performance or to help the business to survive: 80% of owner-managers reported this a motive for their own training, and 39% reported it as the main benefit (Table 3.2). 7 Of course, prompting respondents with particular benefits may inflate number of affirmative responses, compared with more open-ended questioning. This is borne out by the interview data where employers tended to focus on only one or two benefits.

18
Table 3.2
Benefits of Training For Owner-Managers (weighted)
% of sample % reporting as main benefit
To improve business performance or to help the business survive
80.1 39.4
To cope with business growth 59.4 12.5 To meet legal obligations 52.0 17.1 To introduce new equipment or software within the business 53.9 16.2 To solve a specific work problem 46.1 7.7 Other reason 7.1 3.1 No data <0.1 3.9 Weighted N 345 345 Note: Table only includes replies from owner-manager respondents. Question only asked of those owner-managers reporting undertaking training in the year prior to interview. First column does not sum to 100% due to multiple response.
Training was often linked to the introduction of new equipment or software (Tables 3.1 and 3.2). More than half of telephone survey respondents reported it as a motive to train for established staff and for owner-managers. The qualitative data reinforced this view. New recruits and established workers had to be shown how to use equipment they would be required to operate in the course of their jobs. Even where staff had some relevant previous work experience, they often needed some guidance in the particular piece of equipment or software or in the specific ways employers required them to use it. Some training is compulsory as it is a legal requirement for operating, or continuing to operate, in particular types of business activity. Training to meet legal obligations was reported by 44% of telephone sample respondents, and by 8% as the main reason for providing training (see Table 3.1). Among owner-managers, the proportions were even higher: 52% and 17% respectively (Table 3.2). Most commonly, First Aid or Health and Safety training in order to comply with employment legislation were reported. Other examples included training to obtain or renew licenses to operate in particular industries, for example, commercial lorry repair and servicing. Employers provided training to enable staff and themselves to undertake regarding Continuous Professional Development (CPD). This was particularly common for professional and technical workers such as architects, accountants, surveyors and estate agents. Many professional bodies organise training events, including short courses, lectures and conferences, in which members are encouraged to participate. To maintain membership of such bodies, members are often required to undertake a minimum amount of CPD every year. Failure to meet such standards can result in sanctions being applied against members, including expulsion. Motives for undertaking

19
CPD included retention of membership of professional bodies and networking with others in the industry as well as the direct benefits of the training itself. Much less importance was attached to training provision to achieve longer-term objectives such as meeting future skill needs or managing business growth. For instance, although 49% of respondents cited training for future jobs as a benefit of training, less than 3% cited it as the main reason. Regarding business growth, identical figures were obtained. For owner-managers themselves, higher proportions gave business growth as a reason for undertaking training (59% and 13% respectively), suggesting a stronger association between owner-manager training and business growth. It would seem that training to meet future skill needs or for business growth is a much lower priority for small employers, though perhaps slightly more important for owner-managers’ own training. Uncertainty about the future means that it is more sensible for small employers to concentrate their limited resources on current problems. Seeking qualifications was not an important motivation for small business employers to undertake training themselves or to provide training for established staff. About one in ten respondents reported that someone in the business had achieved an NVQ in the year prior to interview and about one in eight reported that someone was currently working towards an NVQ (Table 3.3). For other, non-NVQ, qualifications the figures were higher, with achievement of a qualification reported by 17% of respondents, and someone working towards one in 14% of cases.
Table 3.3 NVQs and Other Qualifications: Achieved and Current (weighted)
Achieved During Past Year Currently Working Towards NVQ Other
qualification NVQ Other
qualification ANYONE 10.7 16.9 13.4 13.6 Owner-manager * 0.4 4.2 0.7 2.4 Partners/co-directors 0.1 2.6 <0.1 1.7 Employed managers 1.0 2.3 1.5 2.1 Non-managerial workers
10.1 12.3 12.2 8.9
No data 0.5 0.5 0.6 0.6 Weighted N 1005 1005 1005 1005
Note: * data for owner-managers only includes owner-manager respondents (weighted N=857); non-owner-manager respondents are excluded. Consequently, data for ‘anyone’ may be understated slightly as no data is available for owner-managers of 148 businesses (unweighted).

20
Qualifications were even less important to owner-managers themselves. Fewer than 1% of owner-managers reported either achieving, or working towards, an NVQ themselves during the year prior to interview and even fewer reported that a partner or co-director had achieved one. For other, non-NVQ, qualifications the proportions were slightly higher (4% and 2% respectively). No employer participating in the face-to-face interviews reported the achievement or current pursuit of any qualifications linked to training. The actual achievement (or pursuit) of qualifications was not a prime goal of owner-managers’ training policies; they may simply be an incidental outcome of recruiting particular types of staff, for example, young people. In-House Training and External Training: Employer Preferences In principle, employers have a variety of sources of training available to them both in-house and externally. In-house sources include employers themselves and other members of the workforce. A plethora of external providers exist including private training companies, employer bodies and trade associations, professional bodies and government-supported organisations. A distinction needs to be made between the trainer and the location. Trainers may be internal or external to the enterprise; but training may be provided at business premises or at some other location. External providers may provide training on business premises or, alternatively, employers and other members of the workforce may provide training to others at a location away from the workplace. The former was much more commonly reported than the latter. Initial training was provided not only by employers themselves but also by other members of the workforce too. Initial training provided by the workforce offers at least two advantages for employers. First, staff are often more knowledgeable than employers about their working routines as they engage in them every day. Second, it enables employers to share or relinquish day-to-day responsibility for managing initial training, thus saving time. In contrast to initial training which, in most cases, was provided at the workplace by in-house trainers, training for established staff and for owner-managers was delivered in a variety of formats: on- and off-the-job; at or away from the workplace; during normal working hours or outside them (Tables 3.4 and 3.5). Most employers reported using more than one format. Choice of source of training varied with the purpose of training and employer perceptions of the relative benefits and costs of training. For both established staff and for owner-managers, off-the-premises training provided during working hours was the most frequently cited. In comparison with training provision for established staff, owner-managers were more likely to report undertaking training themselves away from the workplace and a preference for it. In-house training was provided not only by in-house providers such as owner-managers themselves and other members of the workforce but also by external trainers. Often such training was provided by product suppliers or prospective suppliers, a common example being software training provided by suppliers as part of the sales package. Among respondents reporting on-the-job training provision for established staff, 34% reported external trainers as providers, either alone or as well as in-house sources. For in-house, off-the-job training, the proportion rises to 61%.

21
Table 3.4 Location of Training For Established Staff (weighted)
% of sample
% reporting as
‘most important’ ANY TRAINING FOR ESTABLISHED STAFF 58.8 N/a Off-the-premises, away from the workplace during working hours
35.3 39.1
On-the-premises, on-the-job training 32.4 37.5 On-the-premises, off-the-job training 11.3 7.3 Off-the-premises, away from the workplace outside working hours
11.7 6.3
Distance learning 1.4 0.7 On-the-job (unspecified) N/a 1.0 Off-the-job (unspecified) N/a 2.0 No data N/a 6.1 Weighted N 1005 591 Notes: First column does not sum to 100% due to multiple response.
Table 3.5 Location of Training For Owner-Managers (weighted)
% of sample
% reporting as
‘most important’ ANY TRAINING FOR OWNER-MANAGERS 40.3 N/a Off-the-premises, away from the workplace during working hours
24.8 43.4
Off-the-premises, away from the workplace outside working hours
14.6 17.3
On-the-premises, on-the-job training 11.3 16.8 On-the-premises, off-the-job training 7.8 8.9 Distance learning 2.8 1.1 Off the premises (unspecified) N/a 5.2 On the premises (unspecified) N/a 1.3 No preference reported/no data N/a 5.9 Weighted N 857 345 Notes: Table only includes replies from owner-manager respondents. First column does not sum to 100% due to multiple response.

22
For owner-managers, the proportion of cases involving external training providers, either alone or in addition to in-house providers was even greater: 75% for in-house, on-the-job training and 77% for in-house, off-the-job training. Using external training providers at an in-house location aimed at combining the advantages of in-house and external training: bringing in skills and knowledge unavailable in-house, tailoring training to suit the employer’s particular needs, and limiting working time lost as employees could return to work immediately after any training. Some employers also felt that bringing in outside trainers had the added benefit of encouraging the recipients of training to treat it more seriously than using in-house providers. In contrast to the findings of the telephone survey, the qualitative data indicated a strong employer preference for in-house training for established staff. For most employers, the ‘default position’ for workforce training was in-house provision, particularly where a satisfactory level of competence could be attained in a short period of time with relatively little training. Unless employers had strong reasons for providing training away from the workplace, in-house provision was the norm. While a similar argument can be made in respect of owner-managers’ own training, owner-managers often felt they would benefit less from in-house training (unless provided by external trainers) because they often considered themselves to be the most knowledgeable and/or skilled person in the business. As a consequence, owner-managers were much more prepared to seek external training opportunities for themselves than for their workforces. On-site training was much less commonly reported than for established workers: only a third (27%) reported a preference for in-house training (Table 3.5).8 Again, this might reflect owner-managers’ narrower definition of ‘training’; instead, regarding informal learning experiences at the workplace simply as part of their everyday job. Hence, owner-managers often place most emphasis on organised training episodes which take place away from the enterprise. Use of External Training Providers Employers use a wide range of external training providers (Table 3.6). Telephone survey respondents were asked which, if any, of 17 types of external provider they had used during the past year to provide training for established staff and for themselves. Just under half of the sample (48%) reported at least one external provider for workforce training during the past 12 months (Table 3.6); for owner-managers themselves the figure was 37% (Table 3.7).
8 This figure is derived by adding together the percentages in the three ‘in-house’ categories of the ‘most important’ column of Table 3.5.

23
Table 3.6 External Providers of Training For Established Staff
and Levels of Satisfaction (weighted)
% of sample % reporting as ‘most important’
Satisfaction rating (mean average)
Weighted N (for satisfaction
ratings) ANY EXTERNAL PROVIDER 47.7 N/a N/a N/a Colleges 15.3 21.7 4.1 148 Suppliers of equipment or products 15.0 21.1 4.2 150 Private training companies or consultancies 13.2 17.9 4.3 124 Trade bodies or professional organisations 5.3 7.5 4.3 54 Government organisations & initiatives 2.7 3.7 4.2 27 Exhibitions, conferences & shows 2.7 1.2 3.5 27 Voluntary organisations 2.4 2.0 4.8 21 National Training Organisations 2.0 4.0 4.3 20 Local authority 1.5 1.8 4.5 15 Training & Enterprise Councils 1.4 2.1 3.6 14 Universities 1.3 1.3 4.5 13 Employers’ organisations 1.2 1.8 3.0 12 Business Links 1.0 0.9 4.7 10 Accountants 1.0 1.1 4.0 6 Customers 0.4 0.7 3.9 4 Other provider 1.4 1.7 4.6 11 No data N/a 9.5 N/a Weighted N 1005 479 Note: First column does not sum to 100% due to multiple response. Weighted N column refers to the number of cases reporting a satisfaction rating for each type of provider. Respondents were asked to rate how satisfied they were with each type of provider using a 5-point scale with 1 meaning ‘very dissatisfied’ and 5 meaning ‘very satisfied’.

24
Table 3.7 External Providers of Training Used By Owner-Managers and Levels of Satisfaction (weighted)
% of sample
% reporting as
‘most important’ provider
Satisfaction rating (mean average)
Weighted N (for satisfaction
ratings) ANY EXTERNAL PROVIDER 37.3 N/a N/a N/a Suppliers of equipment or products 9.5 18.5 4.2 82 Private training companies or consultancies 7.7 14.5 4.3 66 Trade bodies or professional organisations 7.5 10.5 4.2 64 Colleges 7.3 12.2 3.9 63 Government organisations & initiatives 3.3 6.2 4.0 28 Local authority 3.0 6.4 4.5 26 Universities 2.8 5.1 4.4 24 Exhibitions, conferences & shows 1.8 2.4 3.7 15 Employers’ organisations 1.5 3.4 3.8 13 Voluntary organisations 1.4 2.1 4.5 12 Business Links 1.4 0.5 4.5 12 Accountants 0.8 0.7 4.8 7 Training & Enterprise Councils 0.8 0.7 3.3 7 Banks 0.4 0 4.9 4 Customers 0.2 0.4 4.2 2 National Training Organisations <0.1 0.1 N/a N/a Other provider 3.6 7.7 4.7 31 No data N/a 7.5 N/a N/a Weighted N 857 320 N/a N/a Note: Table only includes replies from owner-manager respondents. First column does not sum to 100% due to multiple response. Weighted N column refers to the number of cases reporting a satisfaction rating for each type of provider. Respondents were asked to rate how satisfied they were with each type of provider using a 5-point scale with 1 meaning ‘very dissatisfied’ and 5 meaning ‘very satisfied’.

25
The most frequently cited external providers of workforce training were colleges and suppliers (both cited by 15% of the telephone sample), and private training companies (13%) (Table 3.6). A similar ordering of the key providers is evident in responses to questions regarding the main external training provider. For owner-manager training, a similar ranking of providers is evident, albeit at a lower overall level of utilisation (Table 3.7). Suppliers (cited by 10% of employers), private training companies (8%), colleges (7%) and trade bodies or professional organisations (8%) were the most frequently reported external training providers. No other provider was used by more than 4% of owner-managers. Government-supported providers were seldom used. TECs, National Training Organisations (NTOs) and Business Links provided training for 2% or fewer of telephone sample businesses in the year prior to interview, though it is possible these figures understate the role of these organisations as much of their support is delivered through private training companies. External providers were seen as more important to owner-manager training than to workforce training. Nearly two thirds of respondents (66%) reporting any owner-manager training during the previous year reported that external training was the most important type of training undertaken; the figure for established staff was 47% (see Tables 3.4 and 3.5). Owner-managers appear generally well satisfied with the external training providers they used (Tables 3.6 and 3.7). Respondents were asked to rate each type of external provider on a 5-point scale with 1 meaning ‘very dissatisfied’ through to 5 meaning ‘very satisfied’. It is worth remembering the small weighted subsample sizes for infrequently used providers. All providers received an average (mean) rating of at least 3 and most were higher than 4. Only a very small proportion of users reported being ‘dissatisfied’ or ‘very dissatisfied’ with any particular type of training provider. Colleges were the only type of provider which more than 10% of users reported dissatisfaction. Interestingly, for both workforce and owner-manager training, Business Links and voluntary organisations were cited amongst the three highest rated training providers. On the other hand, the three lowest ranked providers were the same for both workforce training and for owner-manager training, albeit in slightly different order: the now defunct ‘TECs’, ‘exhibitions, conferences and shows’ and ‘employers’ organisations’. Reasons for Preferring In-House Training Employers reported several advantages of in-house training. First, it was perceived as more relevant than external training as it could be tailored to suit the specific needs of both employers and workers (reported by 73% of telephone survey respondents as a reason for preferring in-house training for established staff and by 55% as the main reason). Where knowledge and skills could be transferred or taught in house, employers preferred to train in this way. This was particularly important given that 60% of respondents reported that the training they provided was ‘mostly specific to their own businesses’; a further 16% reported that their training was a mix of specific and general training. Moreover, where few relevant training opportunities were available outside the enterprise, employers had no alternative but to train in-house. This may be especially likely in highly innovative companies where the required knowledge simply does not exist outside the enterprise.

26
A second perceived advantage of in-house training was convenience (reported by 67% as a reason for preferring in-house training for established staff and by 38% as the main reason). In-house training could be provided at times which best suited provider and recipient of training, rather than accommodating the timetable of an external provider. Moreover, in-house training reduced down-time as trainees saved on time attending and travelling to and from the training event. On-the-job training enabled trainees to undertake training and perform ‘productive work’ simultaneously (albeit at a lower rate of efficiency). A third advantage of in-house training provision concerned its cost: in-house training is often cheaper than external provision, particularly where in-house providers are used, as little direct financial cost in terms of course fees or travel expenses is incurred. Where external training providers are brought in, the direct financial costs of providing training will be higher. Lower costs of training were reported by 26% as a reason for preferring in-house training and by 4% as the main reason. Owner-managers differed slightly in their rationales for preferring in-house training for themselves. They were more likely to cite convenience rather than relevance as the main reason for preferring in-house training (64% of owner-managers exhibiting such a preference, compared to 35% citing relevance). Again, the views of owner-managers can be linked with their role as perhaps the most knowledgeable and skilled person within the business. In-house providers might be seen as less valuable sources of new ideas and skills. Hence the main benefit from using in-house sources lay in their convenient presence at the workplace. Reasons for Preferring External Training Where employers preferred externally provided training, they did so for several reasons. By far the most important reason cited was that employers lacked the skills and knowledge to provide in-house training. Nearly a half of the telephone sample (46%) reported this as a reason for preferring off-the-premises training and 29% reported this as the most important reason for preferring external training. A further 21% cited external training as the only (or best) option as the most important reason.9 Other reasons for the preference included: possibility for free or subsidised training (cited by 14% as the most important reason); in order to meet legal obligations (8%); lack of equipment in-house (7%). All other reasons were cited by fewer than 5% of those expressing a preference for external training. Owner-managers offered similar reasons regarding their preference for external training for themselves. ‘Lack of in-house skills’ (cited by 28% of those preferring external training as the main reason for that preference), ‘only/best option’ (cited by 19%) and possibility of free or subsidised training (cited by 12%) were the reasons most commonly reported. Combining these replies suggests that a half of owner-managers prefer off-site training provision primarily because the in-house option is simply not viable due to a lack of knowledge and skills. This is perhaps more intelligible in the case of owner-managers in that they might be expected to be among the most knowledgeable and skilled people within their enterprises. But, again, it may
9 This category was coded after the interview following an analysis of ‘other’ responses after the completion of fieldwork. It is possible that had this question been asked of all respondents, a higher proportion of respondents would have replied in the affirmative.

27
reflect the narrower definition of training adopted by owner-managers concerning their own learning and the consequent tendency to overlook in-house learning and training experiences, particularly where other members of the workforce are the providers. Summary Employers pursue two major objectives through the provision of training: to equip new staff with the specific skills and knowledge required to perform their current jobs competently and safely; and, second, to inculcate an awareness and acceptance of the employer’s expectations regarding their work performance and prevailing working arrangements. This is pertinent for all workforce training but particularly so in respect of initial training for new recruits. More specifically, the key objectives of training were to improve workers’ skills for their current work roles and to improve business performance; indeed, these two goals were closely related. In most cases training was seen as a means for enabling workers to raise their individual job performance but it also reflected other goals such as meeting legislative requirements such as those related to health and safety. Other objectives such as training to meet future skill needs or to manage business growth were of much less significance for owner-managers. The ‘default position’ for most employers was to provide training using in-house sources unless there were strong reasons to use external providers. In-house training had the advantages of relevance, convenience and low cost. Training could be tailored to suit the specific requirements of worker and employer, be delivered at times and in formats which were convenient to both parties; plus it was relatively cheap in avoiding the financial costs of course fees, travel and accommodation costs associated with training away from the business. In-house training was usually provided on-the-job to tackle some immediate problem affecting individual workers, for instance, the introduction of new software or equipment. External training providers were used primarily because the employer lacked the skills and knowledge to provide the training in-house; hence those resources had to be sought externally. Most commonly, the required resources were the skills and knowledge but lack of equipment and, less often, space also forced an external search for training. Sometimes external training opportunities were undertaken to solve a short-term problem but often they had a longer time frame. Common reasons for pursuing external training included the provision of Continuous Professional Development for professional workers and training to meet some external standard usually backed up by legislation, for example, health and safety. Frequently, external training providers were brought into the employer’s premises. Employers aimed to combine the advantages of in-house and external training. Common examples of this approach include using equipment and product suppliers to provide short periods of training either to inform them about products and their features or, alternatively, to enable workers to use their products.

28
CHAPTER 4
DETERMINANTS OF TRAINING PROVISION Introduction In this chapter we examine those factors which influence the incidence of training in small firms. Potential explanatory factors on training include business sector, size, the level and nature of product market competition, organisational change, employment and sales turnover and profit performance. The analysis will focus on training for recruits, established staff and owner-managers. Following a discussion of the ways in which these factors may be argued to impact upon training activity in each of the three employment categories within the surveyed firms, and a preliminary univariate investigation, the chapter concludes with a number of multivariate model estimations which seek to show the relative importance of these variables on training. Product Market Competition and Training Provision Arguments can be presented as to why the level and nature of product market competition might affect training provision in the small enterprise. On the one hand, a high level of competition may encourage business owners to seek new means of creating and sustaining a competitive advantage over rivals. One means of doing this might be to develop the stock of skills available to the employer through training in order to improve efficiency or to innovate in products and processes. Alternatively, a high level of product market competition might limit employer investments in training because margins are so tight. Similarly, the nature of product market competition may impact upon training in a variety of ways. Where business owners compete primarily on the basis of cost, it can be argued that employers face few incentives to increase workforce skills in order to improve product quality. They may, instead, attempt to maintain the ‘low skills’ equilibrium in order to avoid possible disadvantages of raising skills such as rising pay and a loss of control over labour. Conversely, where employers compete on the basis of product quality or product innovation, there may be frequent pressures to upgrade the skills of the labour force. The provision of training is likely to be a key component of such a strategy. Respondents were asked to rate how competitive their product markets were on a 5-point scale with 1 meaning ‘not very competitive’ and 5 meaning ‘very competitive’. Over half (53%) of respondents gave the highest rating of 5; a further 24% offered a rating of 4. The average (mean) rating for the sample was 4.2. Data on the links between the level of product market competition and training activity was mixed (Table 4.1). Comparing those providing three types of training (initial training for new recruits, training for established staff, training for owner-manager respondents) with those not providing such training, we find that only in the case of training provision for established staff do trainers record higher competitiveness ratings than non-trainers. In the case of initial training

29
and owner-manager training, it is non-trainers, on average, who reported higher ratings for product market competition. Moreover, for all three types of recipient the differences in ratings were not great. Together, these pieces of evidence suggest that the level of product market competition does not have a large and distinctive impact on training provision. Data on the links between the nature of product market competition and training activity was also mixed. Employers providing initial training to new recruits were much less likely than non-trainers to cite price as the main reason for attracting customers: only 9% of initial trainers reported it as the main factor compared to 30% of non-trainers. The figures for owner-manager training also revealed a difference: only 7% of those owner-managers undertaking training during the previous year reported price as the main source of customer loyalty, compared to 12% among non-trainers. Perhaps surprisingly, there was no difference in the proportion of employers reporting price as the main basis of customer loyalty with regard to training for established staff: 11% of both trainers and non-trainers reported price as the key factor.
Table 4.1 Comparison of Training Enterprises and Others
by Reported Level of Product Market Competition (weighted) Average (mean)
level of competition Weighted N
Initial Trainers 4.22 482 Non-initial trainers 4.37 107 No recruits in previous year 4.13 402
Training for Established Staff 4.23 586 No Training for Established Staff 4.15 406
Training for Owner-Managers 4.10 344 No Training for Owner-Managers 4.32 500
ALL 4.20 991
Notes: Respondents were asked to rate how competitive their product markets were on a 5-point scale with 1 meaning ‘not very competitive’ and 5 meaning ‘very competitive’. No data available for 14 cases (unweighted).
Organisational Change and Training Provision Broader organisational changes may have a causal influence on small business owners’ provision of training. By implementing changes, employers may face pressures (or, alternatively, have an incentive) to train themselves and/or their workforces. Three types of organisational change are distinguished: the introduction of new products and services; the introduction of major changes in equipment, and the introduction of major changes in working methods or workforce

30
organisation. The extent to which businesses are involved in product and process innovations in turn reflects the environment they operate in. Where businesses operate in dynamic market conditions which demand a high level of innovation in products and processes in order to compete, owner-managers may feel it necessary to train frequently to develop the knowledge and skills which enable them to implement change successfully. Training provision for all three categories of recipient (new recruits, established staff, owner-managers) was associated with the introduction of a number of specified organisational changes during the previous year (Table 4.2). For all categories of trainee, those providing training were more likely than non-trainers to have introduced the specified changes. For example, among those providing initial training to new recruits in the year prior to interview, 33% reported the introduction of new products and services during the year, compared to 31% of those not providing initial training. Regarding major changes in equipment the proportions were 43% of initial trainers and 33% of non-trainers. Similar arguments apply to training provision for established staff and also for owner-manager training. In each case, a higher proportion of trainers than non-trainers reports each type of organisational change. Training index values for those implementing each of the three types of organisational change were higher than for those not making such changes. For those introducing changes, the index value was 0.34 or 0.35, suggesting that about a third of these enterprise’s workforces, on average, received training during the year. For those not implementing the specified changes index values varied from 0.23-0.25. In general terms, there was also a positive association between the number of types of organisational change introduced and the incidence of training (Table 4.3). For example, among those respondents reporting all three types of organisational change, 95% reported the provision of initial training to new recruits; only 5% were non-trainers. But, conversely, among those reporting none of the specified changes, 76% reported initial training and 24% were non-trainers. Broadly similar patterns were found for established staff and for owner-manager training. Moreover, those employers introducing such changes were likely to have provided training for a higher proportion of established employees. Respondents reporting all three of the specified types of change had a training index of 0.41 compared to 0.20 for those reporting none of the specified changes (Table 4.3). Clearly, where employers implement these types of change there is a need to develop workforce knowledge and skills to ensure changes are implemented successfully. This is perhaps most evident where new equipment or software are introduced. Those whose jobs will be directly affected by the changes need to be trained how to operate or use them. But also where a business introduces new products, staff will need to become knowledgeable in order to be able to discuss their function and features to potential customers. Most often, training was an integral part of the decision to introduce new products and processes; on other occasions, training preceded the introduction of new products and working routines, though in these cases, employers usually held no definite plan as to how training would influence these broader decisions.

31
Table 4.2 Incidence of Training Provision for New Recruits, Established Staff and Owner-Managers During the Past Year
by Type of Organisational Change (weighted)
Types of Organisational Change Introduced in the Previous Year: Major New Products
and Services Major Changes of
Equipment Major Changes in
Working Methods or Workforce
Organisation
WEIGHTED N
Initial training providers 33.1 42.5 33.4 482 Non-trainers (of initial training) 30.5 32.7 9.4 108 ALL 32.7 40.8 29.0 590
Providers of training for established staff 33.3 40.0 29.1 591 Non-trainers (of training for established staff) 20.6 22.6 14.6 414 ALL 28.1 32.8 23.1 1005
Owner-manager training 40.4 39.2 29.3 345 Non-trainers (of Owner-manager training) 20.4 28.7 20.4 512 ALL 28.5 32.9 24.0 857
Sample mean
average Trainee index per enterprise (implementing the change)
0.35 0.35 0.34 0.27
Trainee index per enterprise (NOT implementing the change)
0.24 0.23 0.25 0.27
Note: Question concerning initial training only asked of those employers reporting any recruitment during the past year (weighted N=590). Question concerning owner-manager training only asked of respondents who were owner-managers (weighted N=857). Trainee index values calculated by dividing the number of established workers receiving training in the year prior to interview by employment at the time of interview. The index numbers are the average for the whole sample or sub-samples shown. Excludes cases for which data is missing for number of established staff trained or workforce size.

32
Table 4.3
Incidence of Training Provision for New Recruits, Established Staff and Owner-Managers During the Past Year by Extent of Organisational Change (weighted)
Number of Types of Organisational Change Reported: 3 types 2 types 1 type None ALL
Initial training providers 95.5 84.0 82.4 76.4 81.7 Weighted N 66 106 193 225 590 Providers of training for established staff 79.5 63.4 73.1 44.5 58.8 Weighted N 83 145 308 470 1005 Owner-manager training 52.1 57.9 44.3 29.7 40.2 Weighted N 73 126 262 397 857 Trainee index per enterprise 0.41 0.32 0.33 0.20 0.27 Note: Question concerning initial training only asked of those employers reporting any recruitment during the past year (weighted N=590). Question concerning owner-manager training only asked of respondents who were owner-managers (weighted N=857). ‘ALL’ row Ns derived from cross-tabulations across entire sample. Therefore, row Ns do not sum to ALL row Ns due to weightings being rounded. Trainee index values calculated by dividing the number of established workers receiving training in the year prior to interview by enterprise employment size. The index numbers are the average for the whole sample or sub-samples shown. Excludes cases for which data is missing for number of established staff trained or workforce size. Training index values given for whole sample (weighted N=1005) and for employers reporting training for established staff only (weighted N=585).

33
The qualitative evidence suggests that training can be both a cause and a consequence of organisational change. More often, changes in working practices preceded training but in other cases training preceded the introduction of new products or working processes. In the latter case, the link between training and organisational change was often diffuse with respondents being aware that training might lead to other innovations at some unspecified point in future rather than because owner-managers had some definite plan as to how training might bring about such innovation. Depending upon the quality of training, owner-managers might subsequently decide to develop new products or processes based on the new knowledge or skills acquired. Training Provision and Employment Change Evidence on the relationship between training provision and employment change offers a very mixed picture. There is no clear and unambiguous association between training and changes in numbers employed. The provision of initial training for new recruits was associated with both an increase in employment over the previous two- and five-year periods and with a decrease; initial trainers were less likely than non-trainers to be associated with employment stability. On the other hand, those providing initial training were slightly more likely to anticipate an increase in numbers employed over the next two years. Those providing training for established staff during the year prior to interview were more likely to report experiencing employment expansion during the previous two- and five-year periods and were also marginally more likely to report employment falls too. Again, non-trainers were more likely to report employment stability over the two periods. Trainers were slightly more likely to anticipate an increase in employment over the next two years. Owner-managers undertaking training themselves in the year prior to interview were slightly more likely to report an increase in employment in their businesses over the previous two- and five-year periods than those not undertaking any training. They were noticeably more likely to expect an increase in employment over the following two years than non-trainers. The relationship between training provision and employment change is clearly complex. Differences between those providing (or undertaking) training were often very slight, suggesting that even where there was a strong relationship between these two variables, other counteracting (and possibly reinforcing) pressures were at work. Even if a clear empirical association could be discerned, it is still debatable whether the relationship is causal and, if so, in which direction, although there did appear to be an association between training provision and changes in the level of employment. Training Provision and Financial Performance The data on the link between training provision and financial performance indicators was equally ambiguous. Initial trainers were slightly more likely to report stability in real sales turnover over the previous two years whereas non-trainers were more likely to report either an increase or a decrease. Nor were initial trainers more likely than non-trainers to expect an increase in turnover over the coming two years. Moreover, initial trainers were marginally less likely than non-trainers to report they had made a profit in each of the previous two years.

34
Those providing training for established staff during the year prior to interview were marginally more likely to report both an increase in sales turnover growth over the previous two years and to anticipate an increase in turnover over the coming two years, compared to non-trainers. But, on the other hand, trainers were marginally less likely than non-trainers to report they had made a profit in each of the previous two years. Owner-managers undertaking training during the year prior to interview were more likely to report that business turnover had increased in real terms over the previous two years and even more likely to report an expected an increase over the next two years, in comparison with non-trainers. They were also more likely to report a profit in each of the previous two years. Again, the problem of teasing out causal connections is evident. Associations between variables by themselves do not provide strong evidence of the direction of causality. Training may be a cause or a consequence (or both) of employment change. For expanding businesses, training may be a key cause underlying employment and/or sales growth. Alternatively, training might be a response to that growth. Developing a Multivariate Framework In this section the analysis is divided into two parts. First, a simple OLS regression estimation is presented which seeks to explain the variation in the value of the Training Index for established employees discussed earlier in the chapter and the relative significance of potential explanatory variables. Second, three dichotomous Logit models were developed for each of the three employment categories within the surveyed firms, in order to explain the presence or absence of training activity for these groups, and the results are discussed here. Training Index From the various OLS regression estimations undertaken, the preferred model is presented below in Table 4.4. In this model, the key explanatory variables are assigned binary values. Not surprisingly, the R2 is low (0.084) but the overall equation is significant and there are a number of variables which are positively and significantly related to the value of the Training Index for established employees. The equation therefore lacks overall explanatory power but does indicate the relative significance of the main variables already identified and discussed in previous chapters. These variables fall into three broad categories: firm characteristics, business performance and business strategy. Higher training index scores are associated with larger and younger firms in the sample as well as those in the Business and Professional Service sector. In addition, those firms growing in employment terms in the last five years also had a higher Training Index score. Finally, those firms that had either introduced major new products and services and/or had introduced new working methods and workforce organisation also recorded a higher index.

35
Table 4.4 Equation for Training Index
Variable Coefficients t statistic
Constant 7.589-2 2.283 Size of Firm (log of employment)
8.864-2 5.259
Age of Firm (1=Established before 1980; 0=Established after 1980)
-7.84-2 -3.943
Sector (1=Business and Professional Services; 0= Other sectors)
8.364-2 3.841
Introduced any major new Products or Services (1=Yes; 0=No)
6.876-2 3.172
Employment Increase in the Last 5 years (1=Yes; 0=No)
3.587-2 1.838
Introduced any Major changes in Working Methods or Workforce Organisation (1=Yes; 0=No)
3.937-2 1.714
R2 = 0.084
n=1005 F = 16.305
Training Activity and Employment Categories Dichotomous Logit models were developed in turn for the extent of training activity in each of three employment categories: owner-managers, existing workers and new recruits. Each of the models is different in specification in very significant ways. For owner-managers the probability of receiving training is positively and significantly associated with a complex set of factors which include size of firm (larger firms), business and professional service sector, the level of competitiveness, profitability, employment increase in the last two years and the introduction of new products and services during the previous year. For established workers the receipt of training is positively and significantly related to a more restricted set of variables which include firm size (larger firms), business and professional service sector, the introduction of new products and services as well as the introduction of new working methods and workforce organisation during the previous year. Controlling for size and sector these latter two variables indicate that training is more likely for established workers when the firm is undergoing some degree of internal re-organisation. Finally, for new recruits the probability of receiving training is significantly related to only two variables - the firm using product price as a competitive strategy and the introduction of new working methods and workforce organisation during the previous year.
36
This multivariate approach is regarded as an important supplement to the univariate and qualitative analyses exploring the factors which are correlated with higher levels of training in the small firm. Although the each of the models revealed similarly low R2 , the analysis tended to reinforce the findings in the univariate analysis. Summary In this Chapter an analysis was undertaken to discover if any associations existed between training provision and a variety of possible causal influences, including the nature and level of product market competition, the incidence of various product and process innovations, employment change and measures of financial performance. This analysis complements that undertaken in Chapter 2 in which enterprise size, sector and workforce composition were shown to be associated with various measures of training activity. In the analysis, both univariate and multivariate, training provision was linked to some sort of change in the workplace: either changes in working methods and/ or the introduction of new goods and services. In the univariate analysis, training for all categories of workers (new recruits, established staff and owner-managers) was associated with the introduction of the three specified types of organisational change (new products or services, major changes in equipment, major changes in working methods or workforce organisation). In the multivariate analysis, there appeared to be additional significant variables for some groups over and above these common factors. For owner-managers and established staff, size of enterprise appears to be important whereas for initial recruits this was not important. Quite clearly, it is easy to posit an explanation for the provision of training in terms of changes in products and processes. Such changes are likely to necessitate adjustments in individuals’ work roles and, consequently, the skills and knowledge required to facilitate their successful implementation. The impact on training will of course depend on the precise character and extent of any organisational change. Extensive or fundamental changes in products and working processes are likely to require more substantial developments in workforce skills than minor modifications. From the analysis in the Chapter, this was the strongest link to emerge when examining the correlations between the incidence of training and business characteristics.

37
CHAPTER 5
TRAINING AND BUSINESS PERFORMANCE Introduction There has been considerable debate surrounding the relationship between training and business performance. Storey and Westhead (1994) argued that quantitative studies have not demonstrated a clear link between the provision of management training and business performance. They further argued that failure to establish such a link might deter small employers from providing training. Subsequent research has suggested a positive causal relationship between training provision and employment growth where training is persistent and embedded in particular human resource practices such as total quality management, quality circles, job rotation and performance-related pay (Cosh et al. 2000). Intensity of training, measured in terms of training costs as a percentage of total sales, was also found to be positively and significantly related to employment growth. Problems With Existing Research However, there are problems in conceptualising both ‘training’ and ‘business performance’ which render attempts to understand and measure their relationship very difficult. Several recent studies have used a binary indicator as their measure of training (e.g. Westhead and Storey 1997; Cosh et al. 1998) - whether training is provided or not - but this fails to distinguish adequately the quantity or quality of such training. The recent attempt by Cosh et al. (2000) to provide a more sensitive measure of the quantity of training uses training costs as a percentage of total sales. This measure, however, seems most appropriate to training which has a measurable money cost as in the case of external courses. Training which does not incur a direct or easily measurable money cost, such as that provided in-house by employers or other members of the workforce, would not appear in this type of calculation. Indeed, informal learning at the workplace, despite its pervasiveness, may be impossible to cost because of its diffuse character. Unfortunately, this is a serious omission because small business owners often rely heavily on in-house training. Similarly, ‘business performance’ is usually operationalised in terms of ‘hard’ quantitative measures such as sales or employment growth, or profitability. Hence models implicitly assume that increases in the value of these variables are unambiguously a benefit for owner-managers. But these may not be the most suitable measures and it cannot be assumed that owner-managers’ objectives include sales and employment growth. Indeed, small employers may resist pressures towards expansion, preferring instead to operate at lower levels of scale or aim to achieve modest rather than fast growth. Business owners may attach greater importance to ‘softer’ objectives such as increased leisure time, cooperative employment relations or a satisfied workforce, goals which do not translate easily into quantitative measures of sales or employment growth. A second issue concerns understanding the relationship between training provision and business performance. Multivariate statistical analysis attempts to determine which factors have a causal

38
influence on business performance and the strength of that impact. But without a better qualitative understanding of the processes through which training (and other factors) causally affects business performance, it is difficult to gauge their relative importance or, indeed, whether the relationship is causal at all. It may be difficult to isolate the specific impact of training on business performance as the latter is affected by many factors, several of which it may not be sensible to define quantitatively. For example, the impact of training on performance is likely to be mediated by the social organisation of work, employers’ product market strategies and the broader macroeconomic context. In the context of a general recession, an increase in workforce skills may be associated with a decrease in sales and employment. Nor is there any guarantee that any particular model will capture the most important causal forces underpinning business performance nor represent them satisfactorily. Furthermore, how decisive an impact training has on business performance is itself likely to be variable. Training and skills development may be crucial to business performance under some circumstances but of lesser importance in others. The argument that the lack of any demonstrated positive relationship between training and business performance may restrict the provision of training by small employers may also be doubted. Though the argument seems plausible, it assumes that small employers are able and willing to evaluate the consequences of their own training effort in terms of some index (or indices) of business performance, most notably those measures adopted in the statistical models. Yet employers may evaluate training, however intuitively, in terms of other measures more amenable to assessment. For example, they make their assessments of the impact of training on the job performance of individual workers rather than broader measures of organisational performance. Evaluating the Training-Business Performance Link: Some Findings Few telephone survey employers reported attempting to evaluate their training provision in any formal sense. Just 28% of those providing training for themselves or for established staff did so. Of these, most employers relied on ‘informal’ measures such as observing employees working or their outputs, or through some assessment of customers’ reactions. More formal practices such as appraisal or debriefing after training were less commonly cited. But despite these limited attempts to evaluate training provision, the vast majority of respondents (77%) felt that training leads to better business performance; fewer than 1% felt that training might lead to inferior business performance (Table 5.1). Those attempting to measure the benefits of training were more likely to report that training leads to better business performance than those who did not attempt to measure the benefits (90% compared to 78%).10 No-one reporting attempts to measure the effects of training on business performance also reported that training detracted from business performance. 10 These percentages were calculated on a subsample of the dataset (unweighted N=763). The subsample excluded cases where no training was reported either for established staff or for owner-managers. Hence the figures slightly inflate the percentages.

39
Trainers were more likely to report that training leads to better performance than non-trainers. For those providing initial training, 86% felt that training improved business performance; among non-trainers the proportion was only 68%. A similar pattern existed for established staff and owner-manager training though the margin was smaller between trainers and non-trainers. With regard to established staff, the proportions were 82% and 71% respectively. Among owner-manager respondents, 84% of those undertaking training felt that training leads to better business performance, compared to 75% of non-trainers. Contrary to the argument of Storey and Westhead (1994), the data is consistent with the view that employers’ perception of training as improving business performance reinforced its provision. Even among non-trainers for each type of recipient, a majority felt that training would improve business performance
Table 5.1 Perceived Impact of Workforce Training on Business Performance (weighted)
ALL
Training leads to better business performance 77.2 Mixed impact - Some training can lead to better business performance, some to worse
9.5
Difficult to tell whether training leads to better business performance 9.0 Training makes no difference 3.8 Training detracts from business performance 0.6
Weighted N 1005 The qualitative data suggested even more strongly than the quantitative data that employers evaluated their training provision, that evaluation tended to be informally conducted and that they believed that training provision produced benefits for their businesses. In contrast with other studies that focus on various measures of organisational performance (sales or employment growth), employers evaluated training in terms of workers’ job performance. If job performance was perceived as improved, training was defined as a success. Most employers seemed surprised by the question whether they could tell training had an impact on business performance. Many reported they could easily tell whether those receiving training were able to perform their jobs in a more efficient or safe manner. Most employers claimed to be able to do this through observation of people working and their ‘outputs’. Training whose purpose was to enhance workers’ current skills could be assessed very quickly; conversely, training whose benefit may not be evident for some time is more difficult to evaluate.
“Internal training is immediately apparent. The outputs are the people who are working with us. Being a small company, there aren’t any hiding places. Not that, I have to say, we’ve ever found anybody who’s looked for one. We’ve been very lucky in that respect. Internal training is very apparent, very hands-on, very apparent to everybody. External training, I suppose you could say it’s not easy to judge. But the fact that that information has come into the office, that’s in our domain, that we have reference to it and that it is relating to legislation that affects us, the work we do, then it is reasonably obvious that

40
it’s paid off. Like I say, the Party Wall Act may pay off one day …” (S6: interior designer and architect, 12 workers)
Asked whether it was possible to detect any ‘bottom-line effect’ arising out of training, most employers replied that it was not. But this did not trouble employers. Rather, they assumed that training which generated improvements in workers’ skills and knowledge was a benefit in itself. Given the difficulties of evaluating the impact of training on business performance, owner-managers adopted a measure of performance they felt they could assess sensibly. For most employers, the ‘deterrent effect’ arising out of an inability to establish a link between training and business performance did not arise. First, the employers discussed here almost universally focused on the impact of training on job rather than business performance. Second, the majority of employers claimed that training did, in fact, generate benefits. For most employers there is a demonstrated connection between training and performance though it is not discussed in the same terms of recent academic studies. Summary Most telephone sample employers claimed not to evaluate training though this was flatly contradicted by the qualitative data which indicated that most, if not all, employers made some assessment of the usefulness of particular training episodes. For the majority, this evaluation took the form of informal methods such as observation of people working or of their outputs. The qualitative data showed that employers focused their attention on trainees’ job performance and not on broader organisational measures such as change in sales turnover or employment. Where individual workers were found to perform their jobs more competently and safely then employers defined the training as a success. None claimed to be able to detect any direct ‘bottom-line effect’ as a consequence of training, suggesting that claims that small employers do not train because they cannot see any impact on business performance are misplaced. Rather the indicators of performance they use focus on the individual worker and not on the business per se. Moreover, the majority of business owners were in no doubt as to the impact of training on individual worker performance; they felt that training did, in fact, improve worker performance.

41
CHAPTER 6
A STRATEGIC APPROACH TO TRAINING ?
Introduction Small employers are often assumed to adopt a ‘non-strategic’ view towards training with little evidence of planning and budgeting. The validity of this claim depends on how ‘strategy’ is defined. Whittington (1993) distinguishes deliberate and emergent processes of strategy-making. Deliberate strategies entail conscious processes of analysis and calculation aimed at securing some long-term advantage whereas emergent strategies arise through incremental, adaptive responses to particular business contingencies and may, therefore, only become evident in retrospect. Marlow (2000) has argued that emergent strategies of people management are more typical in the small enterprise. This does not mean that business decisions are taken without some guiding underlying logic or strategic intent, only that it may be very difficult for small employers to conceive a blueprint which can easily be translated into action. This ‘strategic intent’ may exist as a written policy or, alternatively, business owners may hold it in their heads as a set of guiding principles (Kerr and McDougall 1999). Employers’ approaches to managing training are likely to vary from treating training as central to business performance and planning accordingly through to those who place little value on training and provide it solely as a reactive response to particular pressures. Clearly, a wide range of intermediate approaches is possible. Small employers’ approaches to training should therefore be seen as incorporating strategic elements to a varying degree. Many indicators of a formal training strategy, such as a training budget or the presence of a dedicated training manager, are argued to be associated with enterprise size (e.g. Curran et al. 1996; Sadler-Smith et al. 1998; IFF Ltd 1999). This may reflect the pressure on expanding businesses to formalise their employment practices (Atkinson and Meager 1994). But these features do not necessarily correspond with a strategic approach. For instance, the mere fact of a named person having responsibility for training does not mean that employers attach a high value to training or that they engage in particular training practices. It may simply mean that as business owners are ultimately responsible for all aspects of managing their business, this responsibility necessarily extends to training activity (Curran et al. 1996). Moreover, having a training plan or budget need not mean that either actually guide practice or offer an accurate indication of expenditure. Variations in Small Employers’ Orientations to Training: A Typology Using telephone survey data, a typology has been constructed to highlight differences in small employers’ orientations towards training. The purpose of the typology is to highlight variations in employer approaches to the provision of training. A number of indicators were obtained in the telephone survey. First, respondents were asked to report which of five statements best described their own approach to training (Table 6.1). Only a small minority of telephone survey respondents reported a written training policy (5%) but a further 23% indicated that they had a systematic, though unwritten, approach. The largest group (57%) reported undertaking training ‘as and when necessary without having a particular policy on the matter’.

42
Table 6.1 Attitudes to Training Provision (weighted)
‘What best describes the overall policy of your business to training and learning?’ % of sample ‘No training has been undertaken by the business in recent years’ 10.7 ‘Training tends to be a last resort and generally we try to avoid having to train staff or managers’
4.1
‘We undertake staff training as and when necessary but don’t have a particular policy on the matter’
56.8
‘We take a positive and systematic approach to training though this is not set out in written form’
23.3
‘We have a written training policy which ensures that the necessary learning and training takes place’
5.0
No data 0.1 Weighted N 1005
Second, respondents were asked whether the business had a dedicated training budget and, if so, how much the budget had been in the past year (Table 6.2). Only 5% of the telephone sample reported a training budget and only 4% could provide a precise monetary figure.
Table 6.2 Indicators of Attitudes to Training Provision (weighted)
% of sample Pre-allocated budget for training 5.0 Pre-allocated budget for training (with a budget figure specified) 4.0 Anyone with specific responsibility for managing training 52.1 Anyone with specific responsibility for managing training, where training is a whole or significant part of their job
13.9
Anyone with specific responsibility for managing training and has a personnel–related qualification
4.7
Weighted N 1005 Third, respondents were asked whether anyone had a formal responsibility for training decisions and, where this was the case, whether this responsibility was the whole, a significant part, or a minor part of their job. Over half (52%) of the telephone sample reported one or more people with formal responsibility for training decisions; in about 7% of cases the responsibility was shared between two or more people. In 14% of cases, responsibility for managing training was a whole or significant part of that person’s job. Sometimes responsibility for training was shared.

43
Fourth, respondents were asked whether the person(s) responsible for training decisions held a personnel-related qualification (Table 6.2). In 5% of cases at least one person with responsibility for managing training held a qualification. This was most common in larger businesses, with 20 or more workers (10% reported that the person with responsibility for managing training held a formal personnel-related qualification). A typology of businesses has been developed on the basis of responses to questions concerning employers’ views on their approach to training and the existence of a dedicated training budget in the telephone survey but not questions concerning managerial responsibility for training. Qualitative data from the face-to-face interviews showed that being able to name specific persons responsible for managing training was a poor indicator of an employer’s policy or approach to training. The quantitative data on this question was therefore not incorporated into the definition of the three types defined below. The sample was divided into three groups: • ‘Strategic trainers’ - those who reported that either the business had a ‘written training
policy’ or a ‘positive and systematic approach’ to training (though unwritten) and those with a budget specifically earmarked for training. Strategic trainers constituted 29% of the telephone sample.
• ‘Tactical trainers’ – concurred with the statement that they undertaking ‘staff training as and
when necessary but don’t have a particular policy on the matter’ but had no dedicated training budget. Tactical trainers constituted 56% of the telephone sample.
• ‘Low trainers’ - have no dedicated training budget and describe their approach to training as
either undertaking no training in recent years or as a last resort. Low trainers constituted 15% of the telephone sample.
This threefold typology attempts to distinguish employers in terms of their overall orientation towards training provision. Although fairly simple, it enables us to get beyond seeing employers as either acting strategically or not. Instead, it attempts to replace this approach with a view that treats employers’ orientations as matters of degree. The typology permits a distinction to be drawn between employers who perceive training to have major business benefits and are prepared to budget for it (strategic trainers), employers who recognise the importance of training but do not formally plan for it (tactical trainers), and employers who perceive training to be of limited importance for their business (low trainers). The qualitative data supported the distinctions in employer approaches. A small number of employers explicitly emphasised the strategic purpose of their training provision. They stressed the links between training and business strategy, that developing human capital was the primary means by which a competitive advantage for their business could be established and maintained. Training was seen as a desirable, if not necessary, precondition for the achievement of competitive advantage. Without a considerable training effort, this group of employers felt there would be nothing to distinguish their products and services from those of competitors. Similar in access to non-human resources, the key to success, therefore, lay in developing human resources.

44
Tactical trainers were by far the most common type among both samples. Over half of the telephone sample (56%) has been classified as ‘tactical trainers’ in the telephone survey; the proportion was even higher among the face-to-face interview sample. These employers reported undertaking staff training as and when necessary without having a particular policy on the matter and did not have a training budget. Most of these employers relied heavily on in-house training with limited provision of external training. A distinction needs to be made between employer views of the importance of training and how training is actually delivered. Employers may hold a clear and coherent view of the necessity of training yet prefer to deliver training on-the-job as that is perceived as the most advantageous approach. The qualitative data indicated strongly that these employers attached considerable importance to the provision of training, particularly initial training for new recruits. Such an approach might be described as incorporating strategic elements. Such employers’ approaches should be distinguished from those for whom training is seen as a last resort and/or as unimportant to their businesses. Orientation to Training and Size of Enterprise Strategic trainers were, on average, larger than tactical trainers and low trainers (Table 6.3). The average employment size of a strategic trainer was 9.2 workers, compared to tactical trainers (average size 7.0 workers) and low trainers (average size 5.3 workers). This is consistent with other evidence linking size of enterprise with training planning and may reflect a broader formalisation of business practice within larger enterprises. Nevertheless, 40% of employers with 20 or more workers have been classified as tactical or low trainers. There is no necessary connection between enterprise size and orientation to training provision. Orientation to Training and Industry Sector Strategic trainers were more likely to be located in particular sector groups (Table 6.4). Employers in ‘other services’ were, by some margin, the most likely to be classified as strategic trainers (59%); employers in ‘transport and communications’ (15%) were the least likely. Again, there are links with the occupational composition of the workforce in these sector groups (see Table A1.4 in Methodological Appendix). Employers in ‘other services’ employed a high proportion of professional and technical workers (14% of the workforce in this sector group) and these workers were more likely to receive training during the previous year. This contrasts with ‘transport and communications’ where only 3% of the workforce were described as professional and technical workers. Orientation to Training and Organisational Change Orientation to training was associated with incidence of organisational change (Table 6.5). Strategic trainers were more likely to report each of the three specified types of change – the introduction of new products or services, major changes in equipment, and major changes in working methods or workforce organisation – than tactical trainers who, in turn, were more likely to report them than low trainers. This data is consistent with the argument that organisational change is either a stimulus to, or a consequence of, training (or both).

45
Table 6.3 Orientation to Training by Size of Enterprise (weighted)
% of businesses in each size category 2-9 workers 10-19 workers 20 workers & above ALL Average (mean)
employment size ‘strategic trainers’ 26.3 44.0 58.2 29.4 9.2 ‘tactical trainers’ 57.6 47.5 38.4 55.8 7.0 ‘low trainers’ 16.1 8.5 3.4 14.8 5.3 ALL 100 100 100 100 7.4
Weighted N 864 99 42 1005 1005

46
Table 6.4
Orientation to Training by Industry Group (weighted) % of businesses in each industry group Primary &
construction (SIC 1992
groups A, B, C, E, F)
Manufacturing (SIC 1992 group D)
Distribution, hotels & catering
(SIC 1992 groups G, H)
Transport & communicatio
ns (SIC 1992 group I)
Business & professional
services (SIC 1992
groups J, K)
Other services (SIC 1992
groups L, M, N, O, P, Q)
ALL
‘strategic trainers’
23.5 26.0 21.1 15.4 32.9 59.1 29.4
‘tactical trainers’
54.8 62.5 62.4 41.0 57.9 35.4 55.8
‘low trainers’ 21.7 11.5 16.5 43.6 9.2 5.5 14.8 ALL 100 100 100 100 100 100 100.0 Weighted N 166 104 327 39 240 127 1005
Notes: industry groups based on Standard Industrial Classifications (SIC) 1992 industry groups. Weighted column Ns do not sum to 1005 due to rounding.

47
Table 6.5
Incidence of Organisational Changes by Orientation to Training (weighted) Has the business introduced any of the following during the past year?
% reporting each type of change % of
strategic trainers % of
tactical trainers % of
low trainers ALL
Any major changes in equipment 47.5 28.0 22.1 32.8 Any new products or services 44.1 23.9 12.1 28.1 Any major changes in working methods or workforce organisation
28.5 24.5 7.4 23.1
Weighted N 295 560 149 1005 Note: Weighted column Ns do not sum to 1005 due to rounding.

48
Orientation to Training and Product Market Competition Strategic and tactical trainers reported a slightly higher level of product market competition than low trainers; the former two subgroups reported average (mean) competitiveness ratings of 4.24 and 4.23 respectively, compared to 3.99 among low trainers. There were also differences in the perceived bases of competitive advantage. Strategic and tactical trainers were both slightly more likely than low trainers to attribute customer loyalty to non-price factors such as product quality and after sales service. Low trainers were more likely to attribute customer loyalty to price: 17% of low trainers did so, compared with 11% and 9% of tactical and strategic trainers. This suggests that perceived differences in the level and nature of product market competition may shape small employers’ orientations towards training provision though, as argued in Chapter 4, these factors were not strongly associated with differences in the reported incidence of training. Orientation to Training and Employment Change Variations in employment growth were also associated with different orientations towards training provision. A higher proportion of strategic trainers were found to have experienced an expansion in numbers employed over the previous two years and over the previous five years compared to tactical and low trainers. Whereas 43% of strategic trainers reported employment growth over the previous two years, only 33% of tactical trainers and 12% of low trainers did so. Taking the previous 5-year period, 57% of strategic trainers reported employment growth, compared to 47% of tactical trainers and 19% of low trainers. Strategic trainers were also more likely than other employers to anticipate an increase in employment over the next two years. Among strategic trainers 60% reported that employment was expected to rise over the period; for tactical and low trainers, the proportions were 41% and 24% respectively. The inverse relationships also hold: that low trainers were more likely to experience a decrease in employment and to expect a decrease in employment. Orientation to Training and Changes in Financial Performance Similar differences were evident in sales turnover growth: 61% of strategic trainers reported an increase in sales turnover over the previous two years, allowing for inflation; for tactical and low trainers the proportions were 56% and 27% respectively. Strategic trainers were also more likely than other employers to anticipate an increase in sales turnover over the next two years. For strategic, tactical and low trainers, the figures were 71%, 60% and 36% respectively. Variations in profit performance over the past two years were much less marked. Strategic trainers were more likely to report making a profit in each of the last two years but the differences are very small (78% compared to 76% of tactical and 74% of low trainers). These differences – for employment and sales growth – suggest that they are associated with employers’ orientations towards training to a greater degree than with actual training provision. It is possible that employers may adopt a different attitude to training linked to increases in

49
employment and sales turnover, both actual and anticipated, but that this difference in approach is not necessarily manifested in actual behaviour for some reason. Orientation Towards Training and Training Provision Strategic trainers were more likely to report training for owner-managers, initial training for new recruits and further training for established staff in the year prior to interview (Table 6.6). Differences were marked between strategic, tactical and low trainers for both incidence of provision and the training index values. Strategic trainers provided training for approximately seven times more staff than low trainers and to twice as many staff as tactical trainers. This demonstrates that differences in attitudes towards training have fed through to differences in behaviour. Perhaps this is to be expected, but it does show that the typology is relevant not only to understanding employers’ orientations towards training but also their actual training practices. Strategic trainers were more likely to report the provision of all of the five specified types of training for established staff – in-house, on- and off-the-job, off-site training and distance learning - than tactical trainers who, in turn, were more likely to provide each than low trainers (Table 6.7). This demonstrates that strategic trainers were more willing to use a variety of formats to deliver workforce training. In particular, strategic trainers were more open to utilising external training providers and did not confine themselves to in-house sources alone. Almost three-quarters of strategic trainers (74%) reported using an external provider to provide training to established staff in the year prior to interview, compared to 44% of tactical trainers and 12% of low trainers. Strategic trainers also used a wider range of external training providers.
Multivariate Analysis of the Training Orientation of SME Owner Managers Throughout this chapter the discussion has been driven by a typology of the training orientations of small firms and we have attempted to understand the way particular characteristics are related to these training orientations. The analysis will now explore a more robust econometric approach of the survey dataset to identify the range of variables associated with these three training orientations. In short, a multinomial logit model is developed to calculate the "odds" of a small firm being a strategic or tactical trainer. In order to do this we have three outcomes (Y) from the survey dataset:
• Y= 0 if the firm is a Low trainer • Y= 1 if the firm is a Tactical Trainer • Y= 2 if the firm is a Strategic Trainer
In the model, Y=0 is the baseline outcome and that the log odds ratio of outcome 1 (or 2) relative to outcome 0 can be written as a linear function of a set of "K" determining variables. The

50
determining variables used in the multinomial specification are as follows and reflect, a priori, those factors which may influence training orientation:
• Employment Size, • Sector, • Age of Firm, • Workforce Composition, • Workforce Qualifications, • Training Strategy (subjective assessment by the owner-manager), • Competition Strategy, • Growth performance (turnover) • Innovative Activity.
The results of the preferred multi-nomial model estimations on the sample of 1,005 small firms are presented in Table 6.8. The coefficients on the variables included in the equation were all significantly different from zero with the sole exception of the introduction of major new products and services for Tactical trainers. Overall, therefore, the model indicates that, against the base case of a firm being a "Low Trainer", the odds of a small firm being either a "Tactical" or "Strategic" trainer are significantly higher if the firm:
• is larger; • is in business and professional services; • is younger; • employs both other managers or professional/technical workers; • sees training as a strategic business objective • would like to undertake more training • is growing faster in terms of turnover
Further, the odds of a firm being a "Strategic" trainer as opposed to a "Tactical" trainer is solely determined by whether or not they have been innovative defined by the introduction of new products or services.
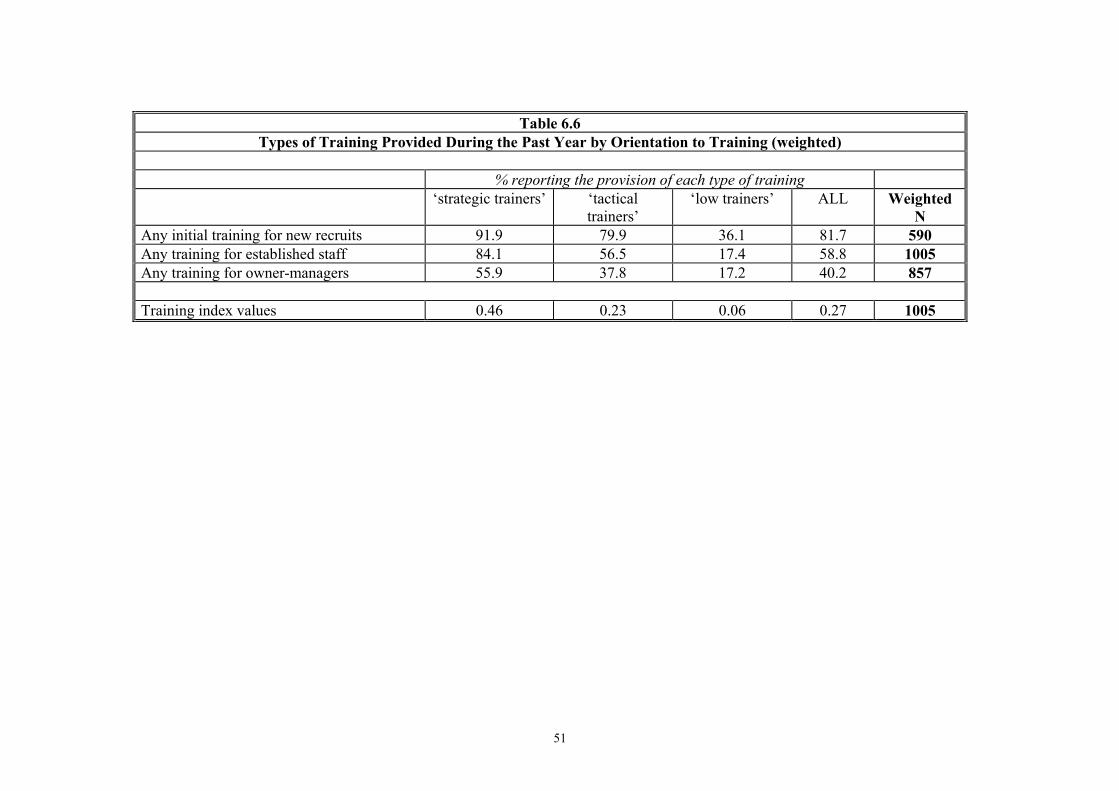
51
Table 6.6
Types of Training Provided During the Past Year by Orientation to Training (weighted)
% reporting the provision of each type of training ‘strategic trainers’ ‘tactical
trainers’ ‘low trainers’ ALL Weighted
N Any initial training for new recruits 91.9 79.9 36.1 81.7 590 Any training for established staff 84.1 56.5 17.4 58.8 1005 Any training for owner-managers 55.9 37.8 17.2 40.2 857
Training index values 0.46 0.23 0.06 0.27 1005

52
Table 6.7
Location of Training Provided For Established Staff During the Past Year by Orientation to Training (weighted)
‘strategic trainers’ ‘tactical trainers’ ‘low trainers’ ALL
ANY TRAINING FOR ESTABLISHED STAFF
84.1 56.5 17.4 58.8
Off-the-premises, away from the workplace during working hours
59.0 29.6 9.4 35.3
On-the-premises, on-the-job training 52.2 27.9 10.1 32.4 Off-the-premises, away from the workplace outside working hours
22.0 9.4 0 11.7
On-the-premises, off-the-job training 27.4 5.7 0.7 11.3 Distance learning 2.7 1.1 0 1.6
Weighted N 295 560 149 1005 Note: Weighted column Ns do not sum to 1005 due to rounding. Columns do not sum to 100% due to multiple response.

53
Table 6.8 Multinomial Logit Regressions for Training Orientations Multinomial Regression Number of obs = 1005 χ2(18) = 293.62 Prob > χ2 = 0.0000 Log Likelihood = -831.94469 Pseudo R2 = 0.1500
Y Coeff. Std. Err. z P>z [95% Confidence Interval] Tactical Trainers • Employment Size (Log) .4637122 .1745658 2.66 0.008 .1215694 .805855
• Business and Professional Services
1.234487 .4683328 2.64 0.008 .316572 2.152403
• Presence of employed managers .848732 .2705861 3.14 0.002 .3183929 1.379071
• Presence of professional/technical workers
.5639441 .3357643 1.68 0.093 -.0941418 1.22203
• Desire to provide more training for the workforce
.6226956 .2538267 2.45 0.014 .1252044 1.120187
• Belief that training leads to better business performance
.7643598 .2303235 3.32 0.001 .3129339 1.215786
• Business started before 1980 -.5967019 .2278017 -2.62 0.009 -.1.043185 -.1502186
• Introduction of major new and services
-.0521255 .271697 -0.19 0.848 -.5846417 .4803908
• Turnover increased in previous 2 years
.86072 .2321314 3.71 0.000 .4057509 1.315689
• Constant -.9262384 .4110101 -2.25 0.024 -1.731803 -.1206733 Strategic Trainers
• Employment Size (Log) 1.000922 .1909983 5.24 0.000 .6265727 1.375272
• Business and Professional Services
1.322704 .4872254 2.71 0.007 .3677595 2.277648
• Presence of employed managers 1.180013 .2875751 4.10 0.000 .616376 1.74365
• Presence of professional/technical workers
.8838813 .3456023 2.56 0.011 .2065131 1.561249
• Desire to provide more training for the workforce
.884368 .2675295 3.31 0.001 .3600198 1.408716
• Belief that training leads to better business performance
1.685407 .2741469 6.15 0.000 1.148089 2.222725
• Business started before 1980 -1.238099 .2497452 -4.96 0.000 -1.72759 -.748607
• Introduction of major new and services
.4797544 .2828896 1.70 0.090 -.0746989 1.034208
• Turnover increased in previous 2 years
.7816663 .2507207 3.12 0.002 .2902628 1.27307
• Constant -3.560225 .4847452 -7.34 0.000 -4.510308 -2.610142
(Outcome Y= Low Trainer is the comparison group)

54
Summary Small employers vary in their orientations to training provision. In contrast to blanket assertions that small employers manage training in a reactive and informal way, this chapter has sought to develop further our understanding of small employers’ approaches to managing training. A typology was constructed based on telephone survey responses to questions concerning respondents’ attitudes towards training and whether the business had a specific training budget. Three orientations towards training were distinguished: strategic, tactical and low trainers. By far the most common group was the tactical trainers, comprising over half the sample. The typology was found to be useful in that the employers so classified differed in their provision of training, their particular training practices, their reasons for training and, as we shall see in Chapter 7, their reasons for not providing more training. Strategic trainers, as might be expected, were more likely to provide training for their workforces and to undertake training themselves than tactical and low trainers. They were more likely to provide training for a higher proportion of their workforces, as measured by the training index. They were also more likely to deliver training in a variety of formats – on- and off-the-job, at and away from the workplace – for both workers and owner-managers. Strategic trainers ascribed greater benefits to training and were more enthusiastic concerning the provision of further training. Conversely, low trainers were more likely to report that training would not be of benefit for their businesses. Finally, a multi-nomial model confirmed the robustness of this typology and demonstrated that both Strategic and tactical trainers were significantly different from Low Trainers. Further, the model highlighted the relevance of the introduction of new products and services as the key influence separating Strategic trainers from Tactical trainers. Variations in orientation to training provision were linked to enterprise size, sector, level of product market competition, sources of competitive advantage, employment and real sales turnover growth, and projected employment and sales growth. But the relationship between orientation to training and a variety of structural and contextual factors is complex. Orientations to training varied with, but cannot simply be ascribed to, those factors in a straightforward fashion, as demonstrated by the multi-nomial model.

55
CHAPTER 7
BARRIERS TO TRAINING Introduction All training activity can be viewed as both an investment and a cost: an investment in that it should enhance the stock of human capital available in the enterprise, thereby enabling increases in productivity; and a cost in that valuable resources are consumed, or opportunities foregone, to undertake training. The costs of training, actual or perceived, may act as barriers constraining the provision of training. Possible costs to employers include the time and effort to search for appropriate training opportunities and to organise, conduct and undertake training; the opportunity costs in terms of lost output or working time; the direct money costs of training; and the fear of ‘poaching’ of trained workers. These costs are likely to vary with the type and extent of training provided. These barriers may restrict employers’ capacity to provide training and may even shape employers’ perceptions of a need to train at all. This chapter investigates the reasons why small employers do not provide, or undertake, more training than they already do. There is a prevailing view amongst policymakers and support agencies that there is a low take up of training by small firms and that they face barriers to training. But whether this perceived limited level of take-up is due to a lack of any perceived need to train on the part of employers or because of barriers to training, or both, is open to debate. Previous research has suggested that both small business owners and employees often do not perceive a need for training (e.g. Abbott, 1993; Curran et al., 1996). One reason for low levels of employer demand for training might relate to their broader competitive strategies. Where employers demand few labour skills because of product strategies do not require them, training might be perceived as unnecessary: a symptom of what has been called a ‘low skill, low quality equilibrium’ (Finegold and Soskice, 1988). Alternatively, employers might view training as desirable but feel unable to allocate sufficient resources to it, notably money and time. Research has also highlighted supply-side inadequacies in the volume and quality of training to match small firms’ needs (Johnson, 1999; Sims et al., 2000). Clearly then, several issues require investigation. To what extent do employers perceive a need to provide further training? Do employers feel constrained to provide less than an optimal amount of training? If so, what are the most important barriers to training? Do barriers differ between employers of different sizes, or in different industries? Do owner-managers face different barriers to undertaking training themselves compared to providing training for their workforces? Are employers taking other approaches to supplying their skill requirements, such as recruiting already trained staff? Barriers to Training or Lack of Perceived Need to Train? Using a prompt list of predefined response categories, telephone sample respondents were asked their reasons for not wanting to provide more training for their workforces, and to identify their most important reason (Table 7.1); a similar question was asked of owner-manager training
56
(Table 7.2). Respondents cited a variety of reasons for not wanting to provide further training (Tables 7.1 and 7.2). For workforce training, only one reason was cited by more than half of the telephone sample: that sufficient training was provided to workers after they were recruited (reported by 53% of respondents). The next most frequently cited reasons were working time lost and the financial cost of training (cited by 40% and 38% of respondents respectively). For owner-manager training, the order was reversed. Lost working time was cited as the major constraint (cited by 50% of owner-managers). Owner-managers perceive themselves as key actors within the enterprise and view their time as an extremely valuable resource. The greater emphasis on time as constraining their own training compared with workforce training, is understandable. The key role they play is also reflected in the importance they attach to another constraint: being unable to cover their work because of its skilled nature (26% cited this as a reason, and 7% as the most important reason). On the basis of respondents’ main reasons for not wanting to provide further training, the sample can be divided into two groups. The first group emphasise the lack of any perceived need to train. Three of the response categories in Table 7.1 can be viewed as indicative of this emphasis: ‘sufficient training is provided after workers are recruited’; ‘staff are all fully trained before they are recruited’; and, ‘further training would not produce benefits for the business’. Hereafter, these reasons are referred to collectively as a ‘lack of any perceived need to train’. The second group of employers emphasises the constraints on training. All other response categories in Table 7.1 (with the exception of the ‘other’ and ‘no data/no preference’ categories) can be interpreted as indicating some kind of constraint on training. Important examples include ‘lost working time while workers are being trained’ and the ‘financial cost of external training’. Hereafter, these reasons are referred to collectively as a ‘real barrier to training’. For workforce training, 52% of respondents reported reasons indicating a ‘lack of any perceived need to train’; 43% gave reasons indicating that further training was constrained by a ‘real barrier to training’ in some way.11 For owner-manager training, the emphasis was reversed: 45% of owner-managers cited reasons suggesting they perceived no need for further training themselves, whereas 50% indicated reasons suggesting further training was constrained. The qualitative interview material highlighted many instances of business owners expressing the view that further training either for their workforces or themselves was simply unnecessary at the time of interview. The central reason was that, given the nature of the business and its environment, there was simply no need to invest resources in training to increase the skills of workers (or themselves) as this would not produce any benefits for the business. These employers perceived existing workforce skill levels as adequate. Skill requirements may have been met through recruitment or through previous training provision, particularly initial training, but further training was seen as unnecessary.
11 The remaining 5% of replies include 3% coded as ‘no data/no preference’ and 2% giving ‘other’ reasons’.

57
Table 7.1 Reasons for Not Providing More Training for Established Workers (weighted)
% of sample
reporting as a reason % reporting as ‘most
important’ reason LACK OF ANY PERCEIVED NEED TO TRAIN Sufficient training is provided after workers are recruited 53.2 31.8 Staff are all fully trained before they are recruited 20.2 11.2 Further training would not produce any benefits for the business 19.1 8.9 CONSTRAINTS ON TRAINING Lost working time while workers are being trained 39.9 11.5 Financial cost of external training 38.1 16.1 Unable to cover work while workers are being trained because of skilled nature of work 27.1 2.8 Lack of any subsidy for training 26.8 2.2 Lack of information about training opportunities 13.1 1.1 Can’t find suitable external training 12.8 3.9 Lack of space to provide in-house learning or training 12.5 <0.1 Lack of skills to provide in-house learning or training 12.3 0.5 Training providers are located too far away 10.8 1.5 Lack of workforce interest in training 10.8 1.2 Fear of trained workers leaving or being poached 9.0 0.9 Lack of equipment to provide in-house learning or training 8.8 <0.1 Poor quality of external training 6.3 0.5 Falling sales 2.3 0.2 Lack of time for employer to organise or conduct training 0.8 0.4 OTHER REASON 3.2 2.2 NO DATA/NO PREFERENCE 1.9 3.0 Weighted N 1005 1005 Note: First column does not sum to 100% due to multiple response.

58
Table 7.2 Reasons for Not Providing More Training for Owner-Managers (weighted)
% of sample
% reporting as ‘most
important’ reason LACK OF ANY PERCEIVED NEED TO TRAIN Respondent is fully skilled/doesn’t need any training 34.0 25.6 Respondent is doing a sufficient amount of training already 18.6 10.5 Further training would not produce any benefits for the business 16.9 9.2 CONSTRAINTS ON TRAINING Lost working time while being trained 49.5 31.2 Unable to cover work while being trained because of skilled nature of work 26.3 7.4 Financial cost of external training 21.6 5.1 Lack of any subsidy for training 12.9 0.3 Can’t find suitable external training 9.3 2.3 Lack of interest in training 6.6. 2.2 Lack of information about training opportunities 6.6 0.8 Training providers are located too far away 5.0 0.4 Lack of skills to provide in-house learning or training 4.9 <0.1 Lack of space to provide in-house learning or training 4.7 0 Lack of equipment to provide in-house learning or training 3.7 <0.1 Poor quality of external training 2.7 0.2 Falling sales 2.3 0.1
OTHER REASON 3.3 2.3 NO DATA 1.7 2.6 Weighted N 857 857 Note: First column does not sum to 100% due to multiple response.

59
Such an approach was particularly evident in those enterprises where most jobs were semi-skilled, and where skill requirements were seen as unlikely to change much over time because employers were not planning to implement other product and process innovations which might necessitate changes in skill requirements. This also helps to explain why workforce training was often limited to particular categories of staff. Even where training was provided, it was often confined to specific groups or individuals. Where employers emphasised that their training activity was constrained, the financial cost and the opportunity cost of lost working time were the primary constraints on workforce training reported (cited as the main reason by 16% and 12% of respondents respectively) (Table 7.1). For owner-manager training, lost working time was by far the most serious barrier (cited as the main reason by 31% of respondents) (Table 7.2). Other, supply-side, constraints – the availability, quality and location of training - were not a primary concern for most employers (Table 7.1). In general, small employers’ training activities were not heavily restricted by a lack of information about training opportunities, an inability to find trainers, the poor quality of training or because training providers are located too far away. Only 7% reported any of these four reasons as the most important barrier to workforce training; fewer than 4% cited these as the main restrictions on owner-manager training. Importantly, the poaching of trained staff was not a major deterrent to the provision of training. Contrary to what policymakers and other commentators often believe (National Skills Taskforce 2000a), poaching of trained workers is not viewed as a major constraint on training activity by smaller employers. Fewer than one in ten employers reported this as a barrier to training provision and less than 1% cited it as the most important reason for not providing further workforce training (Table 7.1). A number of reasons for the relative unimportance of labour poaching as a constraint on training provision can be proposed. First, most employers consider the training they provide to be necessary to enable workers to perform their jobs competently. Restricting training is likely to undermine worker performance and, by extension, business performance. Second, much training is regarded by small employers as business-specific and, therefore, of limited value to other employers. Training Barriers and Enterprise Size There were marginal differences in the reported barriers to provide workforce training by size of enterprise (Table 7.3). Across all size categories, the proportion of employers citing ‘lack of perceived need to train’ related reasons outnumbered those reporting real barriers to increasing their training effort. For owner-manager training the picture was more mixed. Real barriers to training were cited more frequently in the two smallest size categories; in businesses with 20 or more workers, respondents were more likely to cite a lack of perceived need to undertake further training themselves. This is consistent with the view that owner-managers feel unable to undertake training themselves because their presence at the workplace is especially important the smaller the enterprise.

60
Table 7.3 Main Reason for Not Providing More Training
by Size of Enterprise (weighted)
2 – 9 Workers
10 – 19 Workers
20 or More Workers
ALL
WORKFORCE TRAINING ‘Lack Of Any Perceived Need To Train’ reasons
52.1 51.1 46.9 51.8
‘Real barrier to training’ reasons 42.9 43.8 43.7 43.0 Other Reason 2.0 2.9 3.0 2.2 No Data 2.9 2.2 6.4 3.0 Weighted N 864 99 42 1005
OWNER-MANAGER TRAINING ‘Lack Of Any Perceived Need To Train’ reasons
45.6 42.0 48.3 45.3
‘Real barrier to training’ reasons 49.8 51.9 41.4 49.9 Other Reason 2.3 2.5 3.4 2.3 No Data 2.3 3.7 6.9 2.6 Weighted N 747 81 29 857
Note: ‘lack of perceived need to train’ and ‘real barrier’ reasons defined in text and in Tables 7.1 and 7.2. Columns do not sum to 100% due to rounding.
Training Barriers and Business Sector Business sector, it is argued, sets out the context of the enterprise, its market relations, its internal functioning and of importance here, its employment requirements. Indeed, much of the training provision that is available is predicated on the notion of meeting demands for skills rooted in specific sector needs. Examples include sector-specific standards, such as safety training requirements, which are likely to affect attitudes to training. Sector differences may shape variations in the barriers to training. There were discernible sector differences in the reasons for not providing more training (Table 7.4). For both workforce training and owner-manager training, employers in ‘other services’ and ‘business and professional services’ were more likely to report real barriers to training relative to the sample as a whole; for workforce training, this was also the case with ‘manufacturing’ employers. Employers in other sectors were more likely, on average, to report a lack of any perceived need to provide further training for both the workforce and for owner-managers themselves.12 For example in ‘distribution, hotels and catering’, 59% of respondents reported a 12 The only instance where this does not hold is for employers in ‘transport and communications’ which, for owner-manager training, had lower proportions reporting both real barriers to training and the lack of any perceived need to train. A high proportion of responses were coded as ‘other’ (11%) or as missing data (9%).

61
lack of any perceived need to provide additional workforce training and 51% reported no need for further owner-manager training. Overall, the research did identify some broad inter-sector differences in the barriers to train. But the broad sector groups used here may be too broad to permit sensible conclusions to be drawn based on sector. This is particularly the case with ‘other services’ which amalgamates businesses in education, health and others. These groups combine different types of business, serving different types of customer, operating in different product market conditions and using different technologies. More focused research on specific, narrower, industry sectors may be more useful in understanding the pressures, incentives and constraints small employers face in deciding whether to provide training. Training Barriers and Organisational Change Employer decisions to provide, or not to provide, further workforce training may be influenced by product market conditions and the employer’s competitive strategy. Where businesses operate in dynamic market environments that require regular innovations in products and/or working processes, the provision of training to equip staff with the skills and knowledge necessary to innovate may be an integral feature of workplace life. But where businesses operate in less dynamic environments in which new product development is less important to business survival, employers may face few pressures or incentives to provide additional training. Consequently, such employers may perceive few benefits from further training. Employers reporting the introduction of the three specified organisational changes (new products or services, a major piece of equipment, or a major change in skills or workforce organisation) during the year prior to interview, were more likely to report real barriers to further training provision, than non-innovators (Table 7.5). To illustrate, the proportion of the sample reporting a real barrier to training as the main reason for not providing further workforce training was 43%. For those reporting major changes of equipment it was 54%; for new products and services and for major changes in working methods or workforce organisation it was 56%. The same pattern, in a stronger form, was evident regarding owner-manager training (Table 7.5). Whereas 50% of owner-managers across the whole sample claimed to be constrained in their training efforts by a real barrier to training, the proportions among those implementing organisational changes making such a claim were much higher. For those introducing new products or making major changes in working methods, the figure was 65%; for those reporting major changes in equipment, the figure was 62%. Together, the data suggest that innovators in products and processes will feel constrained in furthering their training effort whereas non-innovators are more likely to perceive no need for further training. These employers perceived a need to train and were unable to provide as much training as they would like. The best conclusion is that innovation in products and processes stimulates a desire to train among business owners. Whether or not they are able to satisfy that objectives fully is a separate question.

62
Table 7.4
Main Reason for Not Providing More Training by Industry Group (weighted) Primary &
construction Manufacturing
Distribution, hotels
& catering Transport &
communications Business & professional
Other services
ALL
WORKFORCE TRAINING ‘Lack of any perceived need to train’ reasons
55.5 53.0 59.4 54.1 45.0 38.6 51.8
‘Real barrier to training’ reasons
38.8 43.9 37.9 37.9 44.9 58.9 43.0
Other reason 5.5 2.6 0.5 1.5 2.0 2.3 2.2 No data 0.1 0.5 2.1 6.5 8.1 0.2 3.0 Weighted N 166 105 327 39 240 128 1005
OWNER-MANAGER TRAINING ‘Lack of any perceived need to train’ reasons
47.1 49.7 50.8 34.9 40.2 34.2 45.3
‘Real barrier to training’ reasons
46.1 48.0 46.6 46.6 55.7 56.7 49.9
Other reason 6.6 0.5 0.2 11.0 0.3 5.6 2.3 No data 0.2 1.8 2.3 7.4 3.8 3.4 2.6 Weighted N 142 94 296 34 202 88 857
Notes: Industry groups based on Standard Industrial Classifications (SIC) 1992 industry groups. ‘Lack of perceived need to train’ and ‘real barrier’ reasons defined in text and in Tables 7.1 and 7.2. Columns do not sum to 100% due to rounding. Weighted column Ns do not sum to ‘ALL’ column Ns due to rounding.

63
Table 7.5 Main Reason for Not Providing More Training by Incidence of Organisational Change (weighted)
Types of Organisational Change Introduced in the Previous Year: Major New Products
and Services Major Changes of
Equipment Major Changes in
Working Methods or Workforce
Organisation
ALL
WORKFORCE TRAINING ‘Lack of any perceived need to train’ reasons
36.8 40.8 34.8 51.8
‘Real barrier to training’ reasons 55.5 53.9 56.2 43.0 Other reason 2.3 0.9 1.1 2.2 No data 5.4 4.4 7.8 3.0 Weighted N 282 330 232 1005
OWNER-MANAGER TRAINING ‘Lack of any perceived need to train’ reasons
27.5 31.7 28.8 45.3
‘Real barrier to training’ reasons 64.8 62.0 64.5 49.9 Other reason 3.7 3.0 3.3 2.3 No data 4.1 3.3 3.5 2.6 Weighted N 244 282 206 857 Note: ‘Lack of perceived need to train’ and ‘real barrier’ reasons defined in text and in Tables 7.1 and 7.2. Columns do not sum to 100% due to multiple response. Weighted column Ns do not sum to ‘ALL’ column Ns due to rounding.

64
Training Barriers and Orientation to Training Business owners with varying orientations towards training – strategic, tactical and low trainers - differ in their intentions to providing further training and in their reasons for not wanting to provide further training. Strategic trainers were more likely to report that they would like to provide more training for their workforces (52%, compared to 40% of tactical trainers and 21% of low trainers). Reasons for not wanting to provide further training also varied according to employers’ orientations to training (Table 7.6). Strategic and, to a slightly lesser extent, tactical trainers were more likely to cite real barriers to the provision of further training than those with a low trainer orientation. This applied to both workforce trainer and to owner-manager training. For instance, for workforce training 50% of strategic trainers reported real barriers, compared to 46% of tactical trainers and 19% of low trainers. For owner-manager training, the figures were 55% of strategic trainers, 52% of tactical trainers and 31% of low trainers reporting that additional training was constrained by a real barrier. Clearly, then, different types of employer perceived the provision of further training as of varying significance for their businesses. Even though strategic trainers already provided the most training this did not diminish their propensity to train. Moreover, despite low trainers being the least likely to report workforce training in the year prior to interview, they were the least likely group to report a desire to provide further workforce training. The data support the view that the tripartite classification of employers presented in Chapter 6 highlights persistent differences in employers’ orientations to train. Training Barriers Among Trainers and Non-Trainers There were marked differences between trainers and non-trainers in their views on barriers to training (Table 7.7). For both workforce training and for owner-manager training, those reporting undertaking/providing training in the year prior to interview were more likely to report real barriers as inhibiting further training provision. In respect of workforce training, 45% of trainers reported real barriers on further training, compared to 38% of non-trainers. For owner-manager training, the difference was slightly stronger: 60% of trainers reported a real constraint on undertaking additional training, compared to 43% of non-trainers. Conversely, non-trainers were more likely to emphasise reasons indicating a lack of any perceived need for training on their part. For both workforce training and for owner-manager training, over half of the non-trainers cited ‘lack of perceived need to train’.

65
Table 7.6 Most Important Reason for Not Providing More Training
by Orientation to Training (weighted)
% of ‘strategic trainers’
% of tactical trainers
% of low trainers
ALL
WORKFORCE TRAINING ‘Lack of any perceived need to train’ reasons 44.3 48.9 77.7 51.8 ‘Real barrier to training’ reasons 50.0 45.9 18.5 43.0 Other reason 2.8 1.7 2.6 2.2 No data 2.8 3.5 1.2 3.0 Weighted N 295 560 149 1005
OWNER-MANAGER TRAINING ‘Lack of any perceived need to train’ reasons 38.7 43.4 66.2 45.3 ‘Real barrier to training’ reasons 54.7 52.0 31.0 49.9 Other reason 2.7 2.4 1.1 2.3 No data 3.9 2.1 1.7 2.6 Weighted N 254 481 122 857 Note: ‘lack of perceived need to train’ and ‘real barrier’ reasons defined in text and in Tables 7.1 and 7.2. Columns do not sum to 100% due to rounding. Weighted column Ns do not sum to 1005 due to rounding.

66
Table 7.7 Main Reason for Not Providing More Training for Trainers and Non-Trainers
(weighted)
% of trainers % of non-trainers
ALL
WORKFORCE TRAINING ‘Lack of any perceived need to train’ reasons
50.5 55.8 51.8
‘Real barrier to training’ reasons 44.7 38.0 43.0 Other reason 2.0 2.8 2.2 No data 2.8 3.4 3.0 Weighted N 754 251 1005
OWNER-MANAGER TRAINING ‘Lack of any perceived need to train’ reasons
33.7 53.0 45.3
‘Real barrier to training’ reasons 60.2 43.0 49.9 Other reason 2.0 2.5 2.3 No data 4.1 1.6 2.6 Weighted N 345 512 857 Note: ‘lack of perceived need to train’ and ‘real barrier’ reasons defined in text and in Tables 7.1 and 7.2. Columns do not sum to 100% due to multiple response. Weighted column Ns do not sum to ‘ALL’ column Ns due to rounding. For workforce training, trainers are defined as those providing either initial training for new recruits or training for established staff in the year prior to interview (or both). For owner-manager training, trainers are those undertaking training in the year prior to interview.
Summary Policymakers and other commentators often feel that there is a limited take up of training opportunities by small employers because of the substantial barriers they face. However, small business owners are not necessarily constrained to provide less than an optimal amount of workforce training. On the contrary, a majority of employers felt there was no need to provide additional training because they were able to meet their skill requirements either through the recruitment of suitably skilled workers or through prior training. Further training was seen as unlikely to generate benefits for their businesses. Employers were more likely to view training this way where they: perceived their skill requirements to be relatively limited; believed the skills they needed could be recruited from the labour market; operated in relatively stable product markets, with little emphasis on product innovation as a competitive strategy; or, had few plans to expand their businesses. In some cases, employers felt unable even to articulate a desire for further workforce training given the

67
constraints they faced and the unlikely possibility that scarce resources could be allocated to training. A large minority of employers reported that further training was constrained by a variety of barriers, notably lost working time and the money costs of training. Scarce resources were often viewed as best allocated to meeting day-to-day work obligations. Apart from financial cost, the study did not expose major supply-side weaknesses in the quality or quantity of external training, partly because few owner-managers were actively seeking additional, external training opportunities for their workers and partly because employers emphasised other barriers. The poaching of skilled labour, often thought to be a major deterrent to small employers to provide training, was found to be only a minor constraint in comparison with other barriers. The relative weight of ‘real barriers to training’ and ‘lack of perceived need to train’ related reasons was found to vary with sector, the incidence of product and process innovation, orientation to training, and with incidence of training in the year prior to interview. Employers implementing product and process innovations during the year prior to interview were more likely to cite constraints on training rather than emphasising the lack of any perceived need to train. Employers with a strategic orientation to training and, to a lesser extent, those with a tactical orientation were much more likely to report constraints on training rather than being due to any lack of demand on their part. Size of enterprise had very little effect on training barriers. The data provide a mixed message for policymakers. On the one hand, it shows that many small employers do value training and, therefore, that policymakers may be pushing at an open door with their exhortations to provide additional training. A sizeable minority of small business owners report that their training activity is constrained by factors such as time and money; it is not because they do not see a need to provide training. If policymakers can devise imaginative ways of overcoming these barriers for this type of employer then it seems likely that these business owners will increase their training effort. On the other, policymakers are likely to face resistance from employers who feel they are already investing sufficiently in training or, alternatively, feel unable to provide further training given the constraints they face. These employers feel that workers are sufficiently skilled given the employer’s requirements. Supply-side improvements in the availability, cost and quality of any training offered may be expected to have only a limited impact on take-up among this group of small business owners. Policymakers are likely to face an uphill struggle persuading these owner-managers that further workforce training offers benefits that they themselves do not perceive.

68
CHAPTER 8
GOVERNMENT POLICY AND SMALL BUSINESS TRAINING
Introduction Successive UK governments have sought to encourage small employers to invest greater resources in training. For over a decade TECs played a key role in delivering government training initiatives to business13. Initiatives included those specific to small businesses such as Small Firms Training Loans, those open to employers of all sizes such as Investors in People and work based training for young people (WBTYP) initiatives such as Modern Apprenticeships. While awareness of government training initiatives among small business owners appears to be quite high, involvement and take-up are low (LM Quarterly Report, cited in Ottens and Taylor 2000). These initiatives have enjoyed only limited take-up among smaller firms (e.g. Maton 1999; Matlay 2000; National Skills Task Force 2000). Hillage and Moralee (1996) suggest the impact of Investors in People on small employers is greater, more rapid and generates less deadweight than for larger companies. Others argue that greater participation in, and progress towards, the standard by smaller employers may require a more tailored approach (DTZ Pieda Consulting 1999). In this chapter we present evidence relating take up of the present raft of training initiatives by small employers, employer experiences of involvement in government initiatives, and to the barriers to use/participation faced by small employers. Take Up of Government Training Initiatives Telephone survey respondents were asked whether they were currently participating in, or using, a number of specific initiatives. About 13% of telephone survey respondents reported current involvement in government training initiatives (Table 8.1). The most frequently cited initiative was Modern Apprenticeships (5% of respondents reported current involvement at the time of interview). All other initiatives were cited by fewer than 2% of the sample. Around 11% of the telephone sample reported a worker had achieved an NVQ during the year prior to interview and a further 14% reported that they had a member of the workforce currently working towards an NVQ (see Table 3.3). Take up was highest among non-managerial employees, and very markedly lower among respondents themselves, partners or co-directors, and employed managers.
13 This changed on 1st April 2001 when the TECs ceased to operate, their functions being taken over by the National Learning and Skills Council.

69
Table 8.1 Participation in Government Training Initiatives by Size of Enterprise (weighted)
2-9 workers 10-19
workers 20 or more
workers ALL
ANY GOVERNMENT TRAINING INITIATIVE 11.7 21.4 26.2 13.3 Modern Apprenticeships 4.7 7.1 9.5 5.2 Other government-supported training for young people 1.5 3.0 2.4 1.7 New Deal for Young People aged 18-24 1.5 2.0 2.4 1.6 Individual Learning Accounts 1.2 4.0 2.4 1.4 Investors in People 0.2 3.0 7.1 0.8 Foundation Modern Apprenticeships (formerly National Traineeships)
0.6 1.0 0 0.6
Time off for study or training 0.5 1.0 2.3 0.5 University for Industry 0.5 1.0 0 0.5 New Deal for Long-term Unemployed Adults aged 25+ 0.2 0 2.4 0.3 Key worker training in small firms (formerly Skills for Small Businesses)
0.1 1.0 2.4 0.2
Management Development Initiative 0 0 2.3 0.1 Union Learning Fund 0 <0.1 0 <0.1 Small Firms Training Loans 0 <0.1 <0.1 <0.1 Other government scheme or initiative 2.2 6.1 4.8 2.7
Weighted N 864 99 42 1005

70
Larger employers (those with 20 or more workers) were much more likely to report current involvement in at least one initiative (26%, compared to 12% of employers with 2-9 workers). In general, these larger employers were more likely to report involvement in each individual initiative though there were exceptions, for example, Individual Learning Accounts and other government-supported training for young people (Table 8.1). There were also considerable sectoral variations in participation (Table 8.2). Employers in ‘other services’ (22%) and in ‘primary and construction’ (16%) industries were more likely to be participating currently in government training initiatives. For ‘other services’ employers, this reflects the higher incidence of workforce training provision; government initiatives are just another source of training they consider. For employers in ‘primary and construction’, Modern Apprenticeships dominated: 12% of employers in this sector group reported current participation with the initiative. As Modern Apprenticeships (both Advanced and Foundation) are more likely to be found in particular industry sectors, it is no surprise that employers’ reported involvement varies across sector groups. Strategic trainers were more likely to report participation in government initiatives than other respondents (Table 8.3). Nearly a quarter (24%) of these employers reported current involvement in a government training initiative whereas low trainers’ participation in such initiatives was non-existent. In part, this reflects the more general openness of strategic trainers to the wide variety of training opportunities that exist. Interview data suggested a higher level of awareness of the various initiatives even where they were not participants. A strong link was found between orientation to training and the achievement (or pursuit) of qualifications. Strategic trainers were more likely to report that someone had achieved an NVQ during the past year (cited by 21% of strategic trainers, compared to 8% of tactical trainers and 1% of low trainers); the proportions of those currently working towards an NVQ was 24% of strategic trainers (compared to 11% of tactical trainers and none of the low trainers). For other, non-NVQ, qualifications, 29% of strategic trainers reported that a member of the workforce had achieved one during the past year (compared to 15% of tactical trainers and 1% of low trainers respectively); and 26% of strategic trainers reported that a member of their workforce was working towards a non-NVQ qualification (compared to 11% of tactical trainers and none of the low trainers). Owner-Managers’ Experiences of Government Training Initiatives Interview data on respondents’ experiences of participation or use of initiatives was mixed. Respondents who had received funding for training were, on the whole, satisfied with such arrangements. The qualitative interviews revealed two cases of an employer either achieving or adopting Investors in People and in both cases this was perceived as having beneficial consequences for the business. Employers participating in Modern Apprenticeships also offered favourable views of the initiative despite trainees leaving before completing their training in a number of cases, primarily for reasons unconnected with the initiative itself according to employers. Nevertheless employers tended to report high levels of satisfaction with the trainees recruited.

71
Table 8.2
Participation in Government Training Initiatives by Industry Group (weighted) Primary &
construction Manufacturing
Distribution, hotels
& catering Transport &
communications Business & professional
Other services
ALL
ANY INITIATIVE 15.7 13.3 13.8 5.1 7.9 21.9 13.3 Modern Apprenticeships 12.0 4.8 6.4 0 0.4 3.9 5.2 Other govt. training for young people
0 2.9 1.5 0 1.7 2.4 1.7
New Deal for Young People aged 18-24
0 1.0 1.5 0 2.1 3.9 1.6
Individual Learning Accounts 0 0 0.3 0 2.1 6.3 1.4 Investors in People 0.6 1.0 0.3 0 0.4 3.1 0.8 Foundation Modern Apprenticeships
0 0 1.5 0 0 0.8 0.6
University for Industry 1.8 1.0 0 0 0 0 0.5 Time off for study or training 0 0 0 0 0 3.1 0.5 New Deal for Long-term Unemployed Adults 25+
0 1.0 0.3 2.6 0 0 0.3
Key worker training in small firms (formerly Skills for Small Businesses)
0 0 0.3 2.6 0 0.8 0.2
Mgt. Development Initiative 0 0 0 0 0 0.8 0.1 Union Learning Fund 0 0 0 0 0 <0.1 <0.1 Small Firms Training Loans <0.1 0 0 0 0 <0.1 <0.1 Other govt. scheme or initiative 2.4 2.9 2.1 0 3.3 3.1 2.6 Weighted N 166 105 327 39 240 128 1005
Notes: industry groups based on Standard Industrial Classifications (SIC) 1992 industry groups.

72
Table 8.3 Participation in Government Training Initiatives by Orientation to Training (weighted)
% of strategic
trainers % of tactical
trainers % of low trainers
ALL
ANY INITIATIVE 24.4 10.9 0 13.3 Modern Apprenticeships 8.1 5.0 0 5.2 Other government-supported training for young people 3.4 1.1 0 1.7 New Deal for Young People aged 18-24 2.7 1.4 0 1.6 Individual Learning Accounts 3.7 0.5 0 1.4 Investors in People 2.4 0 0 0.8 Foundation Modern Apprenticeships (formerly National Traineeships)
2.0 0 0 0.6
Time off for study or training 0.3 0.7 0 0.5 University for Industry 1.4 0.2 0 0.5 New Deal for Long-term Unemployed Adults aged 25+ 0.7 0.4 0 0.3 Key worker training in small firms (formerly Skills for Small Businesses)
0.7 0.2 0 0.2
Management Development Initiative 0.3 0 0 0.1 Union Learning Fund <0.1 0 0 <0.1 Small Firms Training Loans <0.1 0 0 <0.1 Other government scheme or initiative 5.4 2.0 0 2.7 Weighted N 296 560 149 1005 Note:

73
But employer involvement in government initiatives was a minority pursuit. Most were indifferent to government training initiatives, either because they were unaware of their specific character and purpose or because they felt them to be irrelevant to their particular training needs. Often this was because employers felt that sufficient training was already provided to staff rather than because of any perception that government initiatives were of poor quality. Further training provision from whatever source was seen by many as unnecessary. Employer criticisms of initiatives concerned both administration processes and substantive content. Failure to comply precisely with the rules regarding the recruitment of trainees under particular initiatives had also created difficulties for a small number of employers. What were perceived as bureaucratic procedures had, it was claimed, prevented (or nearly prevented) employers from hiring the trainee they wished. Similar experiences of applying for funding for training were also described as bureaucratic. Employers with high-skilled workforces often felt that initiatives were not relevant to them because the skill levels they required were believed to be greater than what initiatives such as the New Deal or the NVQ route could deliver. The quality of job applicants was also felt to be a problem with the New Deal initiative (and its predecessors); employers reported that applicants did not even attend the job interview. Evidence on employers’ attitudes towards, and experiences of, NVQs was also mixed. Despite one in ten telephone survey respondents reporting their achievement during the previous year, the interview data suggested only a limited amount of enthusiasm for them. Few employers attached much importance to NVQs even where staff had achieved them or were working towards one. Instead, employers viewed the role of NVQs primarily as providing credentials for workers which would be useful should they move to another employer rather than because they demonstrated that trainees possessed high skills. Respondents in ‘traditional’ industries such as engineering, motor maintenance and plant hire tended to the view that NVQs were inferior to the older City and Guilds qualifications in providing young people with the necessary job-related skills and knowledge. NVQs were often thought to be simply not demanding enough of trainees and, as a consequence, were of little value in assessing or guaranteeing young workers’ capabilities. Overall, then, employers’ experiences of government initiatives were mixed. A small number reported satisfaction with initiatives, often because of the availability of funding. Others complained about the bureaucratic procedures surrounding access to, and funding of, initiatives, the relevance of the initiatives to their businesses, the poor quality of initiatives, and problems with the quality of applicants particularly under New Deal and its precursors. Barriers to Participation in Government Training Initiatives As with training provision more generally, small employers often face considerable barriers to participating in, or using, government training initiatives. Previous research suggests that many of the barriers to participation in government training initiatives mirror those which restrict employers’ broader training provision: lack of a perceived need to train; lack of awareness of

74
training initiatives; financial cost and lack of time. They may also include more specific barriers such as bureaucratic procedures to enter and sustain participation (Curran et al. 1996). Using a prompt list, respondents were asked which, if any, were reasons for not participating in government initiatives (more). The two most common replies were: ‘government initiatives not relevant to your needs’ (reported by 38% of respondents) and ‘lack of information about available initiatives’ (reported by 37% of respondents) (Table 8.4). These two reasons also accounted for more than a half (53%) of all the main reasons for non-participation. Interestingly, lack of relevance was more likely to be reported as the main reason for not increasing the level of participation by those not involved in government initiatives (Table 8.5). Thirty per cent of non-participants gave this as the main reason compared to 14% of respondents currently participating in an initiative. On the other hand, those currently participating in government training initiatives were slightly more likely to claim that lack of information about initiatives was the main reason for not raising their level of participation. This suggests that policymakers perhaps need to address participants and non-participants in government initiatives in different ways. For participants, a greater marketing effort when introducing new initiatives and streamlining procedures to enable smooth access and implementation may be a better way of increasing take up. For non-participants, policymakers may need to address fundamentally the reasons why employers do not provide training at all; specifically, this goes to the issue of firms’ broader competitive strategies. Telephone survey respondents offered other reasons for not participating (further) in government training initiatives (Table 8.4). Lack of time and, particularly, financial costs did not appear to be particularly strong constraints on participation. But, conversely, 22% of respondents reported no need for further training (and 19% cited this as the main reason for non-participation in government training initiatives), suggesting that for this group of employers reducing the barriers to training would not necessarily increase take up. This was particularly common for micro employers with 2-9 workers: 20% gave this reply as the main reason for not participating (further) in government training initiatives, double that for larger employers. For these employers, policy reforms to increase awareness, improve the quality of training or reduce costs, seem unlikely to increase the level of take up of government training initiatives substantially. There were marked differences between strategic trainers and other types of business (Table 8.6). Strategic trainers were more likely to report ‘lack of information about available initiatives’ (32%) as the main reason for not undertaking (further) government training; this compares with only 12% of low trainers. Some strategic trainers do, therefore, seem amenable to encouragement to take part in government initiatives provided they are made aware of them and are persuaded of their relevance. For low trainers, the primary reason for non-participation was that they saw no need for further training (38%, compared with 8% of strategic trainers). Plus a further 34% felt that government initiatives were not relevant to their needs. Government may find it extremely difficult to persuade this group of employers to become involved in their training initiatives.

75
Table 8.4
Reasons for Not Participating in Government Training Initiatives More (weighted)
% of sample % reporting as main reason
Government initiatives not relevant to respondent’s needs 37.9 27.6 Lack of information about available initiatives 36.8 25.1 Don’t need further training 22.3 18.9 Lack of time to become involved with government training 21.2 11.8 Too bureaucratic to become involved with 17.4 4.6 Financial cost of government training 12.7 4.5 Poor quality of government training 6.2 3.0 Unsuitability of job applicants 2.3 2.1 Other reason 1.1 1.0 No data 1.3 1.3
Weighted N 1005 1005 Note: First column does not sum to 100% due to multiple response.

76
Table 8.5 Main Reason for Not Participating in Government Training Initiatives More
by Current Involvement in Government Training Initiatives (weighted)
% of involved % of uninvolved ALL Government initiatives not relevant to respondent’s needs 13.8 29.8 27.6 Lack of information about available initiatives 32.8 23.9 25.1 Don’t need further training 16.8 19.2 18.9 Lack of time to become involved with government training 13.2 11.6 11.8 Too bureaucratic to become involved with 10.7 3.7 4.6 Financial cost of government training 7.6 4.1 4.5 Poor quality of government training 0.5 3.4 3.0 Unsuitability of job applicants 0.7 2.3 2.1 Other reason 0.2 1.1 1.0 No data 3.7 1.0 1.3
Weighted N 133 872 1005

77
Table 8.6 Main Reason for Not Participating in Government Training Initiatives More
by Orientation to Training (weighted)
% of strategic trainers
% of tactical trainers
% of low trainers
ALL
Government initiatives not relevant to respondent’s needs 29.0 25.2 34.0 27.6 Lack of information about available initiatives 32.4 24.6 12.4 25.1 Don’t need further training 8.4 19.4 38.0 18.9 Lack of time to become involved with government training 13.2 11.4 10.8 11.8 Too bureaucratic to become involved with 2.7 6.8 0.5 4.6 Financial cost of government training 4.8 5.4 0.6 4.5 Poor quality of government training 5.9 2.0 1.0 3.0 Unsuitability of job applicants 0.9 2.7 2.2 2.1 Other reason 0.6 1.5 0 1.0 No data 2.1 1.1 0.6 1.3 Weighted N 295 560 149 1005 Note: Weighted column Ns do not sum to ‘ALL’ column Ns due to rounding.

78
A bleaker picture emerges for policymakers keen to encourage small employers to participate in government training initiatives when the data is examined by whether respondents were already providing any training for their workforces (Table 8.7). Those not providing workforce training were more likely to cite no need for further training (31%) and lack of relevance (29%) as the main reasons for not participating in government training initiatives. The corresponding figures for those providing workforce training were 15% and 27% respectively. This suggests that a high proportion of those not already training will be resistant to exhortation to become involved in government training initiatives because employers perceive initiatives as unnecessary - because employers do not demand training; or irrelevant - because employers’ skill needs will be met through other means. Government Assistance for Training Provision in Small Enterprises Given the diversity of attitudes towards government training policy, it might be expected that small employers may have a number of suggestions as to how policy might be reformed to better serve their interests with regard to training. Yet when telephone respondents were asked if government could provide any further help or assistance with regard to training, almost a half could offer no proposal: 36% felt that government could do nothing and a further 10% made no suggestion regarding government assistance for training (Table 8.8). A similar view was echoed in the interview data. Most business owners felt the government could do little to help them in respect of training matters. This was, however, no cause for regret on the part of business owners for two reasons. First, many respondents were not particularly interested in training and hence were neither seeking government training initiatives nor aware of them. Second, for those that were providing workforce training or interested in doing so, government initiatives were usually not considered to be the primary source; other providers, whether in-house or external, were deemed more important. For the majority of this group, therefore, there was no expectation that government could be of major assistance regarding the provision or funding of training and therefore it was not perceived as a major problem for them. Predictably perhaps, low trainers were most likely to report that government could do nothing to help with regard to training (Table 8.9). More than half of them (58%) gave this as their reply but even among strategic trainers, more than a fifth (21%) felt the government could do nothing to help.

79
Table 8.7
Main Reason for Not Participating in Government Training Initiatives More for Trainers and Non-Trainers (weighted)
% of trainers % of non-trainers ALL Government initiatives not relevant to respondent’s needs 27.3 28.6 27.6 Lack of information about available initiatives 26.6 20.5 25.1 Don’t need further training 15.0 30.7 18.9 Lack of time to become involved with government training 11.8 12.0 11.8 Too bureaucratic to become involved with 5.5 1.9 4.6 Financial cost of government training 5.3 2.3 4.5 Poor quality of government training 3.6 1.2 3.0 Unsuitability of job applicants 2.0 2.4 2.1 Other reason 1.3 0 1.0 No data 1.6 0.3 1.3 Weighted N 754 251 1005 Note: Trainers defined as those providing either initial training to new recruits or further training for established staff during the year prior to interview (or both). Column percentages do not sum to 100% due to rounding.

80
Table 8.8 Proposals for Reform of Government Training Initiatives (weighted)
% of sample % reporting as ‘main’
Nothing 36.0 N/a Financial support to train employees 29.0 34.5 More information on training opportunities available 22.2 24.3 Financial support to train partners/directors 10.1 3.6 Provide/improve quality/relevance of training 5.9 9.0 Improve basic skills for school-leavers 3.6 2.7 Reduce bureaucracy 1.9 2.2 Provide local training 0.8 1.0 Offer financial incentives to train 0.5 0.8 Other advice or support (eg literacy & numeracy) 4.2 5.6 No data 10.4 16.3
Weighted N 1005 643 Note: First column does not sum to 100% due to multiple response. Column percentages do not sum to 100% due to rounding.

81
Table 8.9
Proposals for Reform of Government Training Initiatives by Orientation to Training (weighted)
% of strategic
trainers % of tactical
trainers % of low trainers
ALL
Nothing 20.6 38.3 58.0 36.0 Financial support to train employees 38.3 26.8 19.0 29.0 More information on training opportunities available 37.0 18.2 8.4 22.2 Financial support to train partners/directors 12.6 10.5 3.3 10.1 Provide/improve quality/relevance of training 6.3 6.9 1.4 5.9 Improve basic skills for school-leavers 5.2 3.7 0.2 3.6 Reduce bureaucracy 1.6 2.0 2.0 1.9 Offer other financial incentives to train 1.4 0.2 0 0.5 Provide local training 2.7 0.1 0 0.8 Other advice or support (eg literacy & numeracy) 5.4 4.1 2.2 4.2 No data 4.0 12.5 15.3 10.4
Weighted N 295 560 149 1005 Note: ‘All’ column percentages derive from entire dataset. Column percentages do not sum to 100% due to rounding. Weighted column Ns do not sum to ‘ALL’ column Ns due to rounding.

82
Among those respondents who felt the government could provide greater support for training provision, the most common replies were providing ‘financial support to train employees’ (cited by 29% of the sample) and providing further information on available initiatives (22%). Interview data suggested a wide range of changes to government training policy, mostly specific to particular industries. A common response from employers in ‘traditional’ industries such as engineering, motor maintenance, construction and plant hire was that there was little encouragement to schoolchildren and young people to enter these occupations. The emphasis was perceived as being overwhelmingly on computing/IT jobs. Labour shortages were reported, for example, among lorry drivers, plant hire operators and engineering pattern-makers. These employers often suggested that greater public funding should be available for employers and workers to train to take up jobs in these sectors. There was also some complaint that government funding was only available for NVQ-related training; funding for non-NVQ training was perceived as difficult to obtain if not impossible. Summary The study highlighted a limited take-up among smaller employers of a variety of government training initiatives. Only 13% of employers reported current involvement in any government training initiative (excluding NVQs). Modern Apprenticeships, the most frequently cited initiative, was only reported by 5% of respondents. Achievement of an NVQ during the year prior to interview was reported in 11% of firms, with a further 14% reporting current involvement. Yet despite this level of involvement, employer attitudes towards, and experiences of, NVQs were mixed with several employers reporting that they offered little guarantee of the capabilities of trainees. There was substantial variation in employer participation in initiatives. Larger employers, employers in ‘other services’ and ‘primary and construction’, strategic trainers and those providing other forms of workforce training were much more likely to report involvement in a government training initiative. Lack of a perceived need for further training from whatever source was commonly seen as the main reason for restricting participation. The main barriers to participation in government training initiatives were the lack of perceived relevance of initiatives and the lack of information about available initiatives. But another group of employers who did not perceive any need to provide further training suggests that policy initiatives which attempt to overcome these barriers may have only a limited effect. Interview data suggests that many small employers are unaware of government training initiatives but that even if awareness levels could be increased the lack of any desire to increase their training effort would limit their take up of any new initiatives. Nearly a half of all small employers were unable to specify anything that government could do to assist them with regard to training. For these employers, government was not perceived as a primary source of training. Either employers did not perceive a need for further training from any source or, alternatively, they sought other training providers.

83
CHAPTER 9
CONCLUSIONS AND POLICY IMPLICATIONS
Key Findings and Themes Initial Training for New Recruits, Established Staff and Owner-Managers The practice of providing initial training for new recruits was very widespread with 82% of relevant employers reporting it in the year prior to interview. For some, it was more important than training for established staff and, in several cases, initial training was the only sort of workforce training provided. Initial training took various forms: informal on-the-job coaching from employers and other experienced members of the workforce, learning on-the-job, learning about the firm’s internal administrative procedures, and meeting other members of the workforce to understand their roles. Most initial training was conducted at the workplace by employers themselves or by experienced members of the workforce. In only a very small number of cases did initial training involve external providers. The content of such training focused on ‘operational’ issues such as working methods, product knowledge and health and safety rather than more strategic or managerial matters. The character, extent and duration of initial training varied depending on the job and the trainee. For some jobs, employees could be taught most of what they needed to know to become fully productive within a few hours. For other, more highly skilled, jobs, the period of induction could take years – effectively, an informal 'apprenticeship' - before employers expected trainees to be fully competent members of the workforce. Initial training also varied with recruits’ prior work experience and aptitude to learning. Those without previous relevant experience, or who found it difficult to absorb training, would receive a longer period of training. But even experienced newcomers received some initial training in order to learn the very specific ways employers prefer staff to work and behave. Examples include the particular types of equipment or software used, the firm’s internal administrative/organisational systems or, in personal service industries, how to handle customers. Six in ten employers reported the provision of further training for established staff in the year prior to interview and, among those providing such training, almost half of their established workers received training. As with initial training, the content related primarily to ‘operational’ rather than longer-term ‘strategic’ or ‘managerial’ issues. Further training for established staff was much more variable than initial training in its employee coverage, mode and location of delivery, and its purpose. Employers of professional and technical workers were more likely to provide training for that occupational group than any other and a higher proportion of this occupational group were recipients of training in the year prior to interview. This possibly reflects the higher (and increasing) skill development needs arising out of changes in markets, technology and legal frameworks. Fewer than half of owner-managers (40%) reported undertaking training themselves during the year prior to interview. The content of most of this training suggested that owner-managers

84
concentrated on day-to-day, operational matters rather than more long-term, strategic business development. Owner-managers tended to adopt a narrower definition of ‘training’ when discussing their own training than when discussing workforce training. This led them to understate their own personal involvement as learners, particularly in relation to experiences and interactions at the workplace. Owner-managers placed much less emphasis on in-house, and especially on-the-job, training for themselves; they were much more likely to use external training providers, whether at, or away from, the workplace. Employer Motivations to Train Training had two main objectives. The first was to ensure new staff had the knowledge and skills employers believed to be technically necessary to perform their work roles competently. The second objective was to socialise staff into work and behave in ways acceptable to employers and to fit into the existing pattern of social and functional relations in the workplace. Much of this might not be considered genuine skill development in that new recruits were only being shown how to perform their jobs but for employers this was considered crucial. This second objective was particularly salient in respect of initial training for new recruits where employers attempted to set the parameters of acceptable behaviour. More specifically, the key objectives of training were to improve workers’ skills for their current work roles and to improve business performance. In most cases training was seen as a means for enabling workers to increase their individual performance but it also reflected other goals such as improving customer satisfaction or meeting legislative requirements. This is consistent with other studies showing that small employers tend to train to meet their immediate skill needs rather than to attain longer-term objectives such as training to meet future skill requirements or to cope with business growth. Employers reported a mix of in-house and external training providers, both on- and off-the-job, at the workplace and away from it. The ‘default position’ for most employers was to provide training using in-house sources unless there were strong reasons to seek external providers. In-house training was usually provided on-the-job to tackle immediate problems affecting individual workers. In-house training had the advantages of relevance, convenience and low cost. Training could be tailored to suit the specific requirements of worker and employer, be delivered at times and in formats which were convenient to both parties, and was relatively inexpensive in avoiding course fees, travel and accommodation costs associated with training away from the business. External training providers were used primarily where employers lacked the skills and knowledge to provide the training in-house or where external certification or validation was required. Examples of the latter included training to comply with legal requirements, for example, to obtain or renew licenses to continue to provide certain types of service, or to meet health and safety regulations; alternatively, training was often required for individuals to maintain membership of professional bodies through Continuing Professional Development. Frequently, employers hoped to combine the advantages of in-house and external training providers by bringing in external trainers to deliver training on-site. Using external providers in

85
this way, to deliver training tailored to employers’ specific needs at the workplace, avoided major disadvantages such as lost working time. Equipment and software suppliers were commonly used in this way. Correlates of Training The provision of training was influenced by the organisational context within which it took place. The implementation of major changes in working practices, workforce organisation and equipment and the introduction of new products and services, were all found to be associated with higher levels of training provision. This pattern existed for all three types of training recipient (new recruits, established staff, owner-managers). Where businesses operate in dynamic market conditions which demand a high level of innovation in products and processes in order to compete, owner-managers may feel it necessary to train to develop workforce knowledge and skills. Most often, training was undertaken as a consequence of decisions made previously to introduce new products and processes; employers recognised the need to develop workforce knowledge and skills to ensure that the changes were implemented successfully. Only in a few cases was training undertaken prior to the decision to innovate in the sense that it might subsequently give rise to future product and process innovations. Employers concentrated their training effort on solving current or imminently foreseen problems rather than on more speculative, long-term and as-yet-unforeseen issues. Evaluating The Effects of Training The qualitative data suggested that most employers make some evaluation of the training they provide, the majority using informal methods such as observation of workers’ activities and work-related outputs. Fewer respondents in the telephone survey reported such evaluation perhaps neglecting their own informal practices. Most employers believed that training generated beneficial consequences. The qualitative data showed that employers focused their attention on workers’ job performance and not on broader organisational measures such as change in sales turnover, employment or profit. Where individual workers were found to perform their jobs more competently and safely then employers defined the training as a 'success'. None claimed to be able to detect any direct ‘bottom-line effect’ as a consequence of training. This suggests that claims that small employers do not train because they cannot see any impact on business performance are misplaced. Rather, the yardsticks used to evaluate training centre on the individual worker and not the enterprise. Moreover, the majority of business owners were in no doubt that training did, in fact, improve individual worker performance. Variations in Orientation Towards Training In contrast to blanket assertions that small employers manage training in a reactive and informal way, small employers vary in their orientations to training provision. A typology distinguishing three types of orientation towards training, based on the extent to which training was seen as

86
important to the business and/or was budgeted or planned was established. These types were labeled Strategic, Tactical and Low trainers. Tactical trainers were the most common, comprising more than half of the telephone sample. Data from the qualitative sample confirmed the usefulness of the typology. The typology showed that employers so classified, differed in their provision of training, their specific training practices, their reasons for training and, just as important, their reasons for not providing training. Strategic Trainers, as might be expected, were more likely than Tactical and Low trainers to provide workforce training, to train a higher proportion of their workforce, and to undertake training themselves. They were also more likely to deliver training in a variety of formats – on- and off-the-job, at and away from the workplace – for both workers and themselves. Strategic Trainers ascribed greater benefits to training and were more enthusiastic concerning the provision of further training. Conversely, Low Trainers were more likely to report that training would not benefit their businesses. Variations in orientation to training provision were linked to differences in enterprise size, sector, the level of product market competition, sources of competitive advantage, employment and sales growth, projected employment and sales growth. But the relationship between orientation to training and structural and contextual factors is complex. A multi-nomial regression model confirmed the robustness of the three-fold typology and demonstrated that both Strategic and Tactical trainers were significantly different from Low Trainers. Further, the model highlighted the relevance of the introduction of new products and services as the key influence separating Strategic trainers from Tactical trainers. Employers were more likely to adopt a strategic orientation where they employed a higher proportion of professional and technical workers or where the business had introduced new products, new equipment or made other changes in the organisation of the workforce, in the year prior to interview. Strategic Trainers were also more likely to report wanting to provide further training for their workforces. While this is perhaps to be expected, it does offer further support for the view that differences in orientation are persistent features: those employers currently attaching most importance to training were also the ones most likely to want to provide further training in the future. Strategic Trainers were more likely to report that training was constrained by real barriers such as lost working time and financial cost, although even amongst this group there were some who thought that sufficient training had already been provided to staff. Low Trainers, on the other hand, were more likely to give reasons indicating a lack of perceived need for further training. Barriers to Training Policymakers and other analysts often believe that small employers' barriers to training are linked to the size of their enterprise: the smaller the enterprise the more intractable these problems are to solve. As a consequence, there is an assumption that small employers provide 'insufficient' training because of resource constraints. However, the research found that many employers do not perceive a need for further workforce training mainly on the grounds that

87
employees are sufficiently skilled already. Employers also stated that more workforce training would not generate further benefits for the business but would incur additional financial and time related costs. Indeed, for such employers it could be argued that the term ‘barrier to training’ is an inappropriate phrase. This is a problem for policymakers wanting to encourage smaller employers to train because unless employers perceive a need for it they are unlikely to be responsive to training initiatives. This group may comprise up to a half of all small businesses, particularly the very small ones. Other employers perceived a need for further workforce training but were faced with constraints. The main barriers to training for this minority, as other studies have found, were lost working time and financial costs. Contrary to statements by the National Skills Task Force among others, ‘poaching’ of trained labour is not a major concern for small employers. The need to provide training to enable staff to perform their jobs competently and safely, and the specificity of that training to suit employers’ very particular needs are important considerations and poaching is not a serious constraint for very many owner-managers. Policymakers may find that it is these employers who will be more responsive to training initiatives. Yet the restrictions arising out of concerns about lost working time may be difficult to address. But where the primary constraint on training provision lies on the demand side – that is, where employers do not perceive a need for further training – supply-side changes such as reducing the money cost of training may have only a marginal impact on take up. Employers will not provide more training where they do not see a need for it, even if it is freely available. Size and Industry Differences Employers’ training practices and their attitudes towards training varied according to enterprise size. The study reinforced the findings of earlier studies that small employers are less likely to report the provision of training than their larger counterparts although where they did provide it, similar proportions of established staff were involved. Differences in the reasons for not providing or undertaking additional training varied very little by enterprise. Larger businesses were more likely to be strategic trainers whereas smaller employers were also more likely to be classified as low or tactical trainers. Sector differences were evident in the incidence of training provision, training index values, the reasons for not wanting to provide additional training, orientations to training, participation in government initiatives. Given the high level of aggregation of the six industry groups used in the study, it is difficult to offer clear explanations of these differences although the research does suggest that more narrow-sector specific studies should be undertaken. One reason underpinning sectoral differences could be the occupational composition of the workforce in different sectors. Employers with professional and technical workers were more likely to provide training and training index values indicated that a higher proportion of this occupational group received training in the year prior to interview. This finding also probably reflects the higher level of training required to maintain high product quality as well as more rapid changes occurring in markets and technological conditions.

88
Policy Implications A key implication of our findings concerns targeting training initiatives at particular types of employer, and, within enterprises, at particular members of the workforce. Segmenting the small business population and workforce in these ways can help identify specific training needs and facilitate the targeting of policy initiatives and the use of appropriate delivery mechanisms. Enterprises were segmented in two main ways: in terms of their actual training practices during the year prior to interview ('trainers and non-trainers'); and in terms of their orientations towards training ('Strategic, Tactical and Low trainers'). There were important differences between both groups in their reasons for wanting (or not wanting) to provide further workforce training. Among employers providing training and those exhibiting a strategic trainer orientation, a majority viewed their training activity as constrained by a range of factors, particularly financial costs and time. For these employers, policy initiatives aimed at reducing the money and time costs of training is likely to increase take up (assuming no diminution of the quality and relevance of training provision). Given owner-managers’ preference for training at the workplace, whether by in-house or external providers, building on the training small employers already provide could be a way forward. Yet, amongst non-trainers and those with a low trainer orientation, policies that aim to encourage small employers to provide additional training, by reducing the money, time and other such barriers, are likely to enjoy only a very limited degree of success. These business owners tend not to perceive any requirement for further training and simply feel that it would not offer any benefits. Quite the contrary: the provision of training consumes essential resources, notably time and money, which would be better allocated elsewhere. Because these business owners can survive and prosper by pursuing their present product strategies (and their associated training requirements), there is little incentive for them to offer further training for their workforces. Most employers are likely to continue with their present practices of skill formation and development unless there are strong incentives to change. Exhortations to train by policymakers are unlikely to work. Recent proposals by the National Tasks Skills Force (2000a) that the new Learning and Skills Councils (LSCs) establish a national framework of local and sectoral employer networks, that the Small Business Service should promote best practice in management and work organisation to small firms, and that small employers with fewer than 50 employees achieving the IiP standard should receive a tax credit or a reduction in corporation tax, may have only a marginal impact on these small employers’ training activities. Unless small employers perceive benefits to providing more or better training such proposals are likely to have only a limited impact on training provision. It follows that there is no easy entry point for public policy to reach employers and employees within these firms. The absence of demand for training on the part of small business owners means that changes on the supply-side – primarily the cost, quality and location of training provision – are likely to have only a limited impact on take-up. Policy may need to undergo a fundamental shift in emphasis and be linked much more strongly to product and service development strategies for SMEs. One possible route to encouraging training among this group of employers might be to combine inducements to train with a broader package of measures aimed at fostering a shift in product strategy. Without such parallel initiatives efforts to

89
encourage increased training provision will be seen by many to be irrelevant to their concerns. This approach involves venturing into potentially more hazardous, terrain. First, it necessitates crossing conventional government departments. Historically, product- and innovation-oriented initiatives, such as SPUR and SMART, have been the responsibility of the DTI whereas training policy has usually fallen within the remit of the DfES. Second, such an approach is likely to be more expensive. Third, take up of training will be contingent upon take up of the broader product-/innovation-related initiative. Small business owner involvement in these types of initiatives, however, may be as low as their involvement in training initiatives. A special effort on the part of policymakers to market the potential benefits of participation in these initiatives may be required if small employers’ training activities are to be developed. We recognise that policy initiatives aimed at encouraging small employers to modify or transform their existing product strategies will be costly, complex and likely to be resisted by many on the grounds that they will require root-and-branch transformations of existing practice. Policymakers may therefore need to be discriminating in choosing who to target since a broad-brush approach may not be sufficient to stimulate continuing change in specific sectors. One approach might be to target enterprises in dynamic and innovative sectors. At the level of the enterprise, training initiatives could target different groups of staff. The division between new recruits, established staff and owner-managers is one form of segmentation. The research shows that initial training for new recruits is often very firm-specific. The point at which employers are looking to take on new employees may be one of the few times when they are prepared to engage with the NVQs and apprenticeship systems of formal training. For the segment defined as 'established staff', the major barriers to train discussed above tend to apply and the ways in which public policy can link into this group is most probably when there is technical change in the enterprise. For owner-managers themselves, raising training effort is most difficult to achieve of all the three sub-groups because of their emphasis on lack of time and their perception that their skills are difficult, if not impossible to cover in their absence. Owner-manager training needs to be linked to their broader business strategy and, on a longer term basis, to the educational system. A 'broader business strategy' relates to clarifying the links between change in the enterprise (through product, process or other developments) and the need to undertake training. Again, one of the ways in which government could do this is by embedding training into already established initiatives, such as those which are product or marketing focused. This is more likely to follow the owner-managers' line of thinking in that training is undertaken not for its own sake but is an integral and relevant part of a wider development in the enterprise. A 'longer term, educational strategy' relates to building much stronger connections with the educational system and curricula in schools, colleges and universities to engender a learning culture. Although the benefits of a stronger ‘enterprise’ component in educational curricula for the training behaviour of owner-managers has yet to be fully evaluated, it can be argued that the deep-rooted rigidity in owner-managers’ thinking regarding the importance of their own personal training needs a fundamental re-think.

90
For those firms displaying experience of owner-manager and workforce training, the task of raising training effort may be less intractable. Here the range of entry points for delivering training initiatives may be greater and owner-managers may be more receptive to a dialogue regarding improving the content and delivery of training. For example, some firms conducting training may be looking for assistance in respect to covering their costs or be prepared to respond to changes in the mode of delivery. Here changes in the supply of training may affect take-up.

91
APPENDIX 1 METHODOLOGICAL APPENDIX
TableA1.1 Outcomes of All Contacts Made:
Telephone Survey and Personal Interviews
Outcome Telephone survey
Personal interviews
Interviews Achieved 1005 50
Not Interviewed: 3107 144 of which: · Refused/interview aborted 495 46 · Ineligible for Selection/out of quota 945 44
· Unable to contact respondent or conduct interview within fieldwork period
1667 54
Letters sent 4112 194
Response rate (%) 67.0 52.1 Notes: columns do not sum to 100% due to rounding. Response rate calculated using the following formula: Number interviewed / number interviewed + Refused/interview aborted
The sampling frame used for the survey was a Dun and Bradstreet UK Marketing business database. The database includes approximately 1.3 million records, compared with an IDBR-estimated total population of 3.7 million businesses (DTI 2001). This was considered a suitable sampling frame from which to construct a sample of small business owners, as the vast majority of these 1.3 million businesses are small. Telephone sample businesses satisfied the following criteria: • location – all businesses were located in England; • employment size – all businesses employed 2-49 people, including at least one non-owner; 14 • independence – all businesses were legally independent; • sector – target interview quotas were established for each of six specified sector groups. Previous research has shown employers’ training practices to vary with enterprise size and with sector (Curran et al., 1996). Given the skewed size and industry distributions of the business 14 Over three-quarters (79%) of respondents were owners, partners or directors within the enterprise, 17% were managers, and the remaining 5% were either relatives of an owner or non-managerial employees.

92
population, a random sample of businesses would very likely be dominated by very small firms and businesses in particular industries. To ensure that the study findings could be generalised to particular size and industry business sub-groups, the sample was structured in terms of three size bands and six broad industry groups, giving 18 separate size/sector combinations (Table A1.2 in Methodological Appendix). Interview quotas were set for each size/industry combination to permit generalisation to sub-groups of businesses whose limited presence in the broader business population may have rendered a pure random sample unsuitable. Where subsamples contain only a few cases, there will be doubt as to whether any observed differences between different types of business reflect real differences or whether they are due to the particular composition of the subsamples. Within each combination, individual businesses were selected randomly. In summary, therefore, the method can be described as random sampling within size and sector stratifications. An approximation to the target quotas was achieved. To facilitate comparisons with the national business population, results were grossed up on an enterprise size by broad industry group basis, to population estimates derived from the DTI (2001) estimates for the business population for the year 2000 (Table A1.3 in Methodological Appendix). This means that the results for enterprises in the smallest size category and in industries such as ‘distribution, hotels and catering’ and in ‘business and professional services’ receive higher weightings because they constitute a high proportion of the business stock. This is reflected in the weighted Ns for these categories of enterprise in the data tables throughout the report. Eligibility for inclusion in the face to face interview study was the same as for the telephone sample.15 Interviews were undertaken with respondents in a wide range of industries and with varying levels of employment. The aim of these interviews was to explore the diversity of issues and experiences relevant to understanding training in a wide range of industrial contexts rather than to find the typical or average experience. Interviews were conducted in two locations: Greater London and South Yorkshire. The purpose was not to produce findings attributable to location but rather to avoid any possible single-location effect. All interviews were tape recorded to facilitate data analysis.
15 Three businesses employed between 50 and 60 people.
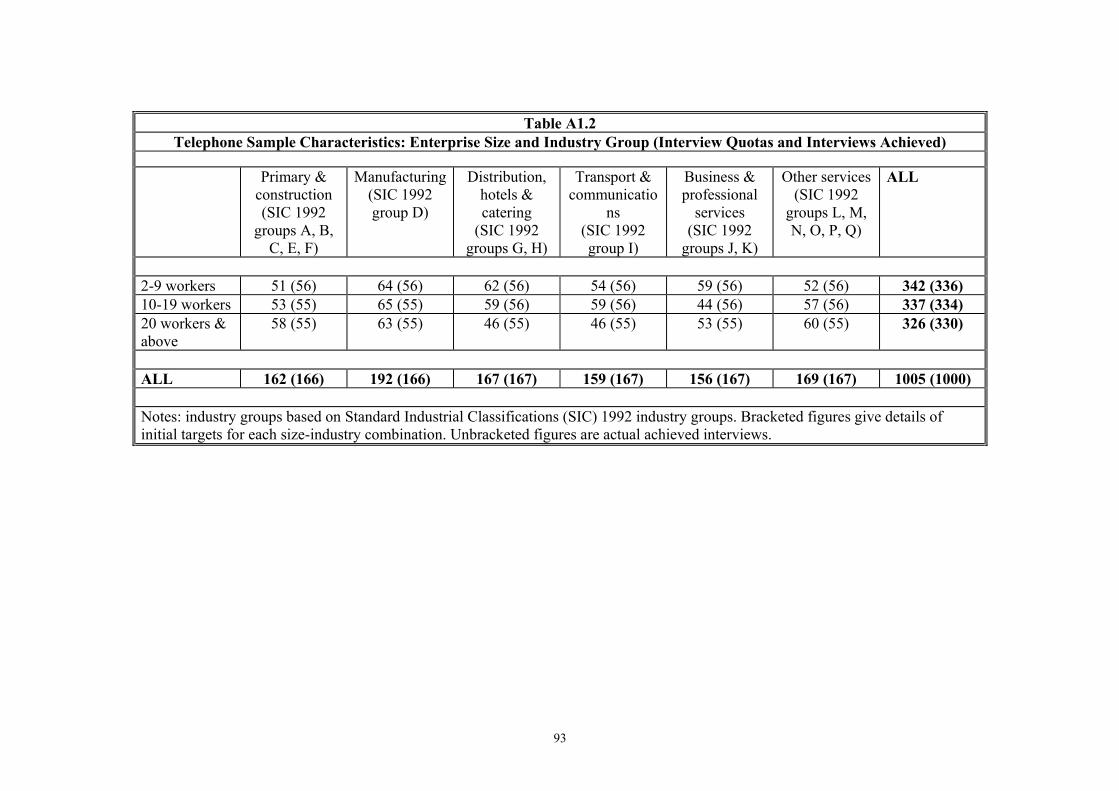
93
Table A1.2
Telephone Sample Characteristics: Enterprise Size and Industry Group (Interview Quotas and Interviews Achieved) Primary &
construction (SIC 1992
groups A, B, C, E, F)
Manufacturing (SIC 1992 group D)
Distribution, hotels & catering
(SIC 1992 groups G, H)
Transport & communicatio
ns (SIC 1992 group I)
Business & professional
services (SIC 1992
groups J, K)
Other services (SIC 1992
groups L, M, N, O, P, Q)
ALL
2-9 workers 51 (56) 64 (56) 62 (56) 54 (56) 59 (56) 52 (56) 342 (336) 10-19 workers 53 (55) 65 (55) 59 (56) 59 (56) 44 (56) 57 (56) 337 (334) 20 workers & above
58 (55) 63 (55) 46 (55) 46 (55) 53 (55) 60 (55) 326 (330)
ALL 162 (166) 192 (166) 167 (167) 159 (167) 156 (167) 169 (167) 1005 (1000)
Notes: industry groups based on Standard Industrial Classifications (SIC) 1992 industry groups. Bracketed figures give details of initial targets for each size-industry combination. Unbracketed figures are actual achieved interviews.

94
Table A1.3
Telephone Survey: Weighting Multipliers by Industry Group and Enterprise Size
Enterprise Size
Industry Group 1-9workers 11-19 workers 20-49 workers Primary & construction (SIC92 Broad sectors A, B, C, E, F)
2.9952 0.1933 0.059
Manufacturing (SIC92 Broad sector D)
1.2248 0.2489 0.1627
Distribution Hotels and Catering (SIC92 Broad sectors G, H)
4.5598 0.5536 0.2535
Transport & Communications (SIC92 Broad sector I)
0.5993 0.0749 0.0437
Business & Professional Services (SIC92 Broad sectors J, K)
3.6436 0.4225 0.127
Other Services (SIC92 Broad sectors L, M, N, O, P, Q)
1.9752 0.2944 0.1340
Note: weighting bases derived from DTI (2001) data on employment size and industry distributions of business stock in 2000.

95
Table A1.4
Workforce Composition by Industry Group (weighted) % of workforce in each occupational category Primary &
construction Manufacturing
Distribution,
hotels & catering
Transport & communications
Business & professional
services
Other services
ALL
Owners 28.1 20.2 26.6 21.3 29.6 19.0 25.2 Employed managers
5.7 5.8 6.2 2.9 7.6 8.5 6.6
Professional & technical
1.8 5.5 4.6 2.5 23.1 13.9 9.4
Clerical 10.1 8.4 10.6 10.0 21.4 8.5 12.1 Skilled manual 31.9 32.0 11.0 29.9 5.1 7.3 15.9 Semi-skilled manual
22.4 27.8 41.0 32.2 12.1 43.0 30.3
All 100.0 100.0 100.0 100.0 100.0 100.0 100.0 Average Size 6.5 9.7 7.5 7.5 6.5 8.4 7.4 Weighted N 166 105 327 39 240 128 1005
Notes: Industry groups based on Standard Industrial Classifications (SIC) 1992 groups (see Table 2.2). Percentages for each sector derived by dividing the number in each occupational group by the ‘ALL’ row data for that particular sector. Percentages do not sum to 100% because of missing data for occupational groups. N figures given relate to ‘ALL’ rows only.
96
REFERENCES Abbott, B. (1993) ‘Training Strategies in Small Service Sector Firms: Employer and Employee Perspectives, Human Resource Management Journal, 4, 2, 70-87. Atkinson, J. and Meager, N. (1994) ‘Running to Stand Still: the Small Firm in the Labour Market’, in Atkinson, J. and Storey, D. (eds) Employment, the Small Firm and the Labour Market, Routledge, London. Cambridge Small Business Research Centre (1992) The State of British Enterprise, Department of Applied Economics, Cambridge University, Cambridge. Campanelli P. and Channell J. with McCauley L., Renouf A. and Thomas R. (1994) Training: An Explanation of the Word and Concept with an Analysis of the Implications for Survey Design, Employment Department, Research Series No 30, London. Cosh, A., Duncan, J. and Hughes, A. (1998) Investment in Training and Small Firm Growth and Survival: An Empirical Analysis for the UK 1987-95, DfEE Research Report RR36, HMSO, London. Cosh, A., Hughes, A. and Weeks, M. (2000) The Relationship Between Training and Employment Growth in Small and Medium-Sized Enterprises, Working Paper No 188, Centre for Business Research, University of Cambridge. Curran, J., Kitching, J., Abbott, B. and Mills, V. (1993) Employment and Employment Relations in the Small Service Sector Enterprise - A Report, ESRC Centre for Research on Small Service Sector Enterprises, Kingston Business School, Kingston Polytechnic. Curran, J., Blackburn, R. A., Kitching, J. and North, J. (1996) Establishing Small Firms’ Training Practices, Needs, Difficulties and Use of Industry Training Organisations, Research Studies RS17, DfEE/HMSO, London. Cushion, N. (1995) How to Succeed in Small Business Training: a Breakthrough, Centre for Applied Research in Management, Education and Training, Norwich. Department for Education and Employment (DfEE) (2000) Learning and Training at Work 2000, www.dfee.gov.uk/statistics/DB/SFR/s0217/index.html Department for Education and Employment (DfEE) (2001) Opportunity and Skills in the Knowledge-Driven Economy, DfEE, London. Department of Trade and Industry (DTI) (1998) Our Competitive Future, cm 4176, London. Department of Trade and Industry (DTI) (2001a) Small and Medium Enterprise (SME) Statistics for the United Kingdom, 2000. Available at www.sbs.gov.uk/statistics

97
Department of Trade and Industry (DTI) (2001b) Opportunity for All in a World of Change, cm 5052, London. DTZ Pieda Consulting (1999) Evaluation of the IiP Small Firms Development Projects, DfEE Research Report 135, DfEE/HMSO, London. Finegold, D. and Soskice, D. (1988) ‘The Failure of Training in Britain: Analysis and Prescription’, Oxford Review of Economic Policy, 4, 3, 21-53. Green, F. (1997) Review of Information on the Benefits of Training for Employers, Research Report No. 7, DfEE, London. Hillage, J. and Moralee, J. (1996) The Return on Investors, IES Report 314, Institute for Employment Studies, Brighton. IFF Research Ltd (2000) Learning and Training at Work 1999, DfEE Research Report RR202, DfEE/HMSO, London. Johnson, S. (1999) Skills Issues for Small and Medium sized Enterprises, Skills Task Force Research Paper 13, Middlesex University Business School, London. Johnson S. and Gubbins A. (1992) ‘Training in Small and Medium-Sized Enterprises: Lessons from North Yorkshire’, in Caley, K., Chell, E., Chittenden, F. and Mason, C. (eds) Small Enterprise Development: Policy and Practice in Action, London, Paul Chapman. Keep, E. (2000) Creating a Knowledge Driven Economy – Definitions, Challenges and Opportunities, SKOPE Policy Paper No. 2, Research Centre on Skills, Knowledge and Organisational Performance, Warwick University. Keep, E. and Mayhew, K. (1998) ‘The Assessment: Knowledge, Skills and Competitiveness’, Oxford Review of Economic Policy, 15, 1, 1-15. Keep, E. and Rainbird, H. (2000) ‘Towards the Learning Organization?’, in Bach, S. and Sisson, K. (eds) (2000) Personnel Management (3rd ed), Blackwell, Oxford. Kerr, A. and McDougall, M. (1999) ‘The Small Business of Developing People’, International Small Business Journal, 17, 2, 65-74. Kitching, J. and Blackburn, R. (1999) ‘Management Training and Networking in Small and Medium-Sized Enterprises in Three European Regions: Implications for Business Support’, Environment and Planning C: Government and Policy, 17, 621-635. Kitson, M. and Wilkinson, F. (2000) ‘Training, Human Resource Management Methods and the National Minimum Wage, in Cosh, A. and Hughes, A. (eds) British Enterprise in Transition, ESRC Centre for Business Research, Cambridge.

98
Loan-Clarke, J., Boocock, G., Smith, A. and Whittaker, J. (1999) ‘Competence-Based Management Development in Small and Medium-Sized Enterprises: a Multi-Stakeholder Analysis, International Journal of Training and Development, 4, 3, 176-195. Lloyd, C. (2000) High Involvement Work Systems: The Only Option for UK High Skill Sectors?, SKOPE Research Paper No. 11, SKOPE, University of Warwick. Marlow, S. (2000) ‘Investigating the Use of Emergent Strategic Human Resource Management Activity in the Small Firm’, Journal of Small Business and Enterprise Development, 7, 2, 135-148. Marshall J., Alderman N., Wong C. and Thwaites A. (1995) ‘The Impact of Management Training and Development on Small and Medium Enterprises’, International Small Business Journal, 13, 4, 73-90. Matlay, H. (2000) ‘Training and the Small Firm’, in Carter, S. and Jones-Evans, D. (eds) Enterprise and Small Business: Principles, Practice and Policy, Prentice Hall, London. Matlay, H. and Hyland, T. (1997) ‘NVQs in the Small Business Sector: a Critical Overview’, Education and Training, 39, 9, 325-332. Maton, K. (1999) Evaluation of Small Firms Training Loans, DfEE Research Report No 97, DfEE, Sheffield. National Skills Task Force (1998) Towards a National Skills Agenda, First Report of the National Skills Task Force. National Skills Task Force (2000a) Skills for All: Proposals for a National Skills Agenda, Final Report of the National Skills Task Force. National Skills Task Force (2000b) Tackling the Adult Skills Gap: Upskilling Adults and the Role of Workplace Learning, Third Report of the National Skills Task Force. Ottens, M. and Taylor, A. (2000) ‘Raising Competitiveness Through Training and Joined up Policy Making’, paper presented at the 23rd ISBA National Small Firms Conference, Aberdeen. Patton, D., Marlow, S. and Hannon, P. (2000) ‘The Relationship Between Training and Small Firm Performance: Research Frameworks and Lost Quests’, International Small Business Journal, 19, 1, 11-27. Sadler-Smith, E., Sargeant, A. and Dawson, A. (1998) ‘Research Note: Higher Level Skills Training and SMEs’, International Small Business Journal, 16, 2, 84-94. Sims, D. Golden, S. Blenkinsop, S. and Lewis, G. (2000) Barriers to Take-up of Modern Apprenticeships and National Traineeships by SMEs and Specific Sectors, DfEE Research Report No 205, DfEE, Sheffield.

99
Storey D. and Westhead P. (1994) Management Training and Small Firm Performance: A Critical Review, Working Paper No 18, Centre for Small and Medium Sized Enterprises, Warwick University Business School. Storey D. and Westhead P. (1996) ‘Management Training and Small Firm Performance: Why is the Link so Weak?’, International Small Business Journal, 14, 4, 13-24. Storey, D. and Westhead, P. (1997) ‘Management Training in Small Firms – a Case of Market Failure?’, Human Resource Management Journal, 7, 2, 61-71. Vickerstaff, S. (1992) ‘The Training Needs of Small Firms’, Human Resource Management Journal, 2, 1-15. Westhead, P, (1997) ‘Factors Associated with the Provision of Job-Related Formal Training by Employers’, International Journal of Entrepreneurial Behaviour and Research, 4, 3, 187-216. Whittington, R. (1993) What is Strategy – and Does it Matter?, Routledge, London. Wood, S. (1999) Education, Training and the British Third Way, SKOPE Policy Paper No. 1, Research Centre on Skills, Knowledge and Organisational Performance, Oxford University.