The nature of silica-alumina surfaces: I. Thermodynamics of adsorption of ammonia
11
JOURNAL OF CATALYSIS 1, 244-254 (1962) The Nature of Silica-Alumina Surfaces. I. Thermodynamics of Adsorption of Ammonia ALFRED CLARK, V. C. F. HOLM, AND D. M. BLACKBURN From the Phillips Petroleum Company, Research Division, Bartlesville, Oklahoma Received February 27, 1262 The adsorption of ammonia on eleven silica-alumina gels ranging in composition from pure alumina to pure silica has been studied. Isosteric heats and dilIerential surface entropies have been determined from adsorption isotherms at 5Gdegree intervals in the range lW4OO”C. The adsorption data are correlated satisfactorily by means of the Freundlich equation. Isosteric heats drop off sharply with increasing coverage for all the gels. Compositions in the range of 5540% silica have the largest fraction of weak adsorption sites. This is the region which exhibits high catalytic activity for various acid-type reactions. The magnitude of the differential surface entropies indicates that in this range most of the adsorbed molecules are in a highly mobile state. I. INTRODUCTION In this paper an account is given of the thermodynamics of adsorption of ammonia on eleven silica-alumina gels ranging in composition from pure alumina to pure silica. Isosteric heats of adsorption and differential surface entropies are stressed. In a second paper, this thermodynamic information will be related to catalytic properties in a group of reactions carried out over gels of the same compositions. In a third paper, a detailed statistical-me- chanical interpretation of the adsorption of ammonia on alumina will be given. Basic work on the clarification of adsorp- tion thermodynamics, especially adsorption entropies, was carried out by de Boer and Kruyer (1) . Numerous reports (g-5) on the adsorption of ammonia or other nitrogen- containing bases on alumina and silica- alumina have appeared in the literature. Very few of them cover broad enough ranges of temperatures and surface con- centrations to allow significant thermody- namic information to be obtained. Most of them are concerned with silica-alumina gels having compositions in the limited re- gion of good cracking catalysts. It is one of the primary objectives of this work to show the trends in thermodynamic proper- ties as a function of adsorbent composition. We have used differential thermodynamic quantities throughout the paper in accord with the views of Everett (6). In our opin- ion, differential quantities have a more direct bearing on the interpretation of catalytic phenomena than integral molar quantities. Furthermore, they are easier to obtain experimentally. II. EXPERIMENTAL Materials Eleven adsorbents ranging in composition from pure alumina to pure silica were pre- pared. The silica-alumina compositions were coprecipitated from solutions of sodium silicate and sodium aluminate as described previously (7). Silica gel was made by a similar procedure from sodium silicate. Alumina was obtained by heat treatment of high purity p-alumina trihy- drate from Davison Chemical Corporation ; the resulting material was T-alumina. All adsorbents were heated in granular form for 16 hours at 55O’C in a stream of 244
-
Upload
alfred-clark -
Category
Documents
-
view
214 -
download
1
Transcript of The nature of silica-alumina surfaces: I. Thermodynamics of adsorption of ammonia

JOURNAL OF CATALYSIS 1, 244-254 (1962)
The Nature of Silica-Alumina Surfaces. I. Thermodynamics of Adsorption of Ammonia
ALFRED CLARK, V. C. F. HOLM, AND D. M. BLACKBURN From the Phillips Petroleum Company, Research Division, Bartlesville, Oklahoma
Received February 27, 1262
The adsorption of ammonia on eleven silica-alumina gels ranging in composition from pure alumina to pure silica has been studied. Isosteric heats and dilIerential surface entropies have been determined from adsorption isotherms at 5Gdegree intervals in the range lW4OO”C. The adsorption data are correlated satisfactorily by means of the Freundlich equation. Isosteric heats drop off sharply with increasing coverage for all the gels. Compositions in the range of 5540% silica have the largest fraction of weak adsorption sites. This is the region which exhibits high catalytic activity for various acid-type reactions. The magnitude of the differential surface entropies indicates that in this range most of the adsorbed molecules are in a highly mobile state.
I. INTRODUCTION
In this paper an account is given of the thermodynamics of adsorption of ammonia on eleven silica-alumina gels ranging in composition from pure alumina to pure silica. Isosteric heats of adsorption and differential surface entropies are stressed. In a second paper, this thermodynamic information will be related to catalytic properties in a group of reactions carried out over gels of the same compositions. In a third paper, a detailed statistical-me- chanical interpretation of the adsorption of ammonia on alumina will be given.
Basic work on the clarification of adsorp- tion thermodynamics, especially adsorption entropies, was carried out by de Boer and Kruyer (1) . Numerous reports (g-5) on the adsorption of ammonia or other nitrogen- containing bases on alumina and silica- alumina have appeared in the literature. Very few of them cover broad enough ranges of temperatures and surface con- centrations to allow significant thermody- namic information to be obtained. Most of them are concerned with silica-alumina gels having compositions in the limited re- gion of good cracking catalysts. It is one
of the primary objectives of this work to show the trends in thermodynamic proper- ties as a function of adsorbent composition.
We have used differential thermodynamic quantities throughout the paper in accord with the views of Everett (6). In our opin- ion, differential quantities have a more direct bearing on the interpretation of catalytic phenomena than integral molar quantities. Furthermore, they are easier to obtain experimentally.
II. EXPERIMENTAL
Materials
Eleven adsorbents ranging in composition from pure alumina to pure silica were pre- pared. The silica-alumina compositions were coprecipitated from solutions of sodium silicate and sodium aluminate as described previously (7). Silica gel was made by a similar procedure from sodium silicate. Alumina was obtained by heat treatment of high purity p-alumina trihy- drate from Davison Chemical Corporation ; the resulting material was T-alumina.
All adsorbents were heated in granular form for 16 hours at 55O’C in a stream of
244

NATURE OF SILICA-ALUMINA SURFACES 245
dry air and stored prior to use under dry a small diameter quartz fiber. The sample conditions. Each sample received a further was enclosed by a Pyrex furnace tube, 11/- heat treatment at 500°C for one hour inch OD and 20 inches long, attached to under diffusion-pump vacuum in the ad- the lower side of the balance case by sorption apparatus just before use. Physi- means of a tapered joint. The balance case cal and chemical properties of these adsorb- was connected by 5/8-inch OD glass tubing ents are given in Table 1. The compositions to a vacuum manifold consisting of a
TABLE 1 COMPOSITION AND PROPERTIES OF SILICA-ALUMINA CATALYSTS
SA. W/s)
Avg. POR dia. 6,
Tam& activity= Protonic aoidityb (meq/mz X 101) beq/m* X 18)
0 <o .002 303 0.56 74 0.51 0 8 0.003 292 0.46 63 1.44 0.14
15 0.008 358 0.51 57 1.02 0.18 40 0.18 309 0.49 63 1.05 0.48 55 0.17 249 0.42 68 1.33 0.99 70 0.22 296 0.32 43 1.37 1.55 82 0.036 397 0.58 58 0.89 1.78 90 0.010 510 0.52 41 0.75 1.45 95 0.004 562 0.52 37 0.6OC 1.18” 98 0.003 564 0.59 42 - 0.63”
100 0.026 344 0.59 68 0.06” 0.27
0 Determined by titration with n-butylamine in dry benzene (7). * Determined by base exchange with neutral ammonium acetate solution (7). c Denotes results on similar compositions but different preparation batches.
given in this table are approximate; they are within 1% of the actual analyses. Pore volumes were sufficiently large that no indi- cations of slow diffusion were obtained dur- ing adsorption measurements. In the com- positions 40, 55, and 70% silica, the sodium contents are higher than desired, but they did not appear to affect the general trends of the results obtained. Other metal impuri- ties were present only in trace quantities.
Ammonia was obtained from the Mathe- son Company, and its specified purity (99.99%) was verified. Extreme precau- tions were taken to maint,ain ammonia samples moisture free.
A&w-p tion Equipment Adsorption measurements were made
with a vacuum microbalance similar to one described by Gray and Jennings (8). The adsorbent sample of about 0.2 g, contained in a small quartz bucket, was suspended from one arm of the balance by means of
manometer, triple-range McLeod gauge, liquid nitrogen trap, three-stage mercury diffusion pump, and suitable connections and stopcocks for admitting gas to the system. The sensitivity of the balance under the conditions of use was between 1 and 2 rg.
The furnace tube was specifically de- signed to minimize the effect of convection currents which otherwise would have proved bothersome at the higher tempera- tures. A short length of v&inch OD tubing, closed at the bottom, was placed within the furnace tube. It was supported by the thermocouple well which was attached to the bottom of the furnace tube and ex- tended upward a short distance through the bottom of the inner tube. The quartz bucket, suspended by the quartz fiber, was situated in the quiescent zone within the inner tube. Convection corrections never exceeded 10% of the total weight of ad- sorbed phase. Maximum corrections oc-

246 CLARK, HOLM, AND BLACKBURN
curred at a pressure of about 0.1 mm of mercury and at the highest temperature (400°C) of adsorption measurements. At higher and lower pressures and at lower temperatures, corrections rapidly declined to zero. Convection corrections were estab- lished by using an inert material, sand, in the sample bucket and making weighings in vacua and at various ammonia pressures over the temperatures covered by the adsorption measurements.
Adsorption Technique
All adsorbents were heated for one hour at 500°C under diffusion-pump vacuum prior to adsorption measurements. After adjustment of the temperature to 400°C the pressure was of the order of low6 mm of mercury, and the weight of the sample was stable. The total water contents of the stabilized samples varied between 0.8 and 2.5%. Future work will include the effect of water content on the adsorption char- acteristics of the various adsorbents. A pre- determined amount of ammonia was ad- mitted into the system. After periodic weighings indicated that equilibrium had been reached, a pressure reading was made and the temperature adjusted to 350°C for equilibrium measurements at this level. The procedure was repeated at 50-degree intervals down to 100°C. Similar runs were made using different amounts of ammonia. Thus adsorption data were obtained at each temperature level for various pressures up to 15 mm of mercury.
The sorption of ammonia by all eleven compositions of the adsorbents proved fully reversible over all the temperatures studied, and it was possible to evaluate thermo- dynamic functions over a broad range of coverages. Isotherm points could be dupli- cated within the limits of sensitivity of the balance by approaching the points from the high temperature side as described above or from the low temperature side. Similar techniques for ensuring the attainment of equilibrium were used by Frankenburger (9) and by Sweett and Rideal (10) in other systems. Excellent agreement among iso- therm points was obtained in duplicate
runs with fresh samples of adsorbents. It was also shown that gas uptake repre- sented true adsorption and not an equi- librium of the type:
S-HsO+ + NHs(g) G S-NH,+ + HzO(g) (1)
where a product is displaced from the sur- face upon adsorption of ammonia. In one case, using alumina as the adsorbent, 1420 pg of ammonia was introduced into the adsorption system at 100°C. The increase in weight after equilibrium had been reached was 1398 pg and the equilibrium gas pressure was 0.006 mm which cor- responds to 17 pg of ammonia. Thus, no more than 1.5% of the ammonia could have been adsorbed according to Eq. (1) if alI of the residue gas were considered to be water vapor. In another case, using SiO,- ALO, (70: 30) as adsorbent, 821 pg of am- monia was introduced into the adsorption system at 100°C; 813 pg was adsorbed at an equilibrium gas pressure of 0.0013 mm which corresponds to 4 pg of ammonia. Thus, no more than 1% of the ammonia could have been adsorbed according to Eq. (1) if all the residual gas were water vapor. Under all conditions and with all adsorb- ents, the sum of the weights of residual (equilibrium) and adsorbed gas checked closely the weight introduced into the sys- tem, and no changes in pressure readings were observed when the measurements were made at more than one compression ratio.
III. RESULTS AND DISCUSSION
Isotherms
The results of ammonia adsorption meas- urements were plotted on large-scale graphs for each adsorbent. A typical set of iso- therms for 70% SiO,-30% Al,O, is shown in Fig. 1. It was found that the data for all adsorbents except silica gel and 98yo silica-2% alumina conformed well to the Freundlich equation, N = ApC, where A and c are functions of temperature only, N X lOI* is the number of adsorbed am- monia molecules per cm2 of surface, and p is the equilibrium gas pressure in mm of mercury. The values of the constants,

NATURE OF SILICA-ALUMINA SURFACES 247
0 .o 1
0.001
A and c, are presented in Table 2 for the onset of slow rise depends sharply on tem- various adsorbents. The two compositions perature. This behavior is typical of sur- which did not conform very well to the faces which possess a spectrum of sites Freundlich equation had such low total ranging in adsorption energy from strong adsorption at the temperatures investigated to weak. that good experimental accuracy was diffi- Figure 2 shows how the adsorption of cult to attain. ammonia varied with adsorbent composi-
The isotherms for the adsorbents show tion for selected levels of temperature and steep initial rises and then enter a region equilibrium pressure. The curves at 400°C of slow rise. The surface coverage at the reveal essentially a gradual decrease in
0.1 1 .o
NO. MOLECULES/ CM2 X 10 -14
30% Al 203- 70% Si02
FIO. 1. Freundlich plot of NH, adsorption.

TABL
E 2
FREU
ND
LIC
H
CO
NST
ANTS
IN
TH
E EQ
UAT
ION
,a
N
= Ap
t, FO
R N
H*
ADSO
RPT
ION
O
N S
ILIC
A-AL
UM
INAS
AT
VA
RIO
US
TEM
PER
ATU
RES
T”C
loo
150
200
250
300
3.50
4o
cl
% S
iOs
A e
A c
A e
A e
A c
A E
A c
P
0 1.
625
0.09
4 1.
300
0.10
2 1.
013
0.12
2 0.
836
0.13
4 0.
660
0.14
1 0.
508
0.15
0 0.
384
0.15
4 g
8 1.
600
0.10
7 1.
225
0.10
4 0.
960
0.12
8 0.
740
0.14
8 0.
580
0.16
1 0.
460
0.18
9 0.
315
0.20
9 F
15
1.50
0 0.
175
1.12
5 0.
126
0.88
0 0.
144
0.68
0 0.
151
0.54
0 0.
156
0.41
0 0.
165
0.30
0 0.
171
40
1.50
0 0.
145
1.15
0 0.
157
0.90
0 0.
176
0.66
0 0.
209
0.49
0 F.
- 0.
226
0.34
0 0.
240
0.23
0 0.
253
55
1.55
0 0.
192
1.20
0 0.
165
0.96
0 0.
195
0.70
0 0.
228
0.53
0 0.
243
0.36
0 0.
274
0.25
0 0.
261
3
70
1.32
5 0.
158
1.05
0 0.
183
0.82
0 0.
199
0.63
0 0.
221
0.47
0 0.
224
0.35
0 0.
230
0.23
0 0.
232
82
g 1.
075
0.15
5 0.
860
0.15
5 0.
680
0.16
9 0.
520
0.17
4 0.
395
0.17
0 0.
300
0.17
6 0.
225
0.16
1 90
?i
0.
840
0.12
9 0.
650
0.12
7 0.
610
0.12
3 0.
400
0.12
4 0.
320
0.11
7 0.
255
0.10
4 0.
195
0.12
7 95
0.
640
$ 0.
107
0.48
0 0.
116
0.38
0 0.
118
0.31
0 0.
111
0.25
0 0.
120
0.22
0 0.
114
0.16
5 0.
108
s 98
-
- -
- 0.
230
0.09
0.
190
0.09
5 0.
165
0.09
1 0.
135
0.09
2 0.
115
0.08
8 r
0 N
X
1014
, the
num
ber
of a
mm
onia
m
olec
ules
ads
orbe
d pe
r cm
*; p,
equ
ilibriu
m
pres
sure
in
mm
mer
cury
. Ba
aed
on e
xper
imen
tal
isot
herm
s up
~J
J 15
mm
pr
essu
re.

NATURE OF SILICA-ALUMINA SURFACES 219
- -;------ I I IMM ,*>4oo"c -
'0 IO 20 30 40 7 50 60 70 60 90 PER CENT 502
FIQ. 2. Variation of ammonia adsorption with silica-alumina composition at three temperatures for two pressures.
adsorption as the composition varies from pure alumina to pure silica. However, at 250°C and lOO”C, particularly at ammonia pressures of 10 mm, the curves show max- ima in the neighborhood of 55% silica. This certainly is related to the familiar acidic properties developed in this system by the combination of the two materials, silica and alumina. In fact, the curve for adsorp- tion at 100°C and 10 mm pressure is re- markably similar to the one obtained by plotting the acidity of the same adsorbents determined by butylamine titration in dry benzene (7).
Isosteric Heats of Adsorption The isosteric heats of adsorption, qst =
-Aii, were obtained in the usual manner from the integrated form of the Clausius- Clapeyron equation, for a constant number of molecules adsorbed per unit area. Areas were determined by the BET method. It was not possible to obtain experimental points on each isostere covering the entire temperature range, 100”400”C. The tem- perature ranges were broad enough on each isostere, however, to show the constancy of
qst at constant surface coverage within the limits of experimental accuracy, It was assumed that small extrapolations of iso- steres could be made without introducing significant errors in the real picture.
Calculations of isosteric heats were made at adsorption level intervals of 0.02 X 10” molecules per cm2. Many adsorption meas- urements were made at temperatures within the 50-degree intervals selected for com- plete study. Isosteric heats calculated from these measurements agreed well with those determined over the 50-degree intervals.
Smooth curves of the average values of qst for each adsorption level are plotted against surface coverage for the eleven adsorbent compositions in Figs. 3 and 4. Deviations of the unaveraged isosteric heats from the smoothed curves did not exceed 8% of the smoothed curve values for the initial points on the very steepest. portion and 3% at higher coverages. All curves show a rapid initial drop. Silica gel and the high silica adsorbents show the sharpest drops and have the smallest total adsorption. Curves for alumina and high- alumina adsorbents drop less rapidly. Their

250 CLARK, HOLM, AND BLACKBURN
ADSORBED NH3, MOLECULES PER CM’xIO-”
FIG. 3. Variation of isosteric heats of adsorption with coverage for ammonia on Si0,AL03 cata- lysta of various compositions.
total adsorption is greater and they have a much larger fraction of high energy sites. The curves for intermediate compositions, 55 to 90% silica, reach lower heats and show a large amount of low energy adsorp- tion. This is the range of composition in which silica-alumina catalysts are known to develop the highest activity for such acid-type reactions as olefin polymeriza- tion, skeletal isomerization, cracking, and hydrogen transfer.
Some of the curves reach minima and then increase. The upswing is attributed to exothermal interactions between near- neighbor adsorbed molecules of ammonia. For some compositions, 98% silica-2% alumina, for example, the upswing occurs at rather low coverage. This might indicate a nonuniform distribution of sites in small “islands.”
As mentioned above, isosteric heats were determined at a constant number of mole-
ADSORBED NH3, MOLECULES PER C#XIO-‘~
Fm. 4. Variation of the isosteric heats of ad- sorption with coverage for ammonia on SiO,Al,O, catalysts of various compositions.
cules adsorbed per cm’. Another procedure often described in the literature (10) is to determine a saturation value assumed inde- pendent of temperature and then calculate isosteric heats as a function of the fraction of saturation value. The methods are equiv- alent. Both rely on the invariance of the total number of sites or surface area with temperature in order to be consistent with the Clausius-Clapeyron equation,
(4 a In p Qat dT r=m
where the partial derivative is taken with I?, the true concentration, constant. The invariance of qst and, as will be shown later, the differential molar entropy with temperature at constant number of mole- cules adsorbed per cm2 is strong evidence that no marked change in the number or nature of adsorption sites or in surface area occurs with change of temperature. For specific models of the adsorbed state this is easily shown. Assume fixed adsorption of the ammonia molecule with no rotation and no interaction of adsorbed species with one another. Assume further t,hat the int,ernal
NATURE OF SILICA-ALUMINA SURFACES 251
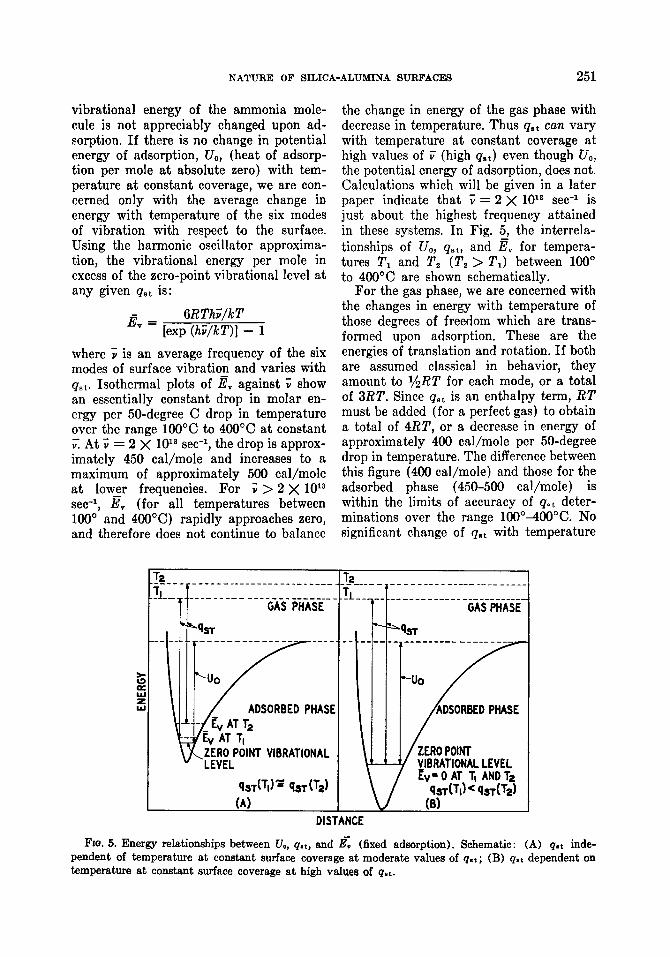
vibrational energy of the ammonia mole- cule is not appreciably changed upon ad- sorption. If there is no change in potential energy of adsorption, U,,, (heat of adsorp- tion per mole at absolute zero) with tem- perature at constant coverage, we are con- cerned only with the average change in energy with temperature of the six modes of vibration with respect to the surface. Using the harmonic oscillator approxima- tion, the vibrational energy per mole in excess of the zero-point vibrational level at any given qst is:
E, = GRThF/kT [exp (hi/kT)] - 1
where ; is an average frequency of the six modes of surface vibration and varies with qst. Isothermal plots of & against ; show an essentially constant drop in molar en- ergy per 50-degree C drop in temperature over the range 100°C to 4OO’C at constant V. At ; = 2 x lOI set-I, the drop is approx- imately 450 Cal/mole and increases to a maximum of approximately 500 Cal/mole at low_er frequencies. For ; > 2 X 10¹³ set-‘, E, (for all temperatures between 100” and 4OO’C) rapidly approaches zero, and therefore does not continue to balance
the change in energy of the gas phase with decrease in temperature. Thus qst can vary with temperature at constant coverage at high values of G (high qst) even though UO, the potential energy of adsorption, does not. Calculations which will be given in a later paper indicate that 7 = 2 X 10¹³ set-’ is just about the highest frequency attained in these systems. In Fig. 5, the interrela- tionships of ‘CJ,, qRt, and & for tempera- tures T, and T, (T, > T,) between 100” to 400°C are shown schematically.
For the gas phase, we are concerned with the changes in energy with temperature of those degrees of freedom which are trans- formed upon adsorption. These are the energies of translation and rotation. If both are assumed classical in behavior, they amount to $$RT for each mode, or a total of 3RT. Since qst is an enthalpy term, RT must be added (for a perfect gas) to obtain a total of 4RT, or a decrease in energy of approximately 400 Cal/mole per 50-degree drop in temperature. The difference between this figure (400 Cal/mole) and those for the adsorbed phase (450-500 Cal/mole) is within the limits of accuracy of qqt deter- minations over the range 100”-400”C. No significant change of qst with temperature
T2 _-----_-_------------- -- ------ - ----___------ ------_-_.
--------- - --__-- IL-- --- ___------------------ GAS PHASE GASPHASE
%T ---- --------- _____
ll!iv
_____
z uo E
%iT -- ------ --------- ---__-_-
Ill-l F uo
I (A) I DISTANCE
Fro. 5. Energy relationships between U,, q ,*, and E: (fixed adsorption). Schematic: (A) get inde- pendent of temperature at constant surface coverage at moderate values of qst ; (B) q.t dependent on temperature at constant surface coverage at high values of qat.
252 CLARK, HOLM, AND BLACKBURN
would be observed so long as 5 does not exceed 2 X 10¹³ set-’ approximately.
Similar arguments may be developed for other models of the adsorbed phase with approximately the same results. It is there- fore reasonable to conclude that the invari- ance of qst and differential molar entropy of adsorption with temperature at constant number of molecules per cm2 indicates that no marked change in the mode of adsorp- tion occurs with change of temperature.
Differential Entropies
Taking gaseous ammonia at 1 atm as the standard state and ignoring deviations from the perfect gas laws, the partial molar free energy of adsorption is given by:
APP = RTlnpr
at a surface concentration I’, at which the equilibrium pressure is pr. The differential molar entropy of adsorption relative to the standard state was then obtained from the equation:
~~~ = ABE - T&
where -AHr = qBt is the isosteric heat of adsorption whose determination was de- scribed in the preceding section. The differ- ential molar entropy, Sr, of the adsorbed molecules was obtained from the relation:
where So is the molar entropy of gaseous ammonia at 1 atm. Values of So for tem- peratures between lOO”4OO”C were ob- tained from the literature (11). A typical calculation of isosteric heat, partial molar free energy, and entropy is given as follows:
For the adsorbent SiO,-Al,O3 (82: 18) the equilibrium pressures at a coverage of 0.72 X 1O1’ molecules/cm2 and tempera- tures 300”, 250”, 200”, 150”, and 1OOOC are 14, 5.16, 1.60, 0.36, and 0.058 mm, respec- tively. Using the pressures for 300”-25O”C, 250°-200°C, 200-150”C,-and 150-lOO”C, the following values of AH = -qst are cal- culated from the Clausius-Clapeyron equa- tion : -11700, -11520, -11870, -11460 Cal/mole, respectively. The average of these values is 11637 Cal/mole. Similar averages
are obtained for other coverages an_d a smoothed curve drawn of average AH vs. coverage. The smoothed value of Al? for 0.72 X 10¹⁴ molecules/cm2 is 11200 cal/ mole, and is taken as the heat of adsorption over the temperature range investigated. The partial molar free energies, Apr = RTlnp,, are calculated for the five tem- peratures and corresponding equilibrium pressures in atmospheres (standard state : gas at 1 atm). The values are: -4570, -5190, -5790, -6440, and -7210 cal/ mole at 300”, 250”, 200”, 150”, and 100°C. The differential molar entropies of adsorp- tion determined from A,w = AH, - TA,!?~ are found to be: -11.50, -11.49, -11.44, -11.25, and -11.26 eu at @O’, 250”, 200”, 150”, and 100°C. From A& = (Sr - So), using the literature values: 52.3, 51.2, 50.3, 49.3, 48.1 eu for S, at 300”, 250”, 200°, 150”, and lOO”C, the values of the differ- ential surface entropies are found to be 40.80, 39.31, 38.86, 38,05, and 36.84 eu.
In Fig. 6, values of Sr are plotted against the number of molecules adsorbed per cm2 for various compositions of adsorbents. To conserve space, only six of the eleven ad- sorbents studied are shown. Those not shown also fall in line with the trends dis- cussed below.
To serve as rough guides, the molar en- tropies of gaseous ammonia and the differ- ential molar entropies of the perfect two- dimensional adsorbed gas have been plotted for corresponding temperatures. The latter, 8rw were calculated by statistical mechan- ical methods on the assumption (12) that the integral molar entropy, Srm, of the adsorbed layer is given by:
srm = Szt + SR + sv
where S,, is the integral molar entropy of two degrees of translational freedom, SR is the molar rotational entropy, and S, the molar entropy of internal vibrations of the ammonia molecule. The expression assumes that the only loss accompanying the process of adsorption is one translational degree of freedom. The entropy of vibration with respect to the surface has been neglected. The translational entropy (1s) is given by:

NATURE OF SILICA-ALUMINA SURFACES 253
Szt = R In MTA + 65.8
where M is the molecular weight of am- monia, and A the area. occupied per mole- cule-a function of the number of moles (n) adsorbed. Rotational and vibrational entropies are readily calculated by well- known statistical methods (13). Multiply- ing the expression for Sr, by n to get the eotal entropy, S”rm, and then taking the derivative, as,/a,n = SF,,,, gives the de- sired expression :
Srm = s2, -I- SR + s, = R In MTA -I- 63.8 + SB + S,
which is not much different from Sr,,,. Es- sentially, the expression gives the maximum differential molar entropy of a mobile ad- sorbed layer of ammonia. Other physical models of the adsorbed state may be se- lected and the entropies calculated.
As mentioned in the preceding section, the experimentally determined differential molar entropy of-adsorption relative to the standard state, ASr, is independent of tem- perature at constant coverage within the limits of experimental accuracy. The dif- ferential molar entropy of the adsorbed molecules, &, as may be seen from Fig. 6, varies with temperature at constant cov- erage. Approximately, the isotherms of ,%‘r plotted against the number of molecules adsorbed per cm2, are equally displaced from one another in the vertical direction. In all cases, the initial entropies, gr, at low coverages are small and are rising rapidly. They then level out; if adsorbate-adsorbate interaction occurs, they-fall again. They behave conversely to AHr. The fact that some of the curves rise above the values for a two-dimensional adsorbed gas is in- terpreted to mean that vibration with respect to the surface in the vertical direc- tion is beginning to make a significant con- tribution to the entropy (IS).
It is in the intermediate range, 55-90s silica, that the highest entropies are ob- tained, that is, the greatest mobilities. On either side, the maximum entropies are significantly lower, much closer to the maximum values calculated for a perfect two-dimensional gas.
*) SO X SiOa
ADSOBED NH,, Y(
I
0 IlEl
U 40% SiOt
4) .2x*
XC
E .P
I 0
Fm. 6. DifYerential entropies for ammonia ad- sorbed on silica-alumina gels at various composi- tions. Expefimental differential surface entropy curves-E (S,). Entropies of gaseous ammonia at 1 atm-G (So). Calculated maximum differential entropies for perfect two dimensional gas-C (&, + S, + a). Temperature interval in sets of curves (G, E, C) is 50°C.
On alumina (Fig. 6a) at low coverage the differential molar entropy sinks as low as 2.7 eu per mole at 400 C. A molecule of ammonia in this state must be essentially immobilized-no rotation and no transla- tion.
Types of Adsorption Sites Thermodynamic studies alone provide
very little information about the types of sites present on silica-alumina surfaces. In conjunction with other studies (7), they may throw some light on this question. In nonaqueous butylamine titrations, for ex-

254 CLARK, HOLM, AND BLACKBURN
ample, both typical silica-alumina crack- ing catalyst and pure alumina indicate an appreciable number of acid sites. Pure alumina, however, shows no activity for propylene polymerization, or hydrogen transfer, whereas the silica-alumina is quite active. On the other hand, if the acidities are determined by base exchange (7) with aqueous ammonium acetate solu- tion, pure alumina shows no acidity whereas the silica-alumina shows about the same amount as indicated by butylamine titration. This brings up the question of the occurrence of two types of acidity, the so-called Lewis and protonic (BrSnsted) , in these catalysts, and suggests that for the reactions mentioned, protonic acid sites are more important than Lewis acid sites. If protonic acid sites are formed by inter- action of water with Lewis acid sites, the adsorption energies of the resulting sites are probably lower than those of the parent Lewis acid sites. Our thermodynamic stud- ies, therefore, may indicate that for any given composition the weakest adsorption sites are protonic and the strongest ones Lewis acids. For different compositions, Lewis acid sites probably have different energy distributions, and the relative ad- sorption energies of protonic sites may well reflect the energies of the particular Lewis sites on which they were formed.
IV. CONCLUSION
The data reported in this paper show that considerable information on the nature of silica-alumina surfaces can be obtained by studying a wide range of compositions. They show that broad distributions of adsorption energies are encountered with each composition, and that there are im-
portant differences between them. In cata- lytic reactions on these surfaces, we believe that adsorption energy distributions are just as significant as the amount of adsorp- tion. Only when the ranges of compositions studied are narrow and of approximately equal adsorption energy distributions is the amount of adsorption alone a measure of catalytic activity.
ACKNOWLEDGMENT
The authors wish to express their appreciation to Phillips Petroleum Company for permission to publish this work.
1.
6.
7.
8.
9.
10.
11.
la.
13.
REFERENCES
DE BOER, J. H., AND KRUYER, S., Koninkl. Ned. Akad. Wetenschap. Proc. B55, 451 (1952) ; B56, 67, 236, 415 (1953) ; B57, 92 (1954) ; B58, 61 (1955).
KOBERSTEIN, E., 2. Elektrochem. 64, 908 m60).
EBERLY, P. E., J. Phys. Chem. 65, 1261 (1961). WEBB, A. N., Ind. Eng. Chem. 49, 261 (1957). OBLAD, A. G., MILLIKEN, T. H., JR., AND MILLS,
G. A., Advances in Catalysis 3, 266-209 (1951).
EVERETT, D. H., Trans. Faraday Sot. 48, 453 (1950).
HOLM, V. C. F., BAILEY, G. C., AND CLARK, ALFRED, J. Phys. Chem. 63, 129 (1959).
GRAY, T. J., et al., “The Defect Solid State,” p. 4%. Interscience, New York, 1957.
FRANICENBUROER, W. G., J. Am. Chem. Sot. 40, 1827 (1944).
SWEEIT, F., AND RIDEAL, E., Second Znternu- tional Congress on Catalysis, Section 1, Paper No. 1.
KOBE, K. A., AND HARRISON, R. H., Petroleum Refiner 33, 161 (1954).
TRAPNELL, B. M. W., “Chemisorption,” p. 211. Butterworths, London, 1955.
KEMBALL, C., Advances in Catalysis, 2, 237- 240 ( 1950).