THE NATURE OF IDEOLOGICAL IDENTIFICATION IN · PDF fileTHE NATURE OF IDEOLOGICAL...
33
THE NATURE OF IDEOLOGICAL IDENTIFICATION IN MASS PUBLICS PART III: CONSEQUENCES Donald R. Kinder & Nathan P. Kalmoe Department of Political Science University of Michigan, Ann Arbor Prepared for delivery at the Annual Meeting of the Mid-West Political Science Association Chicago, Illinois, April 22, 2010 Copyright by the Mid-West Political Science Association
Transcript of THE NATURE OF IDEOLOGICAL IDENTIFICATION IN · PDF fileTHE NATURE OF IDEOLOGICAL...

THE NATURE OF IDEOLOGICAL IDENTIFICATION IN MASS PUBLICS PART III: CONSEQUENCES
Donald R. Kinder & Nathan P. Kalmoe
Department of Political Science University of Michigan, Ann Arbor
Prepared for delivery at the Annual Meeting of the Mid-West Political Science Association
Chicago, Illinois, April 22, 2010 Copyright by the Mid-West Political Science Association

THE NATURE OF IDEOLOGICAL IDENTIFICATION IN MASS PUBLICS PART III: CONSEQUENCES
ABSTRACT
In a famous and influential essay, Philip Converse (1964) concluded that most Americans are innocent of ideology: indifferent to standard ideological concepts, lacking a consistent outlook on public policy, in possession of real opinions on only some issues of the day, and knowing precious little. Against this, when asked directly, many American are quite willing to describe themselves in ideological terms. The purpose of our paper (the third in a series of three) is to reconcile the results on ideological identification with the broad and otherwise well-supported claim of ideological innocence. Here we assess the consequences of ideological identification, focusing on voting in presidential elections in particular. We find that, properly estimated, ideological identification has a small effect on the vote; that this effect pales in comparison to the effects due to other standard ingredients of electoral choice, especially party identification; and that, absent considerable interest in politics, ideological identification plays no role at all. We conclude that, taken all around, the evidence on ideological identification fits comfortably with the general conclusion of ideological innocence.

1
THE NATURE OF IDEOLOGICAL IDENTIFICATION IN MASS PUBLICS PART III: CONSEQUENCES
Donald R. Kinder & Nathan P. Kalmoe
In today’s world, the idea of democracy is widely embraced – both by those who actually
practice it and those determined to subvert it. But this is a modern turn; over the ages, political
commentators have often been more impressed with the imperfections of democracy than with its
virtues. In The Republic, for example, Plato argued that democracy was dangerous: citizens possessed
neither the experience nor the knowledge required for sound judgment; they acted on impulse,
sentiment, and prejudice; and they were easily manipulated by leaders who “profess themselves the
people’s friends” (1974, p. 376).
Closer to our own time and place, many perceptive observers have concluded that ordinary
citizens are simply not up to shouldering the burdens of democracy. In The Phantom Public,
Lippmann compared the predicament of the average citizen who wants to be a virtuous citizen to a
fat man who aspires to become a ballet dancer (1925, p. 39). Likewise, Schumpeter (1942) argued
against democracy on the grounds that the average citizen “is impatient of long or complicated
argument,” is in possession of “weak rational processes,” is “not ‘all there.’” In Schumpeter’s
judgment, the typical citizen “drops down to a lower level of mental performance as soon as he
enters the political field. He argues and analyzes in a way which he would readily recognize as
infantile within the sphere of his real interests. He becomes a primitive again” (1942, pp. 257, 262).
For the most part, such arguments were advanced without benefit of systematic evidence.
Schumpeter was right to say that deciding whether the pre-conditions for democracy are actually
met requires not “reckless assertion” but rather “laborious appraisal of a maze of conflicting
evidence” (1942, p. 254) – but he did not undertake such an analysis himself. To be fair, in
Schumpeter’s time, there was not much high-grade evidence to analyze. Which brings us to Philip

2
Converse (1964) and his celebrated, or notorious, but certainly extraordinary analysis of belief
systems in mass publics.
After a penetrating analysis of national surveys carried out in the late 1950s, Converse
concluded that the American mass public – any mass public, really – is largely innocent of ideology.
Converse found most Americans indifferent to or mystified by standard ideological concepts;
without a consistent outlook on public policy; in possession of genuine opinions on only a handful
of the issues of the day; and (pardon us) knowing damn little. In a phrase, ideologically naïve.
Not everyone agreed, of course. Indeed, publication of Converse’s essay set off a huge
scholarly commotion. But when all the evidence is considered and all the counter-arguments
assessed, the original claim of ideological naiveté stands up very well (Kinder 1983, 1998).
And yet. At about the time the back-and-forth over the ideological appetite of the American
public was beginning to subside, a new question was making its way onto the National Election
Study (NES). Since 1972, those participating in election studies have been asked whether they think
of themselves as liberals or conservatives, and if so, to locate themselves on a 7-point scale,
stretching from extreme liberal (on the far left of the scale, naturally) to extreme conservative (on
the far right). When asked directly in this way, many American seem quite willing to describe
themselves in ideological terms. Moreover, those who say they think of themselves as liberals tend
to favor redistributive welfare policies, social change, and left-leaning presidential candidates; those
who say they think of themselves as conservatives tend to express misgivings about racial
integration, favor capitalism, and give their votes to right-leaning candidates (e.g., Conover &
Feldman 1981; Jacoby 1995; Knight 1985; Levitin & Miller 1979). These empirical relationships are
rather modest – statistical tendencies, not logical imperatives – but they show up with considerable
regularity. Over the years, ideological identification has become a fixture in the behavioral analysis
of politics – “nearly indispensable,” as Ellis and Stimson recently put it (2007, p. 4).

3
What does the now considerable literature on ideological identification have to say to the
claim of ideological innocence? The answer is not immediately obvious. Ideological identification
researchers have for the most part gone about their business without pausing to consider the larger
debate on ideology.1
This paper is the third in a series that seeks to reconcile the results on ideological
identification with the claim of ideological innocence (Kinder & Kalmoe 2008, 2009). Our business
here is to assess the consequences of ideological identification, focusing on voting in presidential
elections in particular. If ideological identification turns out to play an important role in the vote,
this, we say, would make trouble for the claim of ideological innocence. Perhaps the American
public is less naïve than we have been led to believe.
We begin the old-fashioned way, with a definition. We specify what we mean by ideological
identification, partly by drawing an analogy between it and party identification, perhaps the single
most important concept in American election studies. Next we spell out how ideological
identification is conventionally measured. In the next section of the paper, we identify two causal
mechanisms that could plausibly account for the empirical relationship between ideological
identification and presidential voting: selective perception and category-based reasoning. So
informed, we then proceed in the heart of the paper to a series of empirical tests, each motivated by
the same question: Does ideological identification affect presidential voting? In the concluding
section, we gather together the various results and draw out their implications for the broader debate
over the nature of ideology in mass publics.
THE MEANING OF IDEOLOGICAL IDENTIFICATION
According to Webster’s, identification is a “psychological orientation of the self in regard to
something (as a person or group) with a resulting feeling of close emotional association.”
Ideological, derived from ideology, refers to “the integrated assertions, theories, and aims that
4
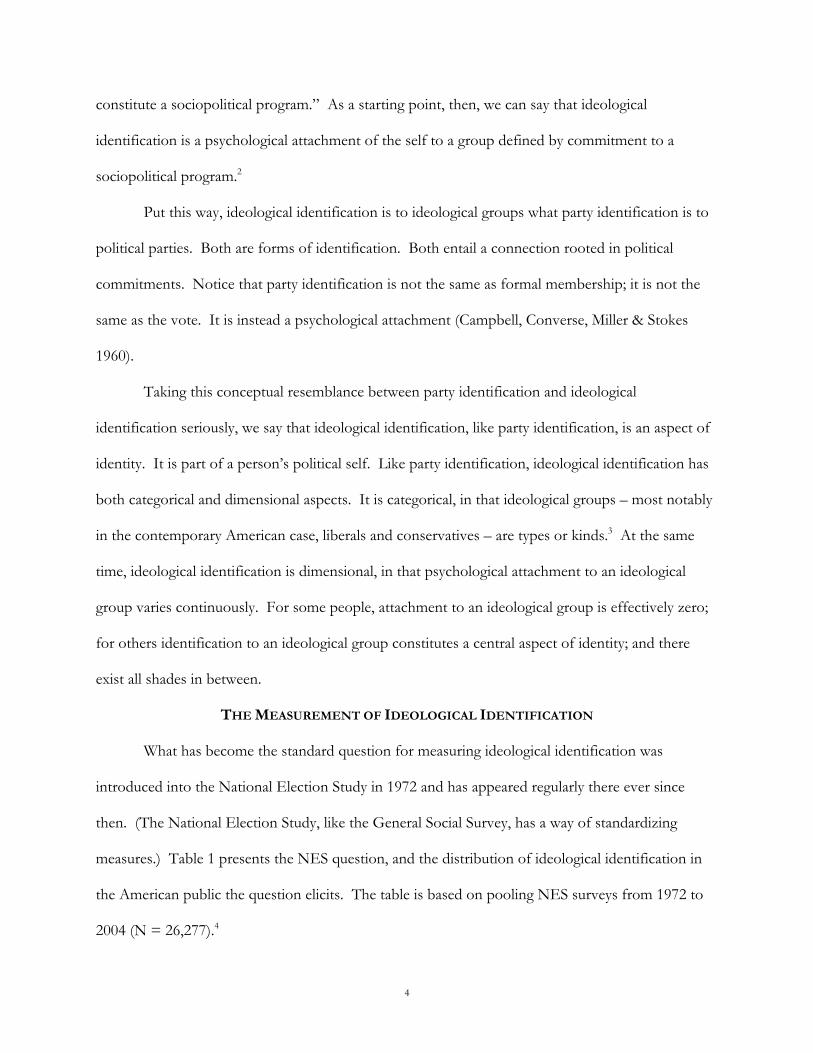
constitute a sociopolitical program.” As a starting point, then, we can say that ideological
identification is a psychological attachment of the self to a group defined by commitment to a
sociopolitical program.2
Put this way, ideological identification is to ideological groups what party identification is to
political parties. Both are forms of identification. Both entail a connection rooted in political
commitments. Notice that party identification is not the same as formal membership; it is not the
same as the vote. It is instead a psychological attachment (Campbell, Converse, Miller & Stokes
1960).
Taking this conceptual resemblance between party identification and ideological
identification seriously, we say that ideological identification, like party identification, is an aspect of
identity. It is part of a person’s political self. Like party identification, ideological identification has
both categorical and dimensional aspects. It is categorical, in that ideological groups – most notably
in the contemporary American case, liberals and conservatives – are types or kinds.3 At the same
time, ideological identification is dimensional, in that psychological attachment to an ideological
group varies continuously. For some people, attachment to an ideological group is effectively zero;
for others identification to an ideological group constitutes a central aspect of identity; and there
exist all shades in between.
THE MEASUREMENT OF IDEOLOGICAL IDENTIFICATION
What has become the standard question for measuring ideological identification was
introduced into the National Election Study in 1972 and has appeared regularly there ever since
then. (The National Election Study, like the General Social Survey, has a way of standardizing
measures.) Table 1 presents the NES question, and the distribution of ideological identification in
the American public the question elicits. The table is based on pooling NES surveys from 1972 to
2004 (N = 26,277).4

5
Table 1 Ideological Identification in the American Public
1972-2004 The first thing to notice there is the displacement of the distribution to the right. At every
step out from the center, conservatives outnumber liberals. Perhaps more striking is how quickly
the categories thin out from the middle. Ideological identification is not for everyone. Far from it.
When offered the opportunity, many Americans say that they do not think of themselves as liberals
or as conservatives. In National Election Studies carried out between 1972 and 2004, 27.1% opt out
of identifying themselves in ideological terms. Moreover, among those who claim an identification,
more than one-third – 34.8% to be exact – select the exact mid-point of the scale.” Ideological
moderation is the rule. 5
CAUSAL MECHANISMS
Ideological identification and presidential voting are correlated. In the postwar period, self-
described liberals tend to vote for the Democratic candidate; self-described conservatives tend to
vote for the Republican (e.g., Jost 2006; Knight 1985; Levitin & Miller 1979; Miller & Shanks 1996).
The question we raise here is whether it is reasonable to interpret this empirical regularity in causal
terms. To what extent can we say that ideological identification explains presidential voting?
In our view, explanation requires specification of causal mechanism. It is not enough to
establish an empirical relationship. It is not enough to rule out alternative explanations.
Explanation also requires specifying the causal mechanism (or mechanisms) that can account for the
relationship (Elster 1989).
In the case before us here, two mechanisms seem likely candidates to account for the
relationship between ideological identification and presidential voting. Both depend on the analogy
between ideological identification and party identification. In The American Voter, Angus Campbell
and his colleagues argued that the vote decision “depends in an immediate sense on the strength and

6
direction of the elements comprising a field of psychological forces, where these elements are
interpreted as attitudes toward the perceived objects of national politics” (1960, p. 9). In turn,
attitudes toward the perceived objects of national politics – the Democratic candidate, the
Republican candidate, the performance of government, and the issues of the day – were powerfully
influenced by party identification. Most Americans thought of themselves as Democrats or as
Republicans, and these attachments affected the vote by first affecting attitudes toward the
fundamental elements of national politics.
What is the mechanism by which party identification influences attitudes toward candidates,
government, and issues? One possibility is selective perception: “for most people the tie between party
identification and voting behavior involves subtle processes of perceptual adjustment by which the
individual assembles an image of current politics consistent with his partisan allegiance” (Stokes
1966, p. 127). Empirical tests generally validate Stokes’s conjecture. Evidence shows party
identification to be a pervasive dynamic force shaping voters’ perceptions of key elements of the
political world (e.g., Bartels 2002; Berelson et al., 1954; Jacoby 1988; Markus 1982; for a contrary
view, see Gerber and Green 1999). Insofar as ideological identification operates the way that party
identification does, selective perception may likewise account for the well-documented relationship
between ideological identification and presidential voting. If liberals and conservatives see the
political world differently – legal access to abortion as either a woman’s right to control her own
body or as government violating the rights of the unborn – they will be inclined to end up voting
differently.
A second possible causal mechanism underlying the power of partisanship and perhaps, by
extension, ideological identification as well, is category-based reasoning. In contemporary cognitive
science, categories are indispensable (Holyoak & Morrison 2005; Margolis & Laurence 1999). In
their absence,

7
… mental life would be chaotic. If we perceived each entity as unique, we would be overwhelmed by the sheer diversity of what we experience and unable to remember more than a minute fraction of what we encounter. And if each individual entity needed a distinct name, our language would be staggeringly complex, and communication virtually impossible. Fortunately, though, we do not perceive, remember, and talk about each object and event as unique, but rather as an instance of a class or object that we already know something about (Smith & Medin 1981, p. 1).
Think of “Democrat” and “Republican” as mental categories. When voters recognize a
particular candidate as belonging to one category or the other, they automatically infer important
things about that candidate. Perhaps more important, they automatically invest the candidate with
the affect they feel for the category in general. Category-based reasoning is an instance of what
Robert Abelson once called “hot cognition”: reasoning is motivated and categories are laden with
affect (Abelson 1963). Here is the way Angus Campbell and his colleagues put this point, working
without benefit of the cognitive revolution that was still to come:
The fact that most elements of national politics are far removed from the world of the common citizen forces the individual to depend on sources of information from which he may learn indirectly what he cannot know as a matter of direct experience. Moreover, the complexities of politics and government increase the importance of having relatively simple cues to evaluate what cannot be matters of personal knowledge. In the competition of voices reaching the individual the political party is an opinion-forming agency of great importance (p. 128).6
Insofar as ideological identification operates the way that party identification does, category-
based reasoning may account for the relationship between ideological identification and presidential
voting (Jacoby 1991). Crucial to this process is recognition. If a presidential candidate is recognized
as a liberal, voters who by their own definition are liberal will immediately believe things and feel
things about the candidate. Beliefs and feelings that are part of the general category are recruited to
the particular case. The process works just the same for conservative candidates and conservative
voters. Liberals and conservatives may vote differently for categorical reasons.

8
We now have in hand two mechanisms – selective perception and category-based reasoning
– that might plausibly account for the relationship between ideological identification and presidential
voting. This is good, but we should keep in mind going forward that they are plausible only to the
degree that the analogy between ideological identification and party identification holds up. That so
many Americans forego thinking of themselves in ideological terms is a reason for skepticism.
Selective perception increases with intensity of identification, but we have already seen that as far as
ideological identification is concerned, moderation is the rule.7 Category-based reasoning requires
voters to recognize a candidate as liberal or conservative, and there are good reasons, going back to
Converse (1964), to doubt whether many Americans are equipped to do this. It is time to look at
the evidence.
IDEOLOGICAL IDENTIFICATION AS AN EXPLANATION FOR PRESIDENTIAL VOTING We do not question that ideological identification and presidential voting are correlated. On
this point, the evidence is overwhelming (e.g., Jost 2006; Knight 1985). The question we raise here
is whether it is reasonable to interpret this relationship as causal. And in estimating the causal
impact of ideological identification, we presume that panel data are best: that is, we explain vote at
time t as a consequence of ideological identification (and other factors) at time t-1. Bartels (2000)
shows that cross-sectional models exaggerate the effect on vote due to party identification. The
same is likely to be true for ideological identification.
The panel requirement leads us to three cases: 1976 (Carter versus Ford), 1980 (Reagan
versus Carter), and 1996 (Dole versus Clinton). In the 1976 and 1996 contests, ideological
identification is assessed two years before, at the time of the mid-term elections; in the 1980 case,
ideological identification is assessed in January of the election year, just as the primary season is
getting underway. In all three instances, vote is measured immediately after the election.

9
In the standard model, presidential voting is a product of party identification, judgments of
the incumbent party’s economic performance, and opinions on the major issues of the day, written
so:
Votei,t = β0 + β1Partisanshipi,t-1 + β2Incumbent Economic Performancei,t + β3Views on Policyi,t-1 + ε [1]
Here, Votei,t is respondent i’s reported vote, coded 1 if for the incumbent party and 0 if for
the out-party (only Democratic and Republican votes are counted). Partisanshipi,t-1 is based on the
canonical question, coded from -1 (Strong Democrat) to +1 (Strong Republican). Incumbent
Economic Performancei,t = -1 if economic conditions have gotten much worse during the election
year (in i’s judgment); 0 if economic conditions have not changed; and = +1 if economic conditions
have gotten much better. And Views on Policyi,t-1 is based on i’s average response to a standard set
of four issue questions: -1 means extreme right; 0 means neither right nor left; and +1 means
extreme left.8 We estimate the model with probit regression, separately for each of the three
elections. Table 2 presents the results.
Table 2 Ideological Identification and Voting for President
As shown there, the standard model yields standard results. In Table 2 we see a huge effect
of party identification; a sizable effect due to the economy (the incumbent party does better when
economic conditions are seen as improving); and a significant effect of policy (voters who prefer
more government spending on services and less spending on defense tend to vote Democratic). For
students of presidential voting, this is utterly familiar.
To estimate whatever effect ideological identification might have on presidential voting, we
simply added ideological identification to the standard model:
Votei,t = β0 + β1Partisanshipi,t-1 + β2Incumbent Economic Performancei,t + β3Views on Policyi,t-1 + β4Ideological Identificationi,t-1 + ε [2]
10
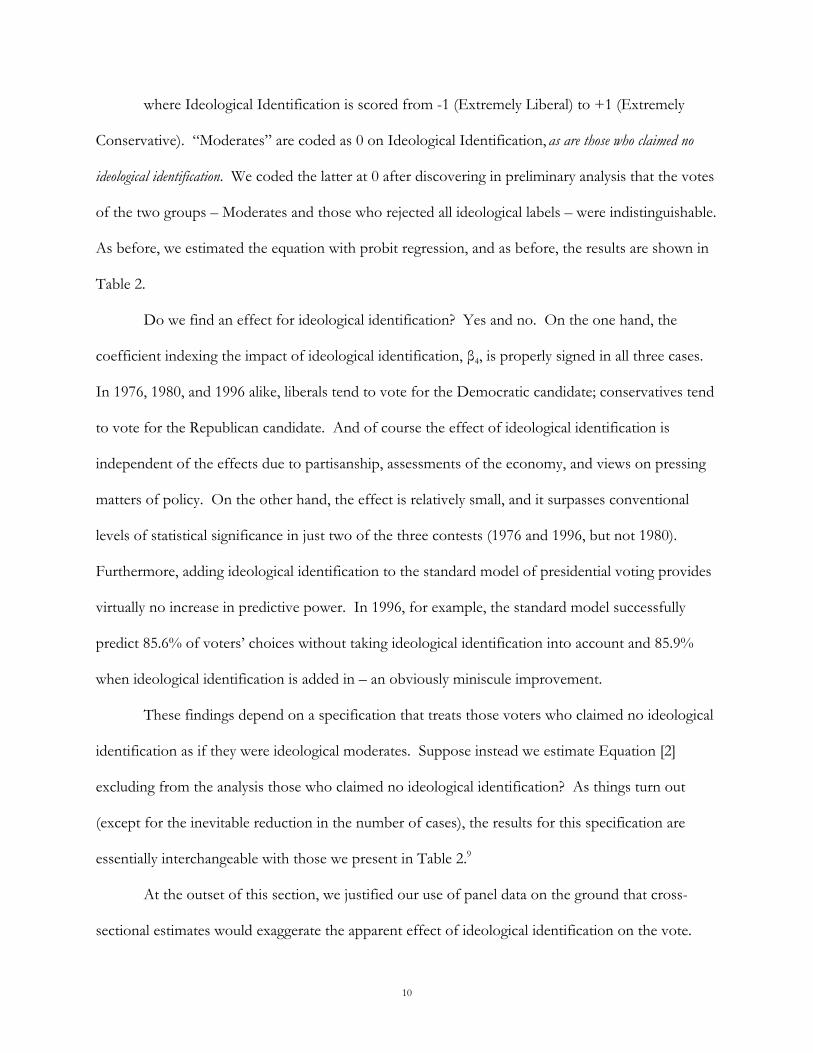
where Ideological Identification is scored from -1 (Extremely Liberal) to +1 (Extremely
Conservative). “Moderates” are coded as 0 on Ideological Identification, as are those who claimed no
ideological identification. We coded the latter at 0 after discovering in preliminary analysis that the votes
of the two groups – Moderates and those who rejected all ideological labels – were indistinguishable.
As before, we estimated the equation with probit regression, and as before, the results are shown in
Table 2.
Do we find an effect for ideological identification? Yes and no. On the one hand, the
coefficient indexing the impact of ideological identification, β4, is properly signed in all three cases.
In 1976, 1980, and 1996 alike, liberals tend to vote for the Democratic candidate; conservatives tend
to vote for the Republican candidate. And of course the effect of ideological identification is
independent of the effects due to partisanship, assessments of the economy, and views on pressing
matters of policy. On the other hand, the effect is relatively small, and it surpasses conventional
levels of statistical significance in just two of the three contests (1976 and 1996, but not 1980).
Furthermore, adding ideological identification to the standard model of presidential voting provides
virtually no increase in predictive power. In 1996, for example, the standard model successfully
predict 85.6% of voters’ choices without taking ideological identification into account and 85.9%
when ideological identification is added in – an obviously miniscule improvement.
These findings depend on a specification that treats those voters who claimed no ideological
identification as if they were ideological moderates. Suppose instead we estimate Equation [2]
excluding from the analysis those who claimed no ideological identification? As things turn out
(except for the inevitable reduction in the number of cases), the results for this specification are
essentially interchangeable with those we present in Table 2.9
At the outset of this section, we justified our use of panel data on the ground that cross-
sectional estimates would exaggerate the apparent effect of ideological identification on the vote.

11
This seems to be so. We estimated Equation [2] using the 1976, 1980, and 1996 NES cross-section
studies. All variables were measured and scored as before. In each case, the cross-sectional estimate
for the effect of ideological identification on presidential voting substantially exceeds the panel
estimate reported in Table 2 (in 1976, .68 versus .47; in 1980, .53 versus .25; in 1996, -1.25 versus
-.66). Because the effect of ideological identification is typically estimated with cross-sectional data,
typical results exaggerate ideological identification’s potency. Properly estimated, the effect of
ideological identification on presidential voting is small.
IDEOLOGICAL IDENTIFICATION VERSUS PARTY IDENTIFICATION We began our paper by noting the resemblance between ideological identification and party
identification. They are conceptual cousins, we said, and should be thought about in that way. But
as an empirical matter, they differ from each other in important ways as well, and these differences
need to be taken into account when comparing their effects on voting.
Figure 1 presents the distribution of both ideological identification and party identification,
based on pooling National Election Study surveys from 1972 to 2004, with non-respondents
included in the middle. As shown there, the two are distributed very differently. Ideological
identification generally follows a dramatic version of the bell-shaped curve, with a tall, narrow spike
at the center. When asked to identify themselves in ideological terms, a decisive majority of
Americans either reject the terms altogether or embrace moderation. Extreme categories, on the left
or on the right, are thinly populated. In contrast, the distribution of partisanship more closely
resembles a box than a bell. Strong partisans are plentiful, even more common than Independents
(and only a tiny handful fail to describe themselves in partisan terms). These are strong differences,
and we need to take them into account in our assessment of the relative importance of ideological
and partisan voting.
Figure 1 The Distribution of Ideological Identification and Party Identification

12
in the American Public In order to do so, we make use of a procedure introduced by Bartels (2000) in his analysis of
the decline and revival of partisanship. We want to estimate ideological and partisan voting in a way
that incorporates both the effect on voting of distinct types of ideological identification and
partisanship and the relative size of each type. First we code ideological identification into three
variables: “Extreme”: -1 if extreme liberal, +1 if extreme conservative, and 0 for all other voters;
“Average”: -1 if average liberal, +1 if average conservative, and 0 for all other voters; and “Slight”: -
1 if slight liberal, +1 if slight conservative, and 0 for all other voters. (In each instance, those coded
as 0 include moderates and those who claim no ideological identification at all.) Then we do the
same for partisanship. “Strong” partisanship is coded -1 for Strong Democrats, +1 for Strong
Republicans, and 0 for all others; “Weak” partisanship is coded -1 for weak Democrats, +1 for weak
Republicans, and 0 for all others; and “Leaning” partisanship is coded -1 for leaning Democrats, +1
for leaning Republicans, and 0 for all other voters. (To parallel ideological voting, those coded as 0
include “pure” Independents as well as those few who claimed no partisan identification at all.)
Then we include both sets of variables – one set representing ideological voting, the other
set representing partisan voting – in the standard presidential vote model:
Votei,t = β0 + β1Extreme Ideological Identificationi,t-1 + β2Average Ideological Identificationi,t-1 + β3Slight Ideological Identificationi,t-1 + β4Strong Partisansi,t-1 + β5Weak Partisansi,t-1 + β6Leaning Partisansi,t-1 + β7Incumbent Economic Performancei,t + β8Views on Policyi,t-1 + ε [3]
with all other variables measured and coded as before. In this set-up, the intercept reflects
the baseline vote: that is, the vote cast by those who are neither partisans nor ideologues, who see no
change in the economy, and who are at the exact center of disputes over policy. The coefficients for
Extreme Ideological Identification, Average Ideological Identification, and Slight Ideological
Identification reflect the degree to which the choices of voters with these types of ideological
commitments depart from the baseline. And likewise for Strong, Weak, and Leaning Partisans.

13
Table 3 summarizes the probit results, again for each of three presidential elections
separately. We expected the effects associated with party and ideological identification to be most
pronounced among those at the extremes (strong Democrats and strong Republicans, extreme
liberals and extreme conservatives) and least pronounced among those close to the center (leaning
Democrats and leaning Republicans, slight liberals and slight conservatives). As Table 3 reveals, this
expectation was handsomely confirmed for partisanship but not for ideology.
Table 3 Ideological Identification, Party Identification, and Voting for President
To summarize the electoral effect of ideological identification (again, following Bartels
2000), we calculate the average of these probit estimates – one for extreme, one for average, and one
for slight – weighting each by the proportion of the electorate in the corresponding ideological type.
For the electoral effect of partisan identification, the computation follows in exactly the same way.
Put together in this manner, the two summary measures are sensitive both to the effect of
ideological and partisan attachments on the vote (shown in Table 3) and the proportion of
ideological and party identifiers of various types in the electorate. Estimates of ideological and
partisan voting for each of the three presidential elections are presented in Table 4.10
Table 4 Ideological and Partisan Voting in Presidential Elections
The principal result shown there is how dramatically party identification dominates
ideological identification in explaining the vote. There are two reasons for this. The first has to do
with the greater potency of partisanship. When it comes to presidential voting, identifying with a
political party is a more consequential commitment than is identifying with an ideological program.
The second has to do with contrasts in distribution. To put it in a stylized way, the American
political landscape is at once strongly partisan and ideologically moderate.
IDEOLOGICAL IDENTIFICATION AND POLITICAL ENGAGEMENT

14
Mass publics are characterized by huge inequalities in political knowledge. Huge inequalities.
Converse (1964, 1990) uses words like “staggering” and “astronomical” to describe the difference
between elite and everyday command of political information, and his analysis of belief systems
turns on this point.
In an earlier paper (Kinder & Kalmoe 2008), we found that the nature of ideological
identification varies qualitatively as a consequence of variation in a person’s general investment in
political life. The propensity to claim an ideological identity; the consistency of ideological
identification; the over-time continuity of ideological identification: all increase dramatically with
increasing knowledge about politics. We went so far as to suggest that differences in ideological
identification associated with differences in the richness of knowledge people bring to politics are
differences of kind. Consistent with these results, we expect the effect of ideological identification on
presidential voting to diminish precipitously with declines in political information (cf., Jacoby 1991;
Knight 1985; Sniderman, Brody & Tetlock 1991).
At the same time, we do not expect to find information playing a similar moderating role for
party identification. Everyone, more or less, is at least acquainted with the two major political
parties. Voters don’t have to be experts to know about the Democrats and the Republicans; they are
regularly, nearly continuously, reminded of the place of partisanship in American politics. Ideology,
on the other hand, does require expertise – political expertise, just what many voters lack.
To test the role of information in ideological and partisan voting, we make use of a judgment
made by NES interviewers. At the conclusion of each interview, NES interviewers are asked to
classify each respondent’s “general level of information about politics and public affairs” into one of
five categories: very low, fairly low, average, fairly high, and very high. This simple rating turns out
to be, perhaps surprisingly, a highly reliable and extremely useful measure of information (Zaller
1985, 1992; Bartels 1996), and we take advantage of it here.11
15
To estimate the moderating role of political information, we create two interaction terms and
drop them into our standard model of presidential voting (along with the main effect of
information):
Votei,t = β0 + β1Partisanshipi,t-1 + β2Incumbent Economic Performancei,t + β3Views on Policyi,t-1 + β4Ideological Identificationi,t-1 + β5Political Informationi,t-1 + β6[Partisanshipi,t-1 x Informationi,t-1] + β7[Ideological Identificationi,t-1 x Informationi,t-1] + ε [4]
where Information is coded -1 (very low) to +1 (very high) and all other variables are
measured and scored as before.
Under this specification, we expect β6 = 0 and |β7|> 0; that is, we expect political
information to play no role in moderating party identification but a significant role in moderating the
effect of ideological identification. The results, presented in Table 5, conform to expectations. The
effect of party identification is strong, and it is strong without regard to the volume of political
information voters command. In contrast, the effect of ideological identification is modest on
average and – the crucial point here – heavily dependent on information. In 1976, 1980, and 1996
alike, the interaction between ideological identification and political information is significant.
Table 5 Ideological and Partisan Voting in Presidential Elections
By Levels of Political Information
The precise nature of the interaction between ideological identification and political
information is spelled out in Table 6. There we present the estimated effect of ideological
identification on the vote at three levels of information: low (-0.50 on the -1 to +1 rating scale),
average (0), and high (0.50). For purposes of comparison, we provide the corresponding estimates
for partisan identification as well.
Table 6 Ideological and Partisan Voting in the 1976 and 1996 Presidential Elections
By Levels of Political Information

16
As Table 6 indicates, party identification is a powerful determinant of the vote – for the
poorly-informed, for the well-informed, and for those in between. Information has no moderating
effect on partisan identification. The story is completely different for ideological identification.
Table 6 suggests that ideological identification has no effect on presidential voting among the
relatively poorly-informed, and only a modest effect among the average-informed (if indeed there is
any effect at all). Ideological identification contributes appreciably to presidential voting only among
the relatively well-informed. According to these results, ideological voting requires a certain level of
engagement in politics, a threshold that many voters fail to cross.
CONCLUSIONS
In a famous and influential essay, Philip Converse (1964) concluded that most Americans are
innocent of ideology: indifferent to standard ideological concepts, lacking a consistent outlook on
public policy, in possession of real opinions on only some issues of the day, and knowing precious
little. Against this, when asked directly, many American are quite willing to describe themselves in
ideological terms. The purpose of our paper has been to reconcile the results on ideological
identification with the broad and otherwise well-supported claim of ideological innocence. Here we
assessed the consequences of ideological identification, focusing on voting in presidential elections in
particular. We find that, properly estimated, ideological identification has a small effect on the vote;
that this effect pales in comparison to the effects due to other standard ingredients of electoral
choice, especially party identification; and that, absent considerable interest in politics, ideological
identification plays no role at all. All things considered, the findings for ideological identification fit
quite comfortably with the original and broad claim of ideological innocence.12
Of course, we have examined only presidential elections (and only a small number of those).
Of all American electoral contests, ideological terminology is surely most common in presidential
races. Moreover, presidential elections are high-stimulus elections. In 2008, Obama and McCain

17
together spent roughly one billion dollars campaigning. If ideological identification is going to
matter to voting anywhere, it should matter in presidential elections.
More generally, we expect the effect of ideological identification to depend on
circumstances. Roughly-speaking, the role played by ideological identification should increase with
the prominence of ideological discourse in the campaign and with clarity of the ideological
differences provided by the rival candidates. This leads to a set of testable propositions: that
ideological identification should matter more in some presidential elections (e.g., 1964, 1972) than in
others; more at the end of presidential campaigns than at the beginning; and more in presidential
elections than in other kinds of contests (Presidential > Senate > House). We intend to expand our
empirical testing along these lines.
Another step we expect to take is to move our testing beyond voting. Do liberals and
conservatives differ generally in their views of political life: in the political problems they worry
about; in the assessments they offer of the health of the nation; in the opinions they take on matters
of public policy? Do they differ because of differences in their ideological identification? We don’t
know, but we aim to find out.
Throughout our analysis, we have supplied a comparison between ideological identification
and its conceptual cousin, party identification. At every juncture, the evidence favored the latter at
the expense of the former. Americans are much more likely to think of themselves as partisan than
as ideological. When it comes to presidential voting, identifying with a political party is a more
consequential commitment than is identifying with an ideological program. Party identification
powerfully influences the vote regardless of the voter’s engagement in politics; ideological
identification influences the vote only among voters who are substantially engaged in political life.
These sharp differences are a reflection, we suggest, of the broader American political
landscape. A conspicuous and persistent feature of American politics is a stable two-party system.

18
Political parties are actual entities, with organizations, resources, buildings, employees, and, so-to-
speak, large megaphones. Campaigns are organized by Democrats and Republicans; conventions are
held by Democrats and Republicans; and candidates run for office as Democrats and Republicans.
The basic language of partisanship – Democrat, Republican – pervades political discourse. And in
the American system, citizens are regularly offered the opportunity to act on their partisanship: to
vote, argue, work on a campaign, give money, register, show up at a rally, and more. Such
behavioral commitments reinforce and strengthen psychological attachment to a party (Markus &
Converse 1979; Jennings & Markus 1984).
Things are very different for ideological identification. Recall that the standard ideological
identification question begins: “We hear a lot of talk these days about liberals and conservatives.”
Well, do we hear a lot of talk these days about liberals and conservatives? Not really. There is no
stable two-ideology system. Even if so inclined, a voter cannot cast a ballot for the Liberal Party or
the Conservative Party (except from occasional precincts in upstate New York). Liberalism and
conservatism belong almost entirely to the realm of ideas. This makes liberalism and conservatism
fair game for intellectual historians – how FDR “invented” liberalism, say, or how classic liberalism
has managed to claim the intellectual center of the contemporary American conservative movement
– but rather less helpful to ordinary citizens trying to follow, not all that determinedly, what is going
on in political life.
This brings us to the broader debate on ideological capacity. The great majority of
Americans come to politics without an ideological axe to grind. Most have no acquaintance with and
little interest in political philosophy. Their opinions appear haphazard: some are liberal, some
conservative, and some, when examined closely, seem not to be opinions at all. Most Americans
know little about what is happening in politics and even less about why. This, to a first
approximation, is the unsettling conclusion reached by Philip Converse (1964) in his famous essay

19
on belief systems. So far, we see little in the evidence on ideological identification to disturb these
claims.

20
FIGURE 1 DISTRIBUTION OF IDEOLOGICAL IDENTIFICATION
AND PARTY IDENTIFICATION IN THE AMERICAN PUBLIC
010
2030
4050
60Pe
rcen
t
1 2 3 4 5 6 7Party Identification
Source: 1972-2004 American National Election Study (ANES).
010
2030
4050
60P
erce
nt
1 2 3 4 5 6 7Ideological Identification

21
TABLE 1 IDEOLOGICAL IDENTIFICATION IN THE AMERICAN PUBLIC
Identification Percentage N Extremely Liberal 1.4 372 Liberal 6.8 1,773 Slightly Liberal 8.6 2,258 Moderate, middle of the road 23.6 6,206 Slightly Conservative 13.3 3,501 Conservative 12.1 3,179 Extremely Conservative 2.1 540 Don’t Know/Haven’t Thought Much about It 27.1 7,111 NA 5.1 1,337 Total 100.1 26,277 Source: 1972-2004 American National Election Study (ANES), Cumulative File.
QUESTION WORDING
We hear a lot of talk these days about liberals and conservatives. Here is a 7-point scale on which the political views that people might hold are arrayed from extremely liberal to extremely conservative.
Respondent is handed a card with a visual representation of the scale, with each of 7 points labeled.
Where would you place yourself on this scale, or haven’t you thought much about this?

22
TABLE 2 IDEOLOGICAL IDENTIFICATION AND VOTING FOR PRESIDENT
1976 1980 1996 [1] [2] [1] [2] [1] [2]
Ideological Identification .47 (.13)
.25 (.21)
-.66 (.20)
Party Identification 1.06 (.07)
.99 (.07)
1.23 (.11)
1.22 (.12)
-1.47 (.11)
-1.34 (.12)
Economic Performance .32 (.05)
.33 (.05)
-.07 (.17)
-.07 (.17)
1.08 (.17)
1.05 (.17)
Views on Policy -.36 (.10)
-.26 (.10)
-.89 (.24)
-.84 (.24)
.98 (.22)
.83 (.23)
Intercept .04 (.05)
.03 (.05)
.32 (.17)
.30 (.17)
.20 (.08)
.29 (.09)
N 1007 1007 465 465 687 687 Pseudo R2 .26 .27 .30 .30 .51 .53 Percent Predicted 76.0 75.9 78.5 77.6 85.6 85.9
Note: Probit coefficients with standard errors in parentheses.
Source: 1974-1976 NES Panel; 1980 NES Panel; 1994-1996 NES Panel.

23
TABLE 3 IDEOLOGICAL IDENTIFICATION, PARTY IDENTIFICATION, AND VOTING FOR PRESIDENT
1976 1980 1996 Extreme Identifiers .89
(.36) .21
(.58) -.13 (.38)
Average Identifiers .22 (.10)
.26 (.18)
-.52 (.16)
Slight Identifiers .18 (.09)
-.03 (.14)
-.15 (.14)
Strong Partisans .99 (.10)
1.36 (.17)
-1.37 (.16)
Weak Partisans .63 (.08)
.70 (.11)
-.76 (.11)
Leaning Partisans .45 (.09)
.41 (.16)
-.73 (.13)
National Economy .33 (.05)
-.08 (.17)
1.05 (.17)
Views on Policy -.26 (.11)
-.85 (.25)
.81 (.23)
Intercept .03 (.05)
.30 (.17)
.30 (.09)
N 1015 466 687 Pseudo R2 .26 .30 .54
Note: Probit coefficients with standard errors in parentheses.
Source: 1974-1976 NES Panel; 1980 NES Panel; 1994-1996 NES Panel.

24
TABLE 4
IDEOLOGICAL AND PARTISAN VOTING IN PRESIDENTIAL ELECTIONS
1976 1980 1996 Ideological Voting .11
( ) .04 ( )
.20 ( )
Partisan Voting .58 ( )
.67 ( )
.85 ( )
Note: Weighted average probit coefficients, with jackknife standard errors in parentheses (still to come). Source: 1974-1976 NES Panel; 1980 NES Panel; 1994-1996 NES Panel.

25
TABLE 5 IDEOLOGICAL AND PARTISAN VOTING IN PRESIDENTIAL ELECTIONS
BY LEVELS OF POLITICAL INFORMATION
1976 1980 1996 Ideological Identification .27
(.14) -.10 (.27)
-.64 (.19)
Ideological Identification x Political Information .88 (.26)
1.30 (.50)
-.90 (.37)
Party Identification 1.00 (.08)
1.19 (.13)
-1.41 (.11)
Party Identification x Political Information .13 (.15)
.27 (.27)
-.07 (.22)
Political Information .21 (09)
.22 (.16)
-.02 (.07)
Intercept .12 (.05)
.48 (.08)
.39 (.14)
N 1021 466 740 Pseudo R2 .25 .29 .48
Note: Probit coefficients with standard errors in parentheses. Source: 1974-1976 NES Panel; 1980 NES Panel; 1994-1996 NES Panel.

26
TABLE 6 IDEOLOGICAL AND PARTISAN VOTING IN PRESIDENTIAL ELECTIONS
BY THREE LEVELS OF POLITICAL INFORMATION
1976 Information Level Low Medium High
Party Identification .94 1.00 1.06 Ideological Identification -.18 .26 .68
1980 Information Level Low Medium High
Party Identification 1.06 1.19 1.32 Ideological Identification -.75 -.10 .55
1996 Information Level Low Medium High
Party Identification -1.38 -1.41 -1.44 Ideological Identification -.20 -.65 -1.10
Note: Probit coefficients with standard errors in parentheses (still to come). Source: 1974-1976 NES Panel; 1980 NES Panel; 1994-1996 NES Panel.

27
REFERENCES
Abelson, Robert P. 1963. Computer simulation of “hot cognitions”. In Computer Simulation of Personality. eds. S. Tomkins, and S. Messick. New York: Wiley.
Bartels, Larry M. 1996. Uninformed votes: Information effects in presidential elections.
American Journal of Political Science 40:194-230. Bartels, Larry M. 2000. Partisanship and voting behavior, 1952-1996. American Journal of
Political Science 44:35-50. Bartels, Larry M. 2002. Beyond the running tally: Partisan bias in political perceptions.
Political Behavior 24:117-150. Berelson, Bernard R., Lazarsfeld, Paul F., and McPhee, William N. 1954. Voting: A Study of
Opinion Formation in a Presidential Campaign. Chicago: University of Chicago Press. Conover, Pamela Johnston and Feldman, Stanley. 1981. The Origins and Meanings of
Liberal/Conservative Self-Identifications. American Journal of Political Science 25:617-45.
Campbell, Angus, Converse, Philip E., Miller, Warren E., & Stokes, Donald E. 1960. The
American Voter. New York: Wiley. Converse, Philip E. 1964. The nature of belief systems in mass publics. In D. E. Apter (Ed.),
Ideology and Discontent. New York: Free Press. Converse, Philip E. 1990. “Popular Representation and the Distribution of Information.”
In Information and Democratic Processes, John A. Ferejohn and James H. Kuklinski (eds.). Urbana, IL: University of Illinois Press.
Converse, Philip E. 2000. Assessing the capacity of mass electorates. Annual review of political
science 3: 331-53. Converse, Philip E. 2007. Perspectives on mass belief systems and communication. In
Russell J. Dalton and Hans-Dieter Klingemann (editors), The Oxford Handbook of Political Behavior. New York: Oxford. Pp. 144-158.
Converse, Philip E. and Pierce, Roy. 1986. Political Representation in France. Cambridge, MA:
The Belknap Press, Harvard University. Dawson, Michael. 1994. Behind the Mule. Princeton: Princeton University Press. Elster, Jon. 1989. Nuts and Bolts for the Social Sciences. Cambridge, UK: Cambridge
University Press.

28
Ellis, Christopher and Stimson, James A. 2007. Pathways to ideology in American politics: the operational-symbolic “paradox” revisited. Unpublished manuscript, Bucknell University.
Holyoak, Keith J., and Morrison, Robert G. 2005. The Cambridge Handbook of Thinking and
Reasoning. Cambridge, UK: Cambridge University Press. Gerber, Alan, and Green, Donald. 1999. Misperceptions about perceptual bias. Annual
Review of Political Science 2:189-210. Jacoby, William G. 1988. The impact of party identification on issue attitudes. American
Journal of Political Science 32:643-661. Jacoby, William G. 1991. Ideological identification and issue attitudes. American Journal of
Political Science 35: 178-205. Jacoby, William G. 1995. The structure of ideological thinking in the American electorate.
American Journal of Political Science 39:314-335. Jennings, M. K., & Markus, Gregory B. 1984. Partisan orientations over the long haul:
Results from the three-wave political socialization panel study. American Political Science Review 78:1000-1018.
Jost, John T. 2006. The end of the end of ideology. American Psychologist 61:651-670. Kinder, Donald R. 1983. Diversity and complexity in American public opinion. In Ada
Finifter (Ed.), Political Science. The State of the Discipline. (pp. 391-401). Washington: APSA.
Kinder Donald R. 1998. Opinion and action in the realm of politics. In Handbook of Social
Psychology, fourth edition, ed. D Gilbert, S Fiske, G Lindsey. Boston: McGraw Hill. 778-867.
Kinder, Donald R. and Kalmoe, Nathan. 2008. The nature of ideological identification in
mass publics. Part I: Meaning and measurement. Paper delivered at the annual meeting of the American Political Science Association, Boston, August 30, 2008.
Kinder, Donald R. and Kalmoe, Nathan. 2009. The nature of ideological identification in
mass publics. Part II: Formation and Consolidation. Paper delivered at the annual meeting of the American Political Science Association, Annual Meeting of the American Political Science Association, Toronto, September 3-6, 2009.
Knight, Kathleen. 1985. Ideology in the 1980 Election: Ideological Sophistication Does
Matter. Journal of Politics 47: 828-853. Kuklinski, James H., and Peyton, Buddy. 2007. Belief systems and political decision-making.
In Russell J. Dalton and Hans-Dieter Klingemann (editors), The Oxford Handbook of Political Behavior. New York: Oxford. Pp. 45-64.

29
Levitin, Teresa A. and Miller, Warren E. 1979. Ideological Interpretations of Presidential
Elections. American Political Science Review 73(3): 751-771. Lewis-Beck, Michael, Jacoby, William G, Norpoth, Helmut, and Weisberg, Herbert F. 2008.
The American Voter Revisited. Ann Arbor, MI: University of Michigan Press. Lippmann, Walter. 1925. The Phantom Public. New York: Harcourt, Brace. Markus, Gregory B. 1982. Political attitudes during an election year: A report on the 1980
NES panel study. American Political Science Review 76:538-560. Markus, Gregory B., and Converse, Philip E. 1979. A dynamic simultaneous equation model
of electoral choice. American Political Science Review 73:1055-70. Margolis, Eric, and Laurence, Stephen (editors). 1999. Concepts. Cambridge, MA: MIT
Press. Miller, Warren E., & Shanks, J. Merrill. 1996. The New American Voter: Conflict and Consensus
in American Presidential Elections. Cambridge, MA: Harvard University Press. Plato. (1970-2) The Republic of Plato. (Francis MacDonald Cornford, Trans.). London:
Oxford University Press. Schumpeter, Joseph A. 1942. Capitalism, Socialism, and Democracy. New York: Harper and
Row. Smith, Ed, and Medin, Douglass. 1981. Concepts and Categories. Cambridge, MA: Harvard
University Press. Sniderman, Paul M., Brody, Richard A. & Tetlock, Philip E. 1991. Reasoning and Choice:
Explorations in Political Psychology. Cambridge: Cambridge University Press. Stokes, Donald E. 1966. Party loyalty and the likelihood of deviating elections. In A.
Campbell, P. E. Converse, W. E. Miller, & D. E. Stokes (Eds.), Elections and the Political Order. New York: Wiley.
Tate, Katherine. 1993. From Protest to Politics. Cambridge, MA: Harvard University Press. Zaller, John. 1985. Pre-testing information items on the 1985 NES Pilot Survey. Report to
the Board of Overseers, National Election Study, Ann Arbor, Michigan. Zaller, John. 1992. The Nature and Origin of Mass Opinion. Cambridge, UK: Cambridge
University Press.

30
NOTES
1 Notable exceptions include Conover and Feldman (1981); Kuklinski and Peyton (2007); Knight (1985); Lewis-Beck, Jacoby, Norpoth, and Weisberg (2008), not to mention Converse himself (2000, 2007). 2 More specifically, we mean Merriam Webster’s Collegiate Dictionary. 3 Which groups are featured in ideological identification is historically contingent and situationally specific. At different times and in different places, other ideological groups will hold sway. And even in the United States right now, liberalism and conservatism are not the only ideological types possibly commanding allegiance. 4 This question was introduced at the time of a fever of interest in 7-point issue scales. Two such scales were tried out in the 1968 NES (one on urban unrest, the other on Vietnam), and then nearly a score of them became part of the 1972 Study (and succeeding studies, for that matter). Included in this avalanche was the ideological identification question, formatted in 7-point style. Looking back on it, this was, perhaps, a mistake. The 7-point format presumes that a person’s position can be placed on a single continuous scale, anchored at both ends by extreme views. This may work for opinions on policy, but it may not be the most felicitous format for ideological identification. Still, in our first paper on the topic (Kinder & Kalmoe 2008), we found that the standard question does a more than respectable job in measuring ideological identification. Measured in this way, ideological identification predicts other views as it should; is uncorrelated with things it should not be associated with; and is reasonably consistent over time. 5 Is the middle a real position – or is it, as Converse and Pierce (1986) argued in their extensive study of “la gauche et la droite” among French voters, mainly a refuge for the indifferent and confused? Converse and Pierce find, as we do, large numbers of the public “flocking” to the ideological mid-point. In the French case, the middle is overrun by citizens not much interested in politics, unable to say what distinguishes the left from the right, and confused over where to place French political parties along an ideological continuum. An occasional true believer of the ideological center there may be, but the typical centrist, according to Converse and Pierce is “a person who is neutral, uncommitted, or even thoroughly indifferent to or ignorant about this generic axis of political dispute” (p. 128). Converse and Pierce conclude that insofar as political warfare in France takes ideological form, those who choose the ideological middle are “noncombatants” (Converse & Pierce 1986, p. 129; Levitin & Miller 1979). 6 And from Stokes:
To the average person, the affairs of government are remote and complex, and yet the average citizen is asked periodically to formulate opinions about these affairs. … In this dilemma, having the party symbol stamped on certain candidates, certain issue positions, certain interpretations of reality is of great psychological convenience (Stokes 1966, pp. 126-127).

31
7 As Campbell and his colleagues put it, “Identification with a party raises a perceptual screen through which the individual tends to see what is favorable to his partisan orientation. The stronger the party bond, the more exaggerated the process of selection and perceptual distortion will be” (Campbell et al. 1960, p. 133). 8 The Views on Policy scales for the 1980 and 1996 models incorporate four policy items central to contemporary political divisions – attitudes toward government services and spending, government’s role in jobs provision, aid to minorities, and defense spending. Each item is coded between -1 (most conservative) and 1 (most liberal). The items are summed, and then rescaled between -1 and 1. “Don’t know” responses are coded as moderate answers at 0. The 1976 model is constructed identically, but with two items rather than four – government jobs and aid to minorities – because the 1974 ANES does not include items for services/spending and defense spending. 9 You might think that those voters who are set aside in this analysis by virtue of not claiming any ideological identification would turn out to be haphazard in their electoral choices. This would be incorrect. Their choice cannot be predicted by their ideological identification, of course, as they have none, but their choice can be predicted – and quite nicely – by the standard model, with party identification doing most of the work. 10 Here’s how we do this. The first three rows of the first column of Table 3 present the estimates of the effects of ideological identification on presidential voting in 1976. The estimated effects are .89 for “extreme” ideological identifiers, .22 for “average” ideological identifier, and .18 for “slight” ideological identifiers. Multiplying these estimated effects by the corresponding proportions of the electorate in each of the three ideological identification types (.03 for extreme ideological identifiers, .21 for average ideological identifiers, and .23 for slight ideological identifiers) yields an average probit coefficient of: [(.03 x .89) + (.21 x .22) + (.23 x .18)] = .11. This is the summary measure of ideological voting in the 1976 presidential election. It appears along with the other summary measures in Table 4. 11 Another advantage of the interviewer rating is that it is reasonable to regard it as a roughly comparable measure over time. 12 It is rather late for a confession, but here one comes. The results we present here have excluded black voters. Why? Since 1964, blacks have voted overwhelmingly for the Democratic candidate. In the three elections we examined, the Democratic candidate took more than 85% of the black vote in each case. It seemed unlikely to us that variation in the black vote, how little of it there is, could be explained by variation in ideological identification (Dawson 1995; Tate 1993). In fact, when we estimated Equation [2] for black voters alone, we found this to be so. Whatever role ideological identification plays in the explanation of presidential voting, it does not extend to African Americans. This is another mark against the claim that ideological identification deserves a place in the standard model of presidential elections.