THE NATURAL TERRAIN LANDSLIDE STUDY PHASES I AND II · The Natural Terrain Landslide Study (NTLS)...
129
THE NATURAL TERRAIN LANDSLIDE STUDY PHASES I AND II GEO REPORT No. 73 N.C. Evans, S.W. Huang & J.P. King GEOTECHNICAL ENGINEERING OFFICE CIVIL ENGINEERING DEPARTMENT THE GOVERNMENT OF THE HONG KONG SPECIAL ADMINISTRATIVE REGION
Transcript of THE NATURAL TERRAIN LANDSLIDE STUDY PHASES I AND II · The Natural Terrain Landslide Study (NTLS)...
THE NATURAL TERRAIN LANDSLIDE STUDY
PHASES I AND II
GEO REPORT No. 73
N.C. Evans, S.W. Huang & J.P. King
GEOTECHNICAL ENGINEERING OFFICE
CIVIL ENGINEERING DEPARTMENT
THE GOVERNMENT OF THE HONG KONG
SPECIAL ADMINISTRATIVE REGION

THE NATURAL TERRAIN LANDSLIDE STUDY PHASES I AND II
GEO REPORT No. 73
N.C. Evans, S.W. Huang & J.P. King
This report was originally produced in June 1997 as GEO Special Project Report No. SPR 5/97

- 2 -
© The Government of the Hong Kong Special Administrative Region
First published, May 1999
Prepared by:
Geotechnical Engineering Office, Civil Engineering Department, Civil Engineering Building, 101 Princess Margaret Road, Homantin, Kowloon, Hong Kong.
This publication is available from:
Government Publications Centre, Ground Floor, Low Block, Queensway Government Offices, 66 Queensway, Hong Kong.
Overseas orders should be placed with:
Publications Sales Section, Information Services Department, Room 402, 4th Floor, Murray Building, Garden Road, Central, Hong Kong.
Price in Hong Kong: HK$308 Price overseas: US$45 (including surface postage)
An additional bank charge of HK$50 or US$6.50 is required per cheque made in currencies other than Hong Kong dollars.
Cheques, bank drafts or money orders must be made payable to The Government of the Hong Kong Special Administrative Region
- 3 -
PREFACE
In keeping with our policy of releasing information which may be of general interest to the geotechnical profession and the public, we make available selected internal reports in a series of publications termed the GEO Report series. A charge is made to cover the cost of printing.
The Geotechnical Engineering Office also publishes guidance documents as GEO Publications. These publications and the GEO Reports may be obtained from the Government’s Information Services Department. Information on how to purchase these documents is given on the last page of this report.
R.K.S. Chan Head, Geotechnical Engineering Office
May 1999
- 4 -
FOREWORD
The Natural Terrain Landslide Study (NTLS) is part of a series of integrated GEO studies of the risks associated with natural terrain in Hong Kong. The aims of the NTLS are to investigate the distribution, nature and probable causes of landsliding on natural terrain in Hong Kong and to assess the hazard from such events.
Phase I of the Study, which began in September 1995, comprised the establishment of an inventory of landslides on natural terrain, covering the whole of Hong Kong, based on the interpretation of high-level aerial photographs taken during the past 50 years. Digitisation of this inventory and the compilation and digitisation of other regional datasets was also completed during Phase I.
Phase II of the Study comprised the incorporation of the landslide inventory and the other datasets into a Geographic Information System (GIS), the analysis of these data to determine correlations between landslide distribution and possible causal factors, and a preliminary assessment of hazard. Additional work was carried out to determine correlations between rainfall and natural terrain landsliding, review methods for predicting landslide debris run-out distances and examine suitable types of landslide mitigation techniques.
This report describes the work undertaken during Phases I and II of the Study, presents some conclusions and discusses the implications for future work. The report was compiled by Nigel Evans. Jonathan King oversaw the establishment of the Natural Terrain Landslide Inventory (NTLI), carried out the analyses of landslide dimensions and long runout/mobile landslides, developed the preliminary proposals for hazard zoning against large debris flows and undertook the ground investigation at Sham Wat. Stephen Huang was responsible for the creation of the GIS and the management of GIS consultants. Willie Shum validated much of the digitised NTLI data. Clive Franks carried out the review of landslide mitigation measures and K.C. Lau reviewed methods of predicting landslide debris runout distance. Raynor Shaw, Diarmad Campbell and Rod Sewell provided geological and geomorphological advice, while Philip Kirk was primarily responsible for the digitisation and validation of geological data. Ken Ho of Special Projects Division wrote much of the section on quantitative risk assessment.
Messrs Hugh Choy, H.N. Wong, Stanley Au, Andy Hansen and Chris Fletcher acted as reviewers. Valuable advice and assistance was provided by Keith Emery and his colleagues from the New South Wales Department of Land and Water Conservation, who undertook the mapping work for the compilation of the NTLI. Mark Shaw proof read the report and finalised the figures, and the project was initiated and administered by Norman Woods.
(R.P. Martin) Chief Geotechnical Engineer/Planning

- 5 -
ABSTRACT
Most landslides on natural terrain in Hong Kong are shallow debris slides and flows with short runout distances. Such landslides are quite common, and occasionally develop into hazardous events with a long runout which can constitute a risk to developments downslope. Less common types of natural terrain slope instability in Hong Kong include deep-seated, slow movements.
The demand for land in Hong Kong means that there will be a continuing trend to develop areas close to steep natural slopes. In view of the hazard from natural terrain landslides there is a clear need to identify areas which may be particularly susceptible to these phenomena.
All natural terrain in Hong Kong has been surveyed using aerial photographs taken between 1945 and 1994, and data on over 25,000 visible natural terrain landslides have been collected. These data, together with information on geology, slope angle, geomorphology and vegetation have been entered into a Geographic Information System (GIS) in order to examine the spatial distribution of landslides with respect to these factors.
It appears that the underlying geology and the angle of slope are the most important parameters for determining natural terrain landslide susceptibility at the regional scale. Geological strata which appear to be particularly susceptible include rhyolitic and dacitic lavas, jointed tuffs, layered sequences of volcaniclastic rocks and lavas, and layered sedimentary sequences. The most susceptible slopes are generally those with angles of approximately 35° to 40°. The shape and aspect of a particular slope may also be useful in assessing susceptibility.
The approximate runout distance has been determined for nearly 9,000 landslides (the more recent events). Of these, 2.3% (204) have plan runout distances of more than 150m and 0.3% (34) have plan runout distances of more than 300m.
Data on natural terrain landslides for the period 1985 to 1994 have been compared with rainstorm intensity on a yearly basis. This has allowed the assessment of rainfall intensity thresholds for the onset of natural terrain landsliding. It appears that a rainfall event affecting perhaps 20% to 50% of Hong Kong and with the potential to trigger a high density (more than ten per square kilometre) of natural terrain landsliding in susceptible areas, can be expected, on average, every two years.
Occasional large landslides might have occurred in Hong Kong in the geological past, and investigations of some possible large landslide deposits are in progress.
A review of natural terrain landslide mitigation measures has been completed. There are a range of methods which could be applied in Hong Kong, ranging from the purely technical (the prevention or control of landslides) to the purely administrative (planning and development controls).
The analyses carried out to date have shown that susceptibility mapping is possible. This work is being progressed. Studies are also in hand to allow regional estimates of hazard to be made.

- 6 -
CONTENTS
Page No.
Title page 1
PREFACE 3
FOREWORD 4
ABSTRACT 5
CONTENTS 6
1. INTRODUCTION 9
2. STUDY METHODOLOGY 10
3. THE NATURAL TERRAIN LANDSLIDE INVENTORY (NTLI) 11
3.1 Compilation 11
3.2 Landslide Identification 12
3.3 Landslide Data 13
3.4 Recognition Factor Survey 14
3.5 Revegetation Survey 14
3.6 Limitations of the Data 15
3.7 Exceptional Landslides 16
3.8 Landslide Inventory Maps and Isopleth Maps 16
4. GEOGRAPHIC INFORMATION SYSTEM 17
5. ANALYSIS OF THE NTLI AND ASSOCIATED DATA 18
5.1 Methodology 18
5.2 Geomorphology 20
5.2.1 Geomorphological Setting 20
5.2.2 Landslide Distribution 21
5.2.3 Terrain Classification 22
5.3 Geology 23
5.4 Gullying 26
5.5 Slope Gradient 26
5.6 Elevation 27

- 7 -
Page No.
5.7 Aspect 28
5.8 Vegetation 28
5.9 Landslide Dimensions 29
5.10 Long Runout and Mobile Landslides 30
6. RAINFALL 31
6.1 Previous Work 31
6.2 Rainfall Return Periods 31
6.3 Correlation of Rainfall with Natural Terrain Landsliding 33
7. ASSESSMENT OF LANDSLIDE FREQUENCY 34
8. LANDSLIDE SUSCEPTIBILITY EVALUATION AND HAZARD ZONING 36
8.1 Landslide Susceptibility Evaluation 36
8.2 Susceptibility Mapping for the NTLS 37
8.3 Hazard Zoning 37
8.3.1 Hazard Zoning for Large Channelised Debris Flows 37
8.3.2 Landslide Runout Distance Modelling 38
8.4 Quantitative Risk Assessment 40
9. MITIGATION OF NATURAL TERRAIN LANDSLIDE HAZARDS 41
9.1 Active Mitigation Measures 41
9.1.1 Source Area 41
9.1.2 Debris Trail and Deposition Areas 42
9.1.3 Selection of Appropriate Active Measures 43
9.2 Passive Mitigation Measures 44
10. CONCLUSIONS 45
11. FURTHER WORK 46
12. REFERENCES 47
LIST OF TABLES 52
LIST OF FIGURES 78
LIST OF PLATES 109

- 8 -
Page No.
APPENDIX A : EXAMPLE MAP SHEET REPORT 123
LIST OF DRAWINGS 128

- 9 -
1. INTRODUCTION
Steep natural hillsides mantled with a layer of weak weathered rock and superficial deposits cover more than 60% of the total land area of Hong Kong. Given the frequent intense rainfall in Hong Kong, it is not surprising that landsliding on natural terrain is a common occurrence. To date, there have been no recorded incidents involving loss of life as a result of such landslides, and the economic damage associated with them has not been great. Nevertheless, landslides on natural slopes over the last few years have demonstrated that they do represent a hazard. For example, the 1.2km long debris flow in 1990 on the eastern slopes of Tsing Shan, above Tuen Mun New Town (King, 1996), reached the Area 19 platform below and could have had more serious consequences if this area had been developed. Similarly, the numerous landslides which occurred on the northern slopes of Pok To Yan, east of Tung Chung, in 1992 and 1993 (Franks, 1996) could have had more serious consequences if the size of the landslides had been somewhat larger and had the North Lantau Expressway been in operation or the developments at Tung Chung been at a more advanced stage.
The Geotechnical Manual for Slopes (Geotechnical Control Office, 1984) highlights the costly and difficult nature of natural slope stabilisation works, and concludes that avoidance is usually the best approach. However, the demand for land, including that required to meet future housing needs, is such that there will be a continuing trend to locate developments closer to areas of steep natural slopes.
A detailed study of all natural terrain in Hong Kong would be an enormous exercise and would be difficult to justify for sparsely populated areas where landsliding is unlikely to endanger lives or property. However, in view of the hazard from natural terrain landslides, there is a clear need to obtain a better understanding of where and why landsliding on natural terrain occurs, so that areas which may be particularly susceptible, and those which may need more detailed investigation, can be identified. Susceptibility mapping and hazard zoning at a regional scale will aid decision-making with respect to appropriate levels of investigation for specific areas.
The Geotechnical Engineering Office (GEO) began the Natural Terrain Landslide Study (NTLS) in early 1995. Phase I of the Study concentrated on establishing an inventory of landslides on natural terrain (the Natural Terrain Landslide Inventory, or NTLI), based on the interpretation of high-level aerial photographs taken over the past 50 years. Phase II of the Study has involved incorporation of the landslide inventory and other datasets into a Geographic Information System (GIS), preliminary analysis of landslide distribution as related to various environmental factors, examination of correlations between landslide distribution and rainfall, evaluation of methods for estimating landslide susceptibility and hazard, and a review of appropriate landslide mitigation measures.
This Report describes and discusses Phases I and II of the NTLS. The report is not intended to be a comprehensive description of natural terrain hazards in Hong Kong, but concentrates on the regional distribution of those features which are identifiable from high-level aerial photography. Phase III of the NTLS will principally involve regional hazard zoning for the commonest types of natural terrain landslides, together with detailed studies of some areas with a high incidence of landsliding. Additional work will be carried out to assess the possible hazards from some of the rarer types of natural terrain landslide.
- 10 -
2. STUDY METHODOLOGY
Phases I and II of the NTLS were principally concerned with establishing a valid foundation for landslide susceptibility and hazard mapping. An ideal hazard map should provide information on spatial and temporal probability, type, magnitude, velocity, runout distance and retrogression limit of the mass movements predicted in a given area (Soeters & van Westen, 1996). A variety of techniques is available for developing landslide hazard maps. The most straightforward initial approach to any study of regional landslide hazard is the compilation of a landslide inventory, and such inventories are the basis of most hazard zoning techniques. Inventory maps can be used by themselves as an elementary form of hazard map because they show the locations of recorded landslides. Landslide concentration can be shown on density maps, on which landslide isopleths are plotted. Landslide inventory and isopleth maps do not, however, identify areas which may be susceptible to landslides unless landslides have already occurred.
In geomorphic approaches the expert opinion of an experienced geomorphologist or engineering geologist is used to classify the hazard either directly in the field, or by using qualitative map combination techniques (assigning weighting values to a series of parameter maps which are then summed to give hazard values). The problems with all such methods relate to the reproducibility of results and to subjectivity in assigning weightings.
In statistical landslide hazard analyses the combinations of factors that have led to landslides in the past are determined statistically, and quantitative predictions are made for areas currently free of landslides but where similar conditions exist. In bivariate statistical analyses each factor map (such as topography, geology, vegetation etc) is combined with the landslide distribution map, and weighting values based on landslide densities are calculated for each parameter class. Procedures combining statistics with physical process evaluation are sometimes called “grey box” models. Multivariate statistical analysis models for landslide hazard zonation use data matrices and multiple regression or discriminant function techniques. These so-called “black box” models rely completely on statistical analysis, and selective criteria based on professional experience are not used.
Deterministic landslide hazard analyses, sometimes referred to as “white box” models, are based on slope stability analyses, and are only applicable when the ground conditions are fairly uniform across the study area and the landslide types are straightforward, known, and easy to analyse. The advantage of these models is that they permit quantitative safety factors to be calculated, while the main problem is the high degree of simplification that is usually necessary when anything larger than very small areas is considered.
Not all methods of landslide hazard zonation are equally applicable at different scales of analysis. Some techniques require very detailed input data, which can only be collected for small areas because of the required level of effort. When considering areas of approximately 100km2 to 1,000km2 at scales of 1:25,000 to 1:100,000 (a reasonable approximation to the Hong Kong situation), deterministic approaches are unlikely to be of use, while direct mapping geomorphic methods are impractical over large areas and do not support implementation of a hierarchical approach to hazard zonation. If geomorphic methods are to be used over large areas they should combine geomorphological analyses with parameters weighted by the application of simple statistics. Statistical methods are not appropriate for either very large or very small study areas. At present, the NTLS is concentrating on the “grey box” approach, i.e.
- 11 -
a combination of relatively simple statistics and physical process evaluation.
A distinction can be drawn between landslide susceptibility maps, which should show the probability of landslide initiation at a given location, and full landslide hazard maps, which should also describe the type of landslide, the anticipated direction and speed of debris movement, and the probable run-out distance. The production of landslide susceptibility and hazard maps for Hong Kong is discussed in Section 8.
3. THE NATURAL TERRAIN LANDSLIDE INVENTORY (NTLI)
3.1 Compilation
Compilation of the NTLI began in September 1995 and the inventory, which contains information on over 26,500 landslides, was completed in February 1996. The NTLI used the Lands Department 1:5,000-scale topographic maps of Hong Kong as a base. Ping Chau Island is not covered by this map series and a 1:5,000-scale map of this area was prepared from a 1987 aerial photograph, with infrastructure taken from the 1:20,000-scale topographic map.
The NTLI was compiled from the interpretation of high level aerial photographs (altitudes of over 10,000 feet with nominal scales of 1:20,000 to 1:40,000) taken in the years 1945, 1964 and 1972 to 1994 (with the exception of 1977). In any given year the photography may only have partly covered Hong Kong (particularly in 1945, 1972, 1980 and 1984), resulting in most areas being mapped using between 20 and 23 sets of photographs over the 50 year period. The aerial photographs used for each map sheet were recorded in a map sheet report. Any portion of a sheet not covered by photography, or obscured by cloud or terrain shadow, was marked on the map sheet. An example of an NTLI map and map sheet report is given in Appendix A, with definitions of the terminology used.
Areas without stereo coverage were excluded from the survey area if landslides could not be recognised due to poor resolution - this was a particular problem with the 1945 photographs. Generally poor resolution in the 1993 and 1994 photographs may also have reduced recognition of landslides in these years. Some 1995 photographs were interpreted for sheet 3SW-D to aid field checking (Table 1). Low level 1967 photographs were used for several map sheets on Hong Kong Island (Table 1) to help identify landslides resulting from the rainstorms of 1966. These landslides otherwise might not have been identified on the first subsequent set of high level photographs, which were not taken until 1974.
Only natural terrain was surveyed for landslides. Natural terrain was defined as terrain that has not been modified substantially by human activity, but includes areas where grazing, hill fires and deforestation may have occurred. Terrain modified substantially by human activity was taken to include agricultural terraces (Plate 1) and urban development. Modified terrain (defined as non-linear features greater than 1ha in area and linear features such as roads and catchwaters with their marginal cut and fill slopes more than 25m wide) was recorded on the map sheets for the years 1945, 1964, 1973, 1981, 1987 and 1994. Some areas modified by development were too small to record on the maps, and landslides within these areas would therefore have been categorised as occurring on natural terrain. Such landslides were marked on the maps but were not included in the inventory.
Areas of intense gully erosion occur in Hong Kong (Plate 2) and are visible on high level

- 12 -
aerial photographs as light toned areas in which the identification of individual landslides is difficult. Landsliding may be a factor in the formation and on-going development of such gully systems, but due to the difficulty of recognising individual landslides these areas were excluded from the survey. Gullied areas were recorded on the maps.
The aerial photograph interpretation team carried out field checking of mapped landslides on Lantau Island from Ngong Ping to Tung Chung (Sheets 9SE-B, 9SE-C, 9SE-D, 13NE-A), from Shek Uk Shan to Lai Chi Chong (8NW-A, 8NW-C) and from Cloudy Hill to the Pat Sin Leng Range (3SE-C and 3SW-D) to promote conformity in landslide recognition and to check the validity of the data being collected.
3.2 Landslide Identification
The features recorded in the inventory include both the fresh scars of landslides that occurred during, or shortly before, the period covered by aerial photography (1945 to 1994), and overgrown scars originally formed by earlier landslides. During the mapping process these different types of feature were referred to respectively as recent and relict landslides. There was no attempt to classify mapped landslides by process (see Section 3.6). Recent landslides were generally bare of vegetation and showed up as distinctive light-toned areas on aerial photographs. Identification of the source and any debris deposits or trails was usually straightforward. In contrast, relict landslides (overgrown scars) were generally represented only by a linear depression, and the following criteria were used for their identification:
(a) A spoon-shaped depression, and
(b) a sharp main scarp either visible or inferred from vegetation characteristics, or
(c) relatively sharp, or high relief, boundaries along one or both sides of the depression.
The following features were not mapped as relict landslides:
(a) Broad depressions with smooth and rounded edges and no obvious main scarps - these features may have been formed by landslides but are too degraded to fit the criteria.
(b) Depressions that meet the criteria but are bounded on all sides by rock at the surface - this included scars on, and at the crest of, sea cliffs.
(c) Heads of incised drainage lines.
The mapped trail length for relict landslides was usually the length of the depression (Plates 3 & 4), but also included any obvious debris deposits immediately downslope (Plate 5). Any gully erosion downslope from the depression was excluded. Landslides on the coast which appeared to be caused by direct wave undercutting (Plates 6 & 7) were not included in the inventory. However, landslides originating in the weathered profile close to the coast, but
- 13 -
which did not appear to be subject to direct wave erosion, were included (Plates 7 & 8). Areas with morphologies that could be interpreted as the relict debris lobe from a single large landslide were recorded on the inventory base maps for later examination (Figure 1).
3.3 Landslide Data
Landslides were identified and recorded on each 1:5,000 base map with a reference number unique to that map sheet. The location of the crown was recorded with a cross and the centreline of any debris trail was marked with a line. The direction of displacement for landslides without a debris trail was shown with a dot immediately downslope from the crown. The day, month and year of the photograph on which the landslide was first observed, and of the preceding photograph, were recorded on a table in the sheet report, together with the following information:
(a) The width of the landslide scar, as less than or more than 20m. Landslides with a width of more than 20m are referred to as “wide”. For the first 37 sheets a width of 5m was used (see Table 1), and these sheets were later resurveyed using the 20m criterion.
(b) The vegetation cover over the landslide source was recorded as follows (see Table 2):
A - totally bare of vegetation, B - partially bare of vegetation, C - completely covered in grasses, and D - covered in shrubs and/or trees.
(c) The ground slope angle across the landslide head, calculated from the distance between the steepest two adjacent contours at the head location, as shown on the 1:5,000-scale base map.
(d) The reference number for any other landslide originating from the same source, recorded as a cross tag.
(e) Elevation data for the crown and toe of each recorded landslide were manually taken from the base maps.
As discussed above, the landslides recorded in the inventory are divided into two age groups - recent if they occurred within the time scale of the available aerial photographs and relict if they occurred earlier. Following digitisation of the NTLI, each landslide was confirmed as relict or recent on the grounds of year of first observation and mapped vegetation cover. Relict landslides were defined as those with vegetation cover C or D in the years 1945, 1963, 1964, 1967 or 1972.
- 14 -
3.4 Recognition Factor Survey
The NTLI was compiled from high level, small scale aerial photographs. Some landslide scars will have been missed and some other features, such as small fill slopes, excavations, paths and graves, will have been misidentified as landslides, particularly in shadowed areas. To quantify this effect an additional survey of low level aerial photographs taken between 1973 and 1994 was carried out to determine a recognition factor.
Ten map sheets with varying bedrock geology were surveyed to determine the number of recent landslides wrongly classified or not recorded by the NTLI. A recognition factor was not assessed for relict landslides due to the subjective nature of the identification criteria. Of 615 recent landslides that were resampled on the low level survey (about 7% of the total number of recent landslides in the NTLI), 5.7% were found to have been misidentified as natural terrain landslides while 2.6% were landslides with more than one source that had been recorded as a single landslide. In the area where these 615 landslides were resurveyed, 147 new landslides were identified. These data are given in Table 3 and suggest that, for the period 1973 to 1994, about 20% of recent landslides visible on the low level aerial photographs were not recorded during compilation of the inventory. Local variations in this figure can be expected.
When comparing the landslides recorded from the low-level photographs with those recorded in the NTLI, it can be seen that the ratio of the total numbers of landslides spread between each of the ten sheets differ by a maximum of only 1.6% (see Table 3), i.e. the NTLI data are accurately reflecting the relative distribution of landslides. The NTLI database is therefore suitable for susceptibility mapping and hazard assessment. The database should not, however, be used on its own to determine the absolute number of natural terrain landslides at a given site.
An additional assessment of landslide recognition compared the numbers of landslides mapped during detailed field studies in two areas on Lantau Island (Wong et al, 1996), which totalled 67, with landslides recorded in the NTLI for the same areas, which totalled 50. This suggests that, in these areas, approximately 25% of all landslides were not recorded in the NTLI. This study also showed that most of the landslides not recorded in the NTLI for these areas comprised multiple scarps to large landslides.
3.5 Revegetation Survey
The vegetation cover distinguishes recent from relict landslides, but can also be used to estimate the time between the occurrence of a landslide and its first observation on a photograph. A study of landslide scar revegetation rates was carried out for 95 landslides from areas with good successive annual photography, to include different types of bedrock, aspect, topography, vegetation and landslide size. Data were recorded for each landslide together with observations of the percentage vegetation cover on both the landslide source and trail. The number of observations at individual landslide sites varied from three to 22 over time periods of eight to 49 years. Vegetation cover was observed to vary considerably with the season in which it was recorded. The averaged results for all the landslides surveyed are shown in Figure 2, which demonstrates that revegetation is much faster for the landslide trails than for the sources. In general, landslide trails revegetate 70% in five years, 90% in eight years and 100%

- 15 -
in eighteen years, while the equivalent figures for landslide sources are 70% in 20 to 30 years and often no more than 90% after 35 years. The relatively slow revegetation of sources almost certainly results from the stripping of soil and plant cover during landslides.
3.6 Limitations of the Data
The occurrence of landslides on natural terrain may often be controlled by variations in topography and slope that are not reflected on 1:5,000-scale maps, and the recorded location of an individual landslide should only be used to identify its approximate position, rather than its precise topographic setting. Additionally, the scale of the maps and photographs used during compilation of the NTLI limited the accuracy of the dimensions recorded. Heights or lengths of less than about 20m should be regarded as indicative only, and are not appropriate for deriving parameters such as H/L ratios. Where the trails from a number of landslides in the same year coalesced, and it was not possible to distinguish between them, each trail was recorded as the maximum length, and this will have increased slightly the recorded frequency of longer landslide trails. Landslide dimensions are discussed further in Sections 5.9 and 5.10.
The slope angle across the head of each landslide was assessed by measuring the distance between two adjacent contours on the 1:5,000-scale base maps to the nearest 1mm (for angles less than 24°), or the nearest 0.5mm (for angles greater than 24°). An effective upper limit to accurate measurement was 45°. Slopes of less than 11° were not subdivided. This procedure resulted in the recorded head slope angles becoming artificially grouped in classes that span a variable number of degrees, rather than being an unbiased record of the slope to the nearest degree. The slope angles at the source of a number of landslides were measured during field checking, and in general the results were within a few degrees of those measured from the map. Slope angles are discussed further in Section 5.5.
Precise dating of landslides is limited by the frequency of aerial photography. For periods during which annual photographs were available landslides were assigned to a particular wet season with reasonable confidence, on the assumption that most landslides occur during the wet season (see also Section 6).
Landslide classification systems are usually based upon a combination of material and movement mechanism. Using the system proposed by Cruden & Varnes (1996), most of the landslides in the NTLI are probably debris slides, debris flows, complex debris slide-flows or composite debris slide-flow-falls, all of which may be either open-slope or channelised. For the purposes of this study, a landslide is considered to be channelised when moving debris converges into a linear depression and is thereby confined in lateral extent. However, classification of individual landslides from high level aerial photographs is not possible. All the landslides in the NTLI are represented on the map in the same way, with a cross to show the crown and a line showing any debris trail - an appropriate method for the majority of the landslides, which are small debris slides or flows with narrow trails of varying lengths (Plates 10 & 11). Subdivision within the NTLI is only possible on the basis of trail length and the fairly crude width and vegetation cover classes.
Trail length may help to indicate whether or not the debris from a landslide became channelised (Plates 11, 12 & 13). A long trail, particularly when it coincides with a drainage line, probably indicates channelisation. Landslide trails were all recorded as a single line, and
- 16 -
this does not reflect the variations in trail width, debris volume, and potential hazard. Thus a relatively narrow trail that is likely to have little consequence (Plates 14 & 15) is recorded in the same way as a considerably larger event (Plates 16, 17 & 18). Other recent landslide trail types are shown in Plates 19 & 20 .
3.7 Exceptional Landslides
Although the majority of landslides within the NTLI comprise shallow debris slides and flows, other types of landslide do occur on natural terrain in Hong Kong. Those identified from the recorded data. Those identified during compilation of the NTLI include:
(a) A large deep rock slide scar at Kwai Tau Leng (Pat Sin Leng Country Park).
(b) Relict landslides with a bouldery ridge as a trail, which could be the scar from small rock avalanches (Plate 5) - in some cases these were recorded as both landslides and relict debris lobes.
(c) A large wide relict landslide above Tai O village on Lantau, which was recorded as a relict debris lobe but not as a landslide.
(d) Landslides with small displacements indicated by subtle variations in topography and tension cracks, such as those observed on the ground during field checking at Pat Sin Leng (Plate 20). Similar large tension cracks have been observed on low level aerial photographs near Po Kat Tsui Village, Fanling. Small-displacement landslides like these cannot be detected from high-level aerial photographs, and are therefore not recorded in the NTLI.
(e) Degraded scarps that may be the scars of very large creeping landslides, such as at Area 19 Tuen Mun, were also not recorded in the NTLI.
The locations of known relict debris lobes and exceptional landslides are shown in Figure 1. If further features such as these exist, a detailed survey using available low-level aerial photographs would probably locate many of them. Additional information sources include the HKGS 1:20,000-scale geological maps (which record some large landslide scars), terrain classification records of individual large landslides from the Geotechnical Area Studies Programme (GASP, see Section 5.2.3), and relict landslides in the NTLI that are cross-tagged to a number of other relict scars (possibly indicating a large relict feature).
3.8 Landslide Inventory Maps and Isopleth Maps
Wright et al (1974) discussed the preparation and use of landslide density maps from
- 17 -
landslide inventories. Straightforward presentation of landslide locations (inventory maps) are the crudest possible form of susceptibility or hazard assessment, and show where landsliding has occurred in the past, thus serving as a general guide to slope stability (Hutchinson, 1992). Inventory maps have been prepared for the NTLI. Drawing GEO/P/PTE 10 shows the inventory at a scale of 1:50,000, and the entire inventory is also available for viewing on a series of 1:20,000-scale maps kept in the Civil Engineering Library.
Comparisons of the relative density of landsliding in different areas is not always easy when examining an inventory map. Unquantified inventory maps are also not ideal for use in combination with other types of map data. Inventory maps can be generalised and quantified by preparing an isopleth map with contours linking areas of equal landslide density. The contour format is easy to combine with other quantified map data and, by itself, can serve as a generalised guide to landslide susceptibility. An isopleth map has been prepared from the NTLI data (Drawing GEO/P/PTE 11), using a moving circle analysis technique (Wright et al, 1974).
4. GEOGRAPHIC INFORMATION SYSTEM
Determination of landslide hazard requires evaluation of the relationship between various terrain and environmental conditions and landslide occurrences. Objective assessment requires evaluation of the spatially varying terrain conditions as well as the spatial representation of the landslides. A Geographic Information System (GIS) allows for the storage and manipulation of information as distinct data layers, and is thus an excellent tool for landslide susceptibility evaluation and hazard zoning. The advantages of a GIS for assessing landslide hazard include the following:
(a) A much larger variety of hazard zoning techniques become available - complex techniques requiring a large number of map overlays and table calculations are feasible.
(b) Models can be run repeatedly using different values and parameters.
Factors to be aware of when using a GIS include the large amount of time required for data entry, digitising and validation, and the possibility of placing over-reliance on data analysis at the expense of assessment by experienced earth science professionals (Hutchinson, 1992).
The NTLI (comprising landslide locations, data tables and other spatial information relating to areas of development, gullying and survey coverage) has been digitised to form the basis of a GIS. The GIS uses the Microstation standard for creating, managing and manipulating graphical data, with the Oracle database system.
For practical purposes, and for ease in monitoring progress, the digitisation of the NTLI linework followed the sequential order of the 1:5,000-scale map sheet numbers, creating 159 Microstation design files. The attribute tables were first captured in ASCII text format and then converted to the Oracle database system. The links between the NTLI linework in the graphics files and the database were established using the Open Database Connectivity (ODBC) language, as the landslide attribute data were converted. During creation of the link between
- 18 -
graphic and attribute elements, many shortcomings and errors in the original manual data were revealed and corrected. For example, duplicate entry of slide number was easily identified using standard database queries, while other cases included improperly assigned slope angles and missing data. After the link between graphic elements and landslide attributes had been established, the enriched graphic elements were exported to the Microstation design files, and the attributes to ASCII data tables.
Because of the open nature of the NTLI dataset, it has been possible to incorporate other digital datasets to form the NTLS GIS. These data sets have included the 1:20,000-scale Hong Kong Geological Survey maps, the Worldwide Fund for Nature vegetation map of Hong Kong, and GEO terrain classification maps. A Digital Terrain Model (DTM) has also been created (see below). Using the layer-based graphical system with the ODBC interface, the NTLI data have been queried against the other datasets to obtain statistical results.
A DTM is a mathematical representation of relief in terms of x,y and z coordinates. The DTM created for the NTLS is based on the Land Information Centre (LIC) 1:20,000-scale 20m contour topographic maps, using MSM Terrain Modeller software which applies the Delauney triangulation method to the LIC contour data in order to produce a Triangulated Irregular Network (TIN) model for each map sheet. The TIN model can then be converted into a Grid model. Once a TIN or Grid has been created, it can be numerically analysed, and displayed in perspective for three-dimensional views. The DTM has the following surface modelling capabilities:
(a) interpolation of surface elevation,
(b) calculation of slope gradients,
(c) calculation of aspect,
(d) calculation of surface area,
(e) calculation of surface length, and
(d) generation of profiles.
The TIN model can also generate a watershed model with which analyses of flow paths, source areas and stream networks can be carried out.
5. ANALYSIS OF THE NTLI AND ASSOCIATED DATA
5.1 Methodology
There are 26,780 landslides recorded in the NTLI. Relict landslides number 17,976, with the remaining 8,804 landslides classified as recent. The split of landslides into recent and relict and their width classes is given in Table 4.
The analyses of the NTLI carried out to date have involved:
(a) The calculation of the density of landslide initiation points
- 19 -
(assessed using plan areas) within different areas defined by parameter units or classes, with the objective of determining which parameters show a significant and logical density variation.
(b) The evaluation of landslide dimension data to determine any underlying pattern in the development of large and/or long runout landslides.
To calculate true landslide density it is necessary to consider only those areas actually surveyed. For example, if a significant proportion of a given geological group was not surveyed (due to urbanisation, gullying or agriculture - see Section 3.1), calculation of landslide density using the total outcrop area would give an underestimate of the true figure. A further complication is that the areas surveyed changed with time, particularly due to the spread of urbanisation. For instance, an area surveyed in 1964 may not have been surveyed in 1994 due to development between these dates. The most recent development boundaries (taken from 1994 aerial photographs) were therefore used within the GIS to calculate the areas actually surveyed. Landslides which fall within areas developed during the period of the survey (1945 to 1994) were not considered further at this stage in the analysis. The proportion of the NTLI landslides affected in this way was relatively small (between 5% and 10%). Differences in the mapping methodologies and boundaries for the various digital datasets have resulted in some slight variations in the total landslide numbers recorded and analysed for each parameter. The overall average landslide density (relict and recent landslides) for the various parameters considered is approximately 38.5-39.5/km2.
The assumption has to be made that the period covered by the NTLI is long enough to “smooth out” rainfall effects, i.e. that all areas have been subjected to rainfall intensities sufficient to cause an equivalent density of landsliding on equally susceptible terrain. It is appreciated that this is a major assumption and is unlikely to be completely realistic. However, a case can be made to use this as a working hypothesis for the progression of susceptibility and hazard mapping. The known period covered by the recent landslides in the NTLI dates back to 1945 (the earliest available comprehensive aerial photograph coverage). Relict landslides cannot be dated, and estimates of their age have varied from tens to many hundreds of years. Nevertheless, “relict” landslides can be taken as extending the period covered by the NTLI to significantly more than 50 years. As discussed in Section 6, rainfall of an intensity sufficient to cause a high density of landsliding on susceptible natural terrain can be expected to occur at a given site in Hong Kong on average once every twenty years. It can therefore be argued that the period covered by the NTLI is long enough to allow the use of this working hypothesis.
Notwithstanding the above, the possible effects of localised rainfall on mapped landslide densities have to be considered. Anomalies may be detectable by a comparison of relict and recent landslide densities. Any significant departures from the overall relict/recent ratio (which is approximately 2:1) may be indicating recent, local rainfall effects. An unusually high proportion of recent landslides may be caused by locally above-average rainfall and vice-versa. This effect would be expected to be most noticeable for land units which have a relatively small surveyed area and limited geographical range, such as certain geological groups (see Section 5.3).

- 20 -
5.2 Geomorphology
5.2.1 Geomorphological Setting
Geomorphology is the study of landforms and their evolution. Geomorphological models can be used to examine the distribution of landscape-forming processes (including landsliding). Any change in the balance between weathering, erosion, transport and depositional processes can result in a change in landform assemblage. Processes that are currently operating can act as trigger mechanisms to promote instability in slopes which are at limiting equilibrium. Processes can be either internal (e.g. weathering) or external (e.g. erosion or deposition).
Hansen (1984) proposed a geomorphological model for Hong Kong that envisaged a succession of landforms through time, controlled by environmental change and lithological/geological variations. Landforms were grouped into assemblages according to their age and the rate of geomorphological activity. The mountainous terrain of Hong Kong, and its proximity to the sea, has created many short, steep, drainage lines that are subject to high rates of activity, adjacent to less active, deeply weathered plateaux. Hansen defined two geomorphological units - the Upper and Lower Landform Assemblages.
The Upper Landform Assemblage comprises deeply-weathered plateaux, convex ridges and crests and convex upper slopes. These landform are generally older than those of the Lower Assemblage, and tend to have deeper weathering profiles and older colluvial deposits.
The Lower Landform Assemblage is separated from the Upper by a boundary convexity, and occurs beneath it. The Lower Assemblage comprises straight or slightly concave oversteep slopes, which often show signs of instability, above concave depositional slopes which may grade into alluvial fans, terraces or floodplain deposits.
Hansen interpreted the Lower Landform Assemblage as being the result of stream rejuvenation during the Pleistocene eustatic lowering of sea levels. Stream incision during these periods would have caused oversteepening, instability, erosion and slope recession, with the Pearl River Valley forming the local base level. Valleys in the west of Hong Kong, being closer to this major axis of erosion, can be expected to be more deeply eroded than those in the east. Post glacial sea level rise would have submerged the lower reaches of these overdeepened valleys, inducing deposition.
This geomorphological model provides a basis for predicting the distribution of geomorphological processes, and allows present-day natural slope instabilities to be viewed in context. The greatest potential for erosion would appear to be associated with the bounding convexity between the two landform assemblages, and this boundary has occasionally been referred to as an “erosion front”. Older slopes can be expected to be less active than newer ones, and Hansen considered that the most active slopes were those associated with the lowest oversteepened areas, with actively-eroding sea cliffs being the extreme example. Hansen identified four categories of natural terrain landslide in Hong Kong, based on geomorphological setting, as follows:
(a) Small, shallow landslides on straight or convex hillsides of the Upper Landform Assemblage. Slopes affected often show no signs of previous instability, and these slides can be

- 21 -
difficult to predict. Landslide location may be controlled by the complex interactions between groundwater and weathering profile, which can lead to local concentrations of flow and/or pore pressure.
(b) Landslides of variable size caused by the oversteepening of slopes when actively-eroding stream channels cut into superficial deposits, residual soil or weathered rock. Runout distances can be large if debris reaches the drainage course and becomes channelised.
(c) Landslides triggered at the boundary convexity between the Upper and Lower Landform Assemblages, where the concave oversteepened slopes of the Lower Assemblage are undercutting the convex or straight slopes of the Upper Assemblage (the “erosion front”). Hansen considered that many of these locations showed evidence of past instability. These failures tend to be small, but, due to their position at the crest of the oversteepened slopes of the Lower Assemblage, they can have long runout distances. Hansen also noted that the largest of these failures appeared to be associated with slope concavities, where surface and groundwater flows can become concentrated.
(d) Landslides on the straight or concave oversteepened slopes of the Lower Assemblage. These landslides tend to be shallow failures of soil or weathered rock.
Hansen’s geomorphological model inevitably simplifies and generalises the actual processes occurring at any given site in Hong Kong, but, nevertheless, provides a framework within which different situations can be assessed. The possible limitations of the model are discussed further in Section 5.2.3.
5.2.2 Landslide Distribution
Qualitative visual examination of the NTLI data superimposed onto 1:20,000-scale topographic maps shows that natural terrain landslides do tend to occur in recognisable patterns, and that a large proportion of the mapped landslide initiation points occur in one of the following four types of situation:
(1) Alignments along slope contours. There are many situations where two or more landslides initiate at the same elevation on a slope. Figure 3 shows an example of this type of situation. The pattern is often repeated at different elevations on the same slope. The following factors may contribute to this type of distribution:
(a) break in slope,
(b) slope hydrology/weathering profiles,

- 22 -
(c) unmapped superficial deposit boundaries, and
(d) presence of bedding planes and/or joints.
These features probably cover the landslide types (a), (b) and (c) described in Section 5.2.1, and may be especially common at the boundary convexity (type c).
(2) Alignments parallel to streamcourses. Landslides are often initiated in a line parallel to streamcourses, on one or both sides (see Figure 4 for a typical example). The initiation points are usually on the upper parts of the stream valley sideslopes, which have presumably been oversteepened by active downcutting. Streams can often be seen to be following photolineaments, giving an indirect correlation between landsliding and lines of structural weakness. These types of failure obviously correspond to the type (b) landslides described in Section 5.2.1.
(3) Arcuate distributions at stream heads. There are many examples of arcuate lines of landslide initiation points around the heads of streamcourses, indicating areas of active erosion and oversteepening. A typical example is shown in Figure 5. Again, these landslides correspond to the type (b) landslides described in Section 5.2.1.
(4) Near-coastal landslides. Strong alignments of landslides on low-elevation, apparently oversteepened slopes adjacent to the coast (but not caused by direct undercutting) are very common. Figure 6 shows a typical example.
This qualitative examination of the NTLI shows that the recorded distribution of landslides is in general agreement with geomorphological theory. However, in order to progress to quantitative susceptibility mapping and hazard zoning it is necessary to look for correlations of landslide occurrence with defined land units.
5.2.3 Terrain Classification
In mid-1979 the (then) Geotechnical Control Office (GCO) undertook a mapping exercise of the whole of Hong Kong to identify areas of colluvium. The survey comprised API at a scale of 1:20,000, and led to a systematic terrain classification mapping exercise which became known as the Geotechnical Area Studies Programme (GASP), also based on 1:20,000-scale API. The mapping was carried out by a team of geomorphologists, geologists and geotechnical engineers and was completed in 1985. The terrain attributes adopted for the GASP terrain classification mapping were as follows:
(a) Slope gradient - see Section 5.5.
(b) Terrain component, e.g. hillcrest, footslope, sideslope, etc.
(c) Erosion and instability - type and degree of erosion and the existence of evidence of landsliding or general instability (e.g. hummocky terrain).
Areas displaying similar terrain characteristics were classified as individual ‘cells’ and

- 23 -
encoded according to the above attributes. The results of the terrain classification mapping were recorded manually on topographic base maps and subsequently transformed into formal terrain classification maps (TCMs) using manual cartographic methods. However, in recognition of the value of the dataset and the growing acceptance of the use of digital data, the TCMs were digitised during the period late 1992 to early 1996. This lengthy task involved the digitisation of as many as 8,500 cells on a single 1:20,000-scale map sheet, with altogether some 56,000 cells for the 11 map sheets. The GASP slope gradient data are considered briefly in Section 5.4, while this Section discusses the terrain component and erosion classes.
(1) Terrain Component. The distribution of landslides with respect to the GASP terrain components is shown in Table 5. Components showing above-average total landslide density comprise concave sideslopes (46.5/km2) and straight sideslopes (44.3/km2). The fact that concave sideslopes have the highest total landslide density is in general agreement with the geomorphological model of Hansen (1984), concave slopes tending to belong to the oversteepened undercutting slopes of the Lower Landform Assemblage. It is not possible, using this dataset, to determine whether landslides occurred on or close to the boundary between the Upper and Lower Landform Assemblages (which Hansen’s model suggests may be a focus for landsliding activity). Six terrain components have landslide densities of less than 15/km2, covering footslopes, floodplains, alluvial plains and coastal plains.
(2) Erosion Classes. The distribution of landslides between mapped GASP erosion classes is shown in Table 6. Maximum total landslide density (74.3/km2) is associated, not surprisingly, with areas mapped as well-defined large landslides (over 1 ha in area). Areas of coastal instability rank second (62.1/km2), and severe rill erosion third (58.6/km2). The fourth-ranking category is that of “general instability”, and covers a large area (177 km2) at a relatively high density (58.4/km2). The erosion classes were determined from aerial photographs covering only a short time period in the late 1970s and early 1980s and, as discussed in Section 5.1, these data may not be representative of long term equilibrium conditions.
Although the GASP and NTLI data do tend to support some of the basic propositions of Hansen’s geomorphological model, it is unlikely that the model can be used by the NTLS GIS as a primary indicator of landslide susceptibility at the regional scale. It is probable that the processes discussed by Hansen are indeed important factors in the evolution of the landscape in Hong Kong, but the reality of any given situation may be considerably more complex than can be explained by a simple model. For example, it is entirely possible that there is not one clearly-defined “erosion front”, but a number, leading to subtle complexities which would be extremely difficult to detect on a regional basis using the 1:20,000-scale NTLS DTM. However, the use of the existing, fairly crude, GASP terrain components as a secondary, or confirmatory, factor in assessing landslide susceptibility should not be dismissed.
5.3 Geology
Geology exerts a fundamental control on the geomorphology of a landscape. The nature and rate of geomorphological processes, including landsliding, is partly dependent on the lithology, chemistry, weathering characteristics, history and structure of the underlying materials.
Lumb (1975) looked at the geological factors that influence natural terrain landsliding in

- 24 -
Hong Kong and noted that, in general, granites weather to a silty sand while volcanic rocks tend to produce a silt. Silt content in both types of residual soil generates high pore-water suctions when unsaturated, generating high apparent cohesion. On full saturation, soil suction is released and cohesion decreases almost to zero, giving essentially cohesionless behaviour and producing shallow slips.
Ruxton (1980) also examined the influence of geology on landsliding in Hong Kong, and concluded that weathering was fundamental. Where debris mantles are thick and varied, the hillslope hydrology becomes very complex and unpredictable. Dry debris will stand at angles of about 30° - 45°, but where impeded drainage and/or full saturation occurs, the threshold slope reduces by up to 50%, to 17°-27°. Continuing weathering can produce a metastable condition where slipping occurs on saturation. Ruxton believed that many natural slopes in Hong Kong are in a metastable condition.
Ruxton (1980) also believed that the incidence of landsliding may be correlated with grain size. Colluvium or bouldery soil can be highly permeable, and complex layering of permeable and less permeable zones within the regolith may impede water movement and cause rapid localised saturation. Ruxton confirmed that many slips occurred adjacent to the convex slope break in the upper parts of slopes, discussed in Section 5.2.1 as the “bounding convexity”, or “erosion front”, and he considered that this was due to the concentration of seepage flow lines above relatively impermeable bedrock. Ruxton also noted that the regolith of lower slopes was often wetter than that of the upper slopes, leading to failures which tended to ravel upslope.
Fourie’s (1996) discussion of shallow slope failures caused by rainfall infiltration reinforces the conclusions of Lumb (1975) and Ruxton (1980). Fourie concluded that relatively shallow failures that develop parallel to slopes during intense rainfall (which probably describes most of the landslides in the NTLI) are caused by a loss of soil suction, and are fundamentally different in their mode of failure to deep-seated landslides with discrete failure planes.
Both granites and volcanic rocks can weather to give clay minerals such as halloysite and kaolinite (Irfan, 1996 & 1997). The type and quantity of clay minerals produced often depend on earlier metamorphism or hydrothermal alteration. Clay minerals can alter the strength and drainage characteristics of weathered rock to give adverse slope stability conditions. Weathering is a dynamic process and the nature of slope-forming materials, and the stability of natural slopes, can change with time.
The above short discussion is focused on the commonly-used simple division of Hong Kong geology into granites or volcanic rocks. The volcanic formations often comprise complex interlayered sequences of pyroclastic and sedimentary deposits. Variable weathering and degradation within formations such as these, and within the metasedimentary and sedimentary rocks which also occur, can be expected to lead to significant variations in landsliding susceptibility. Geological conditions are also locally dominated by features such as dykes, faults and shear zones, all of which can have adverse effects on the stability of natural slopes.
The Hong Kong Geological Survey 1:20,000-scale solid and superficial geological maps have been digitised and input to the NTLS GIS. For the purposes of this study, mapped
- 25 -
landslides have been assigned to one of 34 geological groups, each comprising geological units of broadly similar lithology, chemistry and structure. The groups were further classified into categories (volcanics, intrusives, minor intrusives, volcaniclastic sedimentary rock and lava, sedimentary rock, metasedimentary rock or superficial deposits). A summary of the geological categories and groups and their characteristics is given in Table 7, together with lists of the units contained within them (using the nomenclature of the Hong Kong Geological Survey 1:20,000-scale maps).
Structural information is also available from the digital geological maps, and parameters relating landslides to, for instance, distance to the nearest mapped fault, photo-lineament or geological boundary could also be obtained. However, qualitative examination of spatial distributions suggests that correlation between NTLI landslides and mapped linear features at the 1:20,000-scale is not good.
The distribution of landslides between the 34 geological groups and seven geological categories is shown in Table 8 ranked according to total landslide density. For the geological groups, total densities vary from 14.5/km2 (monzonite dykes) to over 140/km2 (Lai Chi Chong Formation volcanics and volcaniclastic sediments). When considering the geological categories, total landslide densities average about 50/km2 for the volcanics and volcaniclastic sediments, as opposed to about 15/km2, 19/km2 and 28/km2 for the superficials, minor intrusives and intrusives (granites) respectively. The highest average total landslide density is found in the sedimentary category (about 56/km2). The metasediments average about 38/km2. Individual geological groups with landslide densities considerably above average are as follows:
(a) LC(1), RHL, TT, TRL, JCB, JHI (volcanics),
(b) LC(2) (volcaniclastic sediments and lavas), and
(c) SL(1), SSC (sediments).
Geological groups with relatively low landslide densities are as follows:
(a) VT (volcanics),
(b) GD, GC (intrusives),
(c) RF, LBD, MC (minor intrusives),
(d) CQ (metasediments), and
(e) DF, ATB (superficials).
The survey coverage of two sedimentary groups (KKO and SL(2)) was insufficient to permit any conclusions to be drawn with respect to landslide densities.
There are two geological groups with relatively high recent densities but only average relict densities (CB and SST - both sedimentary), possibly due, as noted in Section 5.1, to localised recent rainfall effects. The total recorded landslide density may overestimate the susceptibility of these groups. In contrast, the groups JCB and JHI (volcanics) and SV

- 26 -
(volcaniclastic sediments and lavas) have low recent densities, but high relict densities, and the total density recorded for these groups may underestimate susceptibility to landsliding.
5.4 Gullying
As discussed in Section 3.1, areas of severe gully erosion were not surveyed for individual landslides during the compilation of the NTLI, but were recorded. A total of 25.85km2 of gullied terrain was mapped, of which 22.74km2 were on intrusive rocks (primarily fine- to medium-grained granites). The distribution of gullied terrain between the geological groups is shown in Table 9, in which gullied terrain has been calculated as a percentage of the area surveyed plus the gullied area. The proportions of geological groups affected by gullying range from zero (several units) to 17.8% (fine- to medium-grained granite). A figure of 18.9% was also recorded for a small outcrop (0.37km2) of aplite, a minor intrusion. For the seven geological categories, the proportions affected by gullying range from 0.09% (volcaniclastic sedimentary rock and lava) to 13.9% (intrusives).
5.5 Slope Gradient
Three sets of slope gradient data are available within the NTLS GIS:
(1) GASP slope angle class. Slope angle classes were assessed during the GASP studies and classified as follows: <5°, 5°-15°, 15°-30°, 30°-40°, 40°-60°, >60°. These data are not as detailed as those now available to the NTLS, and are not being used at present.
(2) Head slope angle class. Measured directly from the 1:5,000-scale NTLI base maps (see Section 3.3) and assigned to the following classes: <11°, 11°-15°, 15°-18°, 18°-22°, 22°-27°, 27°-30°, 30°-34°, 34°-39°, 39°-45°, >45°
(3) DTM-derived data. The 1:20,000-scale DTM within the NTLS GIS can be used to calculate slope gradients where required. To date, slope angle classes corresponding to the head slope angle classes above have been defined and analysed to allow comparisons between the two sets of data.
Any consideration of slope gradient for a large area is complex, as the measured gradient depends on both the scale and accuracy of the base data, and the size of the area over which slope gradient is measured and averaged. On this basis, the most accurate data available to the NTLS at present is the direct 1:5,000-scale measurement of the slope across the landslide heads, and the distribution of this dataset is shown in Table 10, subdivided into geological categories.
The distribution of head slope angles is not the same for the different geological categories. As examples, the proportion of landslides in the 34°-39° class varies from 24.9% (superficials) to 40.2% (sedimentary rocks, volcaniclastic sedimentary rocks and lavas), and the proportions in the 22°-27° class vary from 0.85% (sedimentary rock) to 9.49% (superficials). This tends to confirm the importance of the underlying geology on geomorphology and landslide susceptibility. It is expected that differences in landslide head slope angle distributions will be even more apparent between individual geological groups (see Section 8.2).

- 27 -
To quantify the relative frequency of occurrence of slides on different gradients it is necessary to consider the areal distribution of the slope angle classes, and, in the absence of an available 1:5,000-scale DTM, this cannot be done for the 1:5,000-scale data. Using the 1:20,000-scale DTM the areal coverage of slope angle classes measured at this scale can be determined. This has been done, and the numbers of landslides in these DTM-derived slope gradient areas have been calculated (see Table 11).
Comparison of the two sets of data shows that the 1:5,000-scale head slope angle distribution is skewed towards higher values than the 1:20,000-scale DTM-derived data. For instance, the 1:5,000-scale >45° slope angle class contains 2,904 landslides, while the 1:20,000-scale equivalent slope class contains only 337. Conversely, for the <11° slope classes, the 1:5,000-scale data record only 8 landslides, while the 1:20,000-scale data show 1,095. It therefore must be concluded that many landslides occur on locally steep slopes which are being measured more accurately at the 1:5,000-scale. It is probable that the same situation would arise if the 1:5,000-scale data were compared with, say, 1:1,000-scale data. This situation is a reflection of natural slope topography, where apparent complexity tends to increase with the scale of mapping.
Examination of the distribution of total landslide densities, measured at the 1:20,000-scale, shows an increase with slope gradient from 14.6/km2 (<11°) until the maximum density is reached in the 34°-39° class (81.6/km2), followed by a slight decrease to 77.0/km2 and 62.8/km2
in the 39°-45° and >45° classes. Densities start to increase sharply between the 22°-27° class (34.7/km2) and the 27°-30° class (53.1/km2).
5.6 Elevation
There is no obvious direct physical link between elevation and natural terrain landslide susceptibility. However, elevation does influence climate, with temperatures decreasing and rainfall tending to increase with altitude. Temperature decrease is unlikely to be significant in Hong Kong as temperatures of below freezing occur only very occasionally, even on the highest ground, and the freeze-thaw mechanism is therefore unlikely to be a factor in landsliding. The effects of rainfall increase with elevation, however, have to be considered, and this subject is discussed by Evans (1996 & 1997). In brief, it appears that, in Hong Kong:
(a) The frequency of intense rainfall events does not necessarily increase with elevation.
(b) Mean annual rainfall does tend to increase with elevation, but this does not necessarily result in increasing landslide susceptibility (see Section 6).
An initial assessment of the distribution of landslides with elevation is shown in Table 12, and supports the proposition that there is no direct correlation between landslide susceptibility and elevation in Hong Kong.

- 28 -
5.7 Aspect
The aspect of a slope (the direction it faces) has the potential to influence its physical properties and its susceptibility to failure. The processes that may be operating include exposure to sunlight, drying winds and, possibly, rainfall. Above-average exposure to sunlight and hot, drying summer southerly winds on south-facing slopes in Hong Kong may lead to high rates of evaporation, possibly to the detriment of vegetation growth and soil formation. In contrast, shaded north-facing slopes may have denser vegetation and deeper soil (and, possibly, weathering) profiles. Differences in rates of evaporation may also have an effect on the development of soil suction (see Section 5.3).
To investigate whether these effects can be detected within the NTLI, the DTM was used to calculate a three-figure aspect bearing for each landslide with a recorded trail. The distribution of aspect among the NTLI landslides is shown in Figure 7. Table 13 shows the overall distribution of aspect as measured and recorded by the GASP studies (Styles and Hansen, 1989). It can be seen that landslides with aspects of 120° to 240° (approximately ESE through S to WSW) have below-average representation in the NTLI. If it is assumed that the areal distribution of slope aspect is essentially random (and the GASP data in Table 13 appear to support this) then these data may be showing that natural terrain landsliding is less common on south-facing slopes.
5.8 Vegetation
The conventional belief that vegetation cover always contributes to slope stability derives mainly from studies in temperate areas, where soils tend to be thin (permitting effective reinforcement by root systems), and where failures are often triggered by rises in groundwater levels rather than by direct infiltration. The effects of vegetation on slope stability in tropical areas were examined in some detail by Collison & Anderson (1996), who concluded that increases in infiltration resulting from the development of root systems in deep tropical soils of relatively low permeability can offset the mechanical benefits of soil reinforcement. The effects of increased infiltration were noted to be particularly critical on slopes subject to the development of infiltration-induced transitory perched water tables.
Correlations between vegetation cover and slope stability in Hong Kong are unclear. So (1971) examined the effects of the severe rainstorms of June 1966, and concluded that thick vegetation may be an adverse factor. However, Franks (1996) examined natural terrain landslides in North Lantau and concluded that sparsely vegetated slopes appeared to be most susceptible to failure.
The World Wide Fund for Nature (Hong Kong) has compiled a 1:20,000-scale GIS coverage of vegetation types, based on December 1989 aerial photographs. Thirty six land cover categories were mapped, but these were simplified to fifteen for the purposes of map production. Of these fifteen categories, seven (comprising approximately 25% of the land area of Hong Kong) are not relevant to the NTLS as they comprise either wetland areas or areas significantly affected by man (and therefore not surveyed for natural terrain landslides). The remaining eight vegetation categories are as follows:
(a) bare rock or soil,

- 29 -
(b) grassland,
(c) low shrubs with grass,
(d) low shrubs,
(e) tall shrubs with grass,
(f) tall shrubs,
(g) plantation woodland, and
(h) woodland.
The distribution of landslides between vegetation classes is shown in Table 14. Total landslide density ranges from 15.8/km2 (woodland) to 52.0/km2 (tall shrub with grass). Excepting woodland, the density range for both total and recent slides is small (28.3/km2 to 52.0/km2, and 11.8/km2 to 17.6/km2 respectively), making it difficult to draw any conclusions about relative landslide susceptibility. The possibility that lower than normal landslide recognition rates were operating in woodland areas, due to tree cover, has to be considered. When interpreting these data it also has to be remembered that vegetation cover can change with time. The WWF vegetation data represent a “snapshot”, while the landslide data cover a much longer period, i.e. the vegetation cover for a landslide in the NTLI may have changed between the time of failure and the vegetation mapping exercise.
It has been pointed out by Irigaray et al (1996) that apparent correlations of landsliding susceptibility with vegetation have to be considered with care, as vegetation is very strongly dependent on factors such as geology and hydrology. This means that any apparent correlation of landsliding activity with vegetation may, in fact, be a correlation with other factors.
5.9 Landslide Dimensions
The only landslide dimension directly recorded in the NTLI is the width class (less than or more than 20m wide). The division of landslides between width classes and between relict and recent is shown in Table 4. Wide landslides comprise 15% of both the recent and relict landslide totals. The distribution of wide landslides between terrain components, erosion classes, geological categories and groups and vegetation classes are given in Tables 5, 6, 8 and 14. In general, these distributions are similar to the totals for all landslides. However, considerably higher than average wide landslide densities were recorded for the erosion classes of well defined landslides and rill erosion, and for medium-grained granite. Landslide trail location is also recorded in the NTLI and was used to derive the following data by GIS queries:
(a) Trail length (L) - the horizontal plan distance from the crown to the end of any trail.
(b) Vertical distance (H) - the vertical distance from the landslide crown to the end of any trail.

- 30 -
As discussed in Sections 3.2 and 3.3, the trail locations recorded for relict and recent landslides, and the derived H and L measurements, must be analysed separately as they are not directly comparable. Frequency distributions of H and L for recent and relict landslides (both total and wide) are shown in Figures 8 to 11, with modes, means and standard deviations.
The recorded dimensions of relict landslides are, in most cases, those of a linear depression interpreted to be a landslide source. Landslide trails were not detectable for most relict features and, if they are assumed to have existed, but to have degraded with time, it is probable that the original length of most relict landslides was much greater than is now recorded.
For recent landslides the combination of H and L represents debris runout distance, and the H/L ratio is the tangent of the angle of reach. As discussed in Section 3.6, H and L measurements are only meaningful for dimensions of greater than about 20m, and only data meeting this condition has been considered when assessing the recent landslides. Recent landslides meeting this criterion number 3,832, and Figure 12 shows the frequency distribution of their H/L ratios. The modal angle of reach is 29° for all landslides and 28° for wide landslides.
5.10 Long Runout and Mobile Landslides
A subset of the longest landslides in the NTLI was determined by using a minimum length of 150m, and all of the NTLI landslides with a height of more than 100m were included within this group, which comprises 204 recent and 194 relict landslides. The distribution of H and L within this subset is shown in Figures 13 and 14. There are 22 landslides with H over 220m or L over 400m. The frequency distribution of H/L is shown in Figure 15. The modal angle of reach is 28°.
A further subset of mobile landslides was defined, comprising 156 recent landslides with H/L ratios of less than 0.4 (angle of reach about 22°). The frequency distributions of H and L for this subset are shown in Figures 16 and 17.
The distributions of long runout and mobile landslides between terrain components, erosion classes, geological groups, 1:5,000-scale head slope angle classes and vegetation classes are shown in Tables 15 to 19. Parameter classes with above-average concentrations of long or mobile landslides are as follows:
(a) erosion class of well-defined landslides (long, recent landslides),
(b) erosion class of severe gully erosion (long, relict landslides),
(c) geological group JHI (long, relict landslides), and
(d) geological group LC(1) (mobile landslides).

- 31 -
6. RAINFALL
6.1 Previous Work
Rainfall is one of the most important controlling influences on the occurrence of natural terrain landslides. Correlations of rainfall intensity with landslide activity in Hong Kong have, to date, concentrated largely on failures of man-made slopes, as these are the incidents that tend to affect developed areas and are therefore reported. There is general agreement among the various authors (e.g. Lumb, 1975, Brand et al, 1984, Au, 1993, Premchitt et al, 1994) that it is possible to define rainfall thresholds above which failures of man-made slopes increase in frequency. Rainfall thresholds derived for man-made slopes may not, however, be directly applicable to natural terrain, where failure mechanisms may differ.
The subject of rainfall thresholds for natural terrain debris flow initiation received much attention in the USA after a severe rainstorm in central California in January 1982, when up to 50% of the mean annual precipitation fell within 30 hours, triggering over 18,000 highly mobile and destructive debris flows on rugged topography in the San Francisco Bay area.
Mark & Newman (1989) examined correlations between rainfall totals and damaging landslides (predominantly debris flows). They concluded that there was a significant increase in landslide activity after storm rainfall reached about 250mm, or a normalised value of about 0.3 (30% of the mean annual precipitation).
Cannon & Ellen (1989) compared the known times of debris flows with hourly records from nearby rain gauges, and showed that the cumulative storm rainfall required to trigger flows varied linearly with the mean annual precipitation (correlation coefficient of 0.75), and ranged from under 100mm to over 300mm.
Cannon (1989) defined a rainfall threshold condition relating rainfall duration and normalised rainfall intensity to the onset of abundant debris flow activity. For 24 hour storm rainfall this threshold equated to a normalised value of about 0.19.
Evans (1996) examined the distribution of rainfall over Hong Kong, and noted that annual rainfall is not uniform, even when expected orographic (elevation) effects are taken into account. The coastal periphery, the outlying islands and the northern New Territories appear to be significantly drier than elsewhere. It is suggested that this may have led to a situation in which absolute rainfall thresholds for landsliding on natural terrain also vary across Hong Kong, other factors being equal. “Normalised” rainfall, in which rainfall at a site is recorded as a proportion of the mean annual rainfall at that site, may be a more appropriate tool for investigating natural terrain landslide susceptibility (see also Section 6.3).
6.2 Rainfall Return Periods
Before discussing the analysis of rainfall/landslide data for the NTLS, it is necessary to consider the methods used to estimate rainfall return periods. Wong & Ho (1996) have given a very clear exposition of the various factors which can lead to errors in interpreting the rainfall return periods calculated by the Royal Observatory (Peterson & Kwong, 1981, and Lam & Leung, 1994). The rainfall return periods conventionally used were assessed using data from only one site (the Royal Observatory) and should, strictly speaking, be applied only to that site.
- 32 -
While the data from the Royal Observatory can be considered reasonably representative of the northern Hong Kong and Kowloon urban areas, significant errors are possible if the data are applied to sites further afield.
When carrying out a regional study such as the NTLS, it is important to realise that the probability of a rainstorm of a given magnitude occurring somewhere within Hong Kong is considerably higher than the probability of it occurring at a given point (such as the Royal Observatory).
(1) Size of rainstorm. The area affected by a given rainstorm is generally much smaller than the total land area of Hong Kong. Rainstorms affecting 20% to 50% of Hong Kong are typical. Hence it is reasonable to suppose that the probability (the inverse of the return period) of a given rainstorm occurring somewhere within Hong Kong is from two to five times as great as the probability of it occurring in the vicinity of a given rain gauge.
(2) Rainfall at a point versus rainfall in an area. Maximum rainfall intensity usually occurs over a small area within a given rainstorm. Hence the data from the Royal Observatory will not have sampled the peak intensities for most of the rainstorms affecting the site. Wong & Ho (1996) suggest that factors of from two to five would again be appropriate when extrapolating Royal Observatory data.
(3) Effect of rainfall duration. If considering rainfall intensities of different durations, different intensities can give the same return period. It is important to state clearly which duration is being used, and to compare like with like.
(4) Clock time versus rolling time. Rolling rainstorm records tend to yield higher values than clock records, and again it is important to compare like with like.
Wong & Ho (1996) made a subjective assessment of how these various factors could be used to estimate a realistic return period for a given storm. For the purposes of this study, the general approach of Wong & Ho has been used to assess possible return periods of rolling 24hr rainfall for Hong Kong as a whole.
The variation in rainfall patterns across Hong Kong has been addressed by normalising the 24hr rainfall maxima at the Royal Observatory to the annual average rainfall there - which is about 2220mm (Kwan & Lee, 1984). The Royal Observatory data are derived from nearly 100 years of clock hourly records, giving a rolling 24hr figure, and as the storm rainfall intensities assessed are also based on rolling 24hr values there is no need to factor return periods to account for the effects of different durations.
Factoring of rainstorm size and point/area rainfall differences followed Wong & Ho’s technique, with an average value of 3.5 being adopted for both factors, giving a “rainfall index” of 12.25. Due to the inherent uncertainties in the approach, an index value of ten is considered to be a reasonable approximation, i.e. a 24hr rainfall event with a return period of ten years at the Royal Observatory can be expected to have a return period of one year when considering the whole of Hong Kong. Applying the index value to the Royal Observatory data gave approximate return periods for 24hr rainfall for Hong Kong as a whole (Figure 18), in terms of normalised values. It is not considered prudent to estimate return periods for absolute values for Hong Kong as a whole due to possible regional variations (which may be reflected by the

- 33 -
distribution of mean annual rainfall). In the absence of data on return periods at locations with mean annual rainfalls significantly different from that at the Royal Observatory, the normalised approach is being used.
6.3 Correlation of Rainfall with Natural Terrain Landslides
The availability of the landslide data in the NTLI has allowed a semi-quantitative assessment of possible rainfall thresholds. This work is described in more detail in Evans (1997). A comparison of the NTLI data and the available processed rainfall data suggested that the most logical period to evaluate was 1985 to 1994 (inclusive). Spatial rain gauge coverage was improved considerably in 1984 and 1985 with the expansion of the GEO/Royal Observatory automatic recording network. Most significant rainstorms since 1984 have been plotted by the Royal Observatory in terms of maximum 24 hour isohyets. The period 1985 to 1994 was also covered by annual high level aerial photography, although in 1987 photography took place before the wet season and it was not possible to distinguish between the 1987 and 1988 wet seasons (see below).
It has been assumed that all landslides occurred during the wet season. Landslides which were first seen on photographs taken from January to March inclusive were assumed to have occurred during the previous wet season. All landslides first noted between 1985 and 1994 inclusive were therefore assigned to a wet season (as noted above, 1987 and 1988 could not be subdivided). A series of 1:100,000-scale plans of Hong Kong were then produced, one for each wet season from 1985 to 1994, showing the locations of recorded natural terrain landslides superimposed on topography. The numbers of natural terrain landslides individually identifiable from these plans (a total of 2,307) are somewhat less than those recorded in the NTLI as multiple landslides, and landslides very close to each other, cannot be distinguished at this scale.
The rolling maximum 24hr rainfall parameter was used in this study, primarily for ease of data handling. It is not being suggested that this is the most important rainfall parameter associated with landsliding - shorter period intensities may be more critical. However, determining shorter period maxima for the 2,307 landslides would have required enormous amounts of data processing. It can also be argued that the 24hr maxima reflect very strongly the underlying shorter-period maxima (Brand et al, 1984).
Isohyets of 24hr rainfall for all significant rainstorms for the period 1985 to 1994 were plotted onto the appropriate 1:100,000-scale plots of landslide occurrence. Most of this information was obtained from the annual GEO Rainfall and Landslide Reports - Chan (1995 & 1996), Chen (1993), Evans (1992), Premchitt (1991 a, b, c & d), Siu (1991) and Tang (1992). An additional ten storms considered to be potentially significant were plotted by the Royal Observatory specifically for this study. The plots of rainfall and landslides were examined, and for each landslide the maximum 24hr rainfall in the year of occurrence was recorded. This figure was also reduced to a normalised value by dividing it by the approximate mean annual rainfall at the landslide site. There were two potential sources of error in this process:
(a) The recorded maximum rainfall is not necessarily the rainfall that triggered failure.

- 34 -
(b) The method of plotting maps of 24hr rainfall selects a 24hr period which contains all, or most, of the local 24hr maxima. Occasionally, 24hr maxima in some areas fall outside the selected period, leading to localised underestimates of the rainfall maxima.
Figures 19 and 20 show the cumulative distribution of landslides associated with 24 hour rainfall (absolute and normalised respectively) during the ten year study period. Possible rainfall thresholds are detectable at absolute 24-hr values of 60-70mm and 180-200mm, and at normalised values of 0.03, 0.09 and 0.19.
Landslide occurrence can be weighted for probable frequency of associated rainfall by dividing the dimensionless relative frequency of landsliding associated with a given 24hr rainfall intensity by the relative frequency with which that particular 24hr rainfall can be expected to have occurred during the period of the survey (ten years). This is not a statistically rigorous procedure, but serves to accentuate possible rainfall thresholds. Figure 21 shows the dimensionless relative frequencies of landsliding weighted for normalised rainfall frequency. The possible thresholds at 0.09 and 0.19 are magnified by this plot. The erratic nature of the calculated relative frequencies at high normalised values is a reflection of the relatively small number of landslides resulting from high return period rainfall events between 1985 and 1994. Approximate landslide densities were defined as follows:
(a) low density - less than 1 landslide/km2,
(b) medium density - 1 to 10 landslides/km2, and
(c) high density - over 10 landslides/km2.
Examination of the plots of annual rainfall and landslide distribution shows that for the majority of the area of Hong Kong, where mean annual rainfall is in the range 2000-2400mm, landslide densities of about 1/km2 or more are most usually associated with 24hr rainfall maxima of at least 200mm (0.09 normalised), while high densities of over 10/km2 tend to be associated with 24-hr maxima of at least 400mm (0.19 normalised). Table 20 gives more detail on these possible rainfall thresholds. Approximate return periods for rainstorms reaching or exceeding these levels are given in Table 21. It must be emphasised that the rainfall thresholds derived here are average values. Site-specific rainfall thresholds will depend on complex combinations of factors, and may vary widely.
7. ASSESSMENT OF LANDSLIDE FREQUENCY
The frequency of landsliding (the number of landslides that occur in a given area during a given time period) is a fundamental parameter for landslide hazard and risk assessment. Four possible methods have been identified for estimating the frequency of natural terrain landsliding in Hong Kong:
(1) Overall landslide density. Calculation of landslide density for a given area allows an estimate to be made of overall landslide frequency within that area, by dividing the density (landslides/km2) by the time period covered by the landslide record. If the total landslide

- 35 -
density (relict and recent slides) is considered, an estimate has to be made of the time period covered by the relict landslides. It is perhaps more appropriate to consider only recent landslides, as this allows a more accurate estimate of the period covered (which is something less than 60 years for most of Hong Kong). Consideration of the recent landslide densities calculated for different geological groups shows that, using an average time span of 50 years, mapped landslide frequencies range from approximately 0.3/km2/year to 2.8/km2/year, with an overall average of about 0.8/km2/year. As discussed in Section 3.4, it has been estimated that, for the period 1973 to 1994, perhaps 20-25% of recent natural terrain landslides were not recorded in the NTLI. The relative proportions of recent landslides not recorded for the period 1945 to 1973 may be higher than this. Estimates of absolute landslide frequencies will have to address these issues.
(2) Sequential landslide density. A more time-consuming approach is to consider all the landslide data available on a sequential basis, ie: the numbers of landslides recorded from a given survey, adjusted for the area actually covered by that survey. This approach has the advantage of showing the distribution of landslides with time, but can become very complex. One 1:5,000-scale map sheet (13NE-A) has been analysed using this technique, and the results are shown in Table 22.
(3) Correlations with rainfall return periods. The third method of frequency analysis is an indirect approach based on the study of correlations between landsliding intensities and rainfall, as described in Section 6. Rainfall thresholds have been defined on the basis of ten years worth of consecutive annual landslide and rainfall data, and rainfall return periods have been calculated by the Royal Observatory from long-term, comprehensive rainfall data. Combination of the two sets of data has allowed assessment of the probable frequency of rainfall events likely to cause different densities of landsliding in susceptible areas (see Table 21).
(4) Distribution and age of colluvial deposits. A fourth method relates to the distribution and age of colluvial deposits, which are widely distributed in Hong Kong (Bennett, 1984). Estimates of their age range from recent to perhaps 1.6 million years, although the limited chronological data available are insufficient to confirm this. A better understanding of the age, thickness, stratigraphy and genesis of colluvium deposits may give an indication of the rate of geomorphological processes in the past, with particular reference to large landslides.
Some colluvium deposits in Hong Kong have a lobate form, with bouldery surfaces and steep margins, and may be debris lobes representing deposits from individual large debris avalanches/flows or, alternatively, they may have resulted from the combination of many smaller debris flow and alluvial deposition events. The locations of nine possible debris lobes (eight of which were identified during the compilation of the NTLI) are shown on Figure 1. Site reconnaissance visits have been made to five of these. Two lobes near Sham Wat, on Lantau Island, merge into a single body and this site, which has good access, was chosen for a detailed investigation which will be the subject of a full report in due course.
The investigation at Sham Wat was designed to establish the composition, thickness and nature of the contacts of the lobe in order to determine its origin. The work was carried out during January and February 1997 and comprised field mapping, boreholes, trial pits and sections. Thermoluminescence, carbon 14 and radiocaesium analysis of samples is planned and will attempt to extract dating information, with the intention of determining the length of
- 36 -
time over which the lobe was emplaced. Absolute age information may also help to determine the environmental conditions under which the deposit was formed. A provisional model for the formation of the Shum Wat debris lobe, based on the preliminary results of the site investigation, includes the occurrence of several large failures of massive coarse tuff, with enough fines incorporated from the weathered profile and adjacent mudstones to form a flow that emplaced large boulders far from their source.
8. LANDSLIDE SUSCEPTIBILITY EVALUATION AND HAZARD ZONING
8.1 Landslide Susceptibility Evaluation
Statistical methods of determining landslide susceptibility vary from the relatively simple, using two or three main determining factors, to the complex, which can involve calculating discriminant functions based on a very large number of factors. A short discussion of these different approaches follows.
Brabb (1984) describes early work based on computing the percentages of different geological units that had failed, with weightings applied for different slope angles. Brabb also describes how a more complex approach, involving the analysis of 12 factors for a database of over 2,000 landslides, determined that geological/soil unit and slope angle were the prime factors, with the only other factor apparently related to an increase in landslide probability being slope concavity.
Mark & Ellen (1995) used data on the distribution and frequency of shallow landslides in a region of uniform geology to model landslide initiation sites. Regression analyses on a database of 1,500 slides, using a DTM, showed that slides are more abundant on steep terrain, and that the correlation is statistically significant. This analysis was not able to detect any significant correlation with slope curvature.
Fernandez et al (1996) analysed an inventory of 134 slope movements in Southern Spain, and used determinant factor analysis to assess the significance of eighteen different variables. They concluded that the most significant factor overall was geological unit. A small subset of deep slides also showed a correlation with geological boundary zones, such as stratigraphical boundaries, faults and hydrogeological boundaries (especially permeable zones overlying impermeable zones). Irigary et al (1996) provide more detail on these analyses, and note that an observed correlation with vegetation may be fortuitous, as vegetation is closely linked to geology. If slides, debris flows and complex movements are considered, the most important factors are lithology and tectonic unit, followed by slope angle and illumination coefficient (related to aspect and slope angle). However, pure slope aspect was not a consistently important factor.
Finlay et al (1996) applied multivariate stepwise discriminant analysis (SDA) to a dataset of about 180 cut slopes in Hong Kong. The authors concluded that selection of variables by SDA may not always be best from a practical or engineering point of view, as the variables may not make physical sense.

- 37 -
8.2 Susceptibility Mapping for the NTLS
It is intended that susceptibility mapping for the NTLS will begin with a relatively simple ranking exercise based on mapped landslide densities. In order to carry out a susceptibility evaluation which is grounded in physical reality it is necessary to have defined parameters for which landslide densities vary both sufficiently to discriminate between areas of high and low susceptibility, and in a manner that is physically logical. Reference to Section 5 suggests that the parameters available to the NTLS which meet this criteria are geological group and 1:20,000-scale DTM-derived slope class. Parameters for which landslide densities appear to vary in a physically realistic manner, but for which the density ranges, or numbers of classes, are insufficient to discriminate in sufficient detail between areas of different susceptibility, are terrain component and landslide aspect.
It is intended that susceptibility mapping will begin with a relatively straightforward analysis of geological group/1:20,000-scale slope class distribution, with the susceptibility of each unit defined by the mapped landslide densities (both total and recent). Consideration may also be given to carrying out a more complex susceptibility analysis using multivariate discriminant function techniques and the parameters discussed above.
8.3 Hazard zoning
In parallel with the production of a natural terrain landslide susceptibility map, different techniques for natural terrain landslide hazard zoning are being evaluated. In contrast to a susceptibility map, a hazard map has to consider the probable size and impact of a landslide event. To produce a realistic model it is necessary to consider those factors which may result in an “average”, relatively small natural terrain landslide developing into a major event, and to evaluate the probable runout distance and the speed of the mobilised debris. These topics are being studied with the objective of producing workable hazard zoning techniques for Hong Kong.
Natural terrain landslide hazard zoning maps will identify the expected severity of various types of natural terrain hazard. These maps could form the basis of future requirements for developers (Government and private) with respect to investigations and submissions for new developments (see also Section 9.2). Hazard zoning maps will also assist the identification and prioritisation of areas close to existing developments which may require further investigation.
8.3.1 Hazard Zoning for Large Channelised Debris Flows
The largest natural terrain landslide studied in detail in Hong Kong was the Tsing Shan Debris Flow (TSDF), which occurred in September 1990 (King, 1996). This channelised debris flow began as a landslide with a volume of about 2,000m3, the debris from which eroded and entrained additional material to give a total debris volume of about 19,000m3, with a runout distance of about 1,100m. As discussed in Section 5.10, nearly 400 landslides in the NTLI have runout distances of more than 150m, and landslides such as these represent a greater hazard than the small slides and flows that dominate the NTLI.

- 38 -
King (1996) compared the TSDF with a later, smaller debris flood that occurred in a neighbouring catchment without developing into a large debris flow. He concluded that a number of characteristics of the landslide source and trail were instrumental in the development of the TSDF, and these characteristics were used to develop a proposed methodology for hazard zoning for large channelised debris flows (LCDFs).
King’s proposed hazard zoning methodology was based on the phased assessment of individual drainage lines at three levels, with each succeeding level requiring increasing geotechnical input and providing more detailed hazard assessments. Level 1 comprised a relatively fast and conservative provisional zoning to select all drainage lines in which a LCDF is even remotely possible. For these drainage lines crude hazard zones can be drawn based on the runout distance of the TSDF. A Level 2 assessment would be carried out if development was existing or proposed for an area within a hazard zone defined at Level 1. Level 2 hazard zoning uses the size of the catchment to estimate a design debris flow (Hungr et al, 1987), with detailed assessment of possible debris flow routes. A Level 3 assessment would be carried out only where development was existing or proposed within a hazard zone confirmed at Level 2. Level 3 hazard zoning would involve detailed assessment of possible landslide sources, together with examination of possible debris flow routes.
An updated methodology for LCDF hazard zoning is being prepared as part of Phase III of the NTLS. The various factors used to assess the probability of an LCDF occurring will be refined and weighted by comparison with other LCDFs, which will include the long runout and mobile landslides described in Section 5.9. Data on individual landslides from Tung Chung and South Lantau (Franks, 1996, and Wong et al, 1996) will also be used where appropriate.
8.3.2 Landslide Runout Distance Modelling
Runout distance prediction is an important part of landslide hazard assessment. Lau et al (1997) evaluated the various methods available and their applicability. Methods for the prediction of runout distances can be divided into empirical methods, physical scale modelling, and dynamic analyses. Brief notes summarising these methods follow:
(1) Empirical methods
(a) Volume-loss rate method. Based on the premise that as debris moves downslope, its volume and mass are being reduced through loss or deposition, and that the flow halts when the volume of the moving mass becomes negligible. The predicted run-out distance is very sensitive to the initial landslide volume used in the calculation.
(b) Angle of reach method. The angle of reach can be defined as the angle of the line connecting the head of the landslide scar to the distal margin of the displaced mass. The angle of reach is a function of the initial landslide volume, and empirical relationships are developed for specific areas from regional or local databases.

- 39 -
(c) Channel geometry method. An empirical method for predicting the deposition of coarse-textured debris flows in confined channels, based on the geometry of the channel network.
(d) Geometrical method. Slow iterative process using flow profiles which are hard to establish.
(2) Physical scale models. Application to regional hazard assessment is impractical.
(3) Dynamic analyses
(a) Continuum models. These are very sophisticated, and provide all of the information required for landslide hazard assessment. Rheological models have to be selected, and the required rheological parameters determined by use of laboratory methods or back-analysis of landslides. Very time consuming and complicated. Suitable for research, but not suitable for regional studies.
(b) Lumped mass models. These are much simpler than continuum models, and consider the debris mass as a single point, ignoring the effects of internal deformation, channel shape and channel erosion. The sled model is simple to use and provides all the information required for landslide hazard assessment. To apply this method the apparent friction angle of the debris along the sliding plane is required. The model assumes that all energy loss during debris movement is caused by friction. The sliding-consolidation model requires pore-pressure parameters and debris thickness. The improved sled model has the same requirements as the sliding-consolidation model.
The volume-loss rate and angle of reach methods are easy to use, although the initial landslide mass has to be defined and some assumptions have to be made to estimate velocity and acceleration. If it is assumed that the angle of reach and the apparent friction angle for a given landslide are almost the same, then the angle of reach and the sled models become identical, allowing the procedures used in the sled model to calculate debris velocity and acceleration to be applied to both the angle of reach and the volume-loss rate methods.
Franks (1996) compiled a database of natural terrain landslides in the Tung Chung area of Lantau, making field observations of various landslide parameters. This database was used to perform a preliminary evaluation of the applicability of the volume-loss rate method and the angle of reach method. With reference to the extent of surface water influence, the movement classification of Wong et al (1996) was used - gravitational, mixed or hydraulic flow. Since the number of landslides in the Tung Chung database is limited, the mixed and hydraulic movement classes were combined into one (called hydraulic). Step-wise multivariate regressions were performed to determine the empirical volume-loss rate and angle of reach equations for the two classes of debris movement. The effects of each variable of the resulting

- 40 -
regression equations were evaluated based on their physical contributions. Based on the results of the evaluation, the regression equations for the volume-loss rate method were discarded. The regression equations derived from the Tung Chung database using the angle-of-reach method were then used to predict the landslide parameters measured by Wong et al (1996) for a second database of landslides in the South Lantau area. The predicted and measured angles-of-reach are plotted in Figure 22. These results are encouraging, although further work is needed to refine the model.
8.4 Quantitative Risk Assessment
In general terms, landslide risk may be defined as probability times consequence. Quantitative Risk Assessment (QRA) is a method of quantifying risk through systematic examination of the factors contributing to the landslide hazard and affecting the severity of landslide consequence, their interaction and relative contribution to the occurrence of the landslide. The QRA process permits the order of risk posed by a landslide hazard to be evaluated, and can serve as a decision-making tool.
Landslide hazard and risk assessment are dominated by uncertainties. The nature of the uncertainties involved in the factors which trigger landslides and their consequences are varied and can include: parameter uncertainty; model uncertainty; and human uncertainty. Uncertainties arise at all stages of the problem, from site characterisation and material property evaluation to analysis and consequence assessment. In principle, the uncertainties inherent in the problem are considered in a systematic way during the QRA process.
The QRA technique is well established in many fields, particularly those relating to technological processes such as chemical engineering and hazardous materials processing. The application of QRA to landslide risk is relatively new and still under development. While the basic risk assessment concepts and tools (e.g. fault trees and event trees) can be used, the methodologies need to be adapted for landslide work. The GEO has carried out an initial assessment of the application of these techniques to natural terrain hazards in Hong Kong (Golder Associates, 1996). Further development is needed.
If a defensible risk management policy can be formulated for natural terrain landslide hazards by using QRA and cost benefit analysis this is obviously desirable. Such an approach may facilitate the identification of optimal risk mitigation strategies, which would depend on assessed risk and tolerable risk levels (which have yet to be established). For example, assessment of the risk from natural terrain landslides, as opposed to man-made slopes and retaining walls, should enable the appropriate allocation of resources, and might also assist in delineating those areas where priority action is required.
In the context of landslides on natural terrain, the key objectives of QRA studies should be as follows:
(a) to assess the overall level of natural terrain landslide risk,
(b) to examine the cost-effectiveness of different risk mitigation strategies,

- 41 -
(c) to evaluate tolerable risk levels,
(d) to identify factors affecting landslide risk, and
(e) to identify areas for improvement in landslide risk management.
It must be realised that QRA is only an engineering tool, and the limitations of the technique have to be recognised. Hazards from natural terrain landslides are more difficult to assess than those from man-made slopes as they may involve a greater number of failure mechanisms and modes of debris movement. It is therefore important that a realistic hazard model be developed, as this is a prerequisite for QRA studies.
9. MITIGATION OF NATURAL TERRAIN LANDSLIDE HAZARDS
The mitigation of natural terrain landslide hazards is discussed by Franks & Woods (1997). Strategies for controlling or mitigating against the effects of natural terrain landslides can be broadly classified as active/physical or passive/non-physical (Jochim et al, 1988). Active measures can be further subdivided into source area stabilisation and flow path/deposition area protective works. The adoption of a mitigation strategy and the design of specific mitigation measures requires a detailed consideration of the type, distribution and size of the potential landslide. Source area stabilisation is usually difficult as it requires the identification of the precise area of the potential instability. It is often more practicable to mitigate against the effects of natural terrain landslides by means of protective works in the anticipated flow path or deposition area.
9.1 Active Mitigation Measures
An active strategy is often the only means for protecting existing developed land. It should be remembered that if an event occurs which is greater than that for which the active measures have been designed, the consequences could be very great. There is a wide range of active mitigation measures available for various situations, and these have been usefully described and summarised by Jochim et al (1988) and Wold & Jochim (1989). The most appropriate measures will vary between different landslide types (Table 23).
9.1.1 Source Area
Source area stabilisation works are designed and constructed to prevent landslides starting. These works reduce water infiltration and surface water erosion, increase shear strength of the slope materials or reduce groundwater pressures.
(1) Surface and sub-surface drainage. Drainage of man-made slopes is covered in detail in the Geotechnical Manual for Slopes (GCO, 1984), and design details are similar when applied to natural slopes. For surface drainage the catchment characteristics control the design. Sub-surface drainage measures include cut-off drains, horizontal drains, drainage galleries, counterfort drains and vertical wells. Design requires a knowledge of the existing

- 42 -
groundwater levels and rainfall-induced responses. Post-construction monitoring may be an important aspect of sub-surface drainage works, and the designer needs to consider carefully the resources required for this.
(2) Erosion protection. Erosion protection using shotcrete or chunam is restricted in practice to relatively small and easily identifiable source areas. In Japan, hillside works are carried out extensively to provide protection to slopes prone to debris flows, use terracing, catchwaters and tree planting in various combinations, and are collectively referred to as sabo works (Figure 23). Variations of these techniques are also used in the USA and Canada. The use of vegetation for erosion control is covered by a number of publications, e.g. GCO (1984), Crozier (1986) and ICE (1994).
(3) Other methods. Other methods of stabilising potential source areas include removal of unstable materials or slope unloading, increasing insitu strength, and providing support. Removal of unstable materials is possible where source areas can be precisely identified. Methods available for increasing insitu strength include soil nailing or reticulated piling (suitable for weak rock and soil), grouting, or chemical treatment. These methods are relatively expensive and suffer from the uncertainties associated with the identification of potential source areas.
9.1.2 Debris Trail and Deposition Areas
Works in the predicted debris trail and deposition areas are designed and constructed to reduce the energy of the mobilised debris, or to control the movement of the debris along the debris trail in order to reduce its erosive power and promote deposition away from the elements at risk. Typical works include check dams, slit dams, screens, sacrificial piles and flow impediments, deposition areas, channel works (including deflection walls and berms) and containment structures.
(1) Check dams. Check dams are usually constructed in drainage lines in a series, forming a stepped channel, to stabilise sections which, if eroded during transport of a channelised flow, could contribute to the overall debris volume. The velocity of water and slurry flow, and its erosive power, is reduced by the check dams which can be constructed from concrete, metal, masonry, gabions or timber. Check dams are usually constructed within the transport section of the assumed debris trail, but are sometimes used on the upper parts of the potential deposition area. Debris that collects behind check dams acts to stabilise slopes immediately upstream of the dam, and is not usually removed. Drainage holes or galleries are incorporated into the structure to allow the passage of normal stream flows. Design considerations for check dams include the likely flow path immediately upstream of the structure, and the maximum probable discharge of the channelised debris flow at the dam location. Check dams are usually designed as gravity structures to resist dynamic and point impact forces, sliding, overturning, uplift pressures and foundation and abutment loads. Design manuals have been published in Austria, Japan and Switzerland. Check dams are usually less than 5m in height (VanDine, 1996). Factors influencing the spacing of check dams are shown in Figure 24 and include stream gradient, dam height and angle of deposition behind the dam.
(2) Unconfined deposition areas. The simplest form of active mitigation is an

- 43 -
unconfined deposition area (Figure 25) designed and prepared to receive a portion or all of the debris from a debris flow. Design considerations include the potential debris volume, probable flow paths, runout distances and storage angles. Once a debris flow has occurred the deposition area must be cleaned out in preparation for any subsequent flows.
(3) Flow impediments. Impediments to flow (baffles) are used to slow down debris flows and encourage deposition (Figure 26). Baffles can be either natural (such as trees) or artificial (such as earth berms, timber or steel piles, or catch fences). Design considerations include the potential volume of debris, flow paths, runout distances and impact forces. Baffles are designed to be sacrificial and to be rebuilt or replaced after use, and are often combined with other methods.
(4) Deflection walls and berms. Lateral deflection walls are usually constructed in the transport part of the debris trail parallel to the potential debris flow path, and are used to constrain the lateral movement of the debris (Figure 27). These structures should be designed with a freeboard above the estimated maximum flow depth, and are usually constructed of concrete or earth, although forest belts can perform a similar function. The main design consideration is the maximum probable debris volume and flow depth at the location of the structure.
(5) Containment structures. Terminal walls, berms or barriers (Figure 28) can be constructed across the predicted path of a debris flow to encourage deposition by increasing the flow path length. These structures are usually located as far as possible downstream from the probable apex of the debris fan to maximise the runout distance and deposition area and minimise impact forces and run-up. Containment structures are usually built with a deposition area or containment basin excavated upstream. The excavated containment basin lowers the stream gradient, increases storage capacity, and decreases runout distances, impact forces and run-up. As they are basically gravity structures, the main design criteria for containment structures are impact, overturning and sliding forces.
9.1.3 Selection of Appropriate Active Measures
The selection and design of active mitigation measures requires an assessment of the mechanisms of transport, erosion and deposition predominating within the source area, the debris trail and the deposition area. The probable location of these zones also has to be estimated. The first step in assessing whether mitigation measures are required for a given site, and if so of what nature, is the identification of the range of landslide hazards potentially liable to impact the site. This will involve detailed analysis of the terrain, geology, geomorphology and elements at risk in order to select and design appropriate mitigation measures.
(1) Debris slides. Source area stabilisation strategies for debris slides mainly rely on slope drainage and the reduction of rainfall infiltration, but can also include increasing the shear strength of the insitu material. Typical measures include revegetation or surface protection (over large areas if necessary), or more site-specific measures such as horizontal or vertical drainage, chemical and/or cement grouting, sub-surface drainage cut-off walls, unloading by excavation, and soil nailing. However, locating potential source areas is labour intensive, difficult and often subjective, and the cost benefit of site specific source stabilisation is usually prohibitive, unless the hazards and perceived risks are high. Suitable downslope mitigation

- 44 -
measures for debris slides include debris fences, sacrificial piles, deflection walls and berms (Montgomery et al, 1991). For Hong Kong, revegetation or reforestation combined with surface and/or sub-surface drainage may be appropriate for the stabilisation of relatively large source areas assessed as being at risk from sliding failures.
(2) Non-channelised debris flows. Deposition from non-channelised debris flows generally begins at the sides of the debris trail and gradually develops as a debris fan in the deposition area. Suitable mitigation measures include energy dissipators, deflectors and containment structures which all act to induce deposition to take place away from the elements at risk. Hillside works may be applicable in Hong Kong, together with flow control and containment structures in potential deposition areas.
(3) Channelised debris flows. This type of landslide is very common in Canada, where debris volumes may reach 50,000m3 (Hungr et al, 1984 & 1987), and in Japan, where volumes tend to be much larger - 10,000m3 to 500,000m3 (Ikeya, 1977; Ohishi, 1985). Large debris flows require extensive active mitigation in the form of energy dissipation and flow control structures within the debris channel and deposition area, often combined with source area stabilisation (Hungr, 1993). Large channelised debris flows, representing a severe hazard, can occur in Hong Kong, although they are relatively uncommon. The largest debris flow conclusively identified in Hong Kong is the Tsing Shan debris flow of 1990, which had a debris volume of about 20,000m3 (King, 1996). Franks (1996) described debris flows of up to 3,500m3 on North Lantau. Deposition from channelised debris flows is triggered by a number of factors, including decreasing channel gradient, loss of debris confinement and obstructions to flow. The most effective means of mitigation are those which induce deposition by encouraging dewatering within the debris trail and deposition area. Measures include energy dissipation and flow control works such as dykes (Nasmith & Mercer, 1979), slit dams (Johnson & McCuen, 1989 - see Figure 29), check dams, deflection walls, sacrificial piles and baffles within the debris trail, and deflection and containment structures such as containment basins, berms and walls within the deposition area. Channelised debris flows in Hong Kong can be large enough to warrant energy dissipation within the debris trail, and containment structures in the deposition area, to protect elements at risk. Hazards from smaller volume debris flows could be mitigated against by combinations of hillside works and debris trail measures. Following the Tsing Shan Debris Flow in 1990 a debris containment basin was formed across the lower reaches of the debris fan area by constructing a fill embankment some 3m high, 9m wide and 200m long. The containment basin provides protection to a golf driving range.
9.2 Passive Mitigation Measures
Passive mitigation strategies require avoidance of the hazard. This is primarily a land use planning process (see Table 24) and a number of measures are available through the use of legislation, land use control, insurance and education.
(1) Government policy on natural terrain hazards. Current Government policy for dealing with natural terrain landslide hazards is contained in two GEO public documents - the Geotechnical Manual for Slopes (GCO, 1984) and GEO Information Note No. IN 2/96. The former is a manual which provides guidelines on good practice in geotechnical engineering. The manual sensibly states that in view of the marginal stability of many areas of steep natural terrain, avoidance of such areas is often the best policy. The GEO Information Note indicates

- 45 -
that, in the case of boulder/rock fall hazards, preventive action is only warranted in cases of `immediate and obvious danger’. The Geotechnical Manual for Slopes also draws attention to the need to be aware of the possible presence of potentially unstable boulders. Neither of these documents carries any statutory weight.
(2) Planning documents. Planning Department prepares a variety of planning documents at different scales, ranging from the whole of Hong Kong to individual districts plans. These documents are circulated throughout Government for comment before promulgation and, during this process, the GEO has the opportunity to draw attention to any areas which may be subject to or threatened by natural terrain hazards. In the early 1980s the then Geotechnical Control Office carried out a terrain mapping exercise (the GASP study) and produced maps of Hong Kong showing anticipated geotechnical constraints on development. The GASP maps do not predict landslide hazard downslope from areas of instability. These documents were distributed widely throughout Government and are also available for purchase by the public.
(3) Vetting of planned development proposals. Under the Buildings Ordinance, the GEO is empowered to vet private development proposals to ensure that geotechnical works are designed and constructed to accepted standards. The GEO also checks Government Departmental development proposals. However, checking has in the past usually been confined to works within development boundaries. Works required outside development boundaries have generally involved the assignment of a `green-hatched-black’ area as a condition of land sale or land modification. Such areas remain as Government property, but the owner is required to implement and subsequently maintain works within them. These areas rarely extend far beyond development boundaries.
(4) Possible statutory and administrative amendments. The source areas of natural terrain landslide hazards are generally on unallocated Government Land well away from development boundaries. Although the GEO can draw attention to such hazards, and recommend that assessments and mitigation works be carried out, it is not in a position to enforce such advice. Under the current Buildings Ordinance, Government cannot compel a private developer to undertake works outside his property boundary. Equally, the GEO is not in a position to force another Government Department to undertake such works, although compliance would be expected in the interests of public safety. If natural terrain landslide hazards are to be addressed in the future, amendments to the Buildings Ordinance (for private developments), and administrative directives (for Government developments) will be required.
10. CONCLUSIONS
(a) The most appropriate methodology available at present for regional natural terrain landslide susceptibility mapping and hazard zoning in Hong Kong appears to be a combination of simple statistics and physical process evaluation.
(b) Assessment and checking of the Natural Terrain Landslide Inventory has shown that this set of data forms a suitable basis for susceptibility evaluation and hazard zoning at a regional scale.
- 46 -
(c) The analyses carried out to date have shown that, of the various parameters available within the NTLS GIS, geological group and 1:20,000-scale DTM-derived slope angle class can be regarded as the primary measures of natural terrain landslide susceptibility on a regional basis. Terrain component and slope aspect may be secondary factors.
(d) Geological strata which appear to be particularly susceptible to natural terrain landsliding include rhyolitic and dacitic lavas, jointed tuffs, layered sequences of volcaniclastic rocks and lavas, and layered sedimentary sequences.
(e) The most susceptible slopes are generally those with angles of approximately 35° to 40°.
(f) Of the 8,804 landslides within the NTLI classified as recent (less than about 50 years old), 204 (2.3%) had a plan runout distance of more than 150m, and 34 (0.4%) had a plan runout distance of more than 300m. Occasional much larger landslides may have occurred in the geological past, but there is, as yet, no conclusive evidence of this.
(g) Analyses of rainfall and landslide data suggest that a rainfall event affecting perhaps 20% to 50% of Hong Kong, and with the potential to trigger a high density (more than 10/km2) of natural terrain landsliding in susceptible areas, can be expected, on average, every two years.
(h) Active (physical) measures to mitigate against natural terrain landslides are in use worldwide. Administrative and legislative controls on development also have to be considered.
11. FURTHER WORK
Phase III of the NTLS has started and comprises, inter alia, the following:
(a) The production of regional natural terrain landslide susceptibility maps.
(b) The production of regional natural terrain landslide hazard zoning maps.
(c) The identification and detailed study of a small number of high priority areas that appear to be particularly susceptible to natural terrain landsliding and that are located close to existing or proposed developments. These studies will
- 47 -
involve detailed hazard and risk assessments, and determination of possible mitigation measures and probable costs.
(d) The development of procedures for the hazard and risk assessment of natural terrain in Hong Kong.
(e) The investigation of hydrological and hydrogeological influences on natural terrain landsliding susceptibility and hazard.
(f) The continuation of studies into the nature, occurrence and frequency of unusually large natural terrain landslides in Hong Kong.
12. REFERENCES
Au, S.W.C. (1993). Rainfall and slope failure in Hong Kong. Engineering Geology, vol. 36, pp 141-147.
Bennett, J. D. (1984). Review of Superficial Deposits and Weathering in Hong Kong. Geotechnical Control Office, Hong Kong, GCO Publication 4/84.
Brabb, E. (1984). Innovative approaches to landslide hazard and risk mapping. Proceedings of the Fourth International Symposium on Landslides, Toronto, vol. 1, pp 307-323.
Brand, E.W., Premchitt, J. & Phillipson, H.B. (1984). Relationship between rainfall and landslides in Hong Kong. Proceedings of the Fourth International Symposium on Landslides, Toronto, 1984, pp 377-384.
Cannon, S.H. (1989). Regional rainfall-threshold conditions for abundant debris-flow activity. In: S.D. Ellen & G.F. Wieczorek (eds), Landslides, Floods and Marine Effects of the Storm of January 3-5, 1982, in the San Francisco Bay Region, California. US Geological Survey Professional Paper 1434, pp 35-42.
Cannon, S.H. & Ellen, S.D. (1989). Rainfall that resulted in abundant debris-flow activity during the storm. In: S.D. Ellen & G.F. Wieczorek (eds), Landslides, Floods and Marine Effects of the Storm of January 3-5, 1982, in the San Francisco Bay Region, California. US Geological Survey Professional Paper 1434, pp 27-33.
Chan, W.L. (1995). Hong Kong Rainfall and Landslides in 1993. Engineering Office, Hong Kong, GEO Report No. 43, 214p.
Geotechnical
Chan, W.L. (1996). Hong Kong Rainfall and Landslides in 1994. Engineering Office, Hong Kong, GEO Report No. 54, 161p.
Geotechnical
- 48 -
Chen, P.K.H. (1993). Hong Kong Rainfall and Landslides in 1992. Geotechnical Engineering Office, Hong Kong, GEO Report No. 35, 201p.
Collison, A.J.C. & Anderson, M.G. (1996). Using a combined slope hydrology/stability model to identify suitable conditions for landslide prevention by vegetation in the humid tropics. Earth Surface Processes and Landforms, vol. 21, pp 737-747.
Crozier, M. J. (1986). Landslides - Causes, Consequences and Environment. Routledge, London. 252p.
Cruden, D.M. & Varnes, D.J. (1996). Landslide Types and Processes. In: R.L. Shuster and A.K. Turner (eds), Landslides, Investigation and Mitigation, Transportation Research Board Special Report 247, National Academy Press, Washington. pp 36-75.
Evans, N.C. (1992). Hong Kong Rainfall and Landslides in 1991. Geotechnical Engineering Office, Hong Kong, GEO Report No. 20, 76p.
Evans, N.C. (1996). Natural Terrain Landslide Study: Rainfall Distribution and Orographic Effects in Hong Kong. Geotechnical Engineering Office, Hong Kong, Discussion Note DN 3/96, 30p.
Evans, N.C. (1997). Natural Terrain Landslide Study: Preliminary Assessment of the Influence of Rainfall on Natural Terrain Landslide Initiation. Geotechnical Engineering Office, Hong Kong, Discussion Note DN 1/97, 28p.
Fernandez, T., Irigaray, C. & Chacon, J. (1996). Inventory and analysis of landslide determinant factors in Los Guajanes Mountains, Grenada (Southern Spain). In: Senneset (ed), Landslides. Balkema, Rotterdam, pp 1891-1896.
Finlay, P.J., Mostyn, G. & Martin, R.P. (1996). Use of discriminant functions in assessing the probability of slope failure. In: Senneset (ed), Landslides. Balkema, Rotterdam, pp 209-214.
Fourie, A.B. (1996). Predicting rainfall-induced slope instability. Geotechnical Engineering, Institution of Civil Engineers, vol. 119, pp 211-218.
Franks, C.A.M. (1996). Study of Rainfall Induced Landslides on Natural Slopes in the Vicinity of Tung Chung New Town, Lantau Island. Geotechnical Engineering Office, Hong Kong, Special Project Report SPR 4/96, 97p.
Franks, C.A.M. & Woods, N.W. (1997). Preliminary Review of Natural Terrain Landslide Hazard Mitigation Measures. Geotechnical Engineering Office, Hong Kong, Technical Note, (in prep).
Geotechnical Control Office (1984). Geotechnical Manual for Slopes. Hong Kong Government Printer, 295p.

- 49 -
Golder Associates (1996). Development of a Quantitative Risk Assessment Methodology for Landslides on Natural Terrain in Hong Kong. Agreement GEO 9/95. Submitted to Geotechnical Engineering Office, Hong Kong.
Hansen, A. (1984). Engineering geomorphology: the application of an evolutionary model of Hong Kong's terrain. Zeitschrift fur Geomorphologie, N.F. Suppl.-Bd 51, pp 39-50.
Hungr, O. (1993). Flood and Debris Flow Mitigation for Proposed Whistler Creek Redevelopment. In: A.G. Chantler (ed), Building a City in the Mountains, Canadian Water Resources Association, pp 97-103.
Hungr, O., Morgan, G.C. & Kellerhals, R. (1984). Quantitative analysis of debris torrent hazards for design of remedial measures. Canadian Geotechnical Journal, vol. 21, pp 663-677.
Hungr, O., Morgan, G.C., VanDine D.F & Lister, D.R. (1987). Debris flow defences in British Columbia. Reviews in Engineering Geology, vol. 7, pp 201-222.
Hutchinson, J.N. (1992). Landslide hazard assessment. Proceedings of the Sixth Symposium on Landslides, Christchurch, New Zealand, vol. 3, pp 1805-1841.
ICE (1994). Vegetation and Slopes - Stabilisation, Protection and Ecology. Thomas Telford Services Ltd., London.
Ikeya, H. (1976). Introduction to Sabo Works. Japan Sabo Association, Tokyo. 168p.
Irfan, T.Y. (1996). Mineralogy and Fabric Characterization and Classification of Weathered Granitic Rocks in Hong Kong. Geotechnical Engineering Office, Hong Kong, GEO Report No. 41, 158p.
Irfan, T.Y. (1997). Mineralogical and Fabric Characterization and Classification of Weathered Volcanic Rocks in Hong Kong. Geotechnical Engineering Office, Hong Kong, Special Project Report SPR 1/97, 110p.
Irigaray, C., Fernandez, T. & Chacon, J. (1996). Inventory and analysis of determining factors by a GIS in the northern edge of the Grenada Basin (Spain). In: Senneset (ed), Landslides. Balkema, Rotterdam, pp 1915-1921.
Jochim, C.L., Rogers, W.P., Truby, J.O., Wold, R.L., Weber, G. & Brown, S.P. (1988). Colorado Landslide Hazard Mitigation Plan. Colorado Geological Survey Bulletin 48, Department of Natural Resources, Denver, Colorado, 148p.
Johnson, P.A &. McCuen, R.H. (1989). Slit dam design for debris flow mitigation. Journal of Hydraulic Engineering, ASCE, vol. 115, pp 1293-1296.
King, J.P. (1996). The Tsing Shan Debris Flow, Vol.1. Geotechnical Engineering Office, Hong Kong, Special Report SPR 6/96, 427p.
- 50 -
Kwan, W.K. & Lee, B.Y. (1984). 30-Year Mean Rainfall in Hong Kong, 1953 - 1982. Royal Observatory, Hong Kong , Technical Note No. 70, 23p.
Lam, C.C. & Leung, Y.K. (1994). Extreme Rainfall Statistics and Design Rainstorm Profiles at Selected Locations in Hong Kong. Royal Observatory, Hong Kong, Technical Note No. 86.
Lau, K.C., King, J.P. & Woods, N.W. (1997). Review of Methods for Predicting the Travel Distance of Debris from Landslides on Natural Terrain. Geotechnical Engineering Office, Hong Kong, Technical Note, (in prep).
Lumb, P. (1975). Slope failures in Hong Kong. Quarterly Journal of Engineering Geology, vol. 8, pp 31-65.
Mark, R.K. & Ellen, S.D. (1995). Statistical and simulation models for mapping debris flow hazard. In: A Carrara & F. Guzetti (eds), Geographical Information Systems in Assessing Natural Hazards, Kluwer, The Netherlands, pp 93-106.
Mark, R.K. & Newman, E.B. (1989). Rainfall totals before and during the storm: distribution and correlation with damaging landslides. In: S.D. Ellen & G.F. Wieczorek (eds), Landslides, Floods and Marine Effects of the Storm of January 3-5, 1982, in the San Francisco Bay Region, California. US Geological Survey Professional Paper 1434, pp 17-26.
Montgomery, D.R., Wright, R.H. & Booth, T. (1991). Debris flow hazard mitigation for colluvium-filled swales. Bulletin of the Association of Engineering Geologists, vol 28, no. 3, pp 303-323.
Nasmith, H.W. & Mercer, A.G. (1979). Design of dykes to protect against debris flows at Port Alice, British Columbia. Canadian Geotechnical Journal, vol. 16, pp 748-757.
Ohishi, M. (1985). Erosion Control Works in Japan. The Japan Sabo Association, 67p.
Peterson, P. & Kwong, H. (1981). A Design Rain Storm Profile for Hong Kong. Royal Observatory, Hong Kong , Technical Note No. 58, 30p.
Premchitt, J., Brand, E.W. & Chen, P.Y.M. (1994). Rain-induced landslides in Hong Kong, 1972-1992. Journal of the Hong Kong Institution of Engineers, June 1994, pp 43-51.
Premchitt, J. (1991a). Rainfall and Landslides in 1985. Geotechnical Engineering Office, Hong Kong, GEO Report No. 2, 108p.
Premchitt, J. (1991b). Rainfall and Landslides in 1986. Hong Kong, GEO Report No. 3, 113p.
Geotechnical Engineering Office,
Premchitt, J. (1991c). Rainfall and Landslides in 1987. Hong Kong, GEO Report No. 4, 101p.
Geotechnical Engineering Office,

- 51 -
Premchitt, J. (1991d). Rainfall and Landslides in 1988. Geotechnical Engineering Office, Hong Kong, GEO Report No. 5, 64p.
Ruxton, B.P. (1980). Slope problems in Hong Kong - a geological appraisal. Hong Kong Engineer, June 1980, pp 31-39.
Siu, K.L. (1991). Hong Kong Rainfall and Landslides in 1989. Geotechnical Engineering Office, Hong Kong, GEO Report No. 6, 114p.
Soeters, R. & van Westen, C.J. (1996). Slope instability, analysis and zonation. In: A.K. Turner & R.L. Schuster (eds). Landslides, Investigation and Mitigation, pp 129-177. Special Report 247, Transportation Research Board, National Research Council, pp129-177.
Styles, K.A. & Hansen, A. (1989). Geotechnical Area Studies Programme, GASP Report XII. Geotechnical Control Office, Hong Kong.
Tang, K.Y. (1992). Hong Kong Rainfall and Landslides in 1990. Geotechnical Engineering Office, Hong Kong, GEO Report No. 14, 78p.
VanDine, D.F. (1996). Debris Flow Control Structures for Forest Engineering, Research Branch, British Columbia Ministry of Foerests, Working Paper No. 22, 68p.
Wold, R.L. & Jochim, C.L. (1989). Landslide Loss Reduction: A Guide for State and Local Government Planning, Federal Emergency Management Agency, USA, Earthquake Hazards Reduction Series 52, 50p.
Wong, H.N., Chen, Y.M. & Lam, K.C. (1996). Factual Report on the November 1993 Natural Terrain Landslides in Three Study Areas on Lantau Island. Geotechnical Engineering Office, Hong Kong, Special Project Report, SPR 10/96.
Wong, H.N. & Ho, K.K.S. (1996). Thoughts on the Assessment and Interpretation of Return Periods of Rainfall. Geotechnical Engineering Office, Hong Kong, Discussion Note DN 2/96, 19p.
Wright, R.H., Campbell, R.H. & Nilsen, T.H. (1974). Preparation and use of isopleth maps of landslide deposits. Geology, vol. 2, pp 483-485.
- 52 -
LIST OF TABLES
Table Page No. No.
and Groups
Categories and Groups
Geological Categories
Angle Classes
Between Terrain Components
Between Erosion Classes
Between Geological Categories and Groups
1 Map Sheets with Non-Standard Surveying 54
2 Distribution of Landslides by Year and Vegetation Cover 55
3 Results of the Recognition Factor Survey 56
4 Width Classes of Relict and Recent Landslides 57
5 Distribution of Landslides Between Terrain Components 58
6 Distribution of Landslides Between Erosion Classes 59
7 Geological Categories and Groups 60
8 Distribution of Landslides Between Geological Categories 61
9 Distribution of Gullied Terrain Between Geological 63
10 Head Slope Angle Class (1:5,000-scale) Distribution, 65
11 Distribution of Landslides Between 1:20,000-scale Slope 66
12 Distribution of Landslides Between Elevation Classes 66
13 Distribution of Slope Aspect 67
14 Distribution of Landslides Between Vegetation Classes 68
15 Distribution of Long Runout and Mobile Landslides 69
16 Distribution of Long Runout and Mobile Landslides 70
17 Distribution of Long Runout and Mobile Landslides 71
18 Distribution of Long Runout and Mobile Landslides 73 Between 1:5,000-scale Head Slope Angle Classes

- 53 -
Table Page No. No.
19 Distribution of Long Runout and Mobile Landslides 74 Between Vegetation Classes
20 Possible Rolling 24-hr Rainfall Thresholds for Natural 75 Terrain Landsliding
21 Approximate Return Periods for Threshold Rainfall 75
22 Frequency of Landsliding on Sheet 13NE-A 76
23 Active Mitigation Measures and Range of Application 77
24 Passive Mitigation Measures and Range of Application 77
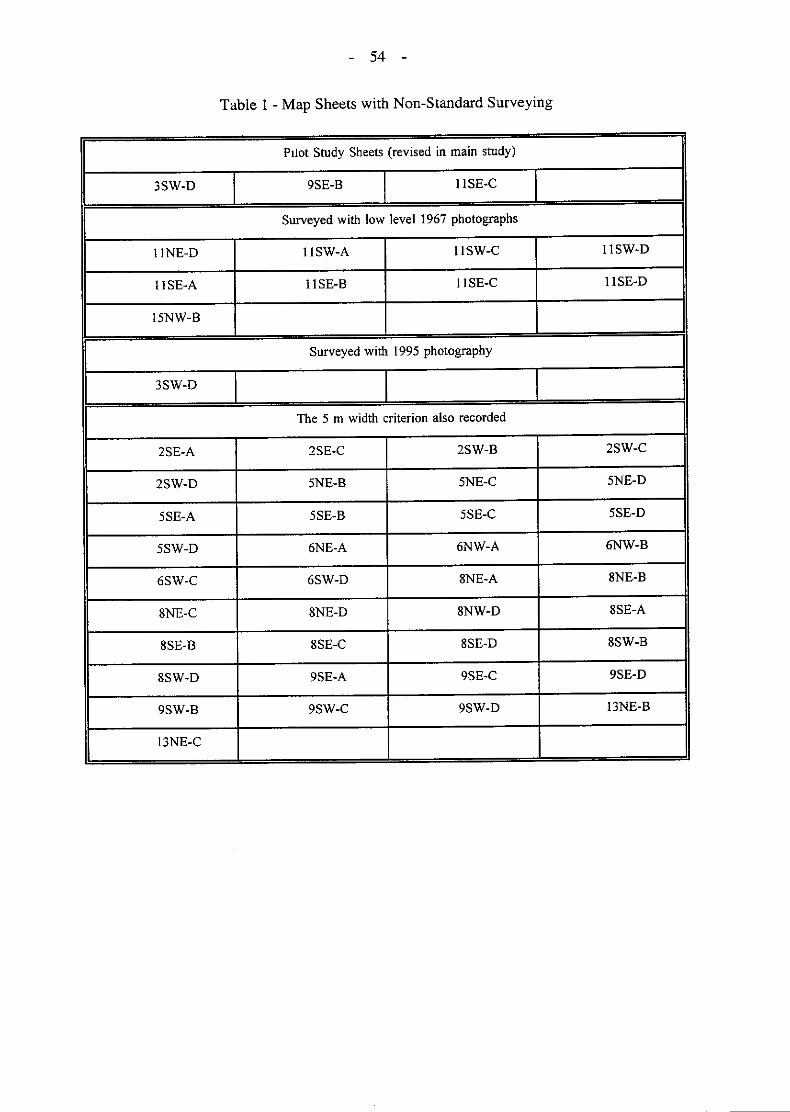


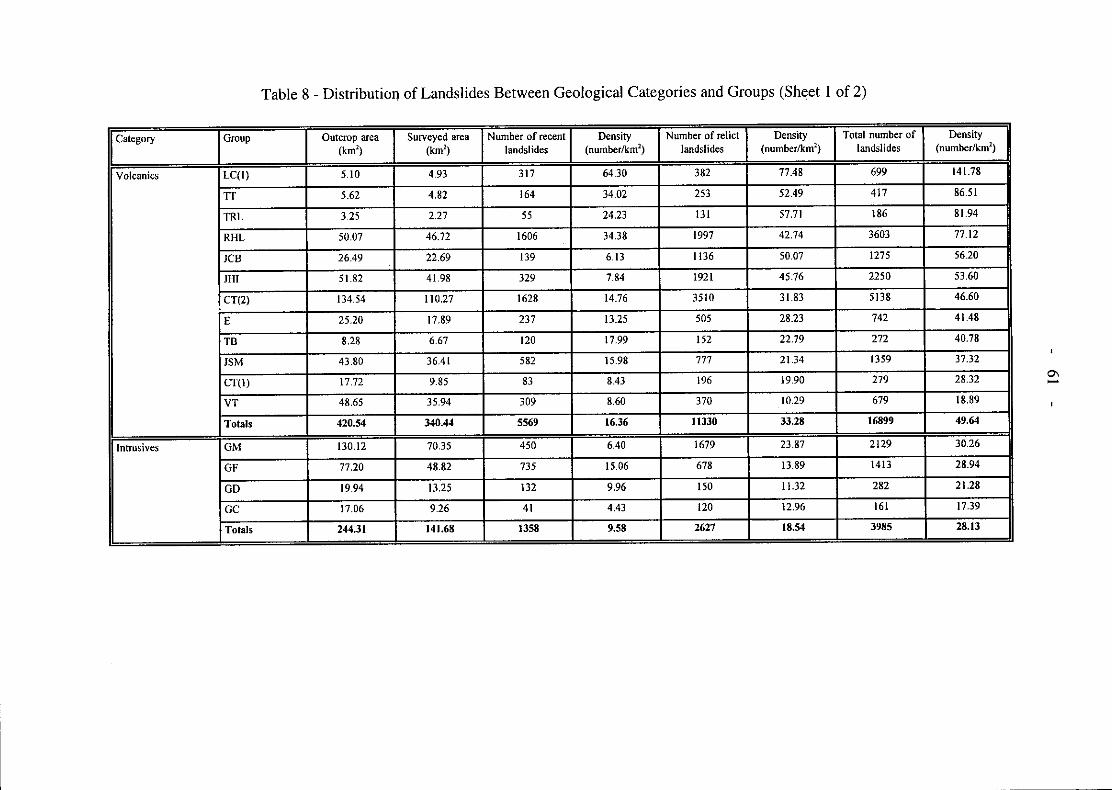

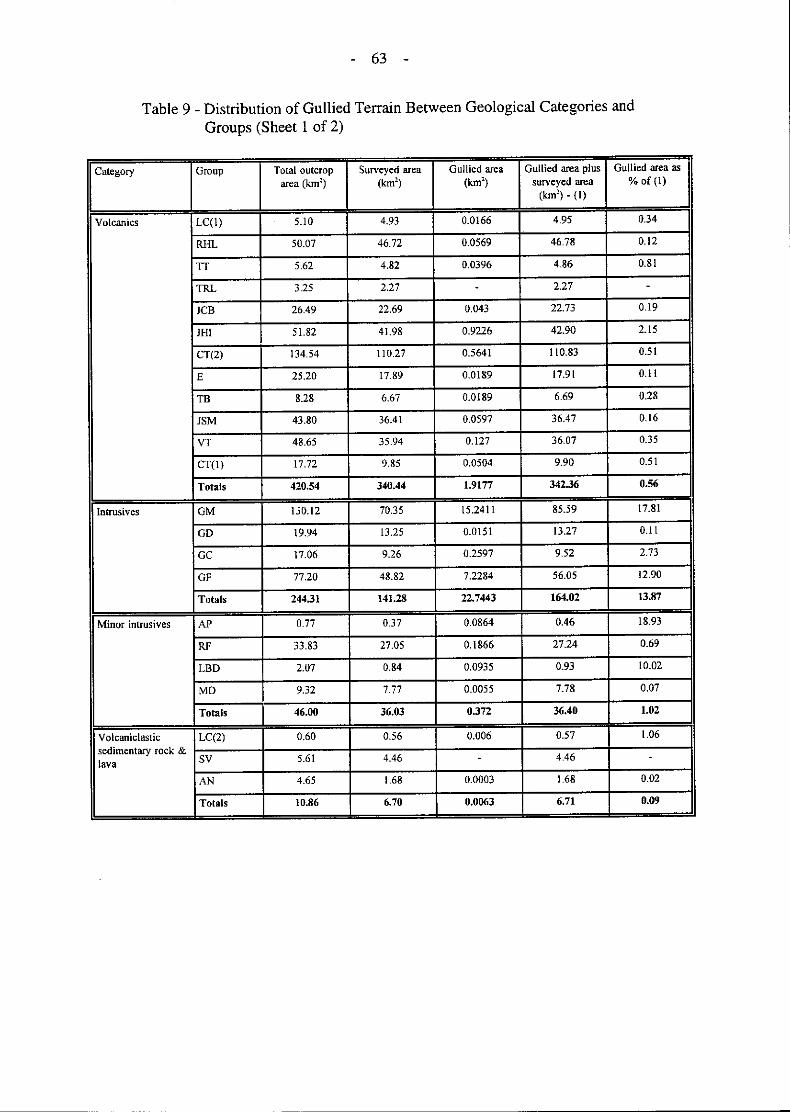

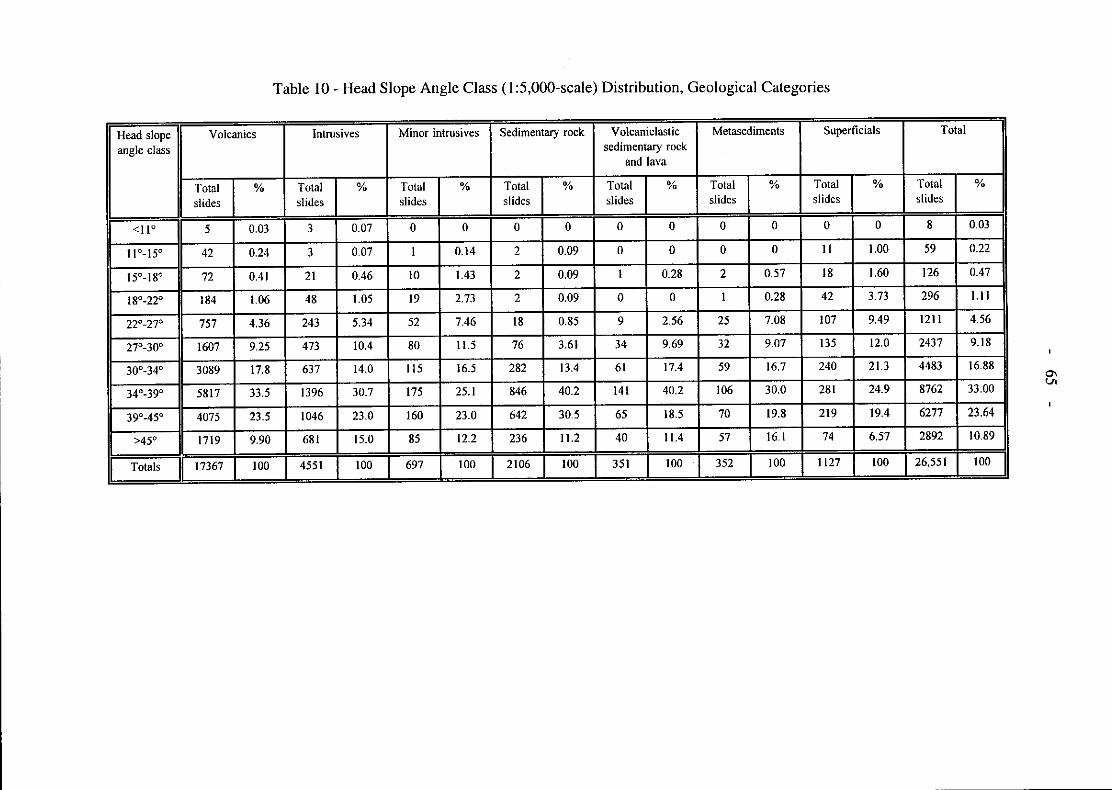


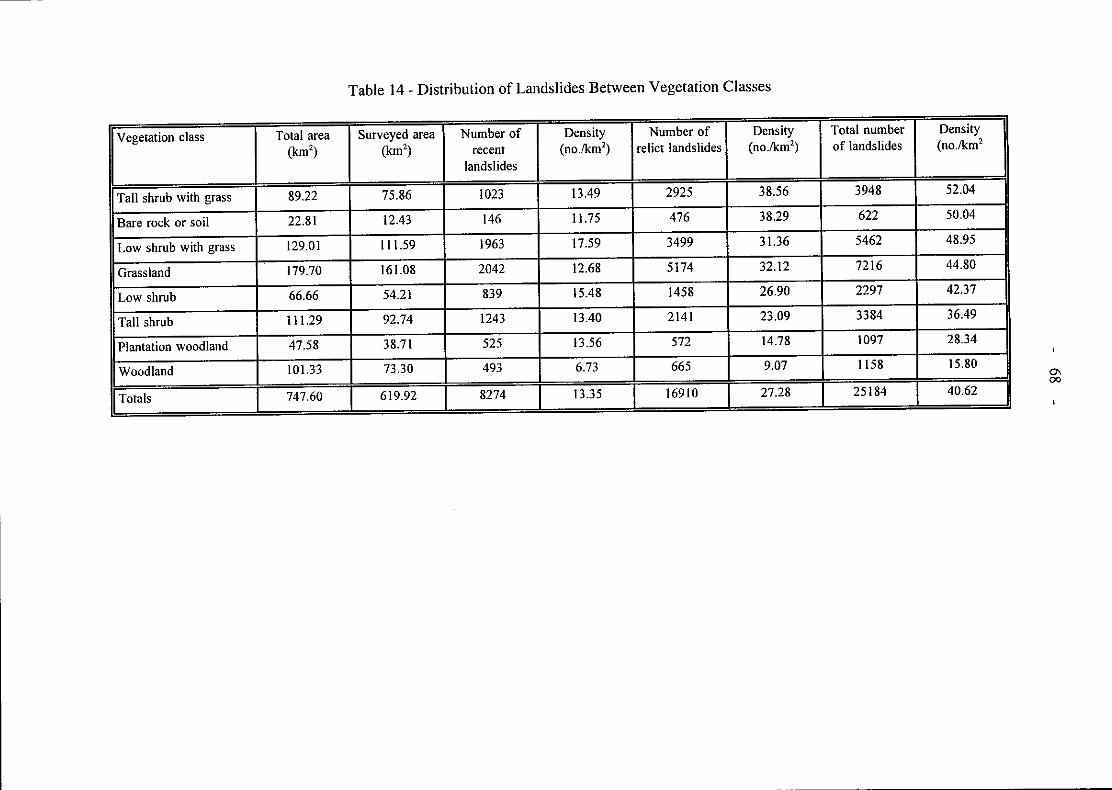
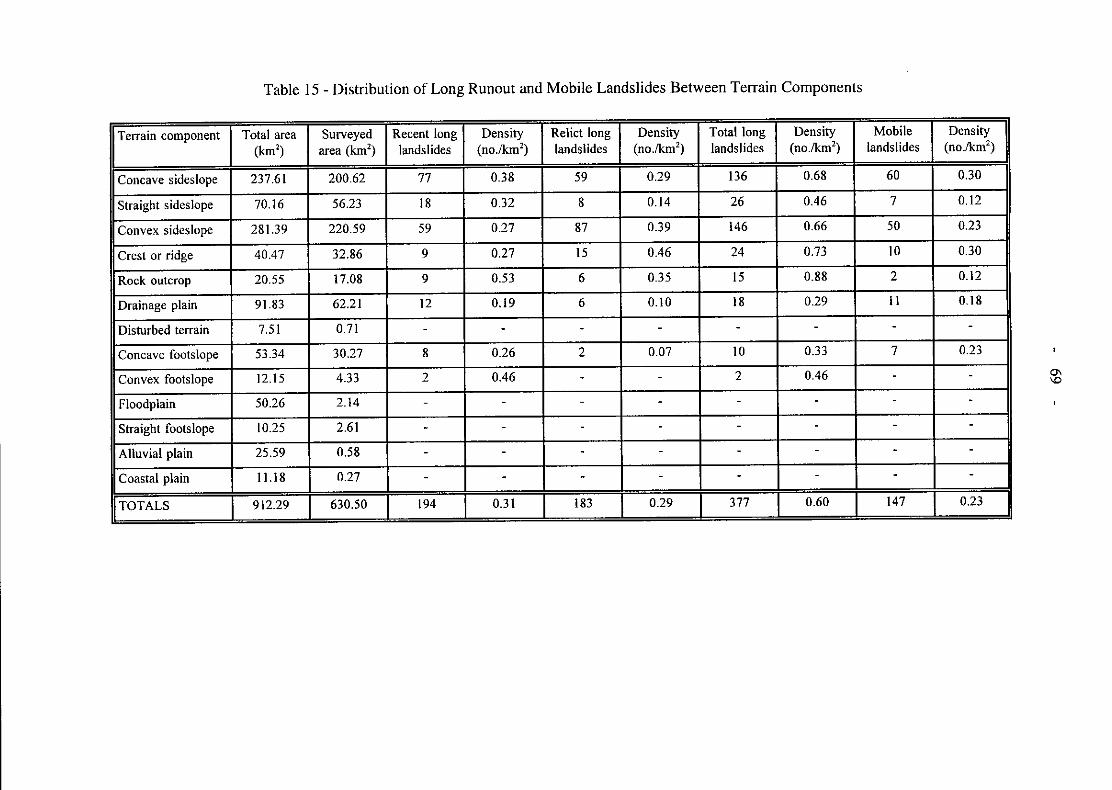
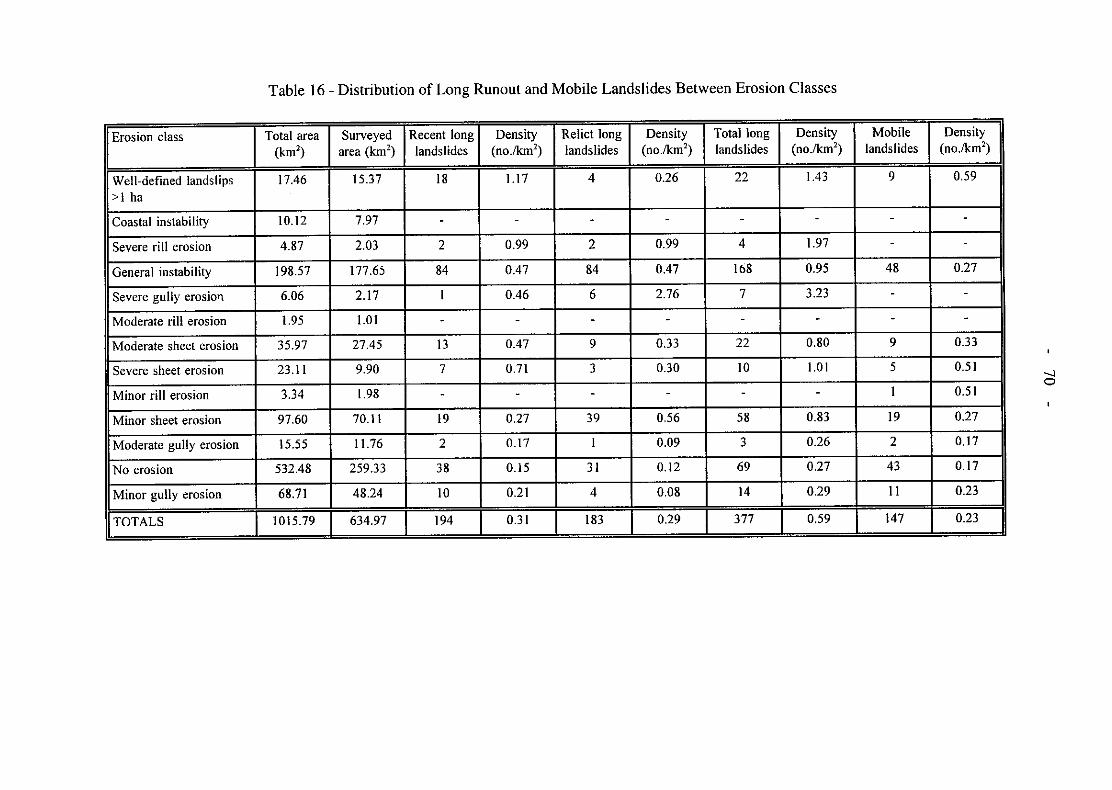
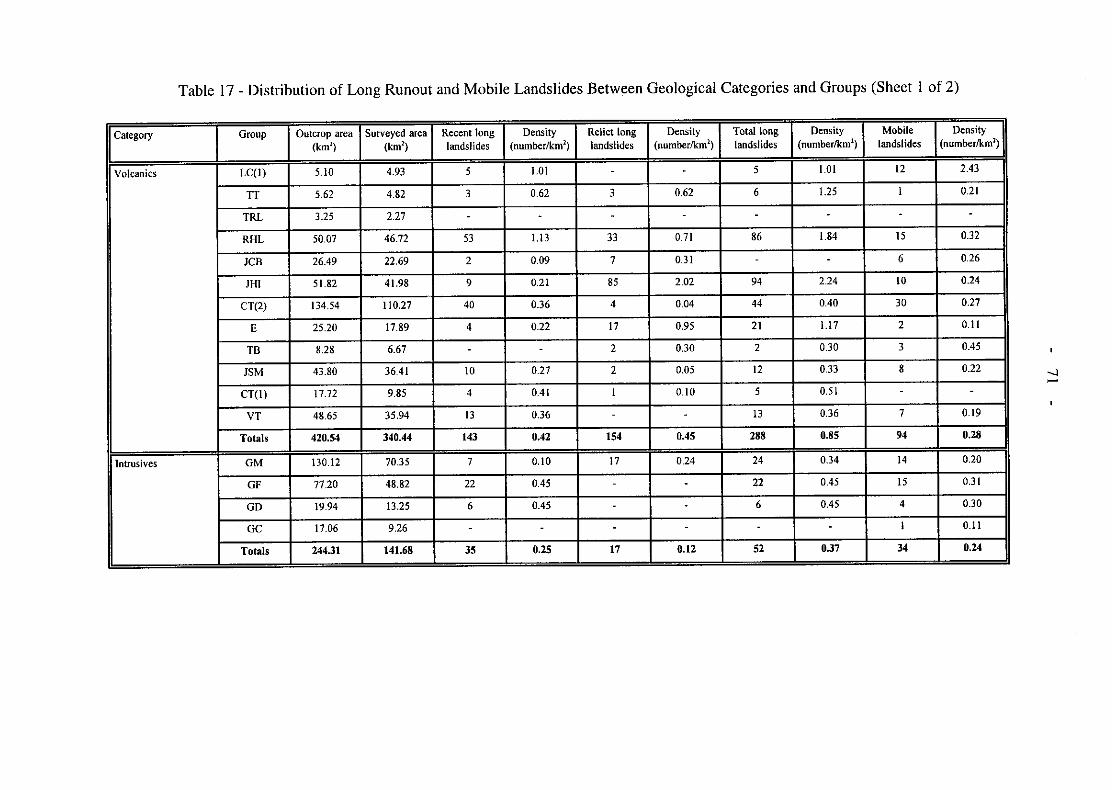
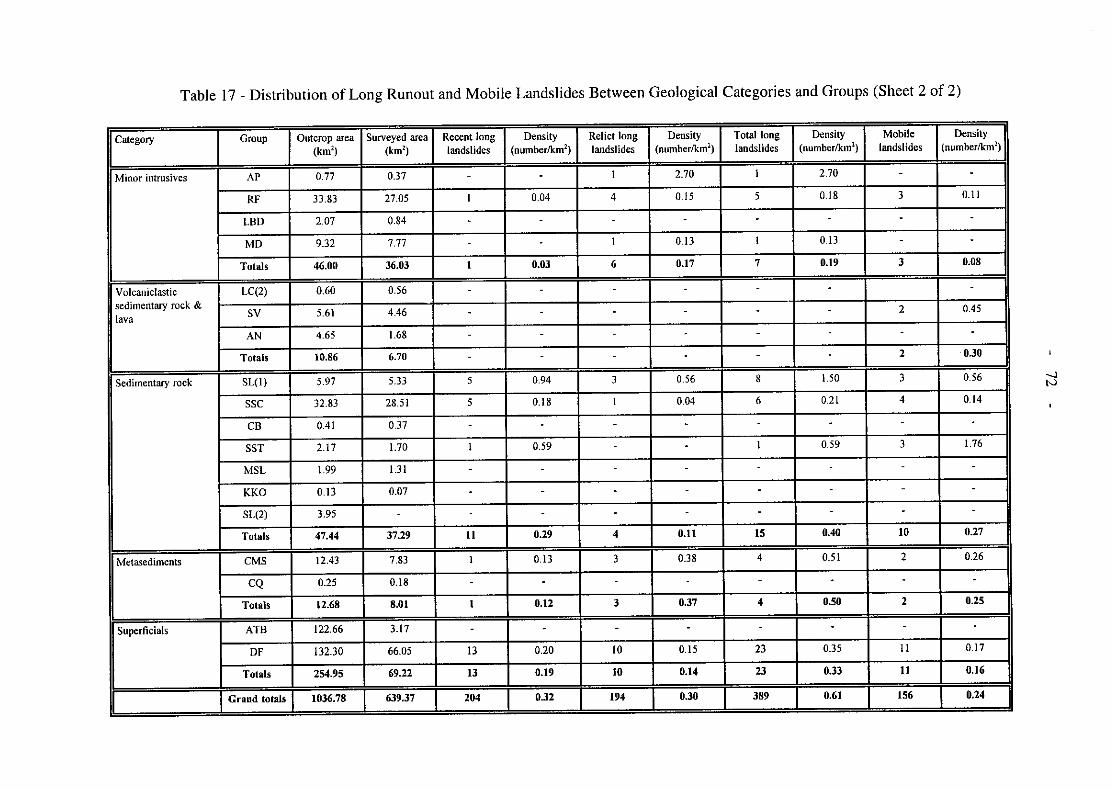


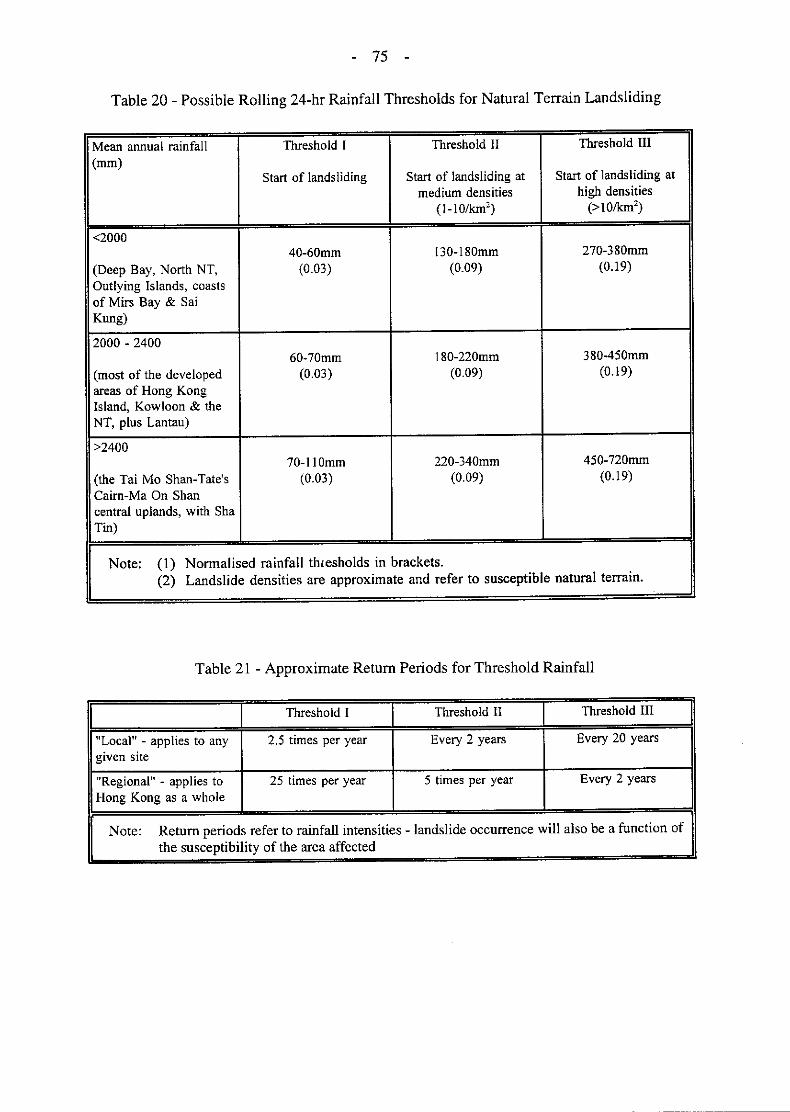
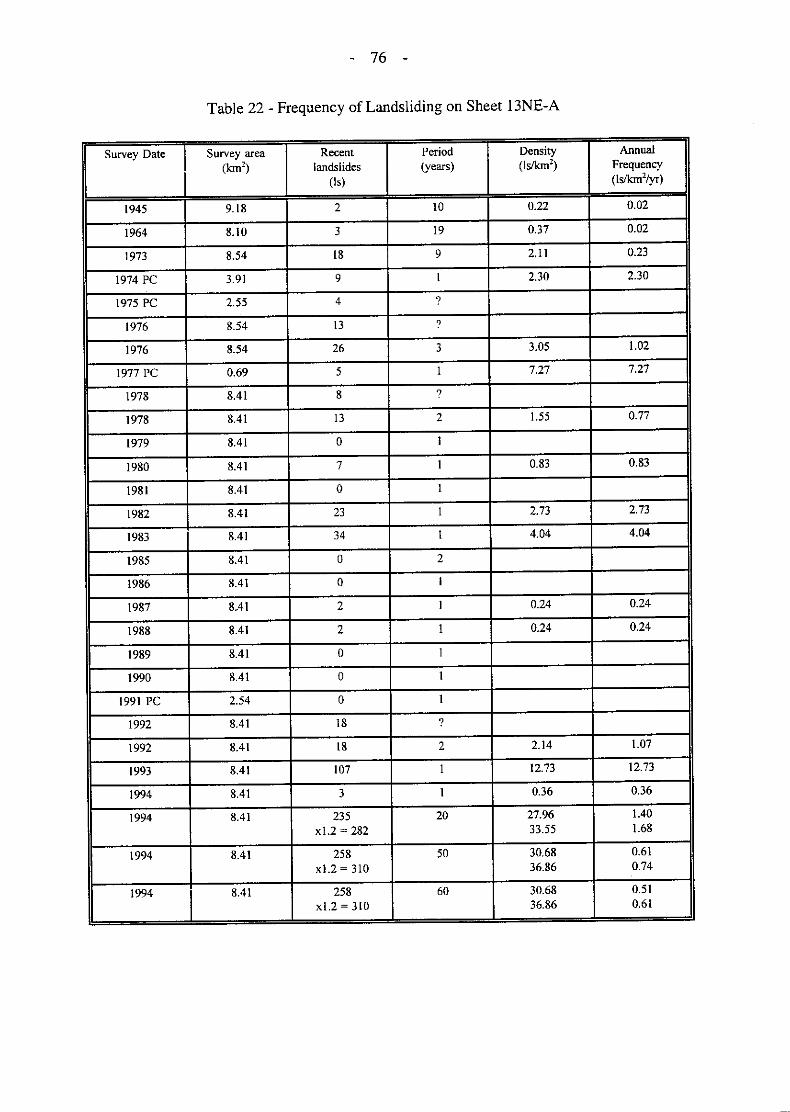
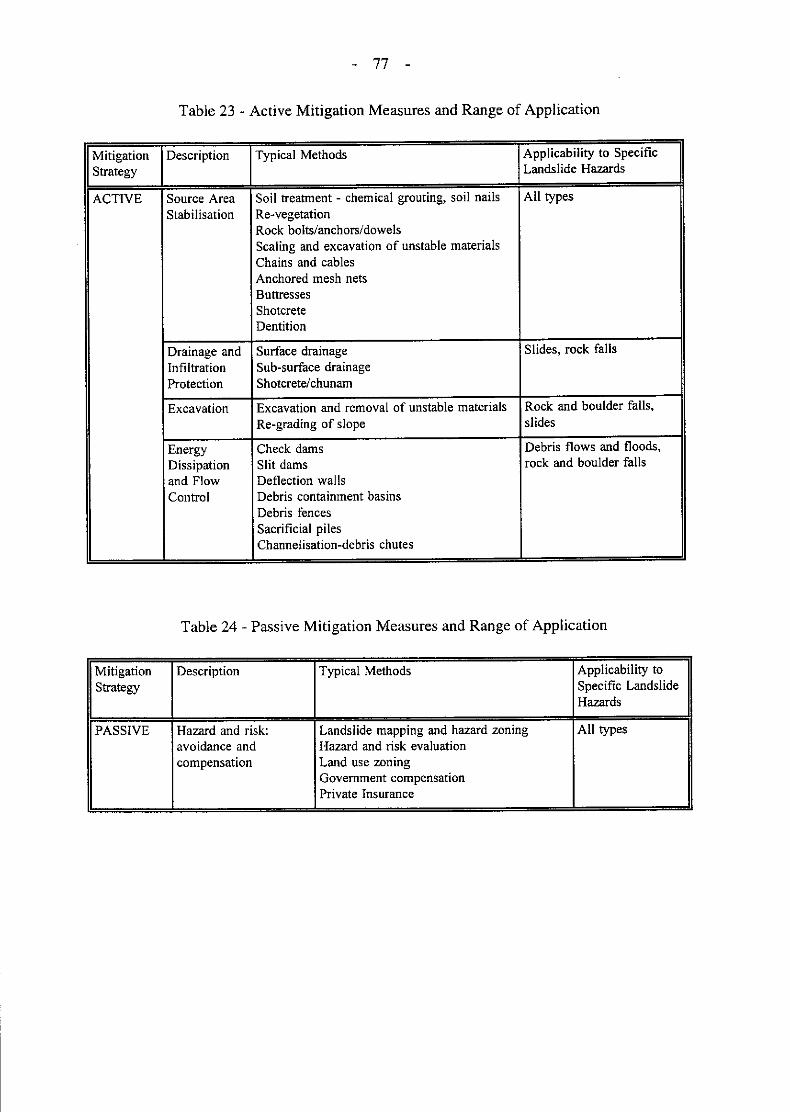

- 78 -
LIST OF FIGURES
Figure Page No. No.
(Ngong Ping, Lantau)
Streamcourses (Tsang Tsui, NT)
Head of Streamcourse (Sai Wan, Sai Kung)
Kung)
both H and L > 20 m
L > 150 m
L > 150 m
L > 150 m
H/L < 0.4 (and both H and L > 20 m)
1 Relict Debris Lobes and Exceptional Landslides 80
2 Revegetation of Landslide Scars 81
3 Natural Terrain Landslides Aligned Along Slope Contours 82
4 Natural Terrain Landslides Aligned Parallel to 83
5 Arcuate Natural Terrain Landslides Distribution Around 84
6 Near-coastal Natural Terrain Landslides (Tsiu Hang, Sai 85
7 Frequency Distribution of Aspect for All Landslides 86
8 Frequency Distribution of H for Recent Landslides 87
9 Frequency Distribution of H for Relict Landslides 88
10 Frequency Distribution of L for Recent Landslides 89
11 Frequency Distribution of L for Relict Landslides 90
12 Frequency Distribution of H/L for Recent Landslides with 91
13 Frequency Distribution of H for Landslides with 92
14 Frequency Distribution of L for Landslides with 93
15 Frequency Distribution of H/L for Recent Landslides with 94
16 Frequency Distribution of H for Recent Landslides with 95
17 Frequency Distribution of L for Recent Landslides with 96 H/L < 0.4 (and both H and L > 20 m)

- 79 -
Figure Page No. No.
18 Return Periods for Normalised 24hr Rainfall for the 97 Whole of Hong Kong
19 Cumulative Percentage of Landslides Associated with 98 Maximum 24hr Rainfall
20 Cumulative Percentage of Landslides Associated with 99 Maximum Normalised 24hr Rainfall
21 Relative Frequency of Landsliding Weighted for 100 Frequency of Rainfall
22 Predicted and Measured Angle of Reach 101
23 Sabo Works 102
24 Factors that Influence Spacing of Check Dams 103
25 Plan and Sectional View of an Unconfined Deposition 104 Area
26 Plan and Oblique View of Impediments to Flow 105
27 Plan and Oblique View of Deflection Wall or Berm 106
28 Plan and Section of a Terminal Berm or Barrier 107
29 Typical Slit Dam Configuration 108
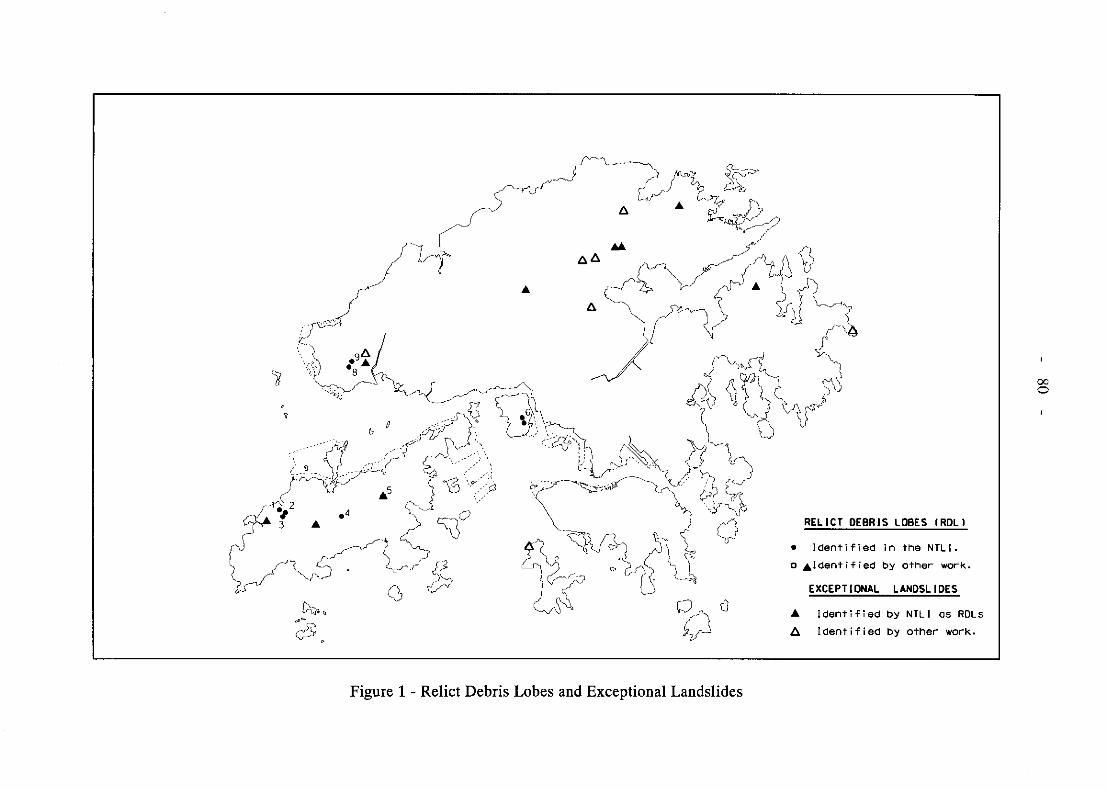


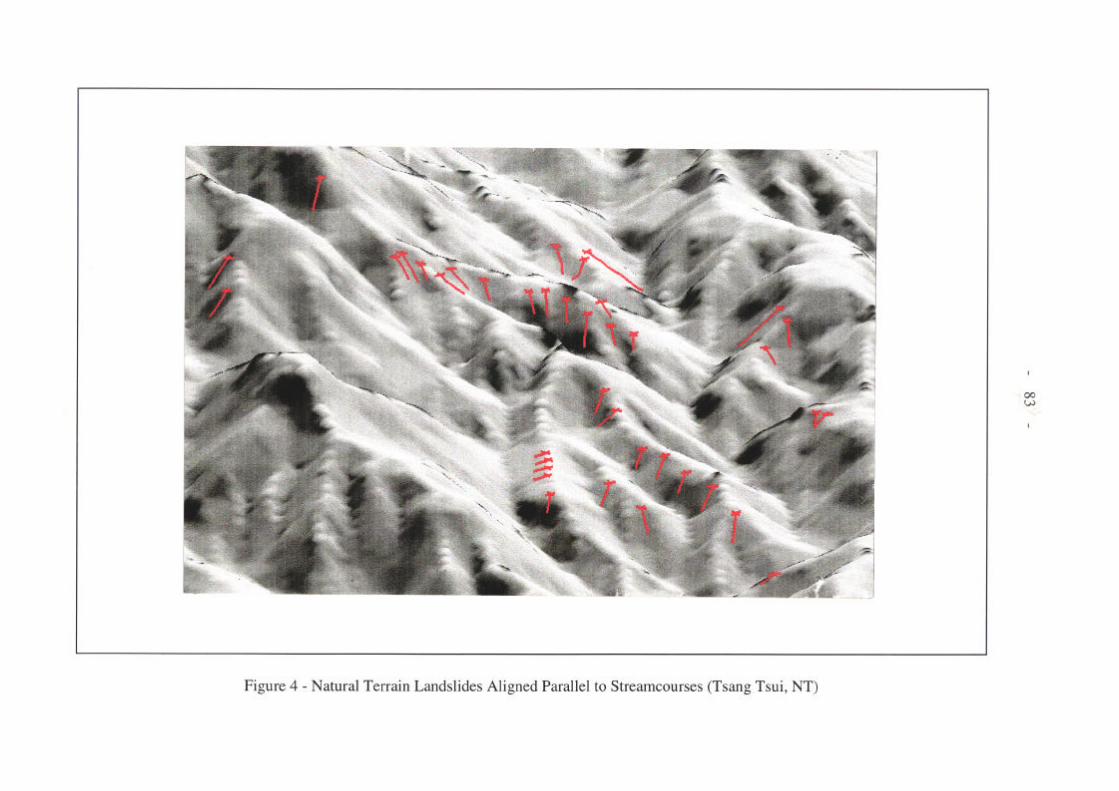


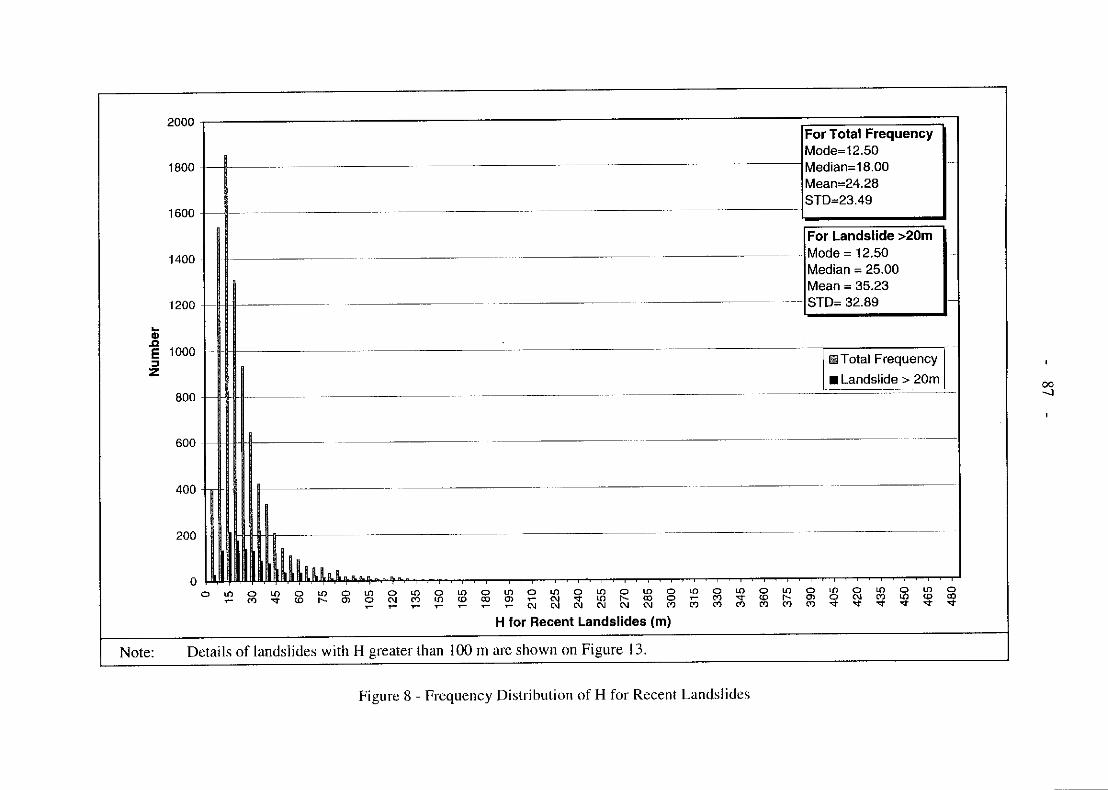


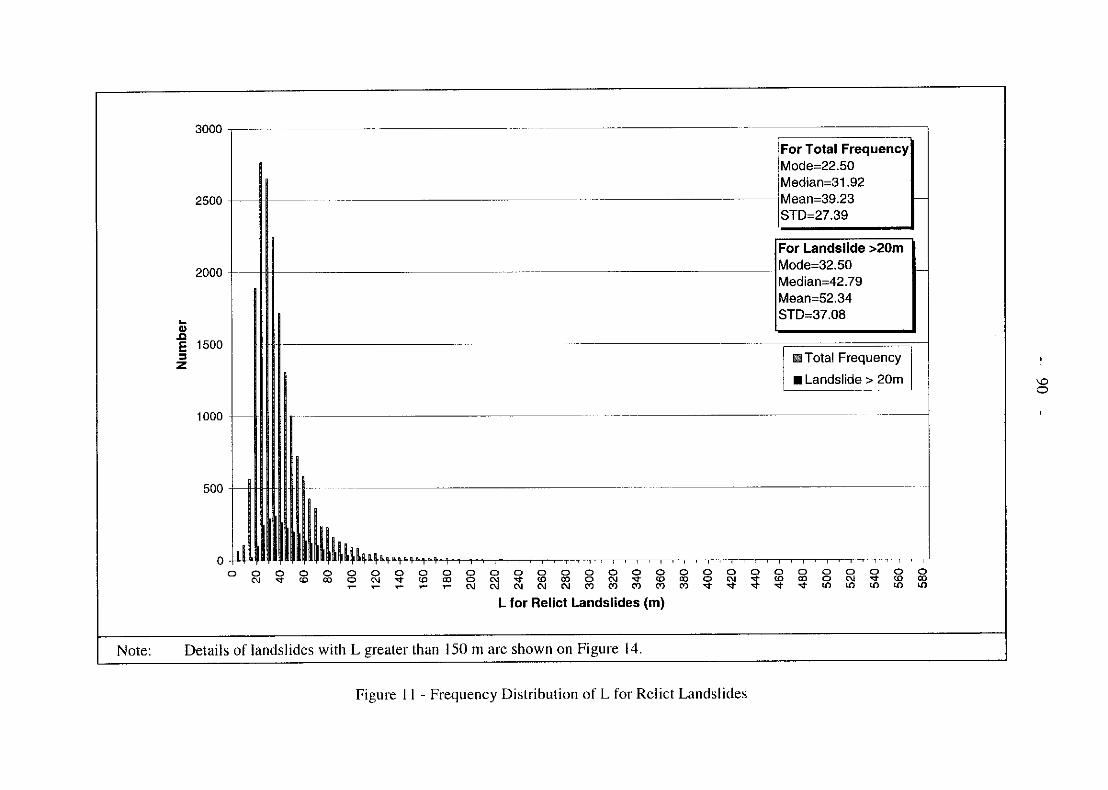

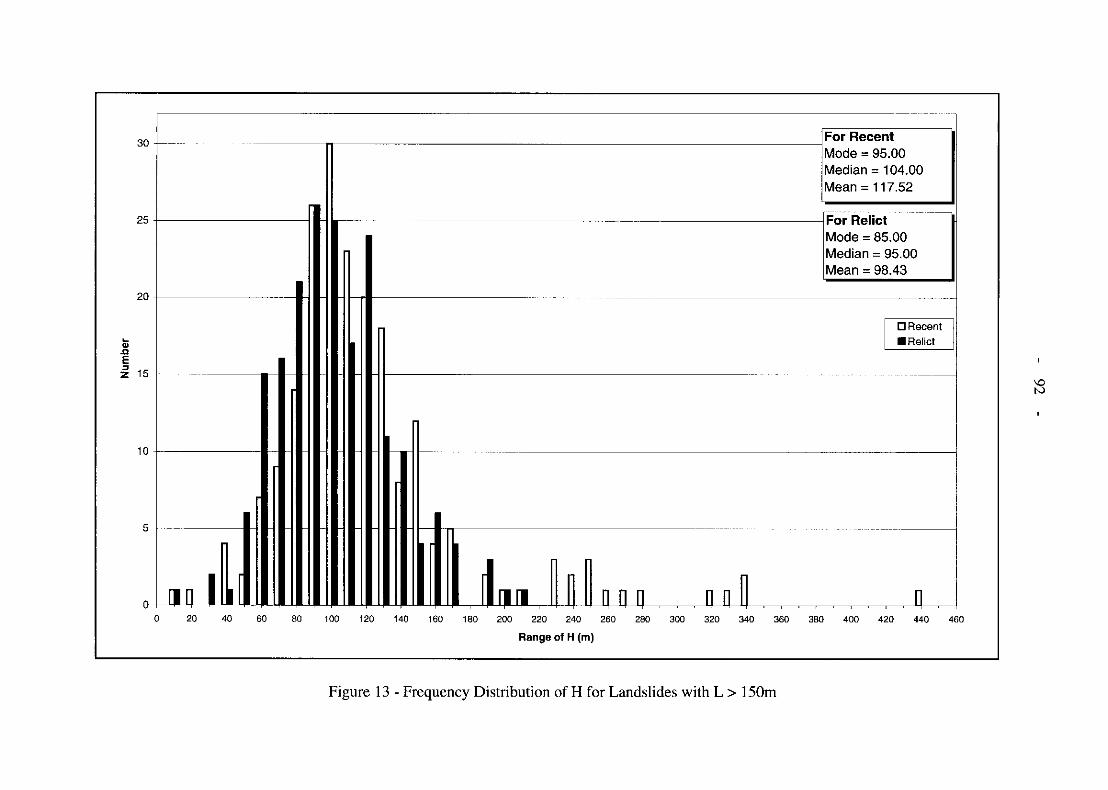

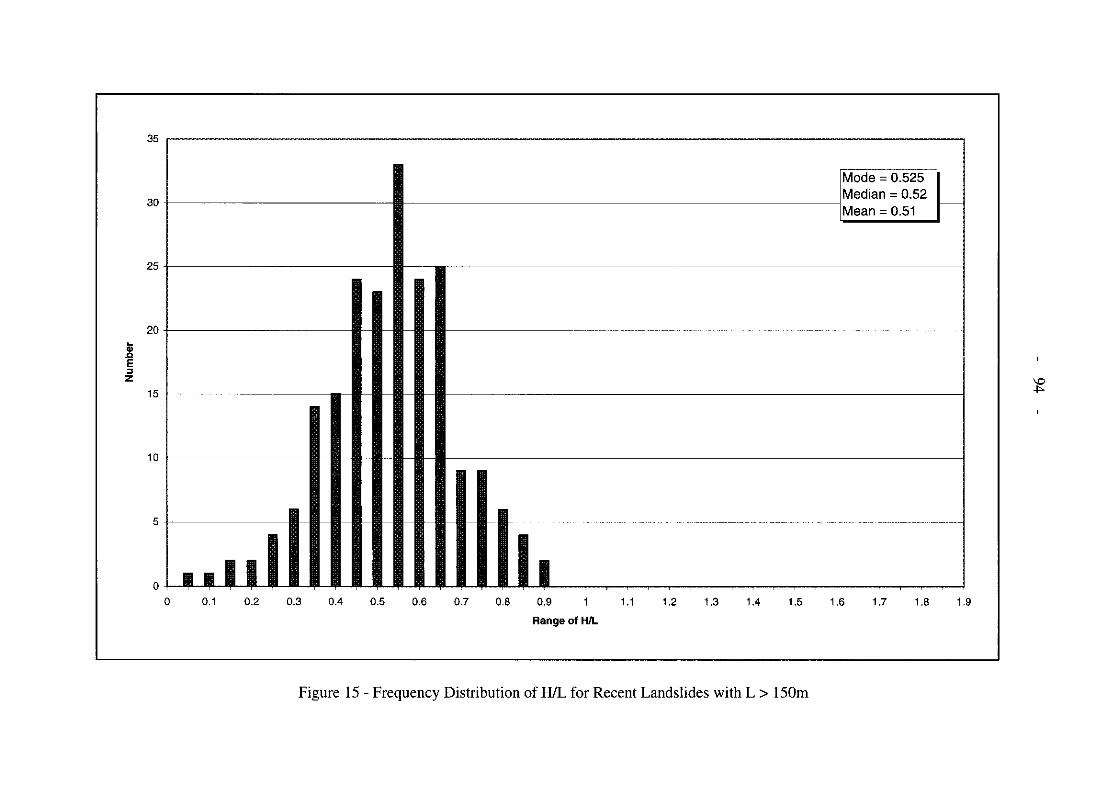
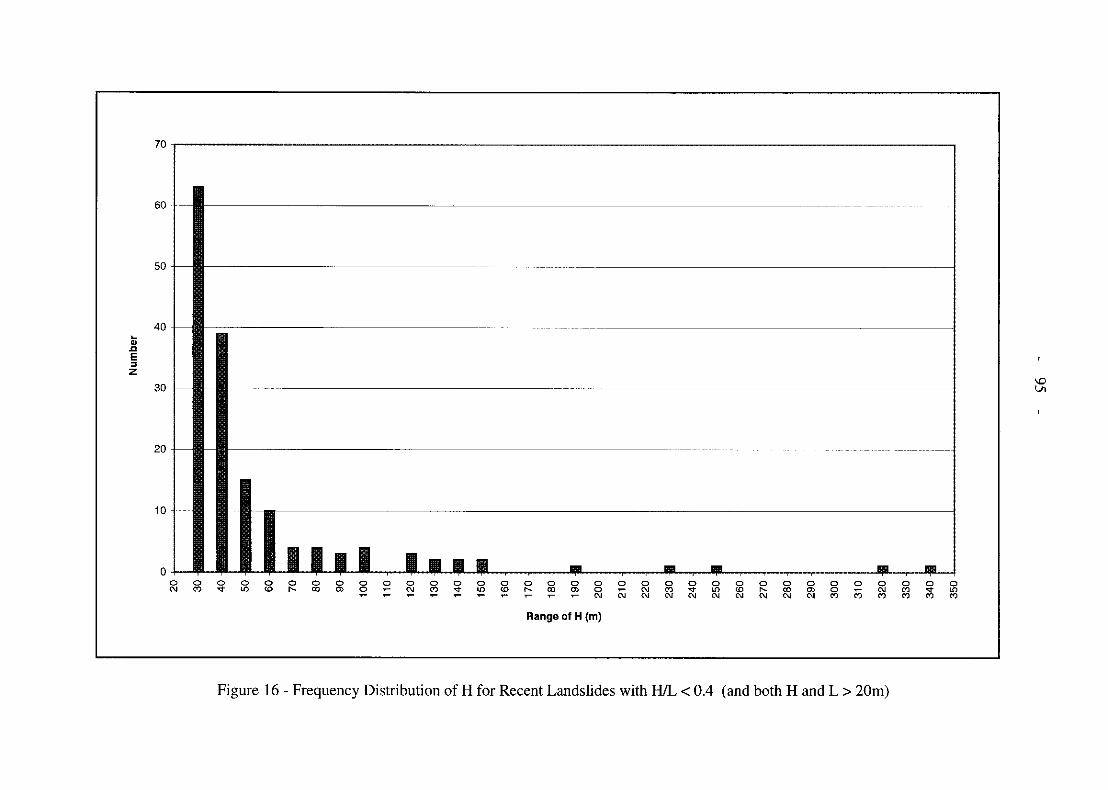


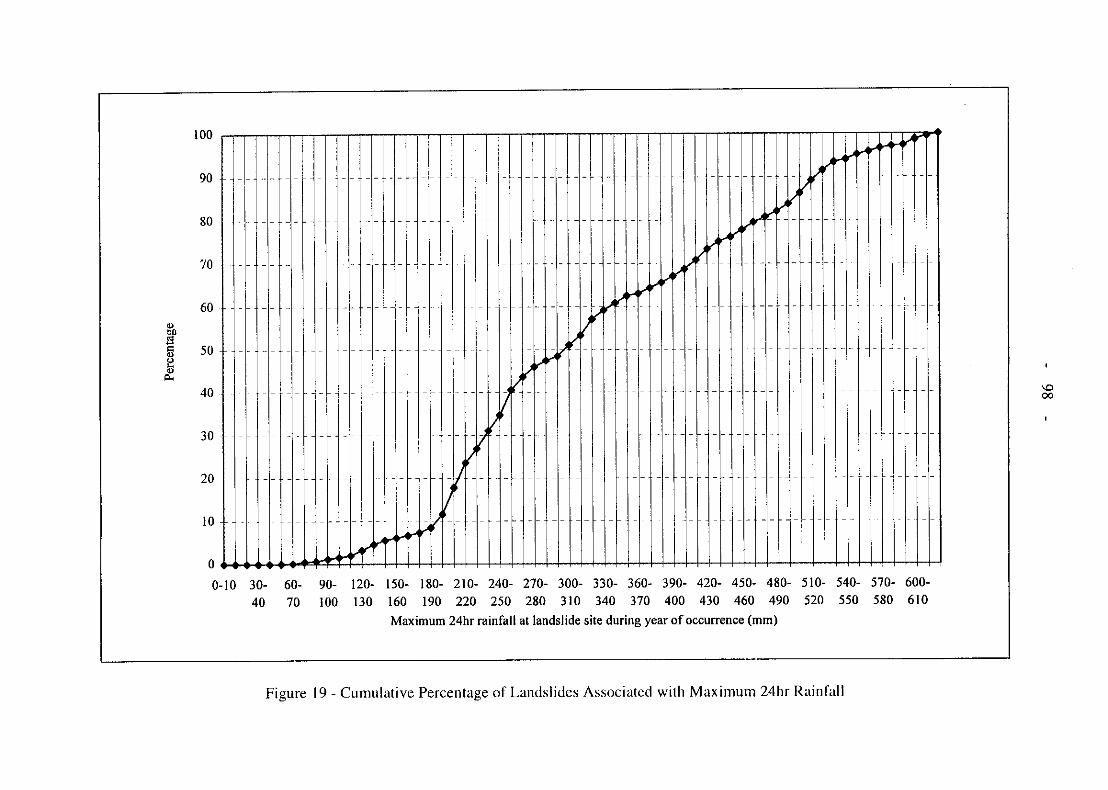


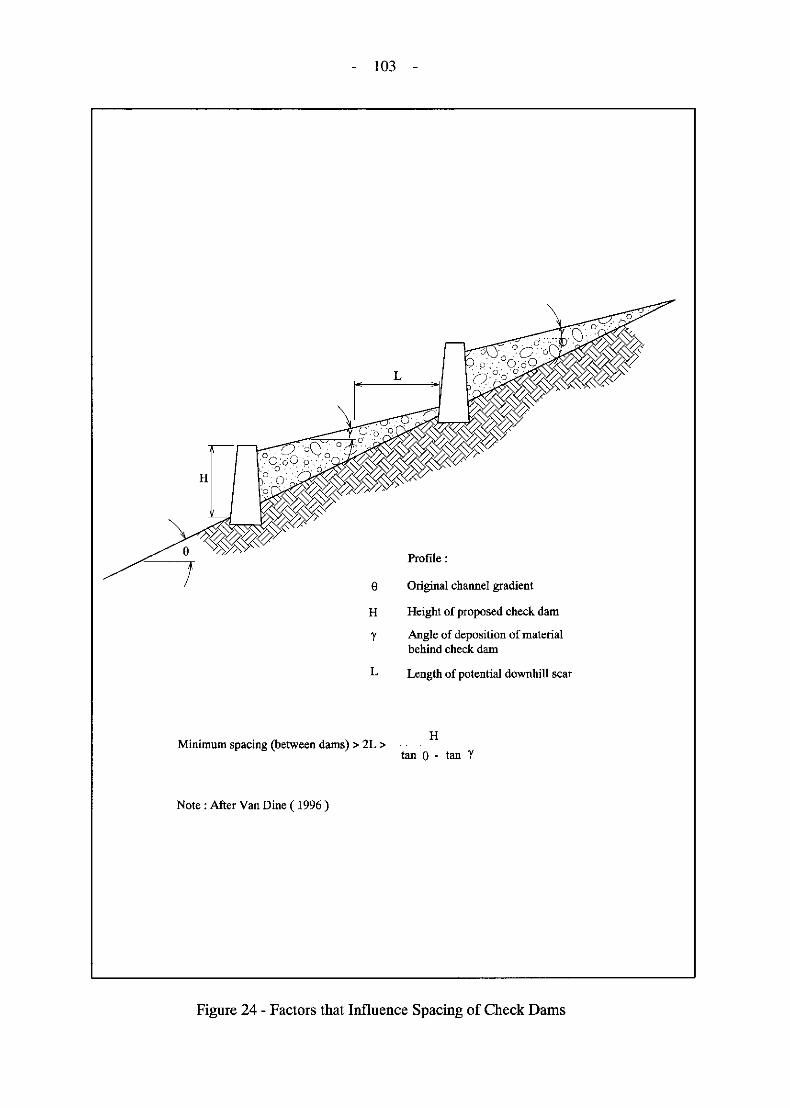


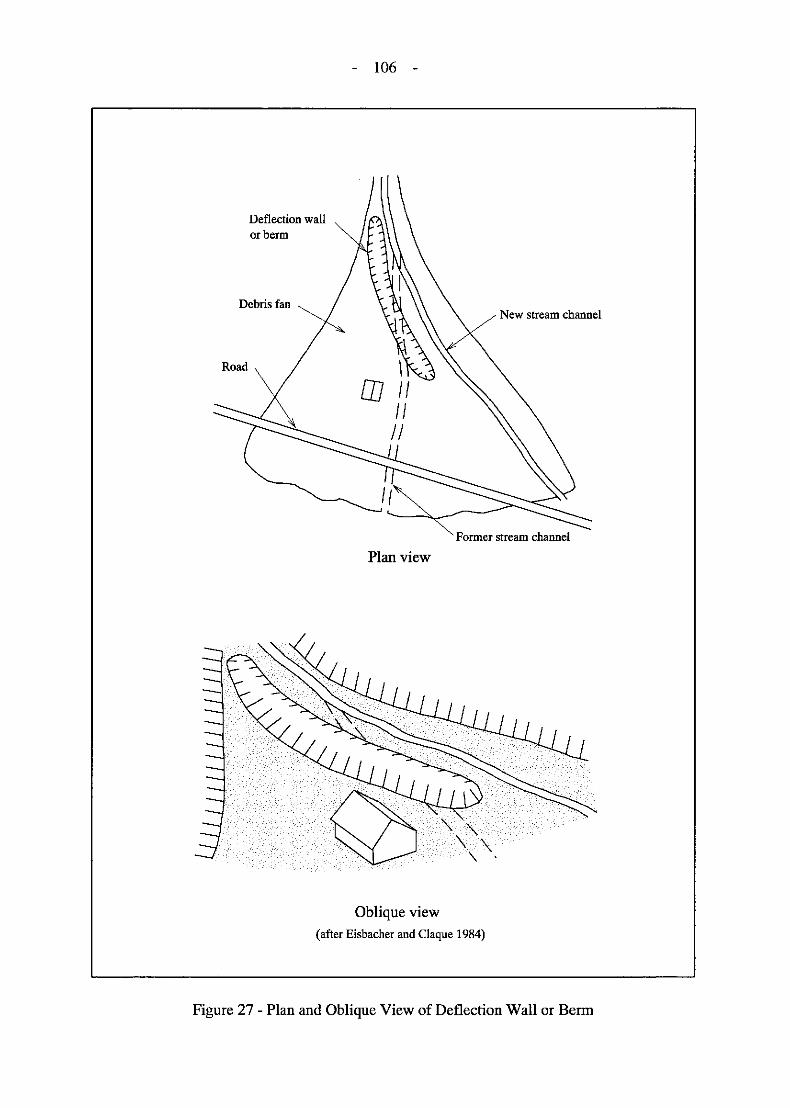


- 109 -
LIST OF PLATES
Plate Page No. No.
Debris Flow
1 Overgrown Agricultural Terraces 110
2 Gullied Terrain 110
3 Relict Landslide 111
4 Relict Landslides 111
5 Relict Landslide with Linear Bouldery Ridge 112
6 Coastal Landslide not included in the NTLI 112
7 Large Coastal Landslide not included in the NTLI 113
8 Landslide near the Coast included in the NTLI 113
9 Landslide near the Coast included in the NTLI 114
10 Small Open Slope Debris Slide-Flow 115
11 Small Channelised Debris Slide-Flow 116
12 Very Large Channelised Debris Flow, The Tsing Shan 117
13 Wide Channelised Landslide 118
14 Small Landslide Trail 119
15 Small Landslide Trail 120
16 Wide Landslide Trail 120
17 Wide Landslide Trail 121
18 Wide Unchannelised Debris Flows 121
19 Landslide Triggered Boulder Fall 122
20 Tension Crack at Small Displacement Landslide 122


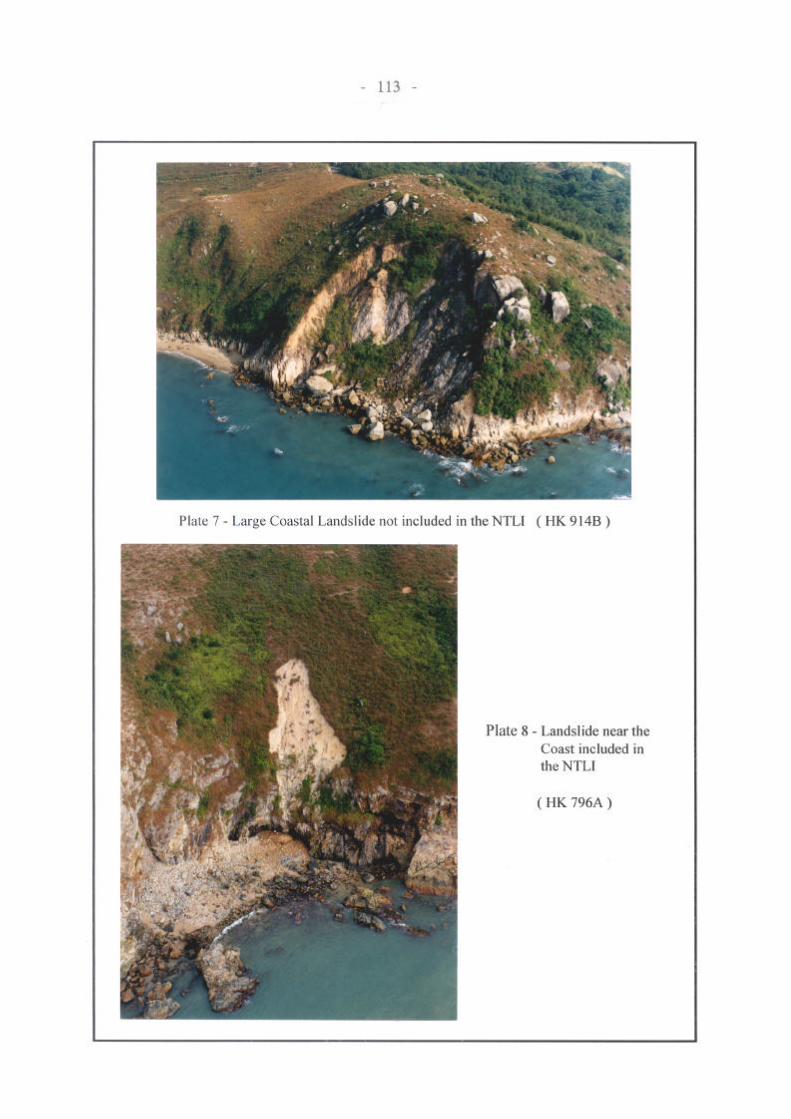
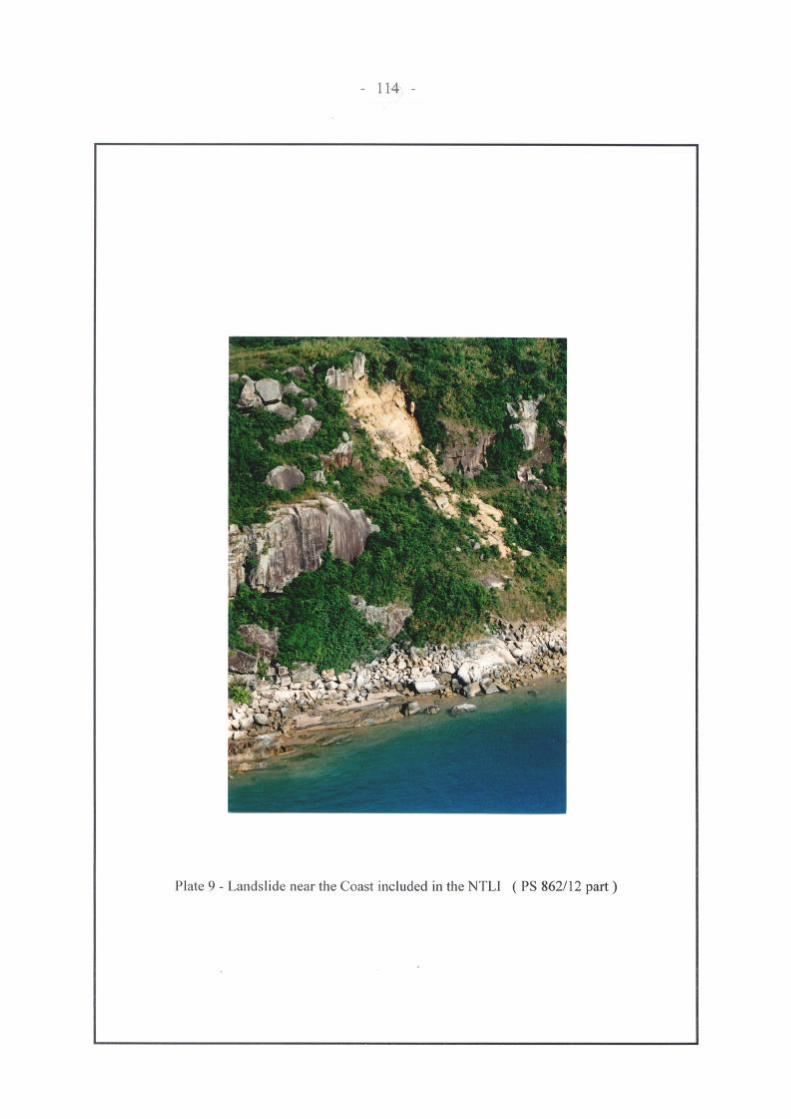
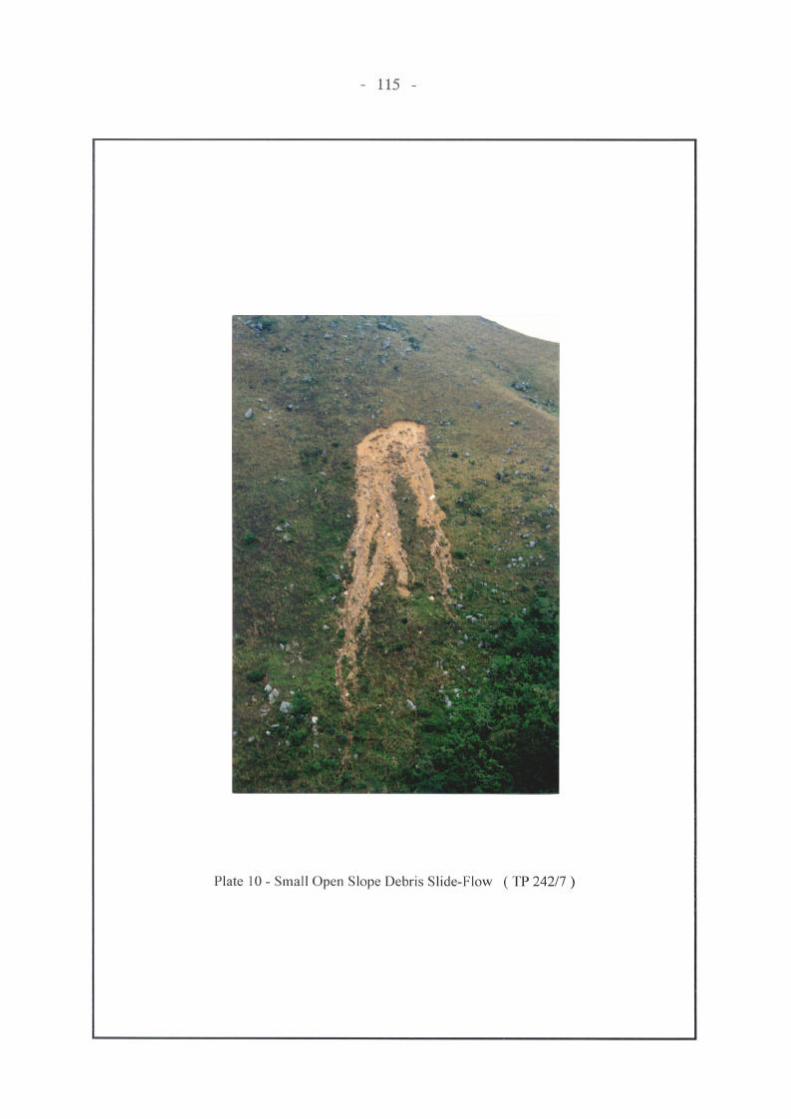


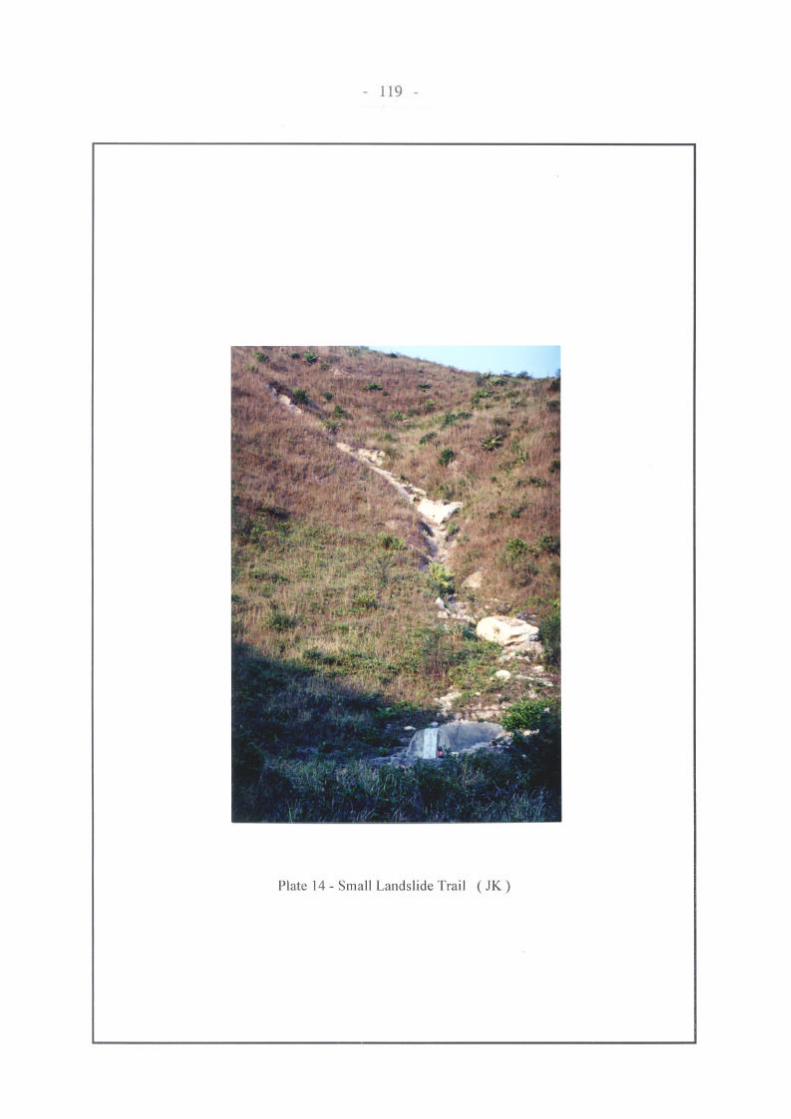

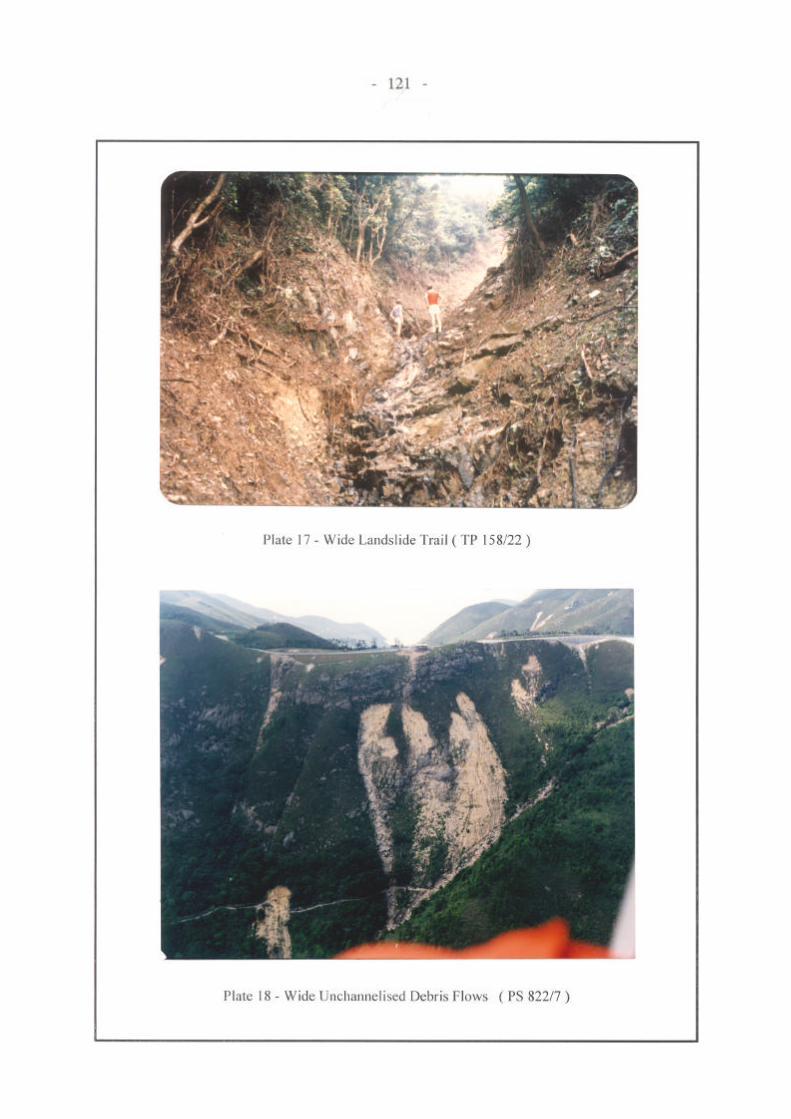
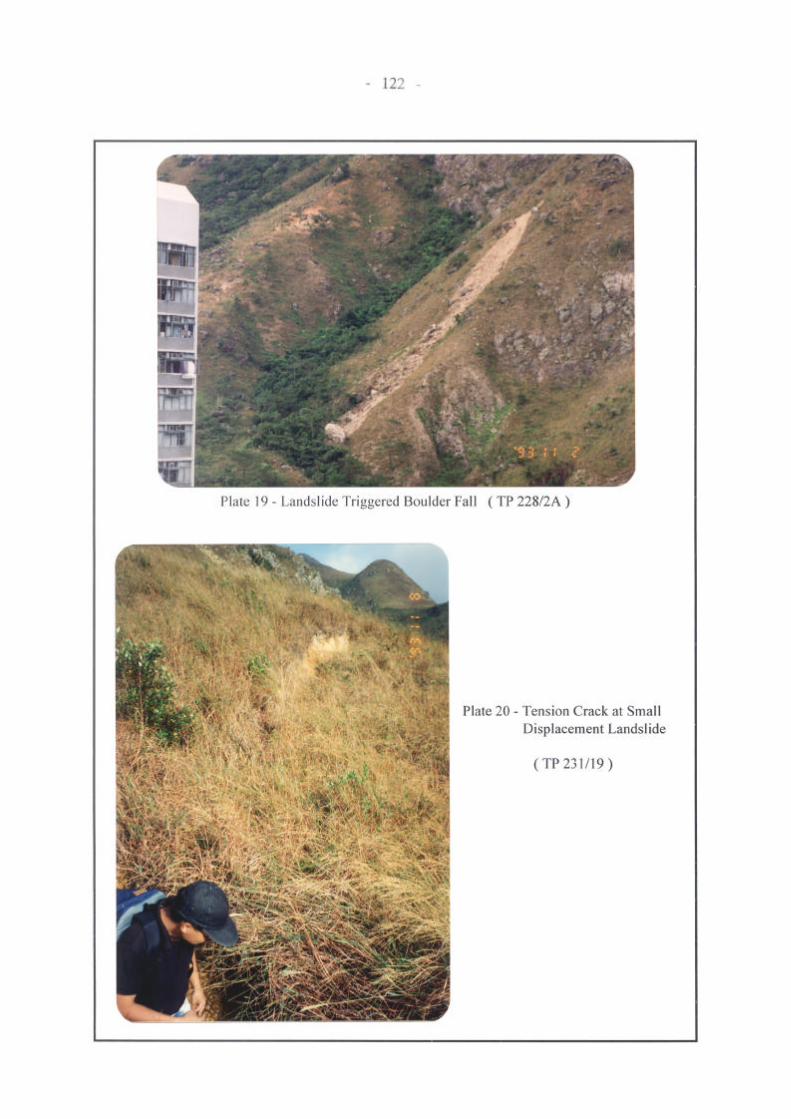

- 123 -
APPENDIX A
EXAMPLE MAP SHEET REPORT

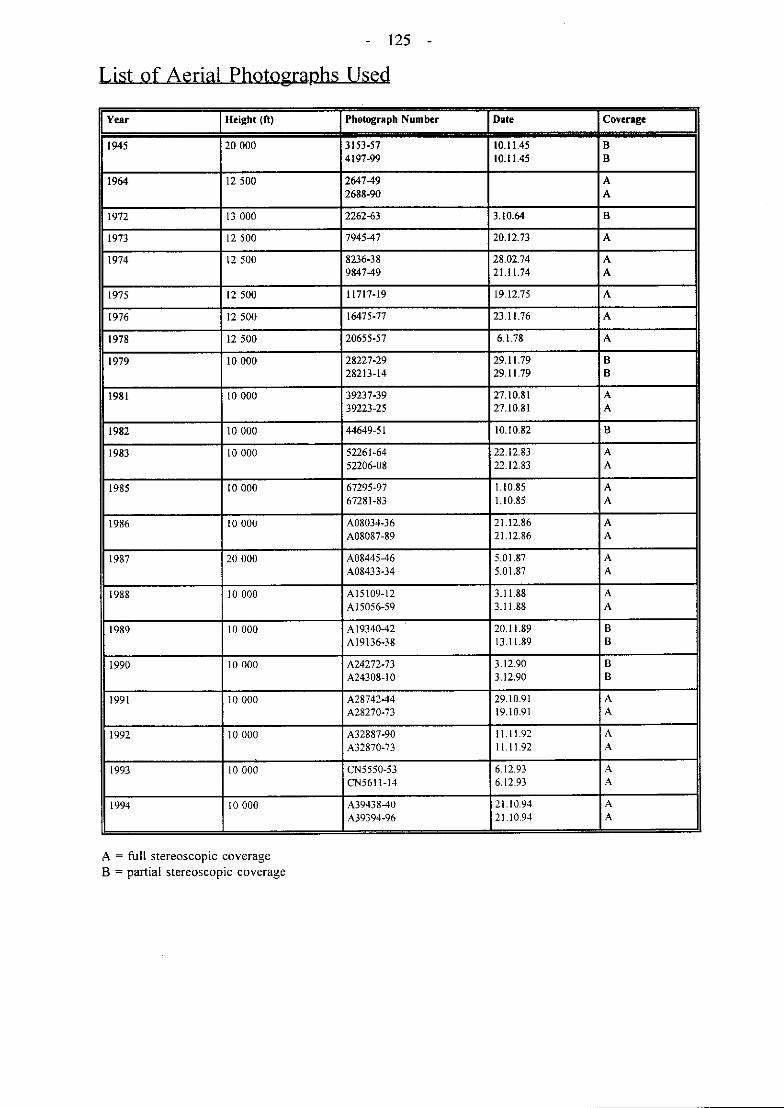


- 128 -
LIST OF DRAWINGS
Drawing No.
GEO/P/PTE 10: Natural Terrain Landslide Inventory Map
GEO/P/PTE 11: Natural Terrain Landslide Inventory Isopleth Map