The National Market for Medicare Clinical Laboratory ... · To analyze the structure of the...
21
MMRR 2012: Volume 2 (2) Kandilov, A.M.G., Pope, G.C., Kautter, J., Healy, D. E1 Medicare & Medicaid Research Review 2012: Volume 2, Number 2 A publication of the Centers for Medicare & Medicaid Services, Center for Strategic Planning The National Market for Medicare Clinical Laboratory Testing: Implications for Payment Reform Amy M. Gass Kandilov, Gregory C. Pope, John Kautter, Deborah Healy RTI International Abstract Current Medicare payment policy for outpatient laboratory services is outdated. Future reforms, such as competitive bidding, should consider the characteristics of the laboratory market. To inform payment policy, we analyzed the structure of the national market for Medicare Part B clinical laboratory testing, using a 5-percent sample of 2006 Medicare claims data. The independent laboratory market is dominated by two firms—Quest Diagnostics and Laboratory Corporation of America. The hospital outreach market is not as concentrated as the independent laboratory market. Two subgroups of Medicare beneficiaries, those with end-stage renal disease and those residing in nursing homes, are each served in separate laboratory markets. Despite the concentrated independent laboratory market structure, national competitive bidding for non-patient laboratory tests could result in cost savings for Medicare. Keywords: Medicare Part B, clinical laboratory, market structure, competitive bidding, payment reform. doi: http://dx.doi.org/10.5600/mmrr.002.02.a04
Transcript of The National Market for Medicare Clinical Laboratory ... · To analyze the structure of the...

MMRR 2012: Volume 2 (2)
Kandilov, A.M.G., Pope, G.C., Kautter, J., Healy, D. E1
Medicare & Medicaid Research Review 2012: Volume 2, Number 2
A publication of the Centers for Medicare & Medicaid Services,
Center for Strategic Planning
The National Market for Medicare Clinical Laboratory Testing: Implications for Payment Reform
Amy M. Gass Kandilov, Gregory C. Pope, John Kautter, Deborah Healy RTI International
Abstract Current Medicare payment policy for outpatient laboratory services is outdated. Future reforms, such as competitive bidding, should consider the characteristics of the laboratory market. To inform payment policy, we analyzed the structure of the national market for Medicare Part B clinical laboratory testing, using a 5-percent sample of 2006 Medicare claims data. The independent laboratory market is dominated by two firms—Quest Diagnostics and Laboratory Corporation of America. The hospital outreach market is not as concentrated as the independent laboratory market. Two subgroups of Medicare beneficiaries, those with end-stage renal disease and those residing in nursing homes, are each served in separate laboratory markets. Despite the concentrated independent laboratory market structure, national competitive bidding for non-patient laboratory tests could result in cost savings for Medicare.
Keywords: Medicare Part B, clinical laboratory, market structure, competitive bidding, payment reform.
doi: http://dx.doi.org/10.5600/mmrr.002.02.a04

MMRR 2012: Volume 2 (2)
Kandilov, A.M.G., Pope, G.C., Kautter, J., Healy, D. E2
Introduction
Medicare Part B clinical laboratory expenditures account for only 2.4 percent of total Medicare Parts A and B Fee-for-Service (FFS) expenditures (CMS, 2010; Pope et al., 2004).1 However, The Institute of Medicine (IOM) affirms that Medicare payment policy for laboratory services is significant beyond the size of the payments, for two primary reasons (IOM, 2000). First, the regulations and fee schedules set by Medicare for laboratory services greatly influence state Medicaid and private payers’ policies and payment rates. Second, laboratory tests influence health care expenditures far beyond their proportion of actual Medicare expenditures, because decisions about the provision of other medical services often hinge on laboratory test results.
Medicare payment policy for outpatient laboratory services, designed in the 1980s, is now outdated. Payments are not consistently related to costs, and neither the rates nor the basic payment methodology has evolved to take into account technology, market, and regulatory changes. There are 56 regional fee schedules for laboratory testing, which were based on laboratory charges in 1984. Laboratories billing Medicare Part B are paid the lesser of the regional fee schedule amount or the National Limitation Amount (NLA), which for each test code is set at 74 percent of the median regional fee schedule amount. With 84 percent of payment amounts set at the NLA, the laboratory testing market faces what is essentially a national fee schedule (IOM, 2000; OIG, 2009).
The Medicare Prescription Drug, Improvement, and Modernization Act (MMA) of 2003 (P.L. 108–173) required the Centers for Medicare & Medicaid Services (CMS) to conduct a demonstration project on the application of competitive acquisition for clinical laboratory services that would otherwise be paid under the Medicare Part B fee schedule. The objective of the Medicare Clinical Laboratory Competitive Bidding Demonstration was to determine whether competitive bidding could be used to provide Part B clinical laboratory services, at fees below current Medicare payment rates, while maintaining quality and access to care.
The MMA specifically required that the demonstration (1) include tests paid under the Medicare Part B Clinical Laboratory Fee Schedule (CLFS); (2) exclude tests provided by entities that have a “face-to-face encounter” with the patient; (3) exclude Pap smears and colorectal cancer screening tests; (4) include requirements under the Clinical Laboratory Improvement Amendments (CLIA) program; and (5) be budget neutral. An initial Report to Congress was submitted in April 2006.
In October 2007, the San Diego, CA, metropolitan statistical area (MSA) was announced as the first demonstration area, followed by the provision of the final Bidders’ Package in November 2007 and a Bidders’ Conference in San Diego in December 2007, to respond to
1According to The Medicare Data Compendium (2010 edition, Table II.1)—fiscal year 2009 physician and
independent laboratory Part B clinical laboratory Medicare expenditures, as a percentage of total Part A and B Fee-for-Service Medicare expenditures, is equal to 2.4%.
MMRR 2012: Volume 2 (2)
Kandilov, A.M.G., Pope, G.C., Kautter, J., Healy, D. E3
questions and concerns of potential bidders in the demonstration site. In April 2008, a U.S. district court judge granted a motion for preliminary injunction halting the continuation of the demonstration project in the San Diego MSA. In June and July of 2008, the U.S. House and Senate, respectively, passed the Medicare Improvements for Patients and Providers Act of 2008. This Act repealed Congress’s earlier mandate to conduct a competitive bidding demonstration for laboratory services.
Although the competitive bidding demonstration was cancelled, it is likely that laboratory payment reform will be addressed again in the near future.2 In this study, we conduct an empirical analysis of the national Medicare Part B FFS clinical laboratory market, which could inform future efforts to implement Medicare clinical laboratory competitive bidding or other payment reforms. Our work updates and extends earlier studies of the Medicare clinical laboratory market by Hoerger and Meadow (1997) and Mennemeyer (1989).
Data and Methods
To analyze the structure of the Medicare Part B clinical laboratory market, we used data from CMS, the American Hospital Association (AHA), and the United States Department of Agriculture (USDA). Our primary data were the Medicare claims and enrollment files for a 5 percent national random sample of Medicare FFS beneficiaries in calendar year (CY) 2006. These data contain basic demographic and geographic information about beneficiaries and Medicare-paid services they received in CY 2006. End Stage Renal Disease (ESRD), Disabled, Dual-Eligible (Medicare/Medicaid), and Aged entitlement status are derived from information in the Medicare Denominator file. Indicators for beneficiaries who are institutionalized or receiving home health services were created using the Nursing Home Minimum Data Set and the home health claims files, respectively.
We restricted our analysis to Healthcare Common Procedure Coding System (HCPCS) test codes included in the 2006 Medicare Part B CLFS. We differentiate between laboratory test codes (HCPCS codes) and laboratory tests, because often a single laboratory test code is used to bill for multiple laboratory tests. In other situations, one laboratory test is billed using multiple test codes. For these tests, when billing Medicare, the laboratory will often “stack” the laboratory test codes that comprise the laboratory test (Carlson, 2010).
Knowledge of automated chemistry test panels is important to understanding the Medicare clinical laboratory payment system. There are 22 automated chemistry test codes (e.g., HCPCS 82310, Assay of Calcium) which are combined into automated chemistry test panels (CMS, 2011). The combination of any two or more of these test codes is referred to as an automated test panel (ATP). Payment for each of these test codes depends on the number 2For example, Section 3113 of the Affordable Care Act of 2010 mandates CMS to design, implement, and evaluate a
demonstration project under which separate payments are made for Medicare Part B complex clinical laboratory tests (CMS, 2012).

MMRR 2012: Volume 2 (2)
Kandilov, A.M.G., Pope, G.C., Kautter, J., Healy, D. E4
provided to a patient on the same date and by the same provider. For panels, Medicare pays at a discounted rate relative to the individual test codes. For example, in 2012, the “national limit amount” payment rate for ATP5 (5 automated chemistry test codes) is $11.09, whereas the payment rate for ATP10 (10 automated chemistry test codes) is only $12.30.
However, laboratories do not bill Medicare for ATPs; rather, laboratories bill Medicare using HCPCS codes. These HCPCS codes include the 22 automated chemistry test codes that define the ATPs. For payment purposes, Medicare groups these chemistry tests into ATPs, but this information is not contained in the Medicare claims. Fortunately, however, organ or disease chemistry panels have single HCPCS codes for billing purposes (e.g., HCPCS 80048, Basic Metabolic Panel, 8 automated chemistry test codes), and thus we are able to observe these high frequency chemistry panels in the Medicare claims.
The Medicare Part B clinical laboratory market can be divided into patient and non-patient testing. Patient testing includes tests performed by physician office laboratories (POLs) for their office patients and hospital laboratories for their registered outpatients.3 Non-patient testing is defined as tests performed by independent laboratories, and by hospital laboratories for Medicare beneficiaries who are not registered as inpatients or outpatients of the hospital. (Beneficiaries who have been treated in the past as outpatients of a hospital may still be considered non-patients.)
The greatest potential for competition is in non-patient testing, as both local and national independent laboratories compete with hospital outreach laboratories for referrals from physicians. Under current Medicare Part B payment rules, laboratories are largely paid the same fee when billing the same test code. Laboratories can compete for business (from physicians) on non-price elements such as providing accurate and reliable test results, quick turnaround times, and low rates of rejected or lost specimens. Future Medicare payment reform may wish to take advantage of the potential for market competition as a means to lower the prices paid for non-patient laboratory tests.
Because of the potential for market competition, our analysis focuses on testing services provided by independent laboratories and hospital laboratories for non-patients. We also include information on the entire Medicare Part B laboratory testing market, for context and comparison. Claims data for laboratory tests were supplied by two 5-percent sample data files: the Physician/Supplier file and the Hospital Outpatient file. The Physician/Supplier file contains claims for independent laboratories and for POLs; a few laboratories that did not fit into either category were classified as “Other Physician/Supplier (P/S) Labs.” The Hospital Outpatient file contains claims for hospital outpatients and non-patients, and for other institutional providers,
3Hospital laboratories also perform tests for hospital inpatients. Such tests are covered under the bundled diagnosis-related group (DRG) Medicare Part A payment for a hospital stay, and are outside the scope of this article.
MMRR 2012: Volume 2 (2)
Kandilov, A.M.G., Pope, G.C., Kautter, J., Healy, D. E5
such as skilled nursing facilities (SNFs),4 Critical Access Hospitals (CAHs),5 and dialysis facilities (which were categorized as “Other Institutional” along with a few other small categories of laboratories).
In addition to these primary data sources, we used data from the CMS Provider of Service file to assign ownership of individual laboratory facilities to laboratory firms, matching facilities with similar names to the firm name. To improve the identification of laboratory firms, we also utilized information from laboratory company websites on subsidiaries, mergers, and acquisitions. We identified hospital systems using the AHA Annual Survey of Hospitals from 2004. By identifying firms and systems, we analyzed market structure in terms of the independently owned and controlled entities that can bid against each other for Medicare clinical laboratory business.
Based on their state and county of residence, beneficiaries in the sample were classified into one of five categories of urban and rural areas using the 2003 Rural-Urban Continuum Codes from the USDA. Beneficiaries in the Nursing Home Minimum Data Set who had at least 3 continuous months of residence in a nursing facility were classified as “institutionalized” and their independent laboratory testing market was compared to the overall market.
Results
Laboratory Market Structure
Overall Medicare Part B Laboratory Market
In 2006, the Medicare program made almost $6.7 billion in Part B payments to physicians and facilities that billed nearly 650 million laboratory test codes6 on behalf of FFS Medicare beneficiaries. The distribution of test code volumes and payments across different laboratory settings is presented in Exhibit 1. Medicare Part B payments for independent laboratory testing were over $2.54 billion, 38.1 percent of all Medicare Part B laboratory test payments. Payments for non-patient tests, including hospital outreach (non-patient) services along with independent laboratories, made up just under half (38.1 + 8.5 = 46.6 percent) of Medicare Part B payments for laboratory tests. These totals include all HCPCS test codes listed in the CLFS, and therefore include waived tests and venipuncture.
4Although there are no “SNF laboratories,” claims for laboratory services in SNFs were found in our data. SNFs were
almost exclusively billing Medicare Part B for “home use” tests that do not require CLIA certification and/or for “waived” tests which require only a CLIA Certificate of Waiver. More than three-quarters of the tests performed in SNFs were glucose tests approved for home use, where the SNF staff members were assisting diabetic patients in monitoring their blood sugar levels.
5Critical access hospitals, located primarily in rural or in underserved areas, received cost-based reimbursement for their outpatient laboratory tests as opposed to being paid according to CLFS.
6If test panels (multiple laboratory tests combined under one test code) were disaggregated, this would have represented roughly 1.4 billion laboratory test codes.

MMRR 2012: Volume 2 (2)
Kandilov, A.M.G., Pope, G.C., Kautter, J., Healy, D. E6
Exhibit 1. National Medicare Part B Volumes and Payments for Clinical Laboratory Test Codes—Calendar Year 2006
Laboratory Type
Volume of Laboratory Test
Codes
Percent of Laboratory Test Code
Volume Medicare Payments
Percent of Medicare Payments
Total 649,077,300 100.0% $6,685,460,031 100.0% Independent Laboratory 218,921,000 33.7 2,543,872,515 38.1 Hospital Non-patient 54,777,440 8.4 565,047,367 8.5 Physician Office Laboratory (POL) 145,509,880 22.4 1,117,329,455 16.7 Other Physician/Supplier Laboratory 54,220 0.0 799,096 0.0 Hospital Outpatient 186,840,420 28.8 1,835,852,729 27.5 Critical Access Hospital (CAH) 20,472,820 3.2 543,434,991 8.1 Skilled Nursing Facility (SNF) 19,977,460 3.1 54,850,649 0.8 Other Institutional 2,524,060 0.4 24,273,229 0.4
NOTE. Five-percent sample volumes and payments have been multiplied by 20 to simulate total national volumes and payments. SOURCE: Authors’ analysis of 2006 Medicare 5-percent sample Hospital Outpatient and Physician/Supplier data.
Laboratory Tests Covered Under Medicare Part B—Volumes and Payments
The top 10 test codes in 2006 by payments and volume are shown in Exhibit 2 and Exhibit 3 for the entire Medicare Part B laboratory market. Of the top 10 HCPCS codes by volume, 8 are also in the top 10 by total Medicare payments, though not necessarily in the same order due to variation in the fee schedule payment associated with each test code. Because our data consists of all HCPCS codes in the fee schedule, waived tests approved for home use (such as the high-volume blood glucose test HCPCS 82962) and venipuncture (HCPCS 36415) are included in the rankings.
Exhibit 2. Top 10 National HCPCS Codes by Medicare Part B Test Code Payments—Calendar Year 2006
Rank HCPCS Description CLIA Specialty Total
Payments
Percent of Total
Payments
Cumulative Percent of
Total Payments
Total Payments/
Total Volume
— TOTAL — — $6,685,460,031 100.0% — $10.13
1 85025
Complete cbc with automated wbc differential Hematology $606,181,587 9.1 9.1% 11.37
2 80053 Comprehen metabolic panel
Chemistry—Routine $529,949,588 7.9 17.0 13.37
3 84443 Assay thyroid stim hormone
Chemistry—Endocrinology $469,176,866 7.0 24.0 23.56
4 80061 Lipid panel Chemistry—Routine $446,486,356 6.7 30.7 14.60
5 36415 Routine venipuncture
Routine venipuncture $337,665,356 5.1 35.7 3.17

MMRR 2012: Volume 2 (2)
Kandilov, A.M.G., Pope, G.C., Kautter, J., Healy, D. E7
Exhibit 2 (cont.) Rank HCPCS Description CLIA Specialty
Total Payments
Percent of Total
Payments
Cumulative Percent of
Total Payments
Total Payments/
Total Volume
6 80048 Basic metabolic panel
Chemistry—Routine $251,791,012 3.8 39.5 11.22
7 85610 Prothrombin time Hematology $227,851,177 3.4 42.9 5.88
8 83036 Glycosylated hemoglobin test
Chemistry—Routine $217,940,561 3.3 46.2 13.61
9 83970 Assay of parathormone
Chemistry—Endocrinology $178,670,871 2.7 48.8 56.95
10 83880 Natriuretic peptide Chemistry—Routine $130,570,527 2.0 50.8 47.35
NOTES. The Centers for Medicare & Medicaid Services regulates all clinical laboratory testing (except research) on humans in the U.S. through the Clinical Laboratory Improvement Amendments (CLIA). HCPCS—healthcare common procedure coding system; CBC—complete blood count; WBC—white blood cell. Five-percent sample payments have been multiplied by 20 to simulate total national payments. SOURCE: Authors’ analysis of 2006 Medicare 5-percent sample Hospital Outpatient and Physician/Supplier data.
Exhibit 3. Top 10 National HCPCS Codes by Medicare Part B Test Code Volumes—CY 2006
Rank HCPCS Description CLIA Specialty Total Volume
Percent of Total Volume
Cumulative Percent of
Total Volume
Total Payments/
Total Volume
— TOTAL — — 659,869,400 100.0% — $10.13
1 36415 Routine venipuncture
Routine venipuncture 106,394,660 16.1 16.1% 3.17
2 85025
Complete cbc with automated wbc differential Hematology 53,308,220 8.1 24.2 11.37
3 80053 Comprehen metabolic panel
Chemistry – Routine 39,624,200 6.0 30.2 13.37
4 85610 Prothrombin time Hematology 38,739,680 5.9 36.1 5.88
5 80061 Lipid panel Chemistry – Routine 30,577,340 4.6 40.7 14.60
6 82962 Glucose blood test Other 24,208,700 3.7 44.4 2.60
7 80048 Basic metabolic panel
Chemistry – Routine 22,444,880 3.4 47.8 11.22
8 84443 Assay thyroid stim hormone
Chemistry – Endocrinology 19,917,060 3.0 50.8 23.56
9 83036 Glycosylated hemoglobin test
Chemistry – Routine 16,018,660 2.4 53.2 13.61
10 81001 Urinalysis, auto w/scope
Chemistry – Urinalysis 10,533,060 1.6 54.8 5.01
NOTES. The Centers for Medicare & Medicaid Services regulates all clinical laboratory testing (except research) on humans in the U.S. through the Clinical Laboratory Improvement Amendments (CLIA). Five-percent sample volumes have been multiplied by 20 to simulate total national volumes. HCPCS—healthcare common procedure coding system; CY—calendar year; CBC—complete blood count; WBC—white blood cell. SOURCE: Authors’ analysis of 2006 Medicare 5-percent sample Hospital Outpatient and Physician/Supplier data.

MMRR 2012: Volume 2 (2)
Kandilov, A.M.G., Pope, G.C., Kautter, J., Healy, D. E8
Medicare clinical laboratory expenditures are concentrated in a relatively small number of HCPCS codes. Of the over 1,000 HCPCS codes on the Medicare CLFS, the top ten HCPCS codes account for over 50 percent of Medicare Part B expenditures (Exhibit 2), and the top 100 HCPCS codes account for about 90 percent of total Medicare Part B expenditures. More than half of the test code volume is contained in just the 10 most frequently billed HCPCS codes (Exhibit 3). The top 50 HCPCS codes account for 82.0 percent of test code volume and the top 200 codes cover 97.5 percent of test code volumes. Hematology and chemistry test panels—groups of individual tests that are routinely ordered together—are among the most common test codes and account for a large share of volume and expenditures. The concentration of the laboratory market in a small fraction of the tests on CLFS suggests that it may not be necessary or efficient to include the full set of 1,000 plus laboratory test codes in the test menu for competitive bidding.
Market Concentration Among Independent Laboratories and Hospital Outreach Laboratories
Independent laboratory firms can consist of one laboratory facility or hundreds. Firm-level analysis is necessary to characterize the market structure of the independently-owned business organizations that can bid against each other for Medicare clinical laboratory testing business. In Exhibit 4, we list the top ten independent laboratory firms as ranked by Medicare payments in 2006, along with an approximation of the number of laboratory facilities operated by them (“Number of Unique CLIA Numbers”) and the number of residence counties of the beneficiaries whose tests were billed by those independent laboratory firms. As we had access to only a 5-percent sample of the Physician/Supplier data, our figures for the number of unique CLIA numbers and number of counties served may be underestimates.
Exhibit 4. Top Ten National Independent Laboratories Ranked by Medicare Part B Payments—Calendar Year 2006
Firm Name
Laboratory Test Payment
Amount
Percent of Total
Independent Laboratory Payments
Cumulative Percentage
Number of Unique CLIA
Numbers
Number of Counties
Served Quest Diagnostics $749,152,581 29.5% 29.5% 206 3,114 Laboratory Corporation of America 479,093,062 18.8 48.3 228 3,041 Spectra 124,185,886 4.9 53.2 3 1,360 DaVita 96,467,181 3.8 57.0 2 938 Sonic Healthcare USA 45,130,769 1.8 58.7 6 773

MMRR 2012: Volume 2 (2)
Kandilov, A.M.G., Pope, G.C., Kautter, J., Healy, D. E9
Exhibit 4 (cont.)
Firm Name
Laboratory Test Payment
Amount
Percent of Total
Independent Laboratory Payments
Cumulative Percentage
Number of Unique CLIA
Numbers
Number of Counties
Served Bio Reference Laboratories Inc 25,274,690 1.0 59.7 1 270 Renalab Inc 20,128,894 0.8 60.5 1 511 Berkeley Heart Lab, Inc 20,102,637 0.8 61.3 1 443 Apax Partners 19,726,055 0.8 62.1 1 425 Nationwide Laboratory Services Inc 16,175,410 0.6 62.7 2 353
NOTES. For a given laboratory firm, each unique CLIA (clinical laboratory improvement amendments) represents a separate laboratory facility. Five-percent sample payments have been multiplied by 20 to simulate total national payments. The "Total" used to calculate "Percent of Total" and "Cumulative Percentage" is total Medicare independent laboratory payments from Exhibit 1; that is, $2,543,872,515. There are 3,141 counties or county equivalents in the United States. SOURCE: Authors’ analysis of 2006 Medicare 5-percent sample Physician/Supplier data.
The Medicare independent laboratory market is dominated by two large national firms—Quest Diagnostics (Quest) and Laboratory Corporation of America (LabCorp). Quest had a 2006 Medicare Part B market share of 29.5 percent, and LabCorp’s market share was 18.8 percent. Together, these two firms received almost half of Medicare Part B payments for independent laboratory tests, a substantial $1.23 billion, which is almost one fifth of the $6.7 billion paid for Medicare Part B for laboratory tests. Each of these laboratory firms operated over 200 CLIA-certified laboratory facilities across the country. The 2006 5-percent Physician/Supplier sample identifies beneficiaries residing in 3,114 counties served by Quest (headquartered in Madison, New Jersey) and residing in 3,041 counties served by LabCorp (headquartered in Burlington, North Carolina), out of 3,141 total counties in the U.S.7
Four of the top 10 independent laboratories serving Medicare Part B in 2006 (Spectra, DaVita, RenaLab, and Nationwide Laboratory Services) are specialty laboratories primarily serving patients with end-stage renal disease (ESRD). ESRD specialty laboratories are discussed further below. Of the 4 remaining independent laboratory firms among the top 10—Sonic Healthcare USA; Bio Reference Laboratories, Inc; Berkeley Heart Lab, Inc.; and Apax Partners—3 had only one laboratory facility.8 None of these laboratory firms have more than a 2-percent
7More information about these companies can be found at
http://www.questdiagnostics.com/common/contactus/contact_index.html for Quest Diagnostics, and https://www.LabCorp.com/wps/portal/aboutus/ for LabCorp.
8Bio-Reference operated a full service clinical laboratory and an andrology laboratory. The main laboratory is located in Elmwood Park, New Jersey and the andrology laboratory is on Park Avenue in New York City; Berkeley HeartLab performed all testing in a 40,000 square foot CLIA-certified laboratory in Alameda, California; and Apax Partners was set to acquire Spectrum labs. More information about these firms can be found at

MMRR 2012: Volume 2 (2)
Kandilov, A.M.G., Pope, G.C., Kautter, J., Healy, D. E10
market share of independent laboratory payments, and all 4 serve a much more limited number of counties, meaning that these are likely regional laboratories as opposed to nationally competing laboratories like Quest and LabCorp. Altogether, the top ten independent laboratory firms received 62.7 percent of Medicare payments for independent laboratory tests.
Examining the market shares of the largest (in terms of Medicare Part B payments for non-patient tests) hospital systems in Exhibit 5, we find that no hospital system dominated the national market among hospital outreach laboratories in the way that Quest and LabCorp dominated the independent laboratory market.9 The hospitals belonging to the Ascension Health system make up the largest share of the hospital outreach market, with over $17 million in Medicare payments in 2006 (3.1 percent of hospital outreach total). Compare this to the almost $750 million in Medicare payments received by Quest (Exhibit 4). Cumulatively, the top 10 hospital networks account for only 15.3 percent of Medicare Part B laboratory payments for hospital outreach laboratory testing (and the top 25 receive only one-quarter of payments).
Exhibit 5. Top 10 National Hospital Outreach Laboratories Ranked by Medicare Part B Payments for Non-Patients—Calendar Year 2006
Hospital System Name
Laboratory Test Payment
Amounts
Percent of Total
Hospital Outreach Payments
Cumulative Percentage
Number of Unique
Providers
Number of Counties
Served Ascension Health $17,441,171 3.1% 3.1% 39 408 Catholic Health East 10,861,517 1.9 5.0 17 296 Quorum Health Resources 10,668,302 1.9 6.9 91 513 Catholic Health Initiatives 9,932,434 1.8 8.7 40 366 Catholic Healthcare Partners 7,804,772 1.4 10.0 26 170 William Beaumont Hospitals 7,547,720 1.3 11.4 2 87 John Muir/Mt Diablo Health System 6,713,146 1.2 12.6 1 76 Trinity Health 5,793,379 1.0 13.6 30 235 Novant Health 5,040,747 0.9 14.5 4 86 Sentara Healthcare 4,600,639 0.8 15.3 6 110
NOTE. Five-percent sample payments have been multiplied by 20 to simulate total national payments. SOURCE: Authors’ analysis of 2006 Medicare 5-percent sample Hospital Outpatient data.
At the national level, then, the market for hospital outreach laboratory services is significantly less concentrated than the market for independent laboratory services. Although no hospital system is a viable national competitor to Quest and LabCorp in the non-patient testing market,
http://www.bioreference.com/lablist.aspx, http://www.bhlinc.com/abou_lab.php, and http://www.apax.com/en/news/story_1369.html, respectively.
9The crosswalk from individual hospitals to hospital systems is based on AHA data from 2004, and so may not accurately reflect the hospital systems present in the CY 2006 claims data, though we do not expect the differences to be large.

MMRR 2012: Volume 2 (2)
Kandilov, A.M.G., Pope, G.C., Kautter, J., Healy, D. E11
individual hospitals and systems are actually, or potentially, strong local competitors to independent laboratories. Hospital laboratories conduct in-patient and out-patient testing in addition to the non-patient testing reflected in Exhibit 5, and typically have substantial financial resources and local market positions.
Independent Laboratory Market by U.S. Census Region and Urbanicity
Quest and LabCorp clearly dominate the independent laboratory market, as they are responsible for almost 50 percent of Medicare payments for laboratory tests performed by independent laboratories, and the next largest independent laboratory receives just 5 percent of payments (see Exhibit 4). The next two Exhibits, Exhibit 6 and Exhibit 7, present Quest and LabCorp market shares for the entire Medicare laboratory test market, for the non-patient laboratory test market, and for the independent laboratory market, across census divisions and across varying levels of urbanicity, respectively.
Exhibit 6. Quest Diagnostics and Laboratory Corporation of America Market Share by Census Division—Calendar Year 2006
Share of Total
Laboratory Market Share of Non-Patient
Laboratory Market Share of Independent
Laboratory Market Census Division Quest LabCorp Quest LabCorp Quest LabCorp
Total 11.2% 7.2% 24.1% 15.4% 29.5% 18.9% New England 13.4 2.7 32.3 6.4 43.5 8.6 Middle Atlantic 18.7 4.3 35.2 8.1 41.5 9.6 East North Central 7.7 3.3 18.8 8.1 26.0 11.2 West North Central 5.9 3.4 17.3 10.0 25.2 14.6 South Atlantic 11.3 12.9 22.5 25.7 26.8 30.7 East South Central 6.9 12.6 15.1 27.7 18.8 34.6 West South Central 9.0 9.1 19.5 19.8 21.5 21.9 Mountain 15.5 7.5 34.7 16.8 39.4 19.1 Pacific 12.9 5.5 26.0 11.1 30.2 12.9 Other 3.3 1.1 4.0 1.3 4.1 1.4
NOTE. The “Other” category encompasses Medicare beneficiaries living in U.S. territories or outside of the U.S.; the vast majority of the payments in this category are for beneficiaries in Puerto Rico. SOURCE: Authors’ analysis of 2006 Medicare 5-percent sample Hospital Outpatient and Physician/Supplier data.
Of the approximately $6.7 billion that Medicare Part B paid for laboratory tests in 2006, Quest received 11.2 percent and LabCorp received 7.2 percent. Although, at the national level, Quest controls a larger share of the Medicare laboratory test market than LabCorp, Exhibit 6 shows that there is considerable regional variation in the relative shares of these two top independent laboratory firms. Quest, headquartered in Madison, NJ, has more than four times the LabCorp share of the total Medicare laboratory market in the New England and Middle Atlantic states. However, Quest does not dominate uniformly across the country, as LabCorp has a slight advantage in the South Atlantic and East South Central states, states that are closer to its headquarters in Burlington, NC. Both Quest and LabCorp are relatively less important in the East North Central and the West North Central states (collectively, the Midwest), accounting for
MMRR 2012: Volume 2 (2)
Kandilov, A.M.G., Pope, G.C., Kautter, J., Healy, D. E12
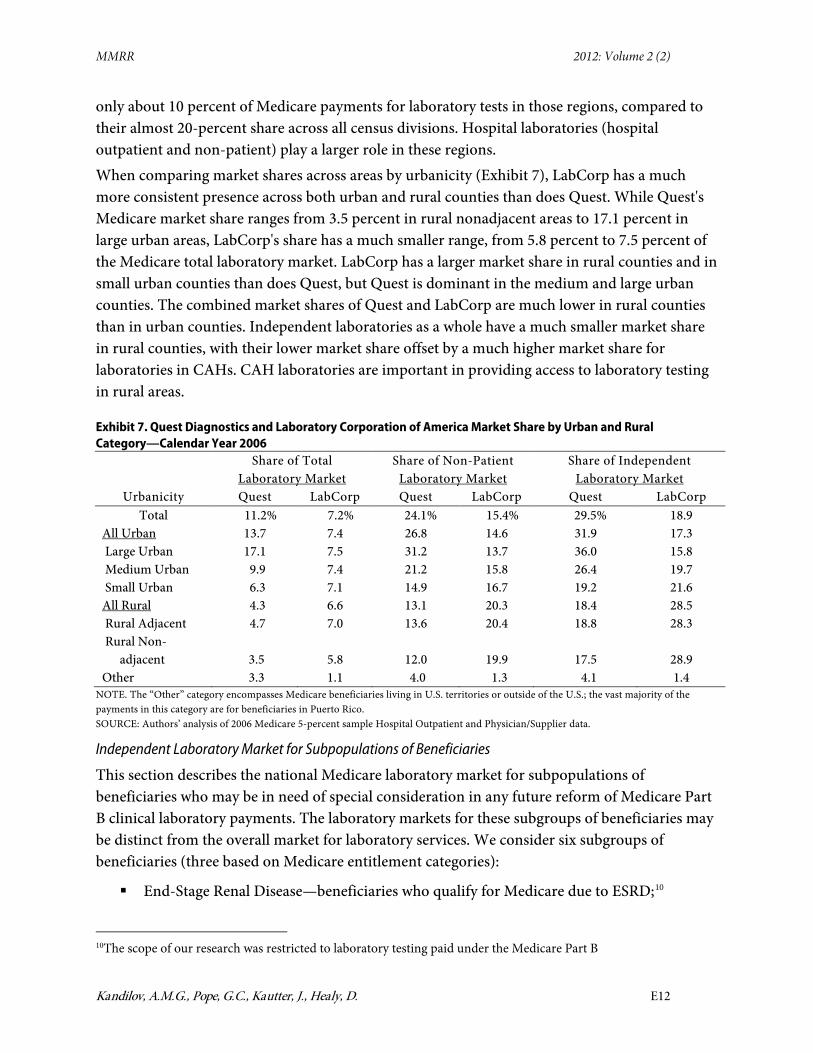
only about 10 percent of Medicare payments for laboratory tests in those regions, compared to their almost 20-percent share across all census divisions. Hospital laboratories (hospital outpatient and non-patient) play a larger role in these regions. When comparing market shares across areas by urbanicity (Exhibit 7), LabCorp has a much more consistent presence across both urban and rural counties than does Quest. While Quest's Medicare market share ranges from 3.5 percent in rural nonadjacent areas to 17.1 percent in large urban areas, LabCorp's share has a much smaller range, from 5.8 percent to 7.5 percent of the Medicare total laboratory market. LabCorp has a larger market share in rural counties and in small urban counties than does Quest, but Quest is dominant in the medium and large urban counties. The combined market shares of Quest and LabCorp are much lower in rural counties than in urban counties. Independent laboratories as a whole have a much smaller market share in rural counties, with their lower market share offset by a much higher market share for laboratories in CAHs. CAH laboratories are important in providing access to laboratory testing in rural areas.
Exhibit 7. Quest Diagnostics and Laboratory Corporation of America Market Share by Urban and Rural Category—Calendar Year 2006
Share of Total
Laboratory Market Share of Non-Patient
Laboratory Market Share of Independent
Laboratory Market Urbanicity Quest LabCorp Quest LabCorp Quest LabCorp
Total 11.2% 7.2% 24.1% 15.4% 29.5% 18.9 All Urban 13.7 7.4 26.8 14.6 31.9 17.3 Large Urban 17.1 7.5 31.2 13.7 36.0 15.8 Medium Urban 9.9 7.4 21.2 15.8 26.4 19.7 Small Urban 6.3 7.1 14.9 16.7 19.2 21.6 All Rural 4.3 6.6 13.1 20.3 18.4 28.5 Rural Adjacent 4.7 7.0 13.6 20.4 18.8 28.3 Rural Non- adjacent 3.5 5.8 12.0 19.9 17.5 28.9 Other 3.3 1.1 4.0 1.3 4.1 1.4
NOTE. The “Other” category encompasses Medicare beneficiaries living in U.S. territories or outside of the U.S.; the vast majority of the payments in this category are for beneficiaries in Puerto Rico. SOURCE: Authors’ analysis of 2006 Medicare 5-percent sample Hospital Outpatient and Physician/Supplier data.
Independent Laboratory Market for Subpopulations of Beneficiaries
This section describes the national Medicare laboratory market for subpopulations of beneficiaries who may be in need of special consideration in any future reform of Medicare Part B clinical laboratory payments. The laboratory markets for these subgroups of beneficiaries may be distinct from the overall market for laboratory services. We consider six subgroups of beneficiaries (three based on Medicare entitlement categories):
End-Stage Renal Disease—beneficiaries who qualify for Medicare due to ESRD;10
10The scope of our research was restricted to laboratory testing paid under the Medicare Part B

MMRR 2012: Volume 2 (2)
Kandilov, A.M.G., Pope, G.C., Kautter, J., Healy, D. E13
Institutionalized—beneficiaries who have resided for at least 3 consecutive months in a nursing facility/skilled nursing facility;
Home Health—beneficiaries who receive Medicare home health services and are likely homebound;
Disabled—beneficiaries who qualify for Medicare due to disability (all under age 65);
Dual-Eligible—Medicare beneficiaries for whom the state Medicaid program pays part or all of their Part B premiums and cost sharing; and
Aged—beneficiaries who qualify for Medicare due to age and do not meet any of the previous conditions.
These categories are constructed to be hierarchical and mutually exclusive, so that Medicare beneficiaries are grouped into the first applicable category listed above and excluded from subsequent categories. Thus, for example, there are no ESRD beneficiaries in any of the other categories, and non-ESRD institutionalized beneficiaries do not appear in any of the subsequent categories.
In interpreting the subpopulation results for ESRD beneficiaries, it is important to understand certain aspects of the Medicare payment system for clinical laboratory tests provided to them. Under the Medicare payment system for beneficiaries with ESRD in 2006, a composite or “bundled” payment was made to dialysis facilities including certain chemistry, hematology, and coagulation laboratory tests at specified frequencies (per treatment, weekly, and monthly). When ordered more often than the frequency specified in the composite rate, these tests could be separately billable to Medicare Part B on a FFS basis if medical justification was provided and in accordance with other Medicare billing rules specific to laboratory tests for ESRD beneficiaries. Additional laboratory tests are ordered on a regular basis through the dialysis facility for the majority of patients with ESRD to monitor and treat common co-morbid conditions of ESRD. With implementation of the prospective payment system (PPS) for ESRD in 2011, laboratory services associated with dialysis sessions are included in the PPS bundle, and so the volume of laboratory testing separately billable to Medicare Part B will be lower than in our 2006 data.
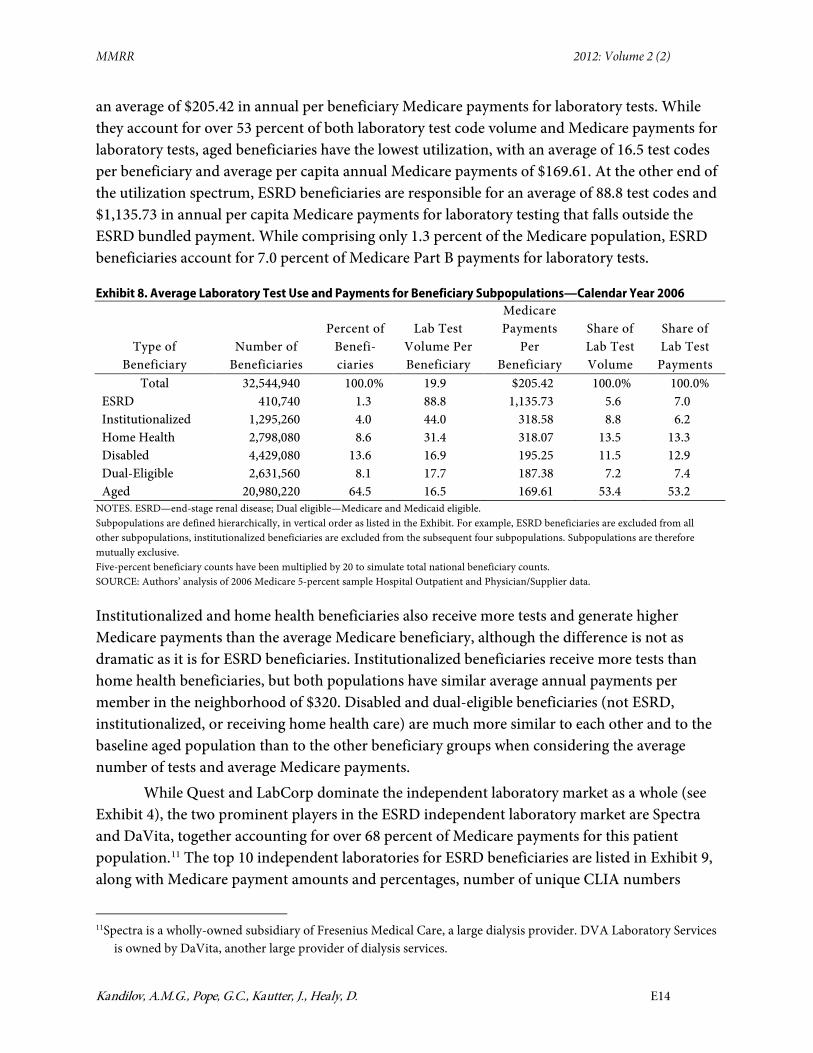
The number and percentage of Medicare beneficiaries in each of the six hierarchical sub-groups is detailed in Exhibit 8, along with averages and total shares of test code volumes and payments for each beneficiary type. In 2006, approximately 32.5 million FFS Medicare beneficiaries received Medicare Part B benefits. On average, each Medicare Part B FFS beneficiary had 19.9 laboratory test codes paid under Medicare Part B in 2006, which generated
clinical laboratory fee schedule. Thus, we only included testing for ESRD beneficiaries paid under the Part B CLFS, but did not include testing paid under the ESRD bundled payment.
MMRR 2012: Volume 2 (2)
Kandilov, A.M.G., Pope, G.C., Kautter, J., Healy, D. E14
an average of $205.42 in annual per beneficiary Medicare payments for laboratory tests. While they account for over 53 percent of both laboratory test code volume and Medicare payments for laboratory tests, aged beneficiaries have the lowest utilization, with an average of 16.5 test codes per beneficiary and average per capita annual Medicare payments of $169.61. At the other end of the utilization spectrum, ESRD beneficiaries are responsible for an average of 88.8 test codes and $1,135.73 in annual per capita Medicare payments for laboratory testing that falls outside the ESRD bundled payment. While comprising only 1.3 percent of the Medicare population, ESRD beneficiaries account for 7.0 percent of Medicare Part B payments for laboratory tests.
Exhibit 8. Average Laboratory Test Use and Payments for Beneficiary Subpopulations—Calendar Year 2006
Type of Beneficiary
Number of Beneficiaries
Percent of Benefi- ciaries
Lab Test Volume Per Beneficiary
Medicare Payments
Per Beneficiary
Share of Lab Test Volume
Share of Lab Test
Payments Total 32,544,940 100.0% 19.9 $205.42 100.0% 100.0%
ESRD 410,740 1.3 88.8 1,135.73 5.6 7.0 Institutionalized 1,295,260 4.0 44.0 318.58 8.8 6.2 Home Health 2,798,080 8.6 31.4 318.07 13.5 13.3 Disabled 4,429,080 13.6 16.9 195.25 11.5 12.9 Dual-Eligible 2,631,560 8.1 17.7 187.38 7.2 7.4 Aged 20,980,220 64.5 16.5 169.61 53.4 53.2
NOTES. ESRD—end-stage renal disease; Dual eligible—Medicare and Medicaid eligible. Subpopulations are defined hierarchically, in vertical order as listed in the Exhibit. For example, ESRD beneficiaries are excluded from all other subpopulations, institutionalized beneficiaries are excluded from the subsequent four subpopulations. Subpopulations are therefore mutually exclusive. Five-percent beneficiary counts have been multiplied by 20 to simulate total national beneficiary counts. SOURCE: Authors’ analysis of 2006 Medicare 5-percent sample Hospital Outpatient and Physician/Supplier data.
Institutionalized and home health beneficiaries also receive more tests and generate higher Medicare payments than the average Medicare beneficiary, although the difference is not as dramatic as it is for ESRD beneficiaries. Institutionalized beneficiaries receive more tests than home health beneficiaries, but both populations have similar average annual payments per member in the neighborhood of $320. Disabled and dual-eligible beneficiaries (not ESRD, institutionalized, or receiving home health care) are much more similar to each other and to the baseline aged population than to the other beneficiary groups when considering the average number of tests and average Medicare payments.
While Quest and LabCorp dominate the independent laboratory market as a whole (see Exhibit 4), the two prominent players in the ESRD independent laboratory market are Spectra and DaVita, together accounting for over 68 percent of Medicare payments for this patient population.11 The top 10 independent laboratories for ESRD beneficiaries are listed in Exhibit 9, along with Medicare payment amounts and percentages, number of unique CLIA numbers
11Spectra is a wholly-owned subsidiary of Fresenius Medical Care, a large dialysis provider. DVA Laboratory Services
is owned by DaVita, another large provider of dialysis services.

MMRR 2012: Volume 2 (2)
Kandilov, A.M.G., Pope, G.C., Kautter, J., Healy, D. E15
(facilities), and the number of counties served by each laboratory firm. Unlike Quest and LabCorp, which each have more than 200 laboratory facilities located throughout the country, Spectra and DaVita each have just a few central laboratories that serve ESRD patients from all over the U.S.
Exhibit 9. Top Ten National Independent Laboratories for Medicare End Stage Renal Disease Beneficiaries—Calendar Year 2006
Firm Name
Medicare Part B Lab Test Payment Amount
Percent of Total
Cumulative Percentage
Number of Unique CLIA
Numbers
Number of Counties
Served Spectra $122,577,794 38.3% 38.3% 2 1,356 DaVita 95,522,041 29.9 68.2 2 934 Renalab Inc 19,911,580 6.2 74.4 1 509 Satellite Laboratory Services LLC
15,887,217 5.0 79.4 1 281
Nationwide Laboratory Services Inc
15,733,092 4.9 84.3 2 312
Quest Diagnostics 10,191,802 3.2 87.5 117 800 DCI Laboratory 6,523,335 2.0 89.5 2 205 Laboratory Corporation of America
6,421,642 2.0 91.5 112 899
Quentin Medical Lab Inc 2,928,842 0.9 92.4 1 10 Scantibodies Clinical Laboratory 2,863,954 0.9 93.3 1 103
NOTES. For a given laboratory firm, each unique CLIA (clinical laboratory improvement amendments) represents a separate laboratory facility. Five-percent sample payments have been multiplied by 20 to simulate total national payments. SOURCE: Authors’ analysis of 2006 Medicare 5-percent sample Physician/Supplier data.
The combined market share for Quest and LabCorp among the ESRD subpopulation is only 5.2 percent of their Medicare Part B clinical laboratory payments. Seven of the remaining 8 laboratories among the top 10 cater almost exclusively to the ESRD patient population, and together these 10 laboratories account for over 93 percent of Medicare payments for the laboratory tests of ESRD beneficiaries. This is a more concentrated market than the overall independent laboratory market, where the top 10 laboratories receive 62.7 percent of Medicare payments for independent laboratory tests (see Exhibit 4).
Despite the dominance of Spectra and DaVita nationally, some localized laboratory firms do provide services to ESRD beneficiaries. For example, the 7th largest laboratory for ESRD beneficiaries, DCI Laboratory, is a network of 26 dialysis facilities throughout the state of Tennessee. Quentin Medical Lab Inc. is also more localized, with nine locations throughout New York City. The market areas for DCI Laboratory and for Quentin Medical Lab Inc. are much more regional than the market area for the national laboratories such as Spectra and DaVita.

MMRR 2012: Volume 2 (2)
Kandilov, A.M.G., Pope, G.C., Kautter, J., Healy, D. E16
We next consider the institutionalized population. Nationally the independent laboratory market for the institutionalized is much less concentrated than the market for all Medicare beneficiaries. Exhibit 10 lists the top ten independent laboratories for the institutionalized population as ranked by Medicare Part B payments. The combined market share for LabCorp and Quest among the institutionalized, at 17.2 percent, is less than half of their combined market share for all Medicare beneficiaries (48.3 percent) from Exhibit 4. The top 10 independent laboratories for the institutionalized together account for 40.5 percent of Medicare payments, compared to 62.7 percent of payments for the top 10 independent laboratories overall. Given that the independent laboratory market for institutionalized beneficiaries is much less concentrated at the national level than the overall independent laboratory market, it appears that these beneficiaries are more likely to be served by local independent laboratories.
Exhibit 10. Top Ten National Independent Laboratories for Institutionalized Medicare Beneficiaries—Calendar Year 2006
Firm Name
Medicare Part B Laboratory Test Payment
Amount Percent of
Total Cumulative Percentage
Number of Unique CLIA
Numbers
Number of Counties
Served Laboratory Corporation of America
$14,688,341 9.0% 9.0% 110 1,210
Quest Diagnostics 13,384,485 8.2 17.3 103 999 Laboratory Partners 8,083,737 5.0 22.2 5 186 Diagnostic Laboratories 6,741,881 4.1 26.4 1 48 Acculabs 6,296,139 3.9 30.2 2 105 Prolab 5,006,509 3.1 33.3 2 122 NICL Laboratories 3,732,046 2.3 35.6 1 45 Professional Clinical Laboratory Inc
2,815,343 1.7 37.3 1 86
Gamma Healthcare 2,787,423 1.7 39.1 3 144 Lifescan Laboratory Inc 2,355,157 1.4 40.5 1 39
NOTES. CLIA—clinical laboratory improvement amendments Five-percent sample payments have been multiplied by 20 to simulate total national payments. SOURCE: Authors’ analysis of 2006 Medicare 5-percent sample Physician/Supplier data.
Although we examined the top ten independent laboratory firms for four other subsets of Medicare beneficiaries—Home Health, Disabled, Dual-Eligible, and Aged—we did not find evidence at the national level that these beneficiaries are served by a significantly different market structure of independent laboratory testing firms than the overall Medicare population.
Implications of Laboratory Market Structure for Competitive Bidding
Competitive bidding is one potential method of determining Medicare prices for Part B clinical laboratory test services. In this study we analyzed the Medicare clinical laboratory market
MMRR 2012: Volume 2 (2)
Kandilov, A.M.G., Pope, G.C., Kautter, J., Healy, D. E17
structure. We now discuss implications of our analyses for possible future Medicare competitive bidding efforts.
National and Local Bidding Competitions
Quest and LabCorp each have a significant market share of Medicare laboratory testing, and we have shown that they each serve large numbers of Medicare beneficiaries in all parts of the country. This suggests that CMS could consider holding a bidding competition among Quest, LabCorp, and any other organizations that could qualify as “national laboratories” (specific criteria would have to be developed).12 The winner(s) of this bidding competition would be designated as “national Medicare laboratories” that are qualified to provide services nationally. The national Medicare business could be periodically re-competed. The primary advantage of bidding on a national basis is that the national firms would have an incentive to bid aggressively, because their entire national Medicare business would be at stake. Also, a single nationwide competition could achieve substantial economies in the bidding and contracting process.
Economic theory suggests that two firms could be sufficient to ensure that Medicare receives a competitive price for laboratory tests. In a Bertrand model of competition, if the product is homogenous and firms compete on price, then two firms are sufficient to achieve a competitive price under sealed bid competitive bidding (Varian, 1992). The empirical evidence presented above supports a Bertrand model for the most common laboratory tests, for which national competition between Quest and LabCorp could reduce CMS payments for laboratory testing. First, the most common tests on the CLFS, including the complete blood count (CBC), and its components, no longer require the skills of a pathologist or physician to perform. (Tests with a professional component are on the physician fee schedule.) Consequently, with the exception of a few esoteric laboratory tests, a specific laboratory test is a homogenous test or product across laboratories.
Also, many large private insurers contract with either Quest or LabCorp exclusively. LabCorp has exclusive contracts for HMO benefit plans of PacifiCare of Colorado, PacifiCare of Arizona, Neighborhood Health Partnership in Florida, and Mid Atlantic Medical Services in Maryland and Virginia,13 as well as Horizon Blue Cross Blue Shield of NJ.14 Quest is the preferred provider for Coventry Healthcare. However, the most convincing evidence is that in 2007, United Healthcare, with 25-million members, signed a 10-year-exclusive contract with LabCorp that extended through 2018,15 while Aetna, with 17.5 million members, signed an exclusive contract for laboratory services with Quest Diagnostics.16 United and Aetna are two large national insurers that, combined, cover more lives than Medicare FFS with approximately 12Possibly, over time, networks of hospital or independent laboratories could form to compete with Quest and LabCorp on a national basis for Medicare business. 13http://www.genomeweb.com/blog/LabCorp-extends-payor-deal-unitedhealthcare 14http://www.horizon-bcbsnj.com/members/LabCorp.html?wt.svl=leftnav 15http://www.genomeweb.com/blog/LabCorp-extends-payor-deal-unitedhealthcare 16Clinical laboratory News, May 2007: Volume 33, Number 5.
MMRR 2012: Volume 2 (2)
Kandilov, A.M.G., Pope, G.C., Kautter, J., Healy, D. E18
36 million in 2010.17 These national private insurers have already shown that exclusive contracting (i.e., competitive bidding) for laboratory services works on a national level, and it can therefore work for Medicare.
CMS could also sponsor bidding competitions in local areas for local or regional independent laboratories and hospitals and integrated delivery systems. These organizations could compete against other local and regional organizations, but not against the national laboratories if a national bidding competition were held for the national laboratories. Or only local/regional bidding competitions could be held including both the national and local/regional laboratories, with the winners of each competition serving that area.
Laboratories Specializing in Certain Medicare Subpopulations
ESRD beneficiaries are served mainly by national laboratories associated with dialysis firms (see Exhibit 9); this market is distinct from the general non-ESRD Medicare market. With the 2011 implementation of the PPS for ESRD, laboratory services associated with dialysis sessions will be included in the PPS bundle. To the extent that other laboratory tests for ESRD beneficiaries (e.g., for comorbid conditions) continue to be billed through regular Medicare FFS after the PPS is implemented, it may be possible to include them as part of competitive bidding. This could be done by including ESRD beneficiary tests as part of the general competitive bidding competition with provisions (e.g., multiple winners, including some specializing in ESRD) to ensure continued access of ESRD beneficiaries to testing. Another option could be a separate bidding competition for tests provided to ESRD beneficiaries—it appears that there are enough laboratories specializing in ESRD beneficiaries to make this feasible in many areas.
Laboratory tests for long-term residents of nursing homes seems to be a different market than laboratory tests for community residents, as shown in Exhibit 10. This market appears to be primarily served by only one or a small number of laboratory firms in many areas, including local independent laboratories. If tests for nursing home residents are to be included in competitive bidding, some of the winning laboratories would need to be willing and able to serve this market. Possibly a separate bidding competition could be held for nursing home business, although the number of competitors may be small in many areas. Alternatively, nursing home beneficiaries could be excluded from the bidding competition, but their tests could be paid under the competitively-determined fee schedule.
Laboratory Tests Included in Competitive Bidding (Test Menu)
Medicare laboratory test volume and expenditures are highly concentrated (see Exhibits 2 and 3), therefore a bidding competition including only the top 100 or 200 test codes would encompass most of the market. Competition is greatest in supplying the most common tests, and the burden of bidding on a smaller number of test codes may be lower than bidding on the full CLFS. Limiting the competition to only the more common tests could be reevaluated in
17Table III.A3, 2011 Medicare Trustees Report, https://www.cms.gov/ReportsTrustFunds/downloads/tr2011.pdf.

MMRR 2012: Volume 2 (2)
Kandilov, A.M.G., Pope, G.C., Kautter, J., Healy, D. E19
future bidding designs, keeping in mind that including a broader range of tests minimizes possibilities for gaming (e.g., substituting tests in and out of the top test list), avoids clinically arbitrary distinctions in what tests are included, and establishes a consistent payment methodology for a larger share of the market.
Conclusion
In this article, we have focused on the national Medicare clinical laboratory market. Although a national analysis has the greatest generality, for bidding competitions conducted at the local level, local market structure is key and market-specific analysis would be important in identifying the characteristics of the local market for laboratory testing.
Implementation of competitive bidding for Medicare clinical laboratory services has the potential to not only lower Medicare expenditures, but to change clinical laboratory market structure. For example, competitive bidding could reduce prices paid by Medicare for laboratory tests to the marginal costs of large national laboratories that can take advantage of economies of scale and perform some tests at lower costs than smaller establishments. In this case, smaller laboratories such as physician office laboratories may minimize losses by outsourcing their laboratory testing to an independent or hospital laboratory instead of providing those tests themselves.
Disclaimer The statements contained in this article are those of the authors and do not necessarily reflect the views or policies of the Centers for Medicare & Medicaid Services.
Correspondence Amy M. Gass Kandilov, Ph.D. RTI International—Health Care Financing and Payments, 3040 Cornwallis Rd., PO Box 12194, Research Triangle Park, NC 27709-2194, [email protected], Tel: 919-541-7111, Fax: 919-990-8454
Acknowledgement The authors are grateful to Linda Lebovic, Dan Layne, and other CMS staff for their contributions to this study.

MMRR 2012: Volume 2 (2)
Kandilov, A.M.G., Pope, G.C., Kautter, J., Healy, D. E20
References
Carlson, B. (2010). Seeking a Coding Solution for Molecular Tests. Biotechnology HealthCare, 7(4), 16–20. PubMed
CMS (Centers for Medicare & Medicaid Services). (2012). Affordable Care Act—Section 3113—Laboratory Demonstration for Certain Complex Diagnostic Tests. Medicare Learning Network Matters No. MM7278. Retrieved from http://www.cms.gov/Outreach-and-Education/Medicare-Learning-Network-MLN/MLNMattersArticles/downloads//MM7516.pdf
CMS (Centers for Medicare & Medicaid Services). (2011). Medicare Claims Processing Manual, Chapter 16—Laboratory Services (Rev. 2136, 1-21-11). Retrieved from http://www.cms.gov/Regulations-and-Guidance/Guidance/Manuals/downloads//clm104c16.pdf
CMS (Centers for Medicare and Medicaid Services). (2010). Data Compendium. Retrieved from http://www.cms.gov/Research-Statistics-Data-and-Systems/Statistics-Trends-and-Reports/DataCompendium/14_2010_Data_Compendium.html
Hoerger, T. J., & Meadow, A. (1997). Developing Medicare competitive bidding: a case study of clinical laboratories. Health Care Financing Review, 19(1), 59–86. PubMed
IOM (Institute of Medicine). (2000). “Medicare Laboratory Payment Policy, Now and in the Future.” In D. Miller Wolman, A. L. Kalfoglou, & L. LeRoy (Eds.). Washington, D.C.: National Academy Press.
Mennemeyer, S. T. (1989). Competitive bidding for Medicare outpatient laboratory services. In R.M. Scheffler & L.F. Rossiter (Eds.), Advances in health economics and health services research: Risk-based payments under public programs (Vol. 10, pp. 313–334).
OIG (Office of Inspector General). (2009). Variation in the Clinical Laboratory Fee Schedule. OIG report no. OEI-05-08-00400. Retrieved from http://oig.hhs.gov/oei/reports/oei-05-08-00400.pdf
Pope, G. C., Kautter, J., Ellis, R. P., Ash, A. S., Ayanian, J. Z., Lezzoni, L. I., et al. (2004). Risk adjustment of Medicare capitation payments using the CMS-HCC model. Health Care Financing Review, 25(4), 119–141. Retrieved from https://www.cms.gov/HealthCareFinancingReview/Downloads/04Summerpg119.pdf
Varian, H. (1992). Microeconomic Analysis. Third Edition. New York: W.W. Norton & Company.

MMRR 2012 Volume 2, Number 2
ISSN: 2159-0354 doi: http://dx.doi.org/10.5600/mmrr.002.02.a04 E21
Medicare & Medicaid Research Review 2012
Volume 2, Number 2
Mission Statement
Medicare & Medicaid Research Review is a peer-reviewed, online journal reporting data and research that informs current and future directions of the Medicare, Medicaid, and Children’s Health Insurance programs. The journal seeks to examine and evaluate health care coverage, quality and access to care for beneficiaries, and payment for health services.
http://www.cms.gov/MMRR/
U.S. Department of Health & Human Services
Kathleen Sebelius Secretary
Centers for Medicare & Medicaid Services Marilyn Tavenner
Acting Administrator
Center for Strategic Planning Anthony D. Rodgers
Deputy Administrator and Director
Editor-in-Chief David M. Bott, Ph.D. Senior Editor Cynthia Riegler, M.A.
Associate Editors John Hsu, M.D., M.B.A, M.S.C.E.
Harvard Medical School James H. Marton, Ph.D
Georgia State University
Jennifer Polinski, Sc.D, M.P.H. Brigham & Women's Hospital
Robert Weech-Maldonado, Ph.D. University of Alabama at Birmingham
Editorial Board Gerald S. Adler, M.Phil.
CMS/Center for Strategic Planning Andrew Bindman, M.D.
University of California, San Francisco William J. Buczko, Ph.D.
CMS/Innovation Center Todd Caldis, Ph.D., J.D.
CMS/Office of the Actuary Craig F. Caplan, M.A.
CMS/ Center for Medicare
Melissa A. Evans, Ph.D. CMS/Center for Program Integrity
Jesse M. Levy, Ph.D. CMS/ Innovation Center
Isidor R. Strauss, F.S.A. CMS/Office of the Actuary
Fred G. Thomas, Ph.D., C.P.A. CMS/ Innovation Center
Contact: [email protected]
Published by the Centers for Medicare & Medicaid Services All material in the Medicare & Medicaid Research Review is in the public domain and may be duplicated without permission.
Citation to source is requested.