The Nairobi Informal Settlements - Charity Reviews and
29
The Nairobi Informal Settlements: An emerging food security emergency within extreme chronic poverty A compilation and synthesis of key food security, livelihood, nutrition and public health data Oxfam GB, Concern Worldwide & CARE International in Kenya April 2009
Transcript of The Nairobi Informal Settlements - Charity Reviews and

The Nairobi Informal Settlements:
An emerging food security emergency within extreme chronic poverty
A compilation and synthesis of key
food security, livelihood, nutrition and public health data
Oxfam GB, Concern Worldwide & CARE International in Kenya
April 2009

2
Executive Summary
In March 2009, Oxfam GB, Concern Worldwide and CARE International in Kenya commissioned a
technical review of available data on the status of food security, livelihoods, nutrition and public
health in the Nairobi slums/informal settlements. The purpose of the technical review was two-fold:
1) begin a process of consolidating key information on the Nairobi slums for assessing current status
and future trends and 2) assess whether a food security emergency was currently occurring in the
slums.
On beginning a process of consolidating key information on the current situation of the Nairobi slums,
this was done in recognition that there is a lack of disaggregated and long term data on the food
security, livelihoods, nutrition and public health situations of residents of these informal settlements,
not only in Nairobi but in Kenya as a whole. There is a need for ongoing reliable data collection and
synthesis to increase the knowledge base of the current situation in urban slums and ongoing
awareness of critical trends.
On assessing whether a food security emergency is occurring, it is clear that there is limited
information to fully understand the current situation and the impact of recent shocks, in particular high
food prices on the nutrition and health status of the urban poor. For background, on 16 January,
President Kibaki formally declared a Kenya food shortage to be a national emergency, with one out of
every three Kenyans (10 million) reported to be threatened by starvation. Subsequently, the Kenya
Food Security Steering Group Short Rains Assessment (KFSSG SRA 2009) stated, “… at least 4.1
million urban dwellers to be extremely food insecure and have difficulty meeting their food needs on a
predictable basis.”
The declaration of a national food security emergency was based on a number of critical problems.
The KFSSG report noted that the combination of the poor 2008 long and short rain seasons, reduced
hectarage planted due to the post election violence, high input costs and resulting sub-optimal
application of recommended inputs, resulted in a 2008 annual maize production of 2.34 million MTs,
which was 15% below recent years’ averages and around 22% below annual national consumption
requirements. Exacerbating the shortfall is an expected 60% reduction in cross border imports from
Tanzania and Uganda. At the same time, Kenya’s national strategic reserve had fallen inappropriately
low. The 2009 KFSSG report stated that the country’s reserve for the staple maize was at 72,000
MTs, equivalent to slightly over one week’s supply for the national annual consumption of 3 million
MTs. As maize is the staple food for around 90% of the Kenyan population, and as other staple grains
are equally depleted, it is no surprise that the Kenyan Government announced in early 2009 an
emergency food security crisis in the country.
The Government’s declaration that at least 4.1 million urban dwellers are extremely food insecure was
not supported by clear data. As noted above, there is limited information on the status of such key
indicators as food security, livelihoods, nutrition and health in the urban slums, and especially limited
information on trends. This is especially problematic for the urban poor as they typically reside in
slums that are marked by extreme chronic poverty within highly dense populated areas. In such
settings, it is not a simple task to differentiate extreme chronic poverty from an emerging emergency
situation. So a key purpose of this technical brief was to better specify the current humanitarian
situation in the urban slums of Kenya at a time of a declared national food security emergency.

3
This technical brief, faced with a challenge of limited data sources, primarily referred to the above
noted Kenya Food Security Steering Group Short Rains Assessment (KFSSG SRA 2009), two
nutrition surveys (Kibera and Mathare 2008), one sentinel site nutrition survey conducted in Mathare
slum in January 2009, a 2008 acute malnutrition caseload synthesis from MoH/NCC/Concern and
MSF-B and published data from the African Population & Health Research Centre (APHRC)1.
In order to help differentiate an emerging food security emergency from extreme chronic poverty, the
brief has utilised a series of trigger indicators for emergency food insecurity appropriate to an urban
setting, as follows:
1. Food availability
a. Reduced availability of food in the market for highly market-dependent populations.
2. Food access
a. Increasing, high food prices
b. Falling or static incomes
c. Increasing severe entitlement gap (people not meeting 2,100 kcal/day).
d. Increasing reliance on negative coping strategies
3. Food utilisation
a. Reduced dietary diversity
b. Increasing malnutrition
Food availability (availability of food in the market for highly market-dependent populations):
According to the KFSSG SRA 2009 report, the Nairobi slum residents are highly reliant on the market
as they procure virtually all household food (90%) and non-food needs from the market. In Nairobi,
there is minimal opportunity for food production; therefore access to food is highly dependent on cash
exchange. However, the report found that, despite such high market dependence, food availability did
not pose a significant threat to food security in the urban setting. The KFSSG SRA 2009 found that all
17 basic food commodities were available at the time of the survey.
In summary concerning food availability, while the urban slum residents were found to be highly
dependent on the market for meeting their daily food needs, the market was found to be adequately
functioning in terms of ensuring such availability.
1 Subsequent to this report, a government report by the National Council for Children’s Services (NCCS),
looked at the effect of the food crisis on child nutrition and health. The report followed rapid assessments
conducted in selected districts hardest hit by hunger, including Kibera and Embakasi, and found that malnutrition
rates have increased and school enrolment in most districts has dropped dramatically. (Source Daily Nation
March 20th 2009)

4
Food access (high food prices): The emergency trigger indicator of rising food prices was found to be
significantly present. The KFSSG report noted that following price increases from December 2007 to
December 2008 based on surveys of the largest Nairobi slums: Kangemi, Kawangware, Kibera,
Korogocho, Mathare and Mukuru:
o >133% maize meal
o >99% maize grain
o >96% beans
o >94% rice
o >87% roots and tubers
o >77% oils and fats
o >65% wheat flour
o >56% milk
o >55% vegetables
Food access (increasing, high non food prices): Price spikes of essential non food items such as
energy fuels, water and health care have been shown to be exacerbating food insecurity by tightening
disposable income from the urban poor at a time of widespread, significant food price spikes. The
KFSSG SRA 2009 report noted the following price spikes from December 2007 to December 2008:
Energy:
o >92% other, generally electricity
o >66% charcoal
o >64% gas
o >30% paraffin
o >19% firewood
Water: >114%
Basic health care services:
o The technical review did not acquire information on market dependent health care costs, such as
the cost of medicines and visits to private clinics. The review did note that the costs for such
government services as antenatal care and immunization increased from 12-23%.
Food access (falling or static incomes): According to the KFSSG SRA report 2009 the incomes of
urban slum residents declined between December 2007 and December 2008. The main sources of
income were identified as casual wage labour, firewood collection/charcoal burning, formal wage
labour (crafts, artisan, local brewing), petty trade and small businesses. All income sources were
found to have declined as follows:
o <22% casual labour
o <28% firework collection/charcoal burning
o <2% formal wage labour, craft artisan
o <23% petty trade
o <27% small business
Food access (severe entitlement gap - people unable to meet 2,100 kcal/day): Faced with declining
incomes and rising prices of essential food and non food items, surveys have found reduced intake of
meals. According to a KEMRI/CDC nutrition survey in two villages in the Kibera slum, 90% of the
urban slum households were reducing meal frequency. According to a January 2009 ACF-USA
sentinel site survey in the Mathare slum, 80% of surveyed households had reduced the size of their
meals in the last 30 days and more than 60% had skipped meals. The KFSSG SRA 2009 reported the
following changes from December 2007 to December 2008:
• <92% in daily meals (2.93 to 1.53)
• <46% in school age meals (3 to 2.05)
• <41% in under five snacks (3.57 to 2.53)
Food access (negative coping strategies): The Oxfam Response to Urban Food Crisis: situation
analysis and strategy options identified the following negative coping strategies in Korogocho and
Mukuru slums (Heyer and Crosskey 2008):

5
• Increased engaging in high risk livelihoods (sex work, crime, brewing/selling illegal brews) and
child labour. According to observations from focus groups discussions, rates of prostitution have
increased by around 30%, whilst rates of scavenging among children increased by around 30%.
• Reduced expenditures on non-food items (water, soap, toilets and education)
• Up to 30% of children taken out of school
• Increased reliance on gifts and credit. (This is supported by the January 2009 ACF-USA sentinel
site survey in the Mathare slum where nearly 80% of households reported purchasing food on
credit from local vendors.
• Splitting of households
Food utilisation (reduced diet diversity): According to a KEMRI/CDC nutrition survey in two
villages in the Kibera slum, 90% of respondents were experiencing food shortages and were coping by
eating less expensive foods. The January 2009 ACF-USA sentinel site survey in the Mathare slum
found that while diet diversity was being maintained, with a mean score of 6.4 food groups consumed
and about 74% consuming more than five food groups, consumption of protein and micronutrient rich
foods, such as eggs, fish and meat, was low.
Food utilisation (increasing malnutrition): Based on limited nutrition survey data from two slums,
absolute numbers of severely malnourished children under-five living in Nairobi informal settlements
at any one time is estimated to be more than 1,000. However, direct data on trends in rates of acute
malnutrition is too limited to draw conclusions on whether the situation has deteriorated or not.
However, considerable indirect evidence indicates that the majority of urban slum dwellers are
adopting negative coping strategies of reducing meal frequency and diversity, which suggests that
slow onset increases in malnutrition, in particular micronutrient malnutrition, is likely occurring.
Summary: the above review of trigger indicators of food insecurity presents compelling evidence that
an emergency food security crisis is occurring within the extreme chronic poverty of the urban slums
of Nairobi and which requires an immediate response. The uncovered trends are disturbing for such
dense slum settings whose residents are highly dependence on the market. The current situation is
marked by price spikes in essential food and non food items, falling incomes, a severe entitlement gap
as people are increasingly unable to meet 2,100 kcal/day, increased reliance on negative coping
strategies, reduced dietary diversity and likely increasing malnutrition.
Recommended Emergency Response: Given that the crisis in the urban slums is one of access rather
than availability, short term cash rather than in-kind based interventions are most appropriate for
reaching the most vulnerable. This can include the following:
• Cash injection to compensate urban poor households for reduced purchasing power and resulting
reduced access to food.
• Food subsidies e.g. food stamps to offset the high food prices.
In addition, given the seriousness of the food security crisis, urgent action needs to be taken to
maintain and expand therapeutic feeding services that accurately monitor and provide essential support
to at-risk malnourished children. This can include the following:
• Continuation and expansion of sentinel site surveillance to monitor the nutrition and food security
situation.
• Further decentralisation, improved quality and expansion of integrated management of acute
malnutrition (IMAM) at key health facilities serving Nairobi slums.
• Secure pipeline of therapeutic nutrition commodities to provide above intervention for all severely
malnourished children, regardless of HIV status.

6
TABLE OF CONTENTS EXECUTIVE SUMMARY……………………………………………………………2
TABLE OF CONTENTS……………………………………………………………...7
FIGURES CONTENTS……………………………………………………………….9
TABLES CONTENTS………………………………………………………………...9
ACKNOWLEDGEMENTS…...………………………………………………………9
1. BACKGROUND…………………………………………………………………..10
2. INTRODUCTION…………………………………………………………………11
2.1 Urbanisation in Kenya……………………………………………………………11
2.2 Urban Poor in Kenya……………………………………………………………..11
3. FOOD SECURITY/LIVELIHOODS……………………………………………...12
3.1 National food security situation………………………………………………….12
3.2 Urban food security situation…………………………………………………….12
3.3 Availability of food….…….……………………………………………………..12
3.4 Access to food….………………………………………………………………...12
3.4.1 Household Income……………………………………………………...13
3.4.2 Rising Prices……………………………………………………………14
3.5 Coping Strategies………………………………………………………………...15
3.6 Summary…………………………………………………………………………16
4. NUTRITION………………………………………………………………………17
4.1 Prevalence of acute malnutrition in the informal settlements………...………….17
4.2 Current nutrition interventions…………...………………………………………18
4.3 Chronic malnutrition……………………………………………………………..20
4.3.1 Chronic malnutrition in the informal settlements………………………20
5. PUBLIC HEALTH………………………………………………………………...21
5.1 Mortality………………………………………………………………………….21
5.2 Morbidity…………………………………………………………………………22
5.3 HIV/TB…………………………………………………………………………...22
5.4 Factors contributing to poorer health of slum dwellers…………………………..22
5.5 Water and sanitation……………………………………………………………...23
6. RECOMMENDATIONS…..……………………………………………………...23
6.1 Immediate – Food security/livelihoods…………………………………………..23
6.2 Immediate - Nutrition…………………………………………………………….23
6.3 Longer-term………………………………………………………………………24
7.0 Concluding comments……………………………………………………………24
REFERENCES……………………………………………………………………….25
APPENDICES

7
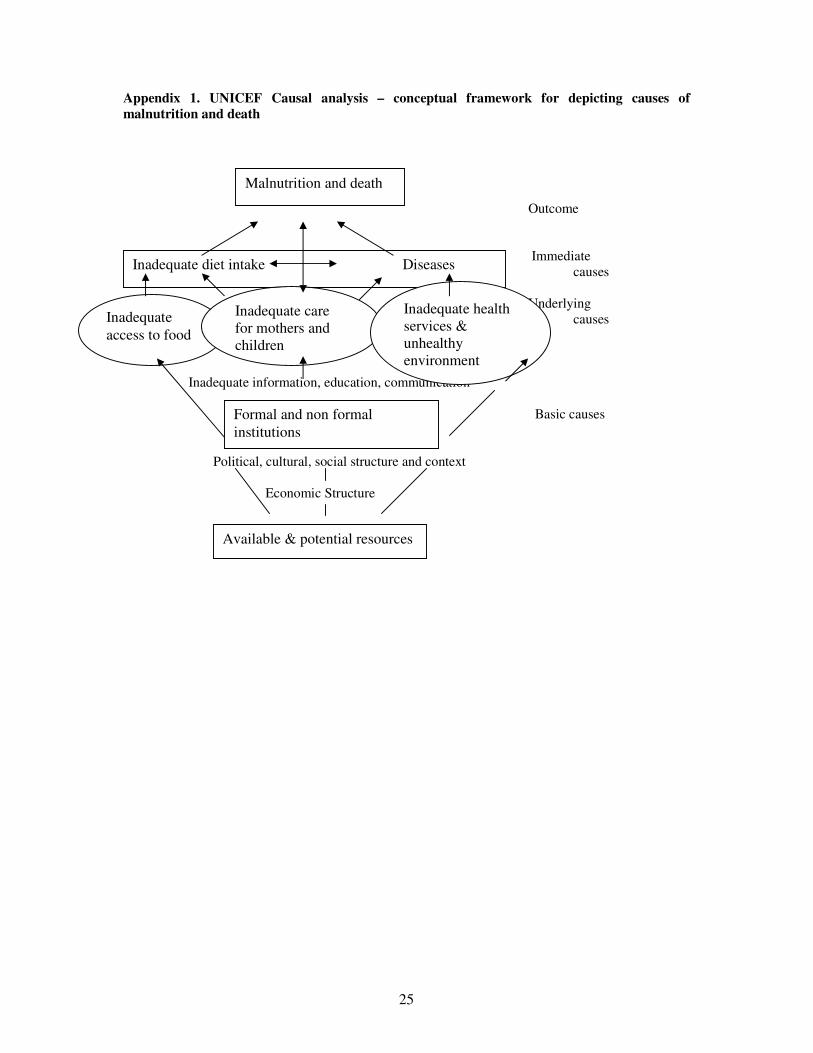
Appendix 1 UNICEF Causal analysis – conceptual framework for depicting causes of
malnutrition and death…………………………………………….. 28
Appendix 2 WHO Decision-making framework for implementation of selective feeding
programmes……………………………………………….. 29
Appendix 3 Examples of current nutrition interventions in the informal
settlements…………………………………………………………………… 30
Appendix 4 Extracts of Kenya’s Food Security and Nutrition Policy 2007… 31
Appendix 5 Policies currently being implemented to address the soaring food prices in
Kenya………………………………………………………………. 32

8
FIGURES CONTENTS
Figure 1. Percent change in mean prices charged and quantities purchased
for basic food commodities, December 2007 – 08 14
Figure 2. Percent change in cost of selected health services in 6 Nairobi
slums from December 2007 to December 2008 15
Figure 3. Nairobi OTP Admissions, Exits and Total for 2008 for severe
acute malnutrition 19
Figure 4 Monthly numbers in OTP compared to numbers of OTP sites open 19
Figure 5 Infant mortality rates in 2 Nairobi slums compared to Nairobi
province and national rates 2003 21
TABLE OF CONTENTS
Table 1 Change in mean income between December 2007 and December 2008,
according to income source 13
Table 2 Change in frequency of meal consumption from December 2007
to December 2008 16
Table 3 Summary of results of 2 nutrition surveys plus estimates of absolute
numbers affected based on population estimates and malnutrition
prevalence rates 17
Table 4 Comparison of outcomes of OTP in Nairobi slums with Sphere Project
recommendations
20
ACKNOWLEDGEMENTS:
For sharing of data go to ACF-USA, APHRC, KEMRI/CDC, Concern, Care, Oxfam, Ministry of
Public Health & Sanitation, Ministry of Clinical Services, MSF-F, MSF-B, Nairobi City Council,
WFP, UNICEF and other key stakeholders and to the members of the Kenya Nutrition Urban Working
Group for preliminary consolidation of information to date.

9
1. BACKGROUND The Right to Adequate Food is recognised in several instruments under international law
2. Despite this
recognition, globally, half of the almost 10 million children under the age of five who die annually do
so from a combination of malnutrition and easily preventable disease. In response, the Right to
Food/Fighting Hunger initiative is a key focus of the work of such organisations as Oxfam GB,
Concern Worldwide and CARE International in Kenya.
In Kenya, there is increasing appreciation that it is not only the rural drought affected but also the
urban poor who are not realising their right to adequate food. Attention has been drawn to the
vulnerable situation of the urban poor in the light of the impacts of post election violence coupled with
global rising food prices on the already precarious food security situation. The urban poor are an
important caseload of vulnerable population that needs to be addressed not least because of a) the
proportion of the total population affected – 60% of Nairobi’s population lives in informal settlements
and slums and b) urbanisation trends – by late 2008, globally, more people were living in urban than
rural areas. In the Kenya National Food and Nutrition Policy 2007 (final draft), the Government of
Kenya states it’s commitment to reducing chronic food insecurity in the urban areas through
promoting urban employment and improved access to food (see appendix 4 for more detail).
In January 2009, the Government of Kenya declared a national food security emergency and within an
estimated total 10 million people at risk, the largest single group affected are 4.1 million urban
dwellers. The data in support of this declaration was not clear and generally, limited information is
available on the food security, livelihoods, nutrition and public health situation in the urban slums.
Therefore the purpose of this technical brief was to begin a process of consolidating key information
on the Nairobi slums for assessing current status and future trends.
As a focus for the consolidation, this brief has used the UNICEF conceptual framework that
recognises food insecurity, inadequate care behaviours and poor health/access to health care and water
and sanitation as the key underlying and overlapping causes of malnutrition (see appendix 1). For each
of these causes, this brief highlights the issues specific to the Nairobi informal settlements and, where
possible, describes and discusses the current food security, nutrition and health situation. Based on this
analysis of the limited data available, recommendations are made regarding appropriate interventions.
Key contextual issues
a) Limited data available specific to urban slums A main limitation of this brief is the lack of disaggregated data specific to the urban slum population
and, in particular, a lack of longer term trend data against which to interpret the impacts of current
staple food price spikes. Much of the existing food security, health and nutrition data is for urban
populations as a whole. Due to the range of socioeconomic backgrounds in the urban setting, data
reported for the urban setting masks the existence of pockets of poor health indicators and malnutrition
within the population.
The key sources of information referred to for this brief are: the Kenya Food Security Steering Group
Short Rains Assessment (KFSSG SRA 2009) which surveyed the largest Nairobi slums: Kangemi,
Kawangware, Kibera, Korogocho, Mathare and Mukuru; two nutrition surveys (Kibera and Mathare
2008); one sentinel site nutrition survey conducted in Mathare slum in January 2009, a 2008 acute
malnutrition caseload synthesis from MoH/NCC/Concern and published data from the African
Population & Health Research Centre (APHRC)3.
2 Most importantly, the International Covenant on Economics, Social and Cultural Rights which in article 11.1
states parties recognise “the right of everyone to an adequate standard of living for himself and his family,
including adequate food, clothing and housing and to the continuous improvement of living conditions”. 3 Subsequent to this report, a government report by the National Council for Children’s Services (NCCS),
looked at the effect of the food crisis on child nutrition and health. The report followed rapid assessments
conducted in selected districts hardest hit by hunger, including Kibera and Embakasi, and found that malnutrition

10
b) Thresholds for classifying the severity of the situation The nutritional status of under-fives is a sensitive indicator of a crisis situation and therefore the
prevalence of global acute malnutrition (GAM) is commonly used as a key indicator in the
classification of the severity of a humanitarian situation. Different frameworks have been developed to
classify emergencies and guide appropriate interventions. These include the WHO Decision-making
framework for implementation of selective feeding programmes (WHO 2000 Management of nutrition
in major emergencies), the Nutrition Information in Crisis Situations (NICS) nutritional risk
classification system and the Integrated Food Security and Humanitarian Phase Classification (IPC).
Each framework identifies thresholds of GAM prevalence against which to classify the severity of a
particular situation and determine the response. Within each framework, the importance of contextual
and trend analysis in interpreting rates of malnutrition is also emphasised.
Arguments exist both for and against the use of thresholds. In their favour they provide a common
scale and framework which helps to identify need and guide response. Against – they lack evidence
base and can be viewed as inappropriate for a population in a densely populated urban setting where
absolute numbers affected relative to the availability of services may be considered more important in
determining the need for intervention (Golden 2009).
2. INTRODUCTION
2.1 Urbanisation in Kenya Urbanisation is increasing in Kenya at a rapid pace. According to Government of Kenya statistics,
urban centres have increased from 15.1% (1979) to 34.8% of the total population in 2000. According
to UN Habitat (2008), urban growth rate in Kenya is 1.2%. The same report estimated the population
of Nairobi in 2008 to be 3,125,000, up from 1,380,000 in 1990, with a city population growth rate of
3.8%. More than 70% of the urban population live in slums with limited access to water and
sanitation, housing social services and secure tenure (UN Habitat 2007). In Nairobi specifically,
informal urban settlements occupy just 5% of the geographical area, yet house about 60% of the total
city’s population. According to UNICEF draft press release, the population growth rates in the 18
slums in Nairobi are far higher than the city rate at 6.9%. This figure may reflect migration into the
slums as well as births.
2.2 Urban Poor in Kenya
In 1992, the percentage of poor in urban areas was estimated at 29% compared to 42% in rural areas.
By 1997, this percentage increased significantly in urban areas to 49% whereas percentage of poor in
rural areas increased to 52% (taken from KFSSG SRA 2009). This increase in proportion of poor in
urban areas, while significant, does not delineate the concentration of poor amongst those living in
informal settlements. Recent surveys have shown that between 70 and 75% of slum dwellers are poor
(World Bank 20064, Taylor and Mathaiya 2007 and Grelletty/MSF-F 2008) compared to 46% of the
national population as a whole (KIHBS 2005/06).
3. FOOD SECURITY AND LIVELIHOODS
Food security can be defined as “a state where all people at all times have both physical and economic
access to sufficient food to meet their dietary needs for a productive and healthy life”. The three
fundamental components to being food secure are availability, access and utilisation of food. Their
contribution to overall food security differs in urban and rural contexts and across urban socio-
economic groups.
rates have increased and school enrolment in most districts has dropped dramatically. (Source Daily Nation
March 20th
2009)
4 The World Bank survey (2006) gives some useful background to the economic and livelihood situation of
Nairobi slum dwellers. It was conducted in 2004 and the slum areas surveyed were Dagoretti, Westlands,
Pumwani, Central, Makadara, Embakasi, Kasarani and Kibera.

11
3.1 National food security situation As mentioned previously, in January 2009, the GoK declared a national food security emergency,
estimating up to 10 million people in Kenya at risk of food insecurity. Overall, this situation results
from a combination of factors, including: repeated droughts, post election violence affecting the
country’s grain basket and high inflation. Corruption in the maize and fuel industries, obstructive trade
regulations and the global financial, food and fuel crises have aggravated the problem.
3.2 Urban food security situation
4.1 million urban dwellers are estimated to be at risk of food insecurity (KFSSG SRA 2009). This is
up from an estimated 3 million in 2007 and represents the largest single group affected. In order to
understand the current food insecurity situation of urban poor, this brief will look at the three
components of food security: availability and access and utilisation.
3.3 Availability of food The KFSSG SRA 2009 found that all 17 basic food commodities were available at the time of the
survey, demonstrating that reduced food availability is not a source of food insecurity.
3.4 Access of food
Results of the KFSSG SRA 2009 highlight that Nairobi slum residents access the vast majority of their
food (90%) and non food items through purchases on the market. As there is minimal opportunity for
food production, access to food is dependent on cash exchange. Ability to access food can be looked
at in terms of household incomes relative to prices of food and non food items.
3.4.1 Household Income The main source of income for households in the informal settlements is low paying unstable jobs in
the formal and informal sector and petty trade. Job stability depends on economic fluctuations and
inclusive employment policy rather than seasonality or climate variability as it does in rural areas.
According to a World Bank survey (2006), 49% of adult slum dwellers have regular or casual
employment, 19% of households engage in micro enterprise and 26% are unemployed.
In Mukuru at the end of 2008, the average monthly income of 35% of households is less than KES
2,000, while 22% report no monthly income (Katilu and Kabuki 2008). Therefore, at the time of the
survey, 55% households were living well below the food poverty line of 1,474 KES/adult/month and
overall poverty line of KES 2,913/adult/month, as defined by Kenya Bureau of Statistics. In Mathare
slum, mean household monthly income for the reference period in January 2009 was KES 7,108 [95%
CI: KES 6,313 to 7,904] which is equivalent to an average daily income per household of KES 237.
However, this is higher than normally expected in slum areas and is considerably higher than average
income of KES 50 per day reported by Grellety/MSF-F (2008) for Mathare in April 2008.
The KFSSG SRA report 2009 indicates that incomes actually declined between December 2007 and
December 2008. The main sources of income were identified as casual wage labour, firewood
collection/charcoal burning, formal wage labour (crafts, artisan, local brewing), petty trade and small
businesses. The monthly incomes from almost all the sources were much less in December 2008 than
in the same period of 2007 and equivalent to an average decline of 21% (see table 1).
Table 1 Change in mean income between December 2007 and 2008, according to income source. (ref
KFSSG SRA 2009)
Source of Income Income (KES)
Dec 2007
Income (KES)
Dec 2008
Change in
income (KES)
Percent
reduction in
income
Borrowing
1,354 1,061 294 22%
Casual waged
labour
4,487 3,240 1,247 28%
12
Firewood
collection/charcoal
burning
3,000 2,243 757 25%
Formal waged
labour – craft
artisan
4,925 4,808 117 2%
Petty trade
3,081 2,396 685 23%
Small business
4,050 2,944 1,106 27%
This reduction in income represents a significant reduction in ability to access food, particularly
among the urban poor who spend a larger proportion of their income on food (43%) than non poor
(37%) (World Bank 2006) and experience greater restrictions to access due to lack of economic means
such as steady income, remittances and access to credit.
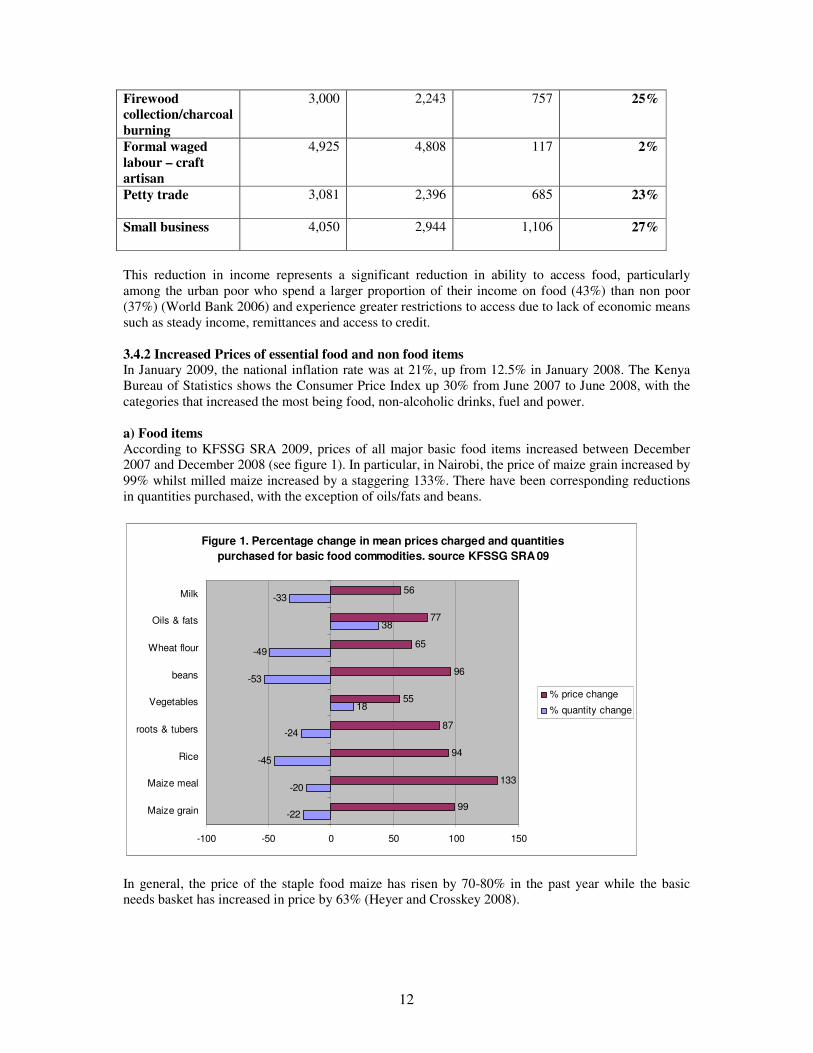
3.4.2 Increased Prices of essential food and non food items In January 2009, the national inflation rate was at 21%, up from 12.5% in January 2008. The Kenya
Bureau of Statistics shows the Consumer Price Index up 30% from June 2007 to June 2008, with the
categories that increased the most being food, non-alcoholic drinks, fuel and power.
a) Food items
According to KFSSG SRA 2009, prices of all major basic food items increased between December
2007 and December 2008 (see figure 1). In particular, in Nairobi, the price of maize grain increased by
99% whilst milled maize increased by a staggering 133%. There have been corresponding reductions
in quantities purchased, with the exception of oils/fats and beans.
Figure 1. Percentage change in mean prices charged and quantities
purchased for basic food commodities. source KFSSG SRA 09
-22
-20
-45
-24
18
-53
-49
38
-33
99
133
94
87
55
96
65
77
56
-100 -50 0 50 100 150
Maize grain
Maize meal
Rice
roots & tubers
Vegetables
beans
Wheat flour
Oils & fats
Milk
% price change
% quantity change
In general, the price of the staple food maize has risen by 70-80% in the past year while the basic
needs basket has increased in price by 63% (Heyer and Crosskey 2008).

13
b) Non food items
i) Fuel Results of KFSSG SRA 2009 show that the price of energy fuels increased between December 2007
and December 2008. Firewood increased by 13%, paraffin by 30%, gas by 64% charcoal by 66% and
other sources in particular electricity increased by 92%. The high cost of cooking fuel has a major
influence on patterns of food consumption.
ii) Water In general, water purchased in the informal settlements from water kiosks is 4-5 times higher per litre
than tariffs charged by Nairobi Water and Sewerages Company (Umande Trust 2006). According to
KFSSG SRA 2009, the cost of water in Nairobi slums increased by 114%, from KES 1.62 per litre to
KES 3.47 per litre, from December 2007 and December 2008.
iii) Basic health care services In Mukuru 2005, the average cost of treatment was KES 600 (Taylor & Maithya 2007). In Mathare
slum 2008, at the most accessible health facility, first consultation cost KES 100 for adults and KES
40 for children under five (Grellety/MSF F April 2008). Results from the urban cluster of KFSSG
SRA 2009 indicate that cost of basic health care services has risen between December 2007 and 2008
(see figure 2). The cost of family planning services increased by 23%, while antenatal and
immunisation services both increased by 12%.
Figure 2. % change in cost of basic health services in 6 Nairobi slums Dec 2007 to
Dec 08 (source: KFSSG SRA 2009)
12
20
23
-8
12
11
-32
0
-40 -30 -20 -10 0 10 20 30
Ante-natal services
De-worming
Family planning
growth monitoring & counselling
immunisation
PMTCT
VCT services
Vit A supplementation
Information in sections 3.4 above highlights how precarious the food security and livelihood situation
of the poor in Nairobi has become. The combination of an “unprecedented and sustained increase in
prices of food and non food commodities” (KFSSG SRA 2009) and falling incomes represents a
significant reduction in access to food. The price of maize alone has increased by up to 133% in
Nairobi, whilst the basic needs basket has increased by 63%. Meanwhile, incomes have fallen on
average by 21%. The rising price of maize alone is equivalent to an increase of KES 20,000 a year in
food expenses. In Mukuru for example, the average monthly income of 55% households is less than
KES 2,000 (Katilu and Kabuki 2008), which is equivalent to an average total annual income of less
than KES 24,000. The poor “normally” spend 43% of their income on food (World Bank 2006).
However, the increase in maize prices alone represents 83% of their annual income. To make up the
shortfall, significant amounts need to be “borrowed” from non food item expenditures resulting in less
cash being spent on other basic needs such as health care, water and sanitation and education.
Alternatively, other coping strategies must be resorted to.

14
3.5 Coping Strategies Traditional coping strategies of the food insecure in rural settings are not necessarily available to
affected urban households – for example wild “free” foods are not available. Support from kin,
political or religious groups may also be weaker in the urban context due to fragmentation of the
population. The role of remittances is unclear as there is little reported on this. The information
available highlights that the key coping strategies being adopted involve changes to food utilisation.
i) Reduced size/frequency of meals
According to a KEMRI/CDC nutrition survey in two villages in the Kibera slum, 90% of respondents
were experiencing food shortages and as a consequence were reducing the quantity of meals
consumed. According to the January 2009 ACF-USA sentinel site survey in the Mathare slum, 80% of
respondents had reduced the size of their meals in the last 30 days and more than 60% had skipped
meals. Further evidence of a reduction in meal frequency comes from KFSSG SRA 2009 (see table 2).
Table 2. Change in frequency of meal consumption from December 2007 to December 2008 (source
KFSSG SRA 2009).
Nairobi slums Frequency 2007 Frequency 2008 Change
Adult meals 2.93 1.53 -1.4
School age meals 3 2.05 -1.4
Under five snack 3.57 2.53 -1.04
ii) Reduced diet diversity
According to a KEMRI/CDC nutrition survey in two villages in the Kibera slum, 90% of respondents
were eating less expensive foods thereby reducing diet diversity in response to food shortage.
According to the January 2009 ACF-USA sentinel site survey in the Mathare slum, diet diversity was
found to be good with a mean score of 6.4 food groups consumed and about 74% consuming more
than five food groups. However, consumption of protein and micronutrient rich foods, such as eggs,
fish and meat, was low.
iii) Other negative coping strategies
The Oxfam Response to Urban Food Crisis: situation analysis and strategy options November 2008
identified the following negative coping strategies in Korogocho and Mukuru slums from observations
made during focus group discussions (Heyer and Crosskey 2008):
• Income supplementation through engaging in high risk livelihoods (sex work, crime,
brewing/selling illegal brews) and child labour. According to observations, rates of prostitution
have increased to around 30%, whilst rates of scavenging among children were also reported to
have increased to around 30%.
• Reduced expenditures on non-food items (water, soap, toilets)
• Reduced expenditure on education - up to 30% of children have been taken out of school
• Increase reliance on gifts and credit. This is supported by results of ACF Sentinel site survey 2009
whereby nearly 80% of households reported purchasing food on credit from local vendors.
• Split households
3.6 Summary of food security/livelihood findings A significant number of the urban population are currently at risk of food insecurity. Food is available
in the markets as normal but access has been reduced significantly due to increased prices of essential
food and non food items concurrent with falling incomes. This is exacerbating an already vulnerable
situation of limited access to food experienced by the urban poor. There is increased reliance on
negative coping strategies. Reductions in the frequency and quality of meals are widespread, raising
the possibility of a rise in micronutrient malnutrition and stunting in later months/years, particularly in
the context of high prevalence of HIV and TB, both of which increase dietary requirements5. Rising
5 Dietary requirements for energy are 10% higher for asymptomatic HIV positive individuals and 20-30% higher
for symptomatic HIV positive individual than their HIV negative counterparts

15
food insecurity has led to food riots, increasing crime rates and increased school dropouts (Kenya
Food Security Update FEWS NET January 2009).
4. NUTRITION
The recognition of the importance of nutrition situation of urban slum dwellers is illustrated by the
setting up of the Kenya Urban Nutrition Working Group (Slums/Informal Settlements) in 2008 at the
request of the Government of Kenya (see appendix 3 for details).
4. 1 Prevalence of acute malnutrition in the informal settlements.
Data available on the recent nutrition situation in the informal settlements is limited to results of two
nutrition surveys conducted in Kibera (CDC/KEMRI April 2008) and Mathare (ACF-USA, November
2008) and one sentinel site survey in Mathare (ACF-USA, January 2009). Results of the two full
surveys are presented in Table 3 and indicate the prevalence of global acute malnutrition (GAM) in the
informal settlements is less than 4.0%.
Table 3. Summary of results of 2 nutrition surveys plus estimates of absolute numbers affected
based on population estimates and malnutrition prevalence rates
Location GAM
*
SAM* Estimated
total slum
population
Estimated
% under-
five
population
***
Numbers
moderately
malnourished
Numbers
severely
mal-
nourished
Mathare
3.9% [2.5 –
5.2%]
0.5% [0.0-
1.2%]
423,000**
20%
17.4%
2,876
2,502
423
368
Kibera –
2 villages
2.6% [1.7-
3.5%]
0.6% [0.1-
1.0%]
600,000 to
1,000,000
20%
17.4%
2,409 to 4,000
2,088 to 3,480
720 to 1,200
626 to 1,044
* Based on WHO 2006 reference population
**Based on MSF – France socio-economic assessment of Mathare (2008)
*** 20% = GoK planning figure; 17.4% = UN Habitat estimate for slum populations in Kenya
Similar results have been reported from the first quarterly sentinel site survey in Mathare slum by
ACF-USA. Based on NCHS/WHO reference population, GAM was 4.0% [0.9 – 7.2%] and SAM 1.0%
[0.0 – 2.4%]. Preliminary results from Concern Worldwide baseline survey also indicate similar
findings, with GAM of 3.5% [95% CI 1.1 – 5.9%] and SAM at 0.3% [95% CI 0.0 – 0.7] (based on
WHO 2006 reference population).
These estimates of the prevalence of GAM are all lower than the national (6%) and urban (5%)
prevalence figures from KDHS 2003, although as mentioned before, KDHS figures mask significant
variation among socioeconomic groups. The survey results are also lower than the WHO emergency
threshold of 15% GAM and 4% SAM. However, the common use of percentage rates over absolute
numbers of children is greatly distorting when used for urban slums, as this masks the high numbers of
children affected in such densely populated settings.
To illustrate this, estimates of the absolute numbers of children affected have been calculated for two
slum areas where nutrition surveys have been conducted and are presented in the table 3 above.
Absolute numbers have been calculated based on different estimates on under-five population

16
available in the literature6. For example, based on a slum population of 600,000 inhabitants, with
under-fives representing 20% of the population, a GAM of 2.6% and SAM of 0.6%, in Kibera slum
alone at the time of the survey, there were over 3,000 malnourished under-fives, of which 720 were
severely malnourished and in urgent need of therapeutic feeding. These figures highlight the large
number of severe and moderately malnourished under-fives in the slum areas who are in need of
immediate intervention, which is not apparent when prevalence rates alone are presented.
Data available is too limited for analysis of trends in prevalence of acute malnutrition. However, there
is consistent proof that families are adopting damaging coping strategies of reducing quantity and
quality of food intake, which, if prolonged, can have a detrimental effect on nutritional status,
resulting in a slow onset crisis and increasing micronutrient malnutrition and stunting in the longer
term (AAH 2009).
4.2 Current interventions for acute malnutrition In 2008, Kenya adopted an integrated management of acute malnutrition (IMAM) response that added
to the existing inpatient therapeutic care an outpatient therapeutic programme (OTP) component for
uncomplicated cases of severe acute malnutrition and community mobilisation. As a response to the
post election violence of late 2007/early 2008, this approach was rapidly scaled up by the Ministry of
Health, Nairobi City Council (NCC) and community-based organisations, supported technically and
logistically by Concern and by UNICEF with Ready-to-Use Therapeutic Food (RUTF). In 2008, 1,262
children were admitted to OTP services in the 21 centres throughout Nairobi. This underestimates the
full caseload as it excludes children admitted to inpatient therapeutic care at hospitals, those treated by
agencies including MSF and the private sector. Data compiled to date is presented in Figure 3 below
and shows how the total numbers in OTP increased during 2008.
Figure 3 Nairobi OTP Admission, Exits and Total for Severe Acute
Malnutrition 2008
0
50
100
150
200
250
300
350
Jan
Feb
Mar
chApr
il
May
June
July
Aug
Sep
tOct
Nov
Dec
Total admissions
Total exits
Total in OTP
Figure 4 below shows how the increase in numbers in OTP relates to the increasing number of OTP
service points, from 4 at the beginning of the year to 21 in December 2008, in addition to considerable
community mobilisation. It highlights the importance of decentralising care to improve access and
coverage and that, in the absence of the expansion of the services, large numbers of severely
malnourished under-fives in the informal settlements would remain untreated and at high risk of death.
6 Estimates of the proportion of under-fives in Nairobi slum populations vary from 15.7% (World Bank Survey
2006), 14.7% (Taylor and Maithya 2007) and 17.4% (UN Habitat 2008). These estimates suggest that the
population of informal settlements does not follow the accepted population distribution of 20% under fives,
probably due to the high proportion of single person households. However, as the GoK still uses 20% for
planning purposes, the absolute numbers of under-fives affected have been calculated using 20% and the UN
habitat figure of 17.4% as a more conservative estimate.

17
Figure 4 Monthly numbers in OTP compared to number of OTP sites open
0
5
10
15
20
25
Jan Feb March April May June July Aug Sept Oct Nov Dec
Nu
mb
er
of
OT
P s
ites
0
50
100
150
200
250
300
350
Nu
mb
er
of
ad
mis
sio
ns i
n O
TP
Total number of OTP sites Total in OTP
Table 4 below shows that the outcomes of OTP are poorer than recommended rates, with a low cure
rate and very high defaulter rate, also noted by MSF-B. It may be assumed that death rate is higher as
some of defaulters may have died. Preliminary defaulter tracing indicates very high migration and
movement within and out of the slums, lack of supplementary food/family ration, high transport costs
for weekly follow up visits, long waiting times and slow recovery, possibly exacerbated by HIV and
TB.
Table 4: Comparison of outcomes of OTP in Nairobi slums with Sphere Project recommendations
(Sphere Project 2004) based on 859 exits
Indicator SPHERE Nairobi OTP rate
Cure rate >75% 51%
Mortality rate <10% 5%
Defaulter rate <15% 42%
Another major problem for the OTP is the lack of secure pipeline of the nutrition commodities for
continuation of this intervention for all severely malnourished children. As the situation is not
regarded as an emergency, UNICEF is not able to provide support. At the moment, supplies are being
provided by NGOs.
Preliminary data from Concern indicates coverage of feeding programmes is around 39%. Therefore,
with better coverage, the caseload of malnourished in treatment could be twice as high. In addition,
Kenya is currently in the process of adopting the new WHO 2006 growth standards for admission
criteria and/or MUAC of <11.5cm which will also significantly increase caseload7. This will
accentuate the nutrition commodity pipeline problems.
Moderate Acute Malnutrition Services Services for moderate acute malnutrition vary from only nutritional counselling to provision of
fortified flours. In some health facilities, INSTA Food by Prescription (FBP) is available for HIV
7 In 2006, new WHO growth standards have been introduced as an alternative reference population to replace the
National Centre for Health Statistics (NCHS)/WHO growth reference population. The new standards are based
on observation of breastfed children of different origins fed in optimal conditions and measured in a standard
way. The new WHO 2006 growth standards classify significantly more children as severely malnourished as the
old NCHS standards.

18
positive vulnerable individuals or moderately malnourished (for example MSF B) and in some, CSB
or UNIMIX.
4.3 Chronic malnutrition
Chronic malnutrition is indicated by low height for age and reflects long-term inadequate food intake.
It is associated with limiting a child’s optimal development, thus affecting long term performance at
school and work. There is evidence that after 36 months, stunting is resistant to intervention (Bhutta et
al Lancet series 2008). In Kenya as a whole, more than one third (36%) of the population is
chronically malnourished (stunted), which is equivalent to 2 million children under five.
4.3.1 Chronic malnutrition in the informal settlements Nutrition survey results indicate the prevalence of stunting in the informal settlements is similar or
even higher than nationally. According to a 2008 KEMRI/CDC nutritional survey in Kibera, almost
one in two (47%) children under-five are stunted. 23% are severely stunted. In the Mathare ACF-USA
nutritional survey, 31.6% [27.8 – 35.4%] under-fives were found to be stunted. Preliminary results
from a Concern nutrition baseline survey indicates that 37.9% [95% CI 30.9 – 45.0%] under-fives are
stunted. These results highlight the long-term inadequate food intake experienced by the urban slum
dwellers as a consequence of chronic food insecurity, a poor health environment and poor care and
feeding practices. In relation to this, at the time of writing, limited data on infant and young child
feeding (IYCF) and care practices in the informal settlements had been identified.
5.0 PUBLIC HEALTH The main source of background information on the health of the residents of Nairobi informal
settlements is from the Nairobi Urban and Demographic Surveillance System (NUHDSS) run by
APHRC. This surveillance work highlights the chronic poor public health situation of the slum
dwellers, who experience high rates of morbidity and higher rates of mortality from preventable
causes than their rural counterparts and the national averages. The squeeze on household budgets in
the face of increasing prices of food and non food items means that there is proportionally less
available to spend on health care, water and sanitation. This is likely to exacerbate the chronic
problem. However, at the time of writing, very limited data on current trends in the health status of
slum dwellers was available to investigate this. It is hoped that in the near future, trend analysis data
will be made available from the NUHDSS (APHRC).
5.1 Mortality
Disaggregated data show that infant and under-five mortality rates for the poorest slum residents are
often higher than in similar groups in rural areas (APHRC 2002, UN Habitat 2003). Infant mortality
rate in Nairobi slums is 96 per 1,000 live births – higher than any other region of Kenya and 25%
higher than the national average of 77 (see figure 5). Under-five mortality rates in the slums (151 per
1,000 live births) are more than double the Nairobi average of 62 and greater than for rural Kenya
(113 per 1000 live births) (UN-Habitat, 2006; APHRC, 2002).

19
Figure 5. Infant mortality rates in 2 Nairobi slums compared to Nairobi
province and national rates 2003
96
130
68 67
77
0
20
40
60
80
100
120
140
infa
nt
mo
rtali
ty r
ate
(p
er
1000 l
ive
bir
ths)
Both slums NUHDSS 2003
Korogocho NUHDSS 2003
Viwandani NUHDSS 2003
Nairobi province KDHS 2003
National average KDHS 2003
Limited recent data on mortality is available from an ACF-USA nutrition survey in Mathare slum
(November 2008). Total crude retrospective mortality over the last three months per 10,000 per day
was 0.31 [0.18 – 0.45] and under five crude retrospective mortality per 10,000 per day was 0.61 [0.23
– 1.00]. Both these figures are similar to baseline reference mortality data for sub-Saharan Africa and
are below emergency thresholds of 0.9 and 2.3 respectively recommended by Sphere Project (2004).
This indicates that in the three months prior to November 2008, mortality rates were not raised above
normal in Mathare slum.
5.2 Morbidity Survey results indicate morbidity rates among under-two year olds ranges from 25% (KEMRI/CDC
nutrition survey March 2008) to 54% (ACF-USA Sentinel site surveillance 2009). The main causes of
morbidity are respiratory symptoms, fever and diarrhoea. The high morbidity due to respiratory
symptoms corresponds with pneumonia as first cause of death in under-fives. Morbidity rates in 2003
were reported as 33% (Taffa and Chepngeno 2005).
5.3 HIV/TB
According to the Kenya AIDS Indicator Survey (KAIS) 2007, the prevalence of HIV in Nairobi
Province (9.3%) is the second highest after Nyanza (15.4%) and higher than the national average
(7.8%). Disaggregated data for the slum population is not available. However, the urban poor are
significantly more likely than their rural counterparts to have an early sexual debut and a greater
incidence of multiple sexual partnerships (Nii-Amoo Dodoo et al 2007). This increased likelihood of
engaging in risky sexual behaviour puts the urban poor at greater risk of contracting HIV and, as a
consequence, TB.
5.4 Factors contributing to poorer health of slum dwellers
Many factors specific to the informal settlement context contribute to the poorer health of the
residents. Environmental factors include i) physical factors that have a direct effect on health –
overcrowding, poor water and sanitation and poor hygiene all increase the risk of communicable
diseases (see section 5.5 below); and ii) social factors such as alienation, unemployment, ethnic
tensions and violence which tend to have a more indirect effect on health.
Access to health care services is restricted as there are a low number of health facilities relatively to
population size. Health facilities that are available tend to provide poorer quality of service, often
operating without formal licences or standard protocols and with severe shortages of medical
equipment and supplies (APHRC 2002). Residents tend to pay more for similar services than in other
parts of Nairobi (Taffa and Chepngeno 2005). Slum dwellers tend not to use public health facilities
(where treatment is cheaper and in theory free for under-fives and pregnant women) not least because
they are not located in the settlements.

20
Coverage of key child survival interventions is lower in the informal settlements for Nairobi Province
and the national average (NUHDSS 2003 and KDHS 2003). However, results from ACF-USA
nutrition survey 2008 suggest that coverage of measles vaccination in Mathare slum is high, at 90.5%.
Preliminary results from the Concern baseline survey indicates coverage of vitamin A in the last 6
months was 58%, while de-worming was 37%.
5.5 Water and sanitation
The water and sanitation services of the informal settlements in Nairobi are a major public health and
livelihood problem. Between 60 and 93% of slum households are dependant on water vendors for their
water supply (World Bank 2006, Taylor and Mathaiya 2007, APHRC 2006, KEMRI/CDC 2008).
Provision of water is well below Sphere Project recommendations. In Mathare slum, for example,
there are 1,200 people per water point compared to Sphere Standards recommending a maximum of
500 people per hand pump based on a flow of 16.6 l/m (Grellety/MSF F 2008). Furthermore, the high
cost of water (generally 4-5 times the price per litre charged by Nairobi Water and Sewerages
Company, Umande Trust 2006) restricts the amount of water used by a household, increasing the risk
of water borne diseases and poor hygiene standards.
The state of sewerage and human waste disposal in the informal settlements pose a major threat to
health. The vast majority of slum dwellers rely on shared toilets or use open areas or plastic bags
(“flying toilets”). Many toilets are public facilities often financed by NGOs and managed by
community groups. Others are private and operate on a pay-as-use basis. Figures from Mathare
(Grellety/MSF F 2008) highlight the inadequate number with a total of four hundred communal
latrines representing one latrine for more than 1,000 people; Sphere Standards recommend a maximum
of 50 people per communal toilet.
6.0 RECOMMENDATIONS
The immediate recommendations are based on the finding that current food insecurity is due to lack of
access to food, which is primarily due to spikes in staple food prices rather than reduced availability.
A key assumption is that the spikes will recede once the current country wide deficit in staple foods
will be overcome once the long rains’ harvest starts to reach the market this September. An immediate
response is required in terms of absolute numbers affected and to prevent further deterioration of an
already chronic food security situation into a more acute one.
6.1 Immediate -Food security/livelihoods
Given that the crisis in the urban slums is one of access rather than availability, short term cash rather
than in-kind based interventions are most appropriate. This can include the following:
• Cash injection to compensate urban poor households for reduced purchasing power and resulting
reduced access to food.
• Food subsidies e.g. food stamps to offset the high food prices.
• Advocacy, including support for the implementation of current policies to address effects of
unprecedented and sustained rise in food prices (see appendix 5)
6.2. Immediate - Nutrition
• Further decentralisation and improved quality for integrated management of acute malnutrition
(IMAM) at key health facilities serving Nairobi slums.
• Secure pipeline of therapeutic nutrition commodities to provide above intervention for all severely
malnourished children, regardless of HIV status.
• Ensure system for moderately malnourished children to help reduce numbers requiring therapeutic
services e.g. CSB, UNIMIX, food by prescription.
• Ensuring quality products for all nutrition interventions.
• Better understanding of high defaulter rate of OTPs in order to address the problems and increase
cost effectiveness of the strategy
• Continuation of sentinel site surveillance to monitor the nutrition and food security situation.

21
• Stronger data collection, consolidation and analysis across all slums.
6.3 Longer term One of the key findings of this report is the chronic poverty and food insecurity situation as indicated
by the high rates of chronic malnutrition. It was not the intent of this technical brief to develop
comprehensive plans for longer term interventions to address the chronic poverty existing in the urban
slums. However, it is important to emphasis that any longer term planning that addresses food
security, the strengthening of livelihoods and provision of essential services should also include social
safety net mechanisms for providing extended support to the most vulnerable and destitute.
Furthermore, it is worth noting the priorities of the community themselves. According to KFSSG SRA
2009, 24% of respondents said employment was the most important recommended priority
intervention, followed by control of food prices (19%), food aid (14%) and business financing (13%).
Of other important recommended priority interventions, 17.5% identified security, 12% improved
health care and 7% improved water.
7.0 Concluding comments There is a lack of long term and disaggregated data on the nutrition, health and food security situation
of residents of informal settlements in Nairobi and Kenya as a whole. Thus, there is limited
information to fully understand the current situation and the impact of recent shocks, in particular high
food prices on the nutrition and health status of the urban poor.
There is a need for ongoing reliable data collection and synthesis to increase the knowledge base of
the current situation in urban slums and demonstrate any trends. In addition, an appropriate forum for
sharing multidisciplinary data and developing a more appropriate set of indicators for evaluating the
urban context is required. At the same time a strengthened food and nutrition response should be
provided to address the immediate needs already identified.

22
REFERENCES
ACF – USA. (2008) Nutritional Anthropometric and Mortality survey Children under five years of
age, Mathare and part of Kasarnai divisions, Nairobi November 2008
ACF – USA. (2009) Sentinel Surveillance report Nairobi Mathare slum. January 2009
Action Against Hunger (AAH) Briefing Paper January 2009: Feeding, Hunger and Insecurity. The
Global Food Price Crisis. A summary of Action Against Hunger research in Ethiopia, Sierra Leone,
Central African Republic and Liberia
African Population and Health Research Centre (APHRC) 2002. Health and Livelihood needs of
residents of informal settlements in Nairobi city. Occasional study report 2002
African Population and Health Research Centre (APHRC) 2006. The Effects of Population Growth on
the Achievement of the MDG on Child Mortality in Urban Sub-Saharan Africa. Memorandum
submitted to the UK All Party Parliamentary Group on Population, Development and Reproductive
Health.
Bhutta ZA, Ahmed T, Black RE, Cousens S et al. (2008): What works? Interventions for maternal and
child under-nutrition and survival. Lancet 2008 366: 514-519
Care International 2009. Internal review of the provision of relief assistance to communities affected
by post-election violence project Jan-June 2008, including break down of voucher use and food.
Central Bureau of Statistics (CBS) [Kenya], Ministry of Health (MOH) [Kenya] and ORC Macro
2004. Kenya Demographic and Health Survey 2003. Calverton Maryland: CBS MOH, ORC Macro.
Concern Baseline Nairobi Urban Nutrition Baseline Assessment March 2009 by Lilly Schofield
Golden M. (2009) web-based nutrition in emergencies discussion forum accessed March 2009 at
http://www.en-net.org.uk/question/40.aspx#lastpost
Grellety Bosviel E./ MSF France (2008) Draft Rapid Socio-Economic Assessment in Mathare Slum
April 2008.
Heyer A. and Crosskey A. (2008) Oxfam response to urban food crisis: a situational analysis and
strategy options.
Jaspers S 2007 Review of food aid, cash and nutrition components of DfID funded humanitarian
response in Kenya; 2005-06
Jones G, Steketee RW, Black RE, Bhutta ZA, Morris SS et al (2003). How many child deaths can we
prevent this year? Lancet 2003; 362: 65-71
Kagure P. (2008) Biocentre User Survey conducted in Gatwekera Village, Kibera.
Katilu AN. And Kabuki MM (2008) A baseline report on HIV/TB survey conducted at Mukuru Kwa
Njenga location, Embakasi District, Nairobi, Kenya. For Medical Missionaries of Mary (MMM)
KEMRI/CDC (2008) Nutritional status of pre-school children living in informal settlement, Nairobi,
Kenya power point presentation Olack B. 2008
Kenya Food Security Steering Group. The 2008/’09 Short Rains Assessment Report (KFSSG SRA)
February 2009

23
Kenya Integrated Household Budget Survey (KIHBS) 2005/06. Kenya National Bureau of Statistics
Kenya National Food Security and Nutrition Policy May 2007, final draft, awaiting signature
Kyobutungi C, Ziraba AK, Ezeh A and Yé Y. (2008) The burden of disease profile of residents of
Nairobi slums: Results from a Demographic Surveillance System. Population Health Metrics 2008,
6:1
Kimani-Murage EW and Ngindu AM. Quality of water the slum dwellers use: the case of a Kenyan
Slum. Journal of Urban Health, June 2007
Mugisha F. The nature of employment in Nairobi Slums; why it is a precondition for poor health and
livelihood outcomes. African Population and Health research Centre, Nairobi, Kenya.
Mullei K, Wafula F, Goodman C. A case study of Integrated Management of Childhood Illness
(IMCI) implementation in Kenya. Consortium for Research on Equitable Health Systems (CREHS)
working paper 2008 in partnership with KEMRI Wellcome Trust
Murphy N (2008) Formative study to understand the effects of post election violence and increased
food prices on household food security, household diet diversity and feeding practices of the target
population of slum areas where Concern Kenya is supporting Outpatient Therapeutic Programme for
children with uncomplicated severe acute malnutrition. Prepared for Concern Worldwide during
internship June to September 2008
National AIDS and STI Control Programme, Ministry of Health, Kenya. July 2008. Kenya AIDS
Indicator Survey 2007: Preliminary Report. Nairobi, Kenya.
National Coordinating Agency for Population and Development (NCAPD) [Kenya], Ministry of
Health (MOH), Central Bureau of Statistics (CBS), ORC Macro. 2005 Kenya Service Provision
Assessment Survey 2004. Nairobi, Kenya: NCAPD, MOH, CBS and ORC Macro.
Nii-Amoo Dodoo F, Zulu EM and Ezeh AC (2007): Urban-rural differences in the socioeconomic
deprivation-sexual behaviour link in Kenya. Social Science and Medicine: 64; 1019-1031
Ruel MT, Garrett JL, Morris SS, Maxwell D. et al (1998): Urban Challenges to food and nutrition
security: a review of food security, health and care-giving in the cities. Food Consumption and
Nutrition Division Discussion paper No 51. International Food Policy Research Institute, Washington
DC
Taffa N. and Chephgeno G. (2005) Determinants of health care seeking for childhood illnesses in
Nairobi slums. Tropical Medicine and International Health: 10 (3); 240-5
Taylor W. and Maithya H. (2007). Urban families under pressure in Kenya and the impact of
HIV/AIDS. Working paper 2., International Development Department, University of Birmingham, UK
The Sphere Project: Humanitarian Charter and Minimum Standards in Disaster Response. The Sphere
Project, Oxfam Publishing, Oxford, UK 2004
Umande Trust, the Economic and Social Rights Centre (Hakijamii) and Christina Flodmann (2006).
From Stakeholders to Shareholders: Enlightening water and sanitation services in Nairobi’s Peoples’
Settlements.
UN Habitat (2007) UN Habitat and the Kenya Slum Upgrading Programme. Accessed online at
www.unhabitat.org March 2009

24
UN Habitat 2008: The State of African Cities 2008: A framework for addressing urban challenges in
Africa.
UN Human Settlements Programme (2003). The challenges of slums: Global report on Human
Settlements.
United Nations Children’s Fund. 2007. Progress for children: A world fit for children statistical
review. New York.
UNICEF 2009 Improving child survival in Nairobi’s informal settlements – Kenya. Draft Press
Release
United Nations Children’s Fund. 2009. The state of the world’s children: Maternal and newborn
health. New York.
World Bank (2006). Kenya Inside Informality: Poverty, Jobs, Housing and Services in Nairobi’s
Slums. Report No. 36347-KE. Water and Urban Unit 1, Africa region, World Bank May 31 2006
Young H and Jaspers S (2006). The meaning and measurement of acute malnutrition in emergencies: a
primer for decision-makers. HPN ODI Briefing paper number 56 November 2006
25
Appendix 1. UNICEF Causal analysis – conceptual framework for depicting causes of
malnutrition and death
Outcome
Immediate
causes
Underlying
causes
Inadequate information, education, communication
Basic causes
Political, cultural, social structure and context
Economic Structure
Malnutrition and death
Inadequate diet intake Diseases
Inadequate
access to food
Inadequate care
for mothers and
children
Inadequate health
services &
unhealthy
environment
Formal and non formal
institutions
Available & potential resources
26
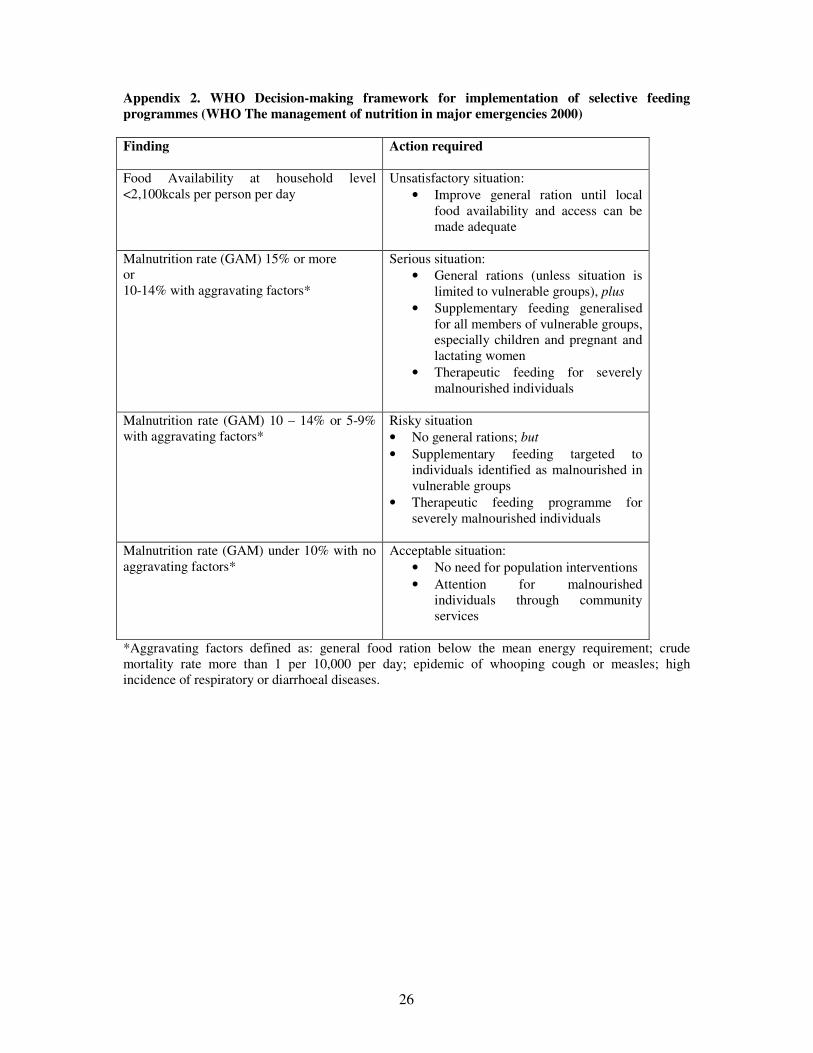
Appendix 2. WHO Decision-making framework for implementation of selective feeding
programmes (WHO The management of nutrition in major emergencies 2000)
Finding
Action required
Food Availability at household level
<2,100kcals per person per day
Unsatisfactory situation:
• Improve general ration until local
food availability and access can be
made adequate
Malnutrition rate (GAM) 15% or more
or
10-14% with aggravating factors*
Serious situation:
• General rations (unless situation is
limited to vulnerable groups), plus
• Supplementary feeding generalised
for all members of vulnerable groups,
especially children and pregnant and
lactating women
• Therapeutic feeding for severely
malnourished individuals
Malnutrition rate (GAM) 10 – 14% or 5-9%
with aggravating factors*
Risky situation
• No general rations; but
• Supplementary feeding targeted to
individuals identified as malnourished in
vulnerable groups
• Therapeutic feeding programme for
severely malnourished individuals
Malnutrition rate (GAM) under 10% with no
aggravating factors*
Acceptable situation:
• No need for population interventions
• Attention for malnourished
individuals through community
services
*Aggravating factors defined as: general food ration below the mean energy requirement; crude
mortality rate more than 1 per 10,000 per day; epidemic of whooping cough or measles; high
incidence of respiratory or diarrhoeal diseases.

27
Appendix 3. The Kenya Urban Nutrition Working Group and examples of current nutrition
interventions in the informal settlements
In 2008, the Kenya Urban Nutrition Working Group (Slums/Informal settlements) was set up with
terms of reference to provide a coordination role; to provide technical leadership on urban nutrition
issues and to advocate and provide a voice for urban nutrition issues. Members of the group include
international Non-governmental organisations (INGOs), national non-governmental organisations,
community-based organisations (CBOs), Ministry of Health, UNICEF, WFP and WHO.
Some examples of the nutrition activities ongoing within the slums are summarised below:
• Certain Nairobi slums – school feeding programme8,
• Outpatient therapeutic programmes for moderate and severe malnutrition in 21
MoH/NCC/CBO supported health facilities in Nairobi East, West and North and MSF in
Kibera 3 sites
• In patient Therapeutic care for severely malnourished with complications
• Mathare –MSF France focus on provision of care, food and drugs to HIV/TB patients,
Quarterly nutrition sentinel site surveillance (ACF)
• Kibera – MSF Belgium, provision of primary health care services, TB and HIV services,
management of moderate and severe malnutrition, food by prescription, multi-storey
gardening
• Riruta/Hurlingham – provision of CCC services, HIV services and food
• Westlands, Lower Kabete, Kawangware – provision of CCC services and food
• All – M&E HMIS UNICEF/MOH
8 The current status of WFP support to school feeding in the slums is: Privately funded in Kibera, Kawangware,
Mukuru and Kangemi, Mathare (ongoing for 5 years, starting 2009); schools in the regular school feeding
programme - Kariobangi (duration 5 years) and schools benefiting from the high food prices funding in Umoja
(duration 1 year 2009). Total school feeding caseload in Nairobi is 91,000 in 84 schools.

28
Appendix 4. Extracts from Kenya’s Food Security and Nutrition Policy 2007
In this policy, the Government of Kenya states that it “is strongly committed to reducing hunger and
malnutrition. This includes efforts to build up self-reliance to reduce chronic food insecurity as well as
measures to assist those in need when emergencies occur”.
In particular, this document highlights the government’s commitment to promote urban employment
and improved access to food described in. This document includes specific commitment to:
i) Support and simplify regulatory frameworks governing formal and informal sectors in urban and
peri-urban areas and towns with a focus on employment creation and poverty alleviation;
ii) Support and promote capacity building to enhance urban and peri-urban small business and
entrepreneurial skills, including agricultural production;
iii) Provide suitable zones for the informal sector through provision of workspace for hawkers and
other small and medium term businesses.
iv) Support small business enterprises to access affordable financial resources.
v) Support activities that enhance income generation capacity of people with special needs or
disadvantaged
vi) Build upon existing urban-rural linkages to increase food security, nutrition and livelihoods to the
benefit of both the urban and rural poor.
vii) Consider special measures to help the poorest and most vulnerable in urban areas meet their
minimum food and nutrition requirements.

29
Appendix 5. Policies currently being implemented to address the soaring food prices in Kenya (taken from KFSSG SRA 2009)
Consumer targeted policies
• Reduced taxes on food
• Cash transfers
• Food for work
• Food ration vouchers
• Reduction of inflation
Producer/Supplier targeted policies
• Increase supply using grain stocks
• Agricultural input subsidies
• Increase administrative prices for produces
• Incentives for expanding production (e.g. credit)
Trade Policy Measures for food commodities
• Increase supply via imports
• Lower input tariffs
• Export restriction
Trade policy measures for agricultural inputs
• Lower import tariffs for fertilisers