The Mundell-Fleming Model - Harvard University · PDF fileThe Mundell-Fleming Model ......
50
The Mundell-Fleming Model How international capital mobility alters the effects of macroeconomic policy Lecture 13: Mundell-Fleming model with a fixed exchange rate • Fiscal expansion • Monetary expansion • Automatic mechanisms of adjustment Lecture 15: Practical policymaking problems Lecture 16: Mundell-Fleming model with a floating exchange rate Lecture 17: Mundell-Fleming model with perfect capital mobility
Transcript of The Mundell-Fleming Model - Harvard University · PDF fileThe Mundell-Fleming Model ......

The Mundell-Fleming Model
How international capital mobility alters the effects of macroeconomic policy
Lecture 13: Mundell-Fleming model with a fixed exchange rate
• Fiscal expansion • Monetary expansion • Automatic mechanisms of adjustment
Lecture 15: Practical policymaking problems
Lecture 16: Mundell-Fleming model with a floating exchange rate
Lecture 17: Mundell-Fleming model with perfect capital mobility

The Mundell-Fleming equations with a fixed exchange rate
i
Y
LM IS
ITF 220 Prof.J.Frankel
IS: Y = 𝐴 − 𝑏𝑖 + 𝑋 −𝑀
𝑠+𝑚 LM:
𝑀1
𝑃 = L(i, Y)

The Mundell-Fleming equations with a fixed exchange rate, continued
BP = TB + KA New addition: capital flows respond to interest rate differential
Solve for interest differential:
i
Y
LM IS BP=0
ITF 220 Prof.J.Frankel
TB = 𝑋 −𝑀 − mY KA = 𝐾𝐴 + κ (𝑖−𝑖 ∗)
(i-i*) = 1
κ[(−𝐾𝐴−(𝑋 −𝑀 )] + (
𝑚
κ)Y.
BP=0: 𝑋 - 𝑀 − mY + 𝐾𝐴 + κ 𝑖−𝑖 ∗ = 0

ITF 220 Prof.J.Frankel
Capital mobility gives some slope to the BP=0 line:.
i
i
Y
Y
Y
BP=0 BP=0 i
BP=0
κ = 0 𝜿 > 0 𝜿 >> 0
The slope is (m/𝜿).
A rise in income and the trade deficit is consistent with BP=0 …
if higher interest rates attract a big enough capital inflow.
BP=0: (i-i*) = 1
κ[(−𝐾𝐴 − 𝑋 −𝑀 ] + (
𝑚
κ) Y .

less than enough to give a surplus in the overall balance of payments, Experiment: Fiscal expansion.
or more than enough, depending on the degree of capital mobility.
The capital inflow is either
BP=0 BP=0
BP=0
ITF 220 Prof.J.Frankel
κ = 0 𝜿 > 0 𝜿 >> 0
• • •

ITF 220 Prof.J.Frankel
Example: France 1981. The Mitterrand fiscal expansion
did not attract enough capital inflow to finance fully the TD.
Example: Germany, 1990-91. The Unification fiscal expansion
attracted more than enough capital inflow to finance TD.
𝜿 low 𝜿 high
• •

The overall balance of payments deficit is bigger, the bigger is k.
A capital outflow adds to BoP deficit.
Experiment: Monetary expansion
ITF 220 Prof.J.Frankel
κ = 0 𝜿 > 0 𝜿 >> 0
• • •
=>TB ↓

ITF 220 Prof.J.Frankel
Automatic mechanisms of adjustment
1. Money supply (via reserve flows)
2. Exchange rate (via demand for currency)
3. Price level (via excess demand for goods)
4. Indebtedness (via current account or budget deficit)
ITF 220 Prof.J.Frankel
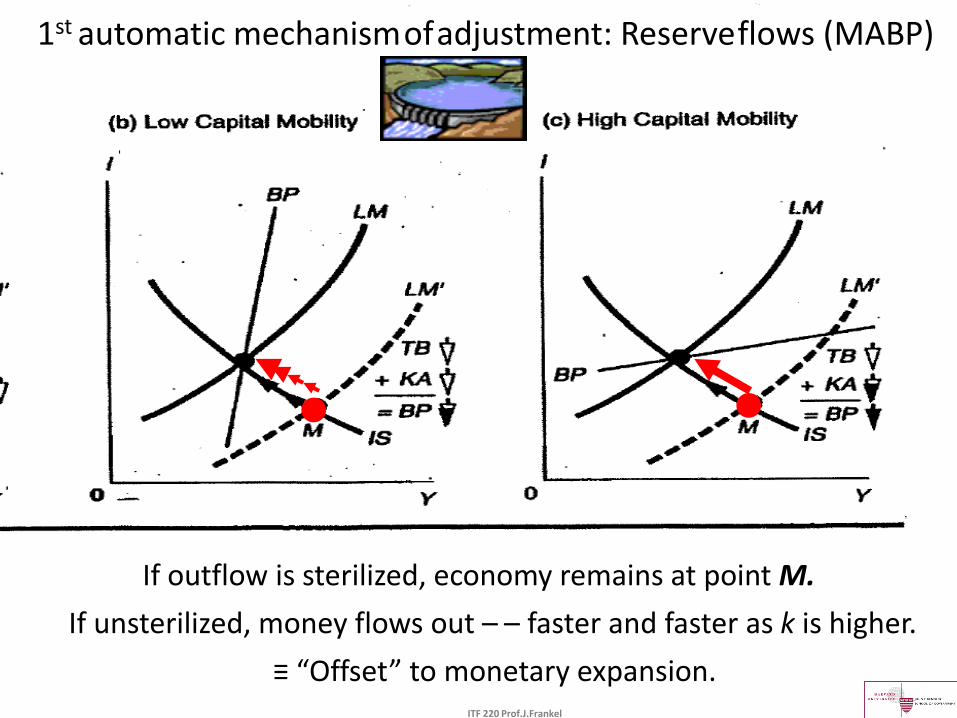
If outflow is sterilized, economy remains at point M.
k low k high 1st automatic mechanism of adjustment: Reserve flows (MABP)
If unsterilized, money flows out – – faster and faster as k is higher.
≡ “Offset” to monetary expansion.
• •
ITF 220 Prof.J.Frankel
• If, at a given exchange rate, a country would have a BoP deficit, then under floating the currency depreciates.
– Enhanced competitiveness (=> 𝑋 ↑) shifts IS & BP=0 curves right.
– Equilibrium occurs at: • a higher level of Y.
• BP=0.
• If, at a given exchange rate, a country would have a BoP surplus, then under floating the currency appreciates.
– Uncompetitiveness (=> 𝑋 ↓) shifts both the IS & BP=0 curves left.
– Equilibrium occurs at: • a lower level of Y.
• BP=0.
• as we will see in Lecture 16.
A 2nd automatic mechanism of adjustment: Floating exchange rate

Appendix: Mundell-Fleming model illustrated by
the example of BoP surpluses in Emerging Markets
• (1) Causes of surpluses
– 1990-97
– 2003-12
• (2) Alternative ways to manage inflows.
ITF 220 Prof.J.Frankel

(1) Causes of BoP Surpluses in EM Countries
I. “Pull” Factors (internal causes)
1. Monetary stabilization => LM shifts up
2. Removal of capital controls => κ rises
3. Spending boom => IS shifts out/up
II. “Push” Factors (external causes) 1. Low interest rates in rich countries
=> i* down =>
2. Boom in export markets =>
BP
shifts down/out
} •
e.g., 1990-97
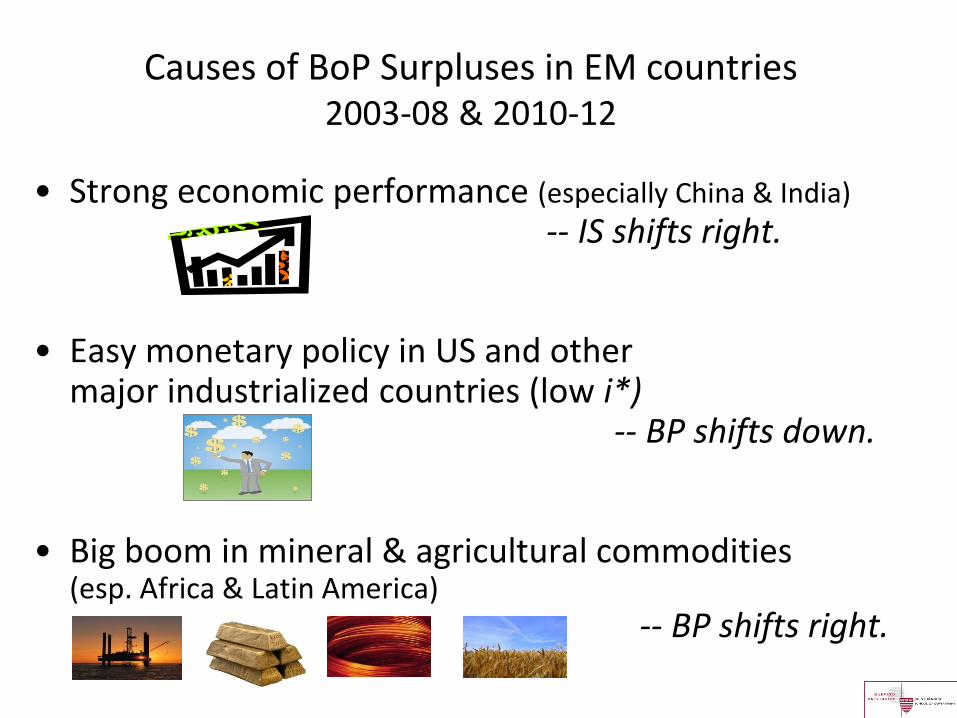
Causes of BoP Surpluses in EM countries 2003-08 & 2010-12
• Strong economic performance (especially China & India) -- IS shifts right.
• Easy monetary policy in US and other major industrialized countries (low i*) -- BP shifts down.
• Big boom in mineral & agricultural commodities (esp. Africa & Latin America) -- BP shifts right.

ITF 220 Prof.J.Frankel
•
A. Allow money to flow in
B. Sterilized intervention
C. Allow currency to appreciate
D. Reimpose capital controls
(Each way has a drawback.)
A country at point B has a BoP surplus.
(2) Alternative ways of managing inflows:
(can be inflationary)
(can be difficult)
(lose competitiveness)
(can impede efficiency)
i
Y

ITF220 - Professor J.Frankel
China initially took its BoP surplus as fx reserves.
But it also allowed RMB appreciation (2006-12).

Lecture 15: Problems/Applications of discretionary policymaking
1. Targets & instruments revisited
2. Practical difficulties of policymaking
3. Zero Lower Bound
• Appendix: The case of China’s inflows 2003-12

ITF-220 - Prof.J.Frankell
1. Targets & instruments revisited
• When we first showed the need to have as many independent policy instruments as goals, monetary & fiscal policy were not independent.
• Now, with capital mobility, they have somewhat independent effects on external balance, provided it is defined as BP=0 (rather than just TB=0).
• The reason: they have opposite effect on capital flows, because they have opposite effects on interest rates.
• => Even with a fixed exchange rate, the proper combination of monetary & fiscal policy can attain internal & external balance at the same time.
ITF-220 - Prof.J.Frankell
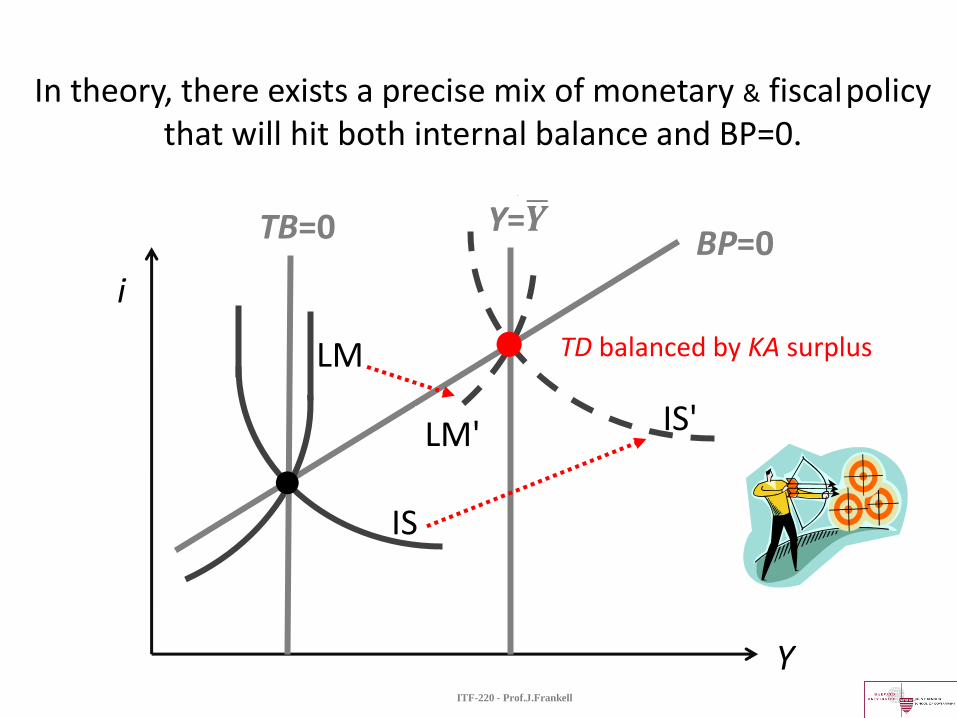
In theory, there exists a precise mix of monetary & fiscal policy that will hit both internal balance and BP=0.
BP=0 TB=0 Y=𝒀
LM
IS'
IS
Y
i
●
●
TD balanced by KA surplus
LM'

2. Practical difficulties of policymaking
Lags: between the change in a policy instrument and the response in the economy
Uncertainty with regard to: • the current position of the economy (“baseline”); • future disturbances (“shocks”); • the correct model (e.g., multipliers).
Expectations on the part of the public
Political Constraints

ITF-220, Prof.J.Frankel
i
Y
LM LM’
3. Liquidity trap or “Zero Lower Bound” Does monetary policy lose effectiveness?
IS
• ZLB: Increases in the money supply by the central bank are absorbed without further lowering i , the short-term rate. • E.g., Japan in late 1990s. • US, UK, ECB 2008-16.

ITF-220, Prof.J.Frankel
Liquidity trap or Zero Lower Bound, continued
• But central banks can still have effects via other channels: • Exchange rate depreciation • Boosting asset prices:
• equities & real estate
• Raising expected inflation, • thus lowering the real interest rate
• Lowering the long-term interest rate.
• Especially via some “unconventional” tools: • Quantitative Easing • Forward guidance.

End of Lecture 15: Problems/Applications
of discretionary policymaking

ITF-220 - Prof.J.Frankell
Appendix: China’s inflows, 2003-12,
including attempts to sterilize them, continued

=> R rising every year.
API-120 - Prof. J.Frankel, Harvard http://viableopposition.blogspot.com/2012/03/chinas-holdings-of-us-treasuries-what.html
http://qz.com/171645/the-invisible-man-managing-chinas-3-8-trillion-in-reserves-just-stepped-down
Recall that China ran large BoP surpluses after 2003.
at an increasing rate.

Source: Zhang, 2011, Fig.7, p.47.
The People’s Bank of China sold sterilization bills, taking cash RMB out of circulation (dNDA/dt < 0)
and so counteracted increases in Net Foreign Reserves.
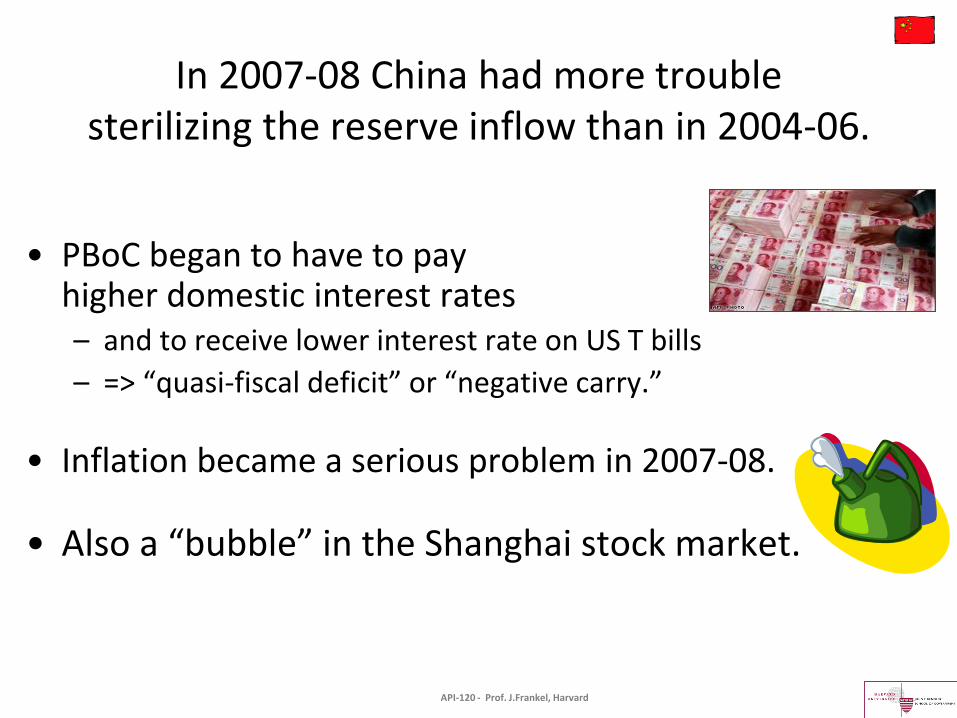
In 2007-08 China had more trouble sterilizing the reserve inflow than in 2004-06.
• PBoC began to have to pay higher domestic interest rates – and to receive lower interest rate on US T bills
– => “quasi-fiscal deficit” or “negative carry.”
• Inflation became a serious problem in 2007-08.
• Also a “bubble” in the Shanghai stock market.
API-120 - Prof. J.Frankel, Harvard
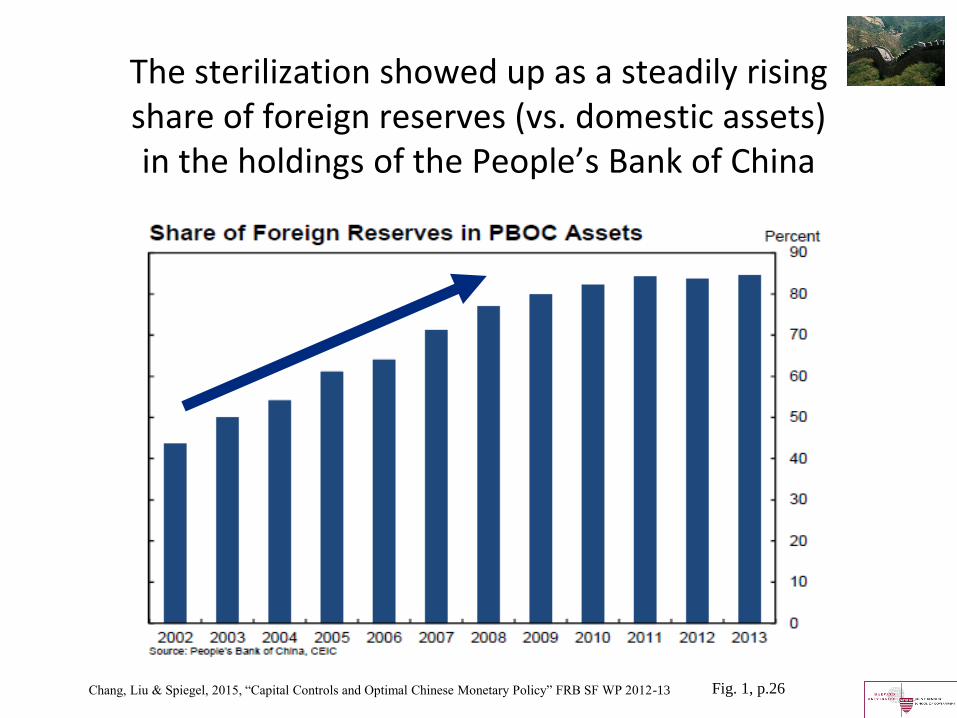
The sterilization showed up as a steadily rising share of foreign reserves (vs. domestic assets) in the holdings of the People’s Bank of China
Fig. 1, p.26 Chang, Liu & Spiegel, 2015, “Capital Controls and Optimal Chinese Monetary Policy” FRB SF WP 2012-13

Sterilization eventually faltered:
Money accelerated sharply in 2007-08.

Real growth > 10% in 2007-08
Growth > 10%

China’s CPI accelerated in 2007-08.
API-120 - Prof. J.Frankel, Harvard
Source: HKMA, Half-Yearly Monetary and Financial Stability Report, June 2008
Inflation 1999 to 2008

2007-08 bubble in China’s stock market
Data from EconStatsTM, Reuters, and major online news outlets such as the BBC & NYT.

The PBoC raised required reserve ratio for banks, continued
Source: Zhang, 2011, Fig.6, p.46.
ITF-220 - Prof.J.Frankell

China was hit by the 2009 global recession
2005-July 2015
temporarily ending any problem of excessive monetary expansion.

Chinese government investment spending in 2009 counteracted the recession.
Reserve Bank of Australia
} A rise in public investment offset the loss of export demand in 2009.

API-120 - Prof. J.Frankel, Harvard
China’s inflation broke sharply in 2008-09,
Inflation 2001 to 2011
But took off again in 2010-11.

36 Source: Gwynn Guilford — Sept. 6, 2013
Rate of increase of housing prices in 4 major Chinese cities (year-on-year)
China’s housing prices also took off again in 2013.

ITF220 - Professor J.Frankel
Lecture 16: Mundell-Fleming model with a floating exchange rate
• Rule: if result at a given exchange rate would be a BoP deficit, then result under floating is currency depreciation.
• Implications of capital mobility
• Monetary expansion: high κ => extra stimulus via net exports => more effect on Y.
• Fiscal expansion: high κ => crowding out of net exports => less effect on Y.
• Examples: – Monetary expansion (Japan 2013, ECB 2015)
– & contraction (UK 1980, US 1980, Japan 1990)
– Fiscal expansions (US twin deficits in early 1980s)
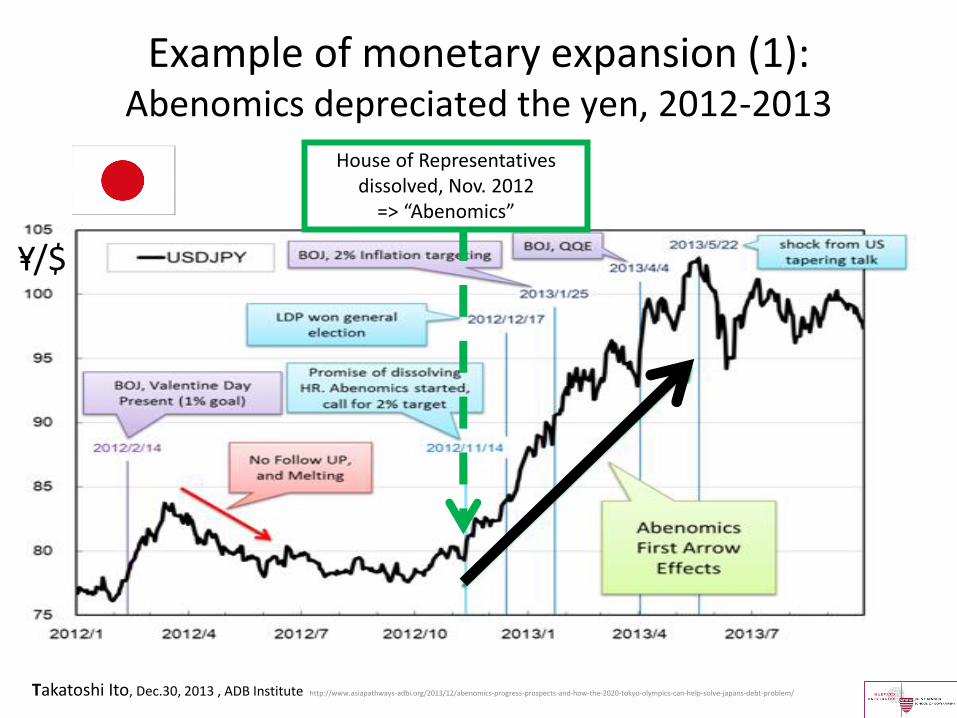
Example of monetary expansion (1): Abenomics depreciated the yen, 2012-2013
Takatoshi Ito, Dec.30, 2013 , ADB Institute http://www.asiapathways-adbi.org/2013/12/abenomics-progress-prospects-and-how-the-2020-tokyo-olympics-can-help-solve-japans-debt-problem/
House of Representatives dissolved, Nov. 2012
=> “Abenomics”
Y/$ =

ITF220 - Professor J.Frankel
Example of monetary expansion (2):
When ECB chief Mario Draghi announced QE Jan.22, 2015,
=> the euro depreciated.
$/€
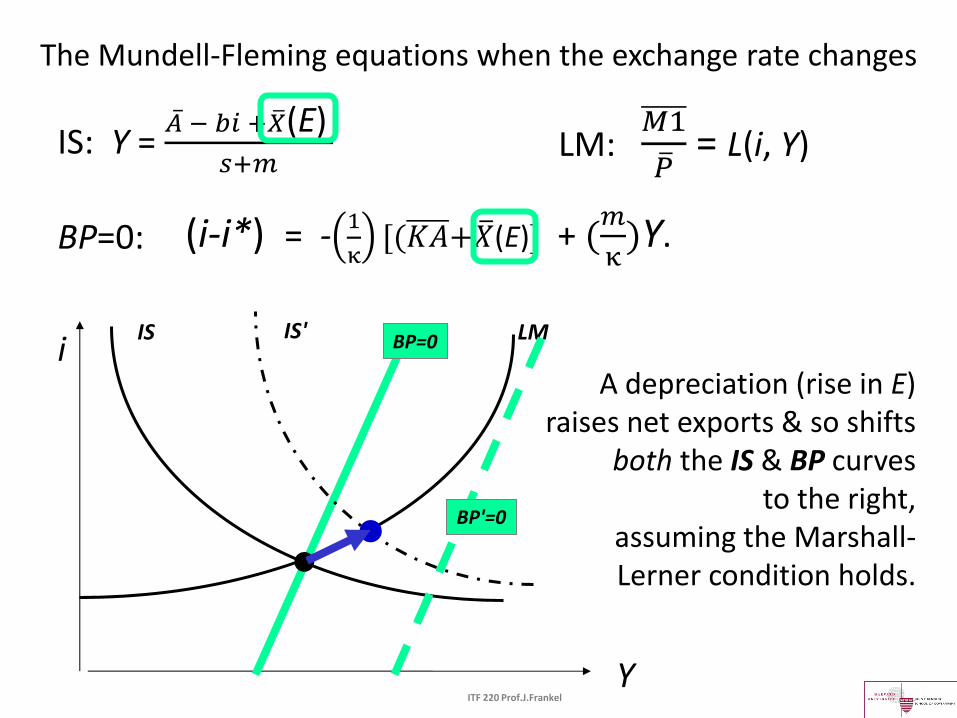
The Mundell-Fleming equations when the exchange rate changes
i
Y
LM IS
ITF 220 Prof.J.Frankel
IS: Y = 𝐴 − 𝑏𝑖 +𝑋 (E)
𝑠+𝑚 LM:
𝑀1
𝑃 = L(i, Y)
BP=0: (i-i*) = -1
κ[(𝐾𝐴+𝑋 (E)] + (
𝑚
κ)Y.
BP=0
A depreciation (rise in E) raises net exports & so shifts
both the IS & BP curves to the right,
assuming the Marshall-Lerner condition holds.
IS'
BP'=0
• •

i ↓ => capital outflow => more depreciation => higher net exports
Monetary Expansion
κ >> 0 κ > 0 κ = 0
ITF220 - Professor J.Frankel
• • • • • •

i ↑ => capital inflow => less depreciation => lower net exports
Fiscal Expansion
κ = 0 κ > 0 κ >> 0
ITF220 - Profe J.Frankel
• • • • • •

ITF220 - Professor J.Frankel
Examples of monetary contractions under modern conditions of high κ and floating exchange rates
• Thatcher monetary contraction of 1979-82
• Volcker monetary contraction of 1981-82
• Japanese monetary contraction of 1990-92
In each case, i ↑ , r ↑ (at A)
=> currency appreciated => net exports fell (B)
=> recession was more severe than in
traditional monetary tightenings.
IS IS’
LM'
LM
A
B
i
y

ITF220 - Professor J.Frankel
2) German union 1991-92.
Examples of
monetary/ fiscal mix:
1) Reagan- omics,
1981-84;
GDP composition shifts to G & C, away from I & X-M.
The US shift in monetary-fiscal mix: from low real interest rate & low $ in the late 1970s, to high real interest rate & high $ in the mid-1980s.
•
i
Y
LM
IS IS′
LM′
IS′′
M contrac-
tion
Late 1970s
1982
1984
•
•

We now have a causal interpretation of the twin deficits
US National Saving, Investment, & Current Account as Shares of GDP, 1949-2009
Trend: Gap widened,
as NS fell relative to I

Appendix: Japanese monetary expansion and yen depreciation
2012-15
“Abenomics”

QE: The Fed doubled the monetary base in 2008.
“HSBC: don’t worry, BoJ expansion will offset end of QE,” FT, Jun 14, 2013. http://blogs.ft.com/beyond-brics/2013/06/14/hsbc-dont-worry-boj-expansion-will-offset-end-of-qe/
Kuroda in Apr. 2013 announced BoJ would double over 2 years.

“Outlook 2014 - Recovery on a shaky footing,” Special , Economic Research Dept., Rabobank November 13, 2013, https://economics.rabobank.com/publications/2013/november/outlook-2014-recovery-on-a-shaky-footing/
HR dissolved, Nov. 2012 => “Abenomics”
Japan’s monetary easing (QQE) raised the exchange rate (Yen/$) and stock market

But Japan went back into recession in 2014 Q2, perhaps because of a big increase in the consumption tax
ITF220 - Professor J.Frankel
Abenomics seemed to boost growth, at first.
Nov. 2012 => “Abenomics”
April 2014 => Consumption tax

End of Lecture 16: Mundell-Fleming model
with a floating exchange rate