THE MSR PRIMARY WAVE SYSTEM 212-422-8040 Over the years, the stock market has generated Major...
19
THE MSR PRIMARY WAVE SYSTEM 212-422-8040 Over the years, the stock market has generated Major Secular Bull Markets. Examples: 1914-1929, 1949-1964 and 1982-2000. The Buy-Hold strategy became dominant and mostly unquestioned. Consequently, many investors and asset managers were forced to give up much of their profits during the lengthy intervening secular corrections. The MSR Primary Wave System is designed to provide investors with a major alternative. It is applied here to ETFs of Major US Economic Sectors from mid 2002 to mid 2009. The investment signals are derived from a series of broad price wave components labeled A, B, C, D and E, mathematically measured in most US and Global financial markets. The system protects capital when a broader price wave A or B is set to decline along with a shorter component. This permits substantially greater cumulative gains over time. Primary long trades also require a “Resonance Principle” which often leads to a high percentage of successful trades of extended duration. Long Term Total Returns substantial Capital Protection APPLIED TO MAJOR US INDUSTRY SECTORS LONG SHORT REPORT
-
Upload
noreen-copeland -
Category
Documents
-
view
213 -
download
0
Transcript of THE MSR PRIMARY WAVE SYSTEM 212-422-8040 Over the years, the stock market has generated Major...
THE MSR PRIMARY WAVE SYSTEM
212-422-8040
Over the years, the stock market has generated Major Secular Bull Markets. Examples: 1914-1929, 1949-1964 and 1982-2000. The Buy-Hold strategy became dominant and mostly unquestioned.
Consequently, many investors and asset managers were forced to give up much of their profits during the lengthy intervening secular corrections. The MSR Primary Wave System is designed to provide investors with a major alternative. It is applied here to ETFs of Major US Economic Sectors from mid 2002 to mid 2009. The investment signals are derived from a series of broad price wave components labeled A, B, C, D and E, mathematically measured in most US and Global financial markets. The system protects capital when a broader price wave A or B is set to decline along with a shorter component. This permits substantially greater cumulative gains over time. Primary long trades also require a “Resonance Principle” which often leads to a high percentage of successful trades of extended duration.
Long Term Total Returns substantial Capital Protection
APPLIED TO MAJORUS INDUSTRY SECTORS
LONG SHORT REPORT
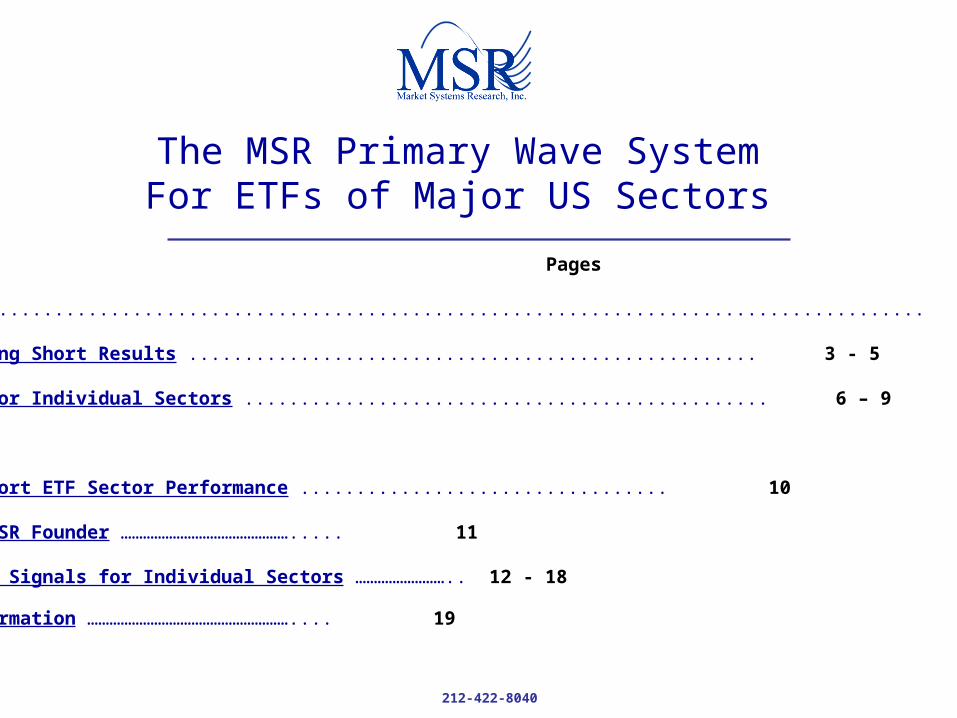
The MSR Primary Wave SystemFor ETFs of Major US Sectors
Pages
Introduction ..................................................................................... 1
Primary Wave Long Short Results ................................................... 3 - 5
System Charts for Individual Sectors ............................................... 6 – 9
Appendix:Appendix:
Monthly Long Short ETF Sector Performance ................................. 10
Developer and MSR Founder ………………………………………..... 11
Trades and Wave Signals for Individual Sectors …………………….. 12 - 18
Additional Information ……………………………………………….... 19
212-422-8040

3
MSR Primary Wave Trend Signals Applied to ETF SectorsTrade Signals 2002 - June 2009
-50
0
50
100
150
200
250
300
350
MSR Long & Long/Short vs. ETF Benchmark
Per
cen
t A
pp
reci
atio
n
ETF Benchmark MSR Long Only MSR Long/Short
Basic MaterialsConsumer Services
EnergyTechnology
FinancialIndustrials
Telecom
Dates are from initial Primary Wave signal in 2002. Dates are specified in tables to follow.
Interest income and transaction costs are not included.
212-422-8040
Consumer BasicServices Materials Technology Energy Financial Industrials Telecom
ETF Benchmark -20.6 7.7 -17.4 85.7 -45.5 -7.6 -41.9MSR Long Only 65.3 104.3 130.1 176.2 113.9 115.6 81.8
MSR Long/Short 177.1 195.4 335.7 314.1 304.7 286.4 274.7

4
Yearly PerformanceMSR PRIMARY WAVE SYSTEM APPLIED TO US SECTOR ETFs
Cumulative2002* 2003 2004 2005 2006 2007 2008 2009* Performance
TechnologyBuy-Hold IYW -39.65 49.26 -0.10 2.60 9.51 14.71 -43.44 25.93 -17.39MSR Long Only -2.11 41.77 6.16 0.98 12.37 14.71 -6.53 28.36 130.08MSR Long-Short 35.43 41.77 6.16 -0.63 12.37 14.71 28.91 29.87 335.68EnergyBuy-Hold IYE -14.79 25.42 30.04 33.41 18.75 34.49 -37.89 0.99 85.73MSR Long Only -3.03 23.73 30.04 33.41 3.80 34.49 -12.11 8.16 176.24MSR Long-Short 8.73 23.73 30.04 33.41 3.80 34.49 13.36 13.25 314.07IndustrialsBuy-Hold IYJ -17.1 31.12 15.32 2.90 11.95 11.66 -40.69 -3.43 -7.65MSR Long Only 2.94 32.18 7.44 -1.03 7.52 8.96 0.00 27.17 115.57MSR Long-Short 22.98 31.94 7.44 -1.03 7.52 8.96 34.21 47.31 286.40FinancialsBuy-Hold IYF -12.75 29.07 10.95 3.49 16.40 -20.00 -51.73 -6.21 -45.49MSR Long Only -0.83 28.23 7.86 4.36 10.30 -2.10 0.00 38.38 113.89MSR Long-Short 10.01 28.23 7.86 4.36 10.30 7.66 46.58 57.75 304.67Consumer ServicesBuy-Hold IYC -24.95 32.28 10.45 -2.58 13.10 -8.29 -31.85 5.17 -20.59MSR Long Only -5.44 27.21 12.70 -6.24 11.05 -2.20 0.00 19.72 65.26MSR Long-Short 12.52 27.21 12.70 -6.24 11.05 -0.92 31.43 29.50 177.1Basic MaterialsBuy-Hold IYM -14.61 32.41 10.46 2.34 14.63 30.26 -51.99 17.54 7.70MSR Long Only 3.18 33.09 5.48 -8.73 5.69 8.26 0.64 34.21 104.33MSR Long-Short 3.18 33.09 5.48 -13.63 5.69 8.26 47.00 43.20 195.40TelecommunicationsBuy-Hold IYZ -37.77 10.44 15.44 -5.93 29.70 -0.44 -44.14 7.88 -41.92MSR Long Only 7.08 20.95 6.52 -8.63 21.87 9.44 0.00 8.15 81.82MSR Long-Short 51.93 20.95 6.52 -8.63 21.87 11.37 43.36 8.29 274.73
Average of ETFsBuy-Hold -23.09 30.00 13.22 5.18 16.29 8.91 -43.10 6.84 -5.66MSR Long Only 0.26 29.59 10.89 2.02 10.37 10.22 -2.57 23.45 112.46MSR Long-Short 20.68 29.56 10.89 1.09 10.37 12.08 34.98 32.74 269.72
* From initial Primary Wave signal in 2002. Dates specified in tables to follow.* 2009 through June 30, 2009. Interest income and transaction costs are not included.

5
-25.00
0.00
25.00
50.00
75.00
100.00
125.00
150.00
175.00
200.00
225.00
250.00
275.00
300.00
325.00
212-422-8040
Perce
nt
App
recia
tion
MSR Monthly ETF PerformanceJune 30, 2002 – June 30, 2009
MSRLong Only+ 115.67 %
ETF Benchmark+ 6.71 %
MSR Long/Short, MSR Long Only vs. ETF Benchmark
MSR U.S. Sector ETF Performance Long/Short MSR U.S. Sector ETF Performance Long Only U.S. Sector ETF Benchmark
Total percent gain for the period = 302.95 % Total percent gain for the period = 115.67 % Total percent gain for the period = 6.71 %
Compounded annual rate of return = 22.03 % Compounded annual rate of return = 11.61 % Compounded annual rate of return = 0.93 %
l 2004 l 2003 l 2005 l 2006 l 2007 l 2008 l 2009
MSR Long/Short+ 302.95 %
U.S. Sector ETFS
IYM Basic MaterialsIYC Consumer ServicesIYE Energy SectorIYF Financial Sector IYJ Industrial SectorIYW Technology SectorIYZ Telecom Sector

6Market Systems Research, Inc.
212-422-8040
Cumulative Results: ETF Benchmark -17.4 % MSR Long Only 130.1 % MSR Long Short 335.7 %

7
Financial Sector
ETF Benchmark -45.5 %MSR Long Only 113.9 %MSR Long Short 304.7 %
Energy Sector
ETF Benchmark 85.7 %MSR Long Only 176.2 %MSR Long Short 314.1 %
Market Systems Research, Inc.212-422-8040
7
8
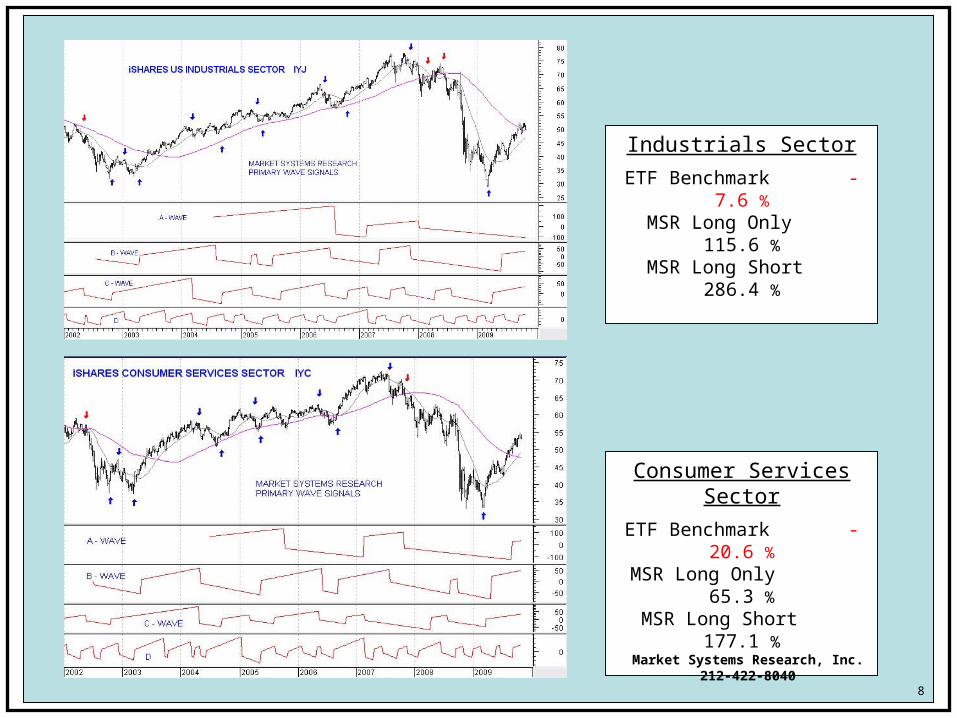
Industrials Sector
ETF Benchmark -7.6 %MSR Long Only 115.6 %MSR Long Short 286.4 %
Consumer Services Sector
ETF Benchmark -20.6 %MSR Long Only 65.3 %MSR Long Short 177.1 %
Market Systems Research, Inc.212-422-8040
8

9
Basic Materials Sector
ETF Benchmark 7.7 %MSR Long Only 104.3 %
MSR Long Short 195.4 %
Telecom Sector
ETF Benchmark -41.9 %MSR Long Only 81.8 %MSR Long Short 274.7 %
Market Systems Research, Inc.212-422-8040
9

10
212-422-8040
Monthly ETF Sector Performance: June 30, 2002 – June 30, 2009
Interest income and transaction costs are not included.
MSR U.S. Sector ETF Performance Long/Short MSR U.S. Sector ETF Performance Long Only U.S. Sector ETF Benchmark
Total percent gain for the period = 302.95 % Total percent gain for the period = 115.67 % Total percent gain for the period = 6.71 %
Compounded annual rate of return = 22.03 % Compounded annual rate of return = 11.61 % Compounded annual rate of return = 0.93 %
Appendix 1
January February March April May June July August September October November December
2002 ETF Sector Benchmark -10.15 1.05 -12.76 11.16 8.74 -6.59
MSR Long Only 0.00 0.00 0.00 -0.67 8.00 -6.43
MSR Long/Short 7.44 5.91 8.47 -7.97 7.88 -6.43
2003 ETF Sector Benchmark -3.76 -1.60 0.53 8.20 6.57 0.80 2.23 3.59 -2.79 6.62 0.94 5.85
MSR Long Only 0.25 0.00 -1.74 4.78 6.57 0.80 2.23 3.59 -2.79 6.62 0.94 5.85
MSR Long/Short 0.25 0.00 -1.74 4.78 6.57 0.80 2.23 3.59 -2.79 6.62 0.94 5.85
2004 ETF Sector Benchmark 1.15 2.20 -1.68 -2.57 1.31 2.95 -2.08 -0.10 3.22 1.49 5.45 1.61
MSR Long Only 1.15 2.20 -2.32 -0.43 -0.53 1.11 0.28 -0.13 1.17 1.01 5.45 1.61
MSR Long/Short 1.15 2.20 -1.92 -0.43 -0.53 1.11 0.44 -0.13 1.17 1.01 5.45 1.61
2005 ETF Sector Benchmark -2.85 3.97 -2.23 -3.88 3.48 0.51 4.81 -0.93 0.96 -2.39 4.74 -0.68
MSR Long Only -2.85 3.97 -1.40 -3.45 0.66 -0.19 4.81 -0.93 0.70 -2.75 3.64 -0.08
MSR Long/Short -2.85 3.97 -0.84 -2.20 -0.43 -0.19 4.81 -0.93 0.45 -1.81 2.99 -0.08
2006 ETF Sector Benchmark 4.58 -0.25 2.92 1.85 -3.60 0.34 -1.43 1.91 1.91 4.13 2.95 0.50
MSR Long Only 4.02 -0.60 1.65 1.21 -2.06 -0.78 0.30 0.34 1.20 2.10 2.39 0.50
MSR Long/Short 4.02 -0.60 1.65 1.21 -2.06 -0.34 0.30 0.34 1.20 2.10 2.39 0.50
2007 ETF Sector Benchmark 2.35 -1.31 1.25 3.77 5.40 -1.20 -2.47 0.63 4.04 1.30 -5.98 0.23
MSR Long Only 2.35 -1.31 1.25 3.77 5.40 -1.20 -1.30 -0.81 2.47 0.70 -2.65 1.24
MSR Long/Short 2.35 -1.31 1.25 3.77 5.40 -1.20 -1.30 -0.81 2.47 0.84 -1.07 2.96
2008 ETF Sector Benchmark -6.87 -2.43 -1.23 6.84 3.30 -8.29 -2.70 1.16 -13.01 -20.33 -8.44 1.05
MSR Long Only -2.66 0.26 -0.44 1.10 1.03 -0.20 -1.48 0.00 0.00 0.00 0.00 0.00
MSR Long/Short -0.79 3.37 -0.43 -1.53 0.19 6.96 -1.73 -1.59 10.31 16.39 5.35 -0.53
2009 ETF Sector Benchmark -9.04 -8.97 9.14 13.66 6.20 -1.81
MSR Long Only 0.00 0.00 4.09 13.66 6.20 -1.81
MSR Long/Short 4.96 4.78 3.93 13.66 6.20 -1.81

11
212-422-8040
Frank A. Peluso: brief fact sheet
Market Systems Research, Inc., New York 1970-Present; Founder, CEO and Research Director
• Developed MSR original Quantitative Selection Model,
• Provided Ranking Results to varied institutional client base,
• Strong Performance Relative to SP500 in 27 of 29 3-Yr Periods,
• Author of successful MSR Bond Timing Letter 1983-1997,
• Co-Founder, President of MSR Advisors, 1984 to 2000,
• Co-Managed the MSR Market Oriented Equity portfolios for the Lexington Management Company and its subsequent owner, ING, from 1984 to 2000, and
• Advisor to Market Oriented Domestic Equity portfolios for Strategy Asset Managers from 2000 to present.
• Developed the MSR Quantitative Primary Wave System 2007
• Author of Global Wave Analysis Report 2007 - Present
Princeton University: Princeton, NJ; AB Magna Cum Laude in Physics; Princeton University: Putnam Graduate Fellowship in Mathematical Physics.
Appendix 2
12
212-422-8040
Appendix 3
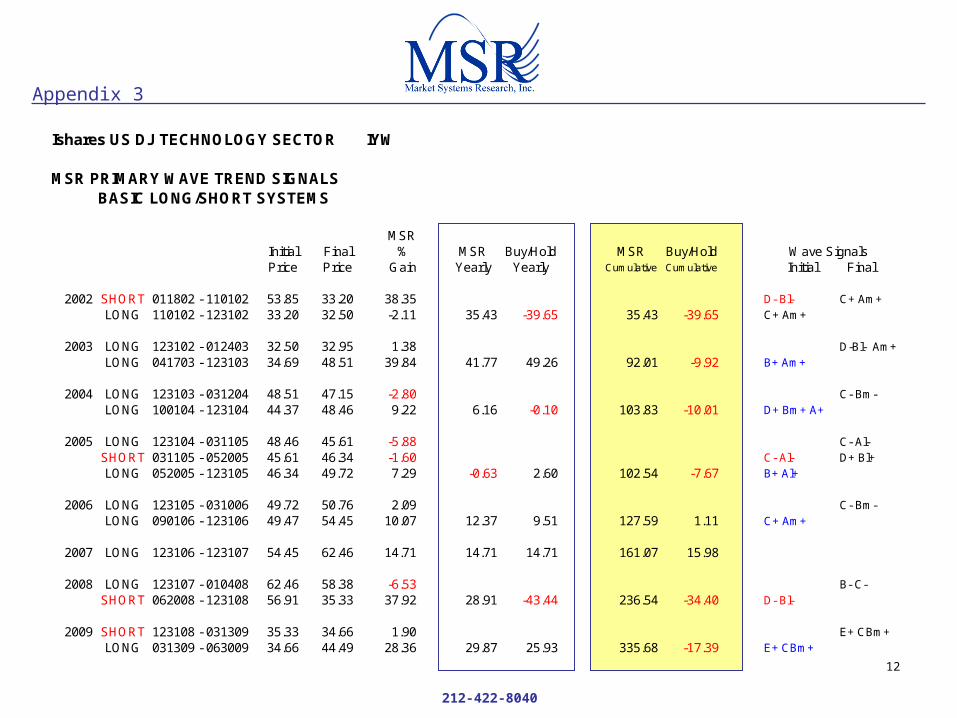
Ishares US DJ TECHNOLOGY SECTOR IYW
MSR PRIMARY WAVE TREND SIGNALSBASIC LONG/SHORT SYSTEMS
MSRInitial Final % MSR Buy/Hold MSR Buy/Hold Wave SignalsPrice Price Gain Yearly Yearly Cumulative Cumulative Initial Final
2002 SHORT 011802 - 110102 53.85 33.20 38.35 D- Bl- C+ Am+LONG 110102 - 123102 33.20 32.50 -2.11 35.43 -39.65 35.43 -39.65 C+ Am+
2003 LONG 123102 - 012403 32.50 32.95 1.38 D-Bl- Am+LONG 041703 - 123103 34.69 48.51 39.84 41.77 49.26 92.01 -9.92 B+ Am+
2004 LONG 123103 - 031204 48.51 47.15 -2.80 C- Bm-LONG 100104 - 123104 44.37 48.46 9.22 6.16 -0.10 103.83 -10.01 D+ Bm+ A+
2005 LONG 123104 - 031105 48.46 45.61 -5.88 C- Al-SHORT 031105 - 052005 45.61 46.34 -1.60 C- Al- D+ Bl+LONG 052005 - 123105 46.34 49.72 7.29 -0.63 2.60 102.54 -7.67 B+ Al+
2006 LONG 123105 - 031006 49.72 50.76 2.09 C- Bm-LONG 090106 - 123106 49.47 54.45 10.07 12.37 9.51 127.59 1.11 C+ Am+
2007 LONG 123106 - 123107 54.45 62.46 14.71 14.71 14.71 161.07 15.98
2008 LONG 123107 - 010408 62.46 58.38 -6.53 B- C-SHORT 062008 - 123108 56.91 35.33 37.92 28.91 -43.44 236.54 -34.40 D- Bl-
2009 SHORT 123108 - 031309 35.33 34.66 1.90 E+ CBm+LONG 031309 - 063009 34.66 44.49 28.36 29.87 25.93 335.68 -17.39 E+ CBm+

13
212-422-8040
Appendix 4
Ishares US DJ FINANCIAL SECTOR IYF
MSR PRIMARY WAVE TREND SIGNALSBASIC LONG/SHORT SYSTEMS
MSRInitial Final % MSR Buy/Hold MSR Buy/Hold Wave SignalsPrice Price Gain Yearly Yearly Cumulative Cumulative Initial Final
2002 SHORT 060702 - 101802 78.18 69.63 10.94 C- Al- E+ CAm+LONG 101802 - 121302 69.63 69.05 -0.83 10.01 -12.75 10.01 -12.75 E+ CAm+ D- Bl-Am+
2003 LONG 032103 - 123103 68.66 88.04 28.23 28.23 29.07 41.06 12.61 DC+ Am+
2004 LONG 123103 - 041604 88.04 90.09 2.33 C- Bm-LONG 091704 - 123104 92.67 97.68 5.41 7.86 10.95 52.15 24.94 C+ A+
2005 LONG 123104 - 031105 97.68 94.60 -3.15 C- B-LONG 052005 - 123105 93.81 101.09 7.76 4.36 3.49 58.79 29.31 B+ Al+
2006 LONG 123105 - 051906 101.09 104.40 3.27 C- Bm-LONG 092206 - 123106 110.17 117.67 6.81 10.30 16.40 75.15 50.51 A+ Cm+
2007 LONG 123106 - 062907 117.67 115.20 -2.10 B- C-SHORT 101907 - 123107 104.56 94.14 9.97 7.66 -20.00 88.57 20.41 E- AB-
2008 SHORT 123107 - 123108 94.14 45.44 51.73 46.58 -51.73 168.43 -41.88
Jun-09 SHORT 123108 - 031309 45.44 30.80 32.22 E+ CmBm+LONG 031309 - 063009 30.80 42.62 38.38 57.75 -6.21 304.67 -45.49 E+Cm+Bm+
14
212-422-8040
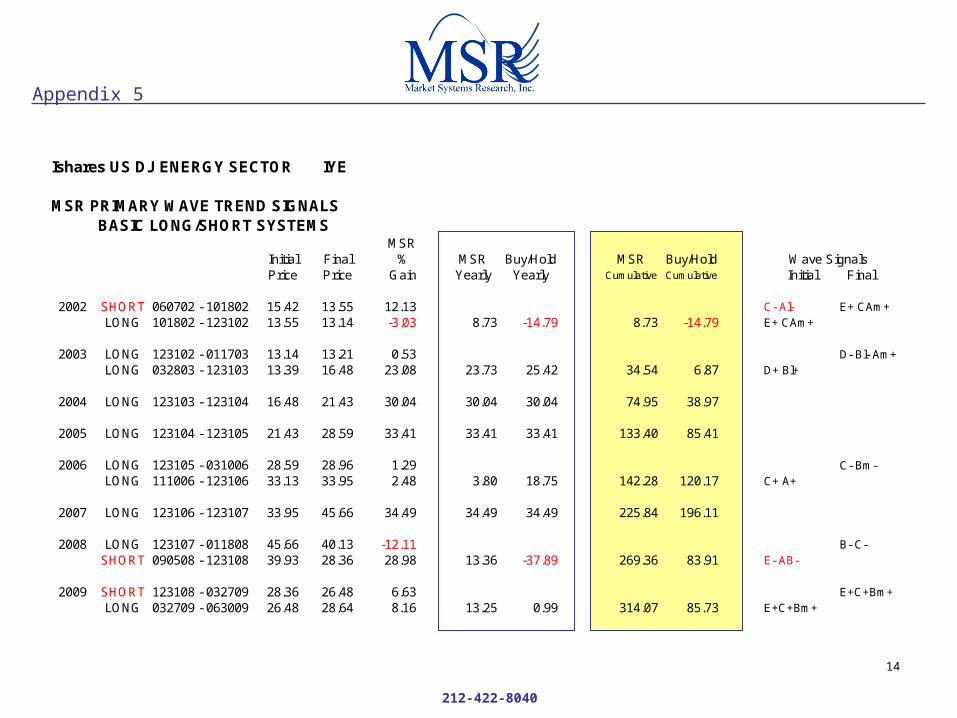
Appendix 5
Ishares US DJ ENERGY SECTOR IYE
MSR PRIMARY WAVE TREND SIGNALSBASIC LONG/SHORT SYSTEMS
MSRInitial Final % MSR Buy/Hold MSR Buy/Hold Wave SignalsPrice Price Gain Yearly Yearly Cumulative Cumulative Initial Final
2002 SHORT 060702 - 101802 15.42 13.55 12.13 C- Al- E+ CAm+LONG 101802 - 123102 13.55 13.14 -3.03 8.73 -14.79 8.73 -14.79 E+ CAm+
2003 LONG 123102 - 011703 13.14 13.21 0.53 D- Bl- Am+LONG 032803 - 123103 13.39 16.48 23.08 23.73 25.42 34.54 6.87 D+ Bl+
2004 LONG 123103 - 123104 16.48 21.43 30.04 30.04 30.04 74.95 38.97
2005 LONG 123104 - 123105 21.43 28.59 33.41 33.41 33.41 133.40 85.41
2006 LONG 123105 - 031006 28.59 28.96 1.29 C- Bm-LONG 111006 - 123106 33.13 33.95 2.48 3.80 18.75 142.28 120.17 C+ A+
2007 LONG 123106 - 123107 33.95 45.66 34.49 34.49 34.49 225.84 196.11
2008 LONG 123107 - 011808 45.66 40.13 -12.11 B- C-SHORT 090508 - 123108 39.93 28.36 28.98 13.36 -37.89 269.36 83.91 E- AB-
2009 SHORT 123108 - 032709 28.36 26.48 6.63 E+C+Bm+LONG 032709 - 063009 26.48 28.64 8.16 13.25 0.99 314.07 85.73 E+C+Bm+

15
212-422-8040
Appendix 6
Ishares US DJ INDUSTRIAL SECTOR IYJ
MSR PRIMARY WAVE TREND SIGNALSBASIC LONG/SHORT SYSTEMS
MSRInitial Final % MSR Buy/Hold MSR Buy/Hold Wave SignalsPrice Price Gain Yearly Yearly Cumulative Cumulative Initial Final
2002 SHORT 051002 - 101802 45.15 36.36 19.47 C- Al- E+ CAm+ LONG 101802 - 123102 36.36 37.43 2.94 22.98 -17.10 22.98 -17.10 E+ CAm+
2003 LONG 123102 - 011703 37.43 37.50 0.19 D-Bl- Am+LONG 041703 - 123103 37.20 49.08 31.94 31.94 31.12 62.56 8.70 D+ Bl+
2004 LONG 123103 - 031204 49.08 47.98 -2.24 C- Bm-LONG 091004 - 123104 51.50 56.60 9.90 7.44 15.32 74.66 25.35 C+ A+
2005 LONG 123104 - 041505 56.60 52.68 -6.93 B- C-LONG 052005 - 123105 54.77 58.24 6.34 -1.03 2.90 72.86 28.99 D+ Bl+
2006 LONG 123105 - 060906 58.24 60.68 4.19 C- Bm-LONG 102706 - 123106 63.18 65.20 3.20 7.52 11.95 85.86 44.40 C+ Al+
2007 LONG 123106 - 112307 65.20 71.04 8.96 B- C-CASH 112307 - 123107 71.04 72.80 0.00 8.96 11.66 102.51 61.24
2008 CASH 123107 - 030708 72.80 65.63 0.00SHORT 030708 - 123108 65.63 43.18 34.21 34.21 -40.69 171.78 -4.37 E- A- B-
2009 SHORT 123108 - 031309 43.18 32.79 24.06 E+Cm+Bm+LONG 031309 - 063009 32.79 41.70 27.17 47.31 -3.43 286.40 -7.65 E+Cm+Bm+
16
212-422-8040
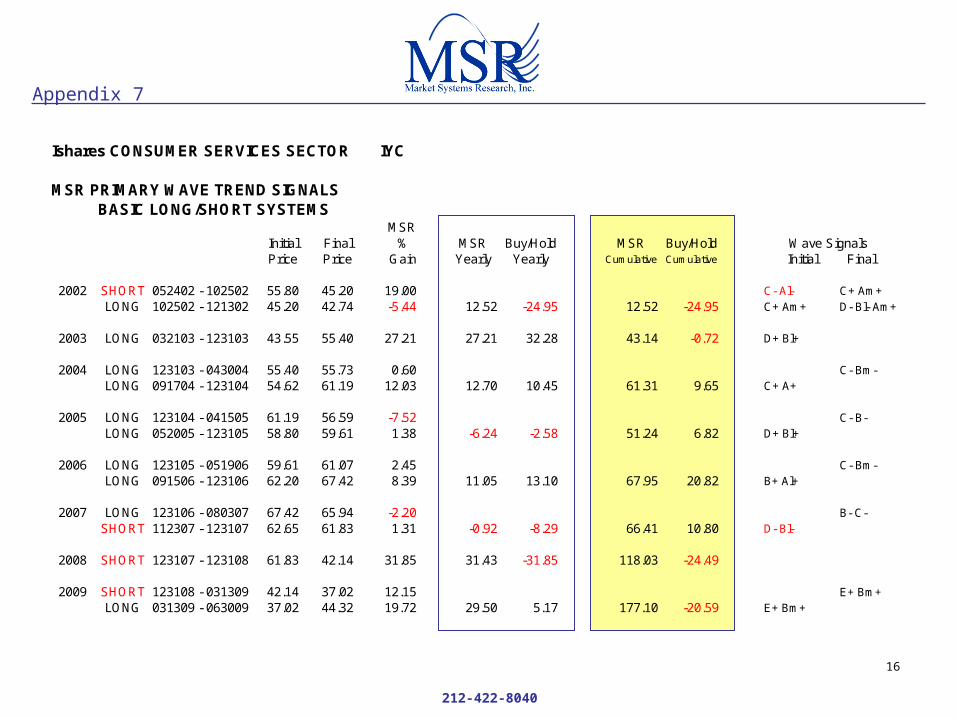
Appendix 7
Ishares CONSUMER SERVICES SECTOR IYC
MSR PRIMARY WAVE TREND SIGNALSBASIC LONG/SHORT SYSTEMS
MSRInitial Final % MSR Buy/Hold MSR Buy/Hold Wave SignalsPrice Price Gain Yearly Yearly Cumulative Cumulative Initial Final
2002 SHORT 052402 - 102502 55.80 45.20 19.00 C- Al- C+ Am+LONG 102502 - 121302 45.20 42.74 -5.44 12.52 -24.95 12.52 -24.95 C+ Am+ D- Bl- Am+
2003 LONG 032103 - 123103 43.55 55.40 27.21 27.21 32.28 43.14 -0.72 D+ Bl+
2004 LONG 123103 - 043004 55.40 55.73 0.60 C- Bm-LONG 091704 - 123104 54.62 61.19 12.03 12.70 10.45 61.31 9.65 C+ A+
2005 LONG 123104 - 041505 61.19 56.59 -7.52 C- B-LONG 052005 - 123105 58.80 59.61 1.38 -6.24 -2.58 51.24 6.82 D+ Bl+
2006 LONG 123105 - 051906 59.61 61.07 2.45 C- Bm-LONG 091506 - 123106 62.20 67.42 8.39 11.05 13.10 67.95 20.82 B+ Al+
2007 LONG 123106 - 080307 67.42 65.94 -2.20 B- C-SHORT 112307 - 123107 62.65 61.83 1.31 -0.92 -8.29 66.41 10.80 D- Bl-
2008 SHORT 123107 - 123108 61.83 42.14 31.85 31.43 -31.85 118.03 -24.49
2009 SHORT 123108 - 031309 42.14 37.02 12.15 E+ Bm+LONG 031309 - 063009 37.02 44.32 19.72 29.50 5.17 177.10 -20.59 E+ Bm+

17
212-422-8040
Appendix 8
Ishares US DJ BASIC MATERIALS SECTOR IYM
MSR PRIMARY WAVE TREND SIGNALSBASIC LONG/SHORT SYSTEMS
MSRInitial Final % MSR Buy/Hold MSR Buy/Hold Wave SignalsPrice Price Gain Yearly Yearly Cumulative Cumulative Initial Final
2002 AVOID 060702 - 101802 40.32 33.37 0.00 C- Am- E+ CAm+LONG 101802 - 123102 33.37 34.43 3.18 3.18 -14.61 3.18 -14.61 E+ CAm+
2003 LONG 123102 - 012403 34.43 33.40 -2.99 D-Bl- Am+LONG 041703 - 123103 33.23 45.59 37.20 33.09 32.41 37.32 13.06 D+ Am+
2004 LONG 123103 - 031904 45.59 43.44 -4.72 C- Bm-LONG 091004 - 123104 45.49 50.36 10.71 5.48 10.46 44.85 24.89 C+ A+
2005 LONG 123104 - 041505 50.36 46.35 -7.96 C- B-LONG 061705 - 092305 49.32 47.43 -3.83 D+ Bl+ D- Bl-
SHORT 092305 - 111805 47.43 49.98 -5.38 D- Bl- D+ Bl+LONG 111805 - 123105 49.98 51.54 3.12 -13.63 2.34 25.10 27.81 D+ Bl+
2006 LONG 123105 - 060906 51.54 53.11 3.05 C- Bm-LONG 111706 - 123106 57.60 59.08 2.57 5.69 14.63 32.22 46.51 C+ Al+
2007 LONG 123106 - 081707 59.08 63.96 8.26 8.26 30.26 43.15 90.85 B- C-
2008 LONG 020108 - 072508 75.23 75.71 0.64 C+ A+ B- C-SHORT 090508 - 123108 68.51 36.95 46.07 47.00 -51.99 110.42 -8.37 D- B- Al-
2009 SHORT 123108 - 031309 36.95 32.36 12.42 C+ Bm+LONG 031309 - 063009 32.36 43.43 34.21 43.20 17.54 195.36 7.70 E+ BCm+
18
212-422-8040
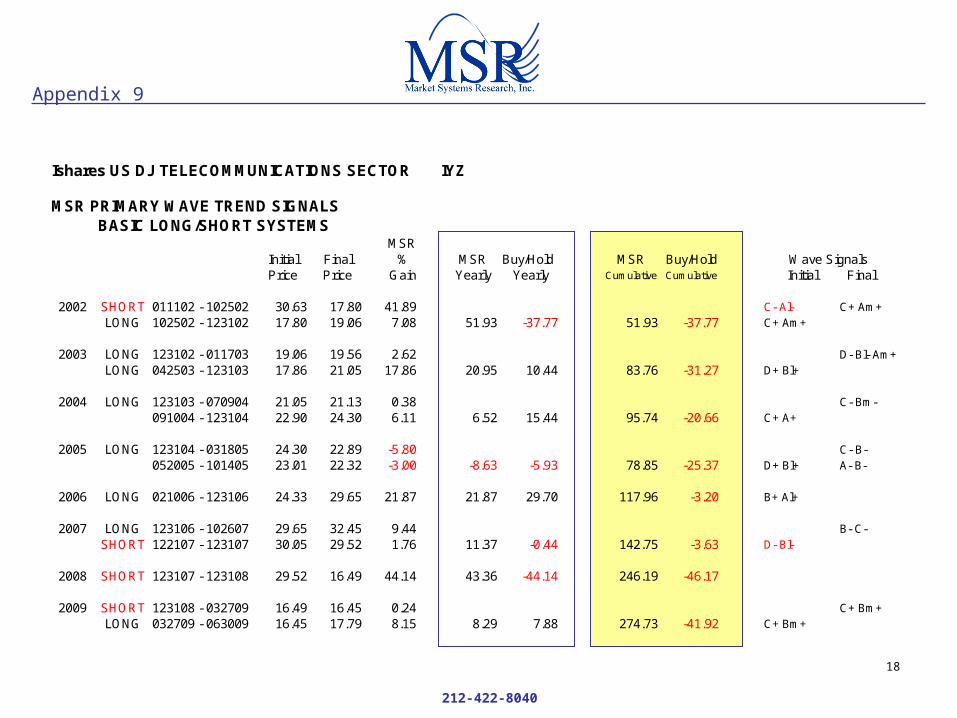
Appendix 9
Ishares US DJ TELECOMMUNICATIONS SECTOR IYZ
MSR PRIMARY WAVE TREND SIGNALSBASIC LONG/SHORT SYSTEMS
MSRInitial Final % MSR Buy/Hold MSR Buy/Hold Wave SignalsPrice Price Gain Yearly Yearly Cumulative Cumulative Initial Final
2002 SHORT 011102 - 102502 30.63 17.80 41.89 C- Al- C+ Am+LONG 102502 - 123102 17.80 19.06 7.08 51.93 -37.77 51.93 -37.77 C+ Am+
2003 LONG 123102 - 011703 19.06 19.56 2.62 D- Bl- Am+LONG 042503 - 123103 17.86 21.05 17.86 20.95 10.44 83.76 -31.27 D+ Bl+
2004 LONG 123103 - 070904 21.05 21.13 0.38 C- Bm-091004 - 123104 22.90 24.30 6.11 6.52 15.44 95.74 -20.66 C+ A+
2005 LONG 123104 - 031805 24.30 22.89 -5.80 C- B-052005 - 101405 23.01 22.32 -3.00 -8.63 -5.93 78.85 -25.37 D+ Bl+ A- B-
2006 LONG 021006 - 123106 24.33 29.65 21.87 21.87 29.70 117.96 -3.20 B+ Al+
2007 LONG 123106 - 102607 29.65 32.45 9.44 B- C-SHORT 122107 - 123107 30.05 29.52 1.76 11.37 -0.44 142.75 -3.63 D- Bl-
2008 SHORT 123107 - 123108 29.52 16.49 44.14 43.36 -44.14 246.19 -46.17
2009 SHORT 123108 - 032709 16.49 16.45 0.24 C+ Bm+LONG 032709 - 063009 16.45 17.79 8.15 8.29 7.88 274.73 -41.92 C+ Bm+
19
Additional Information
The statistical and other information contained in this report has been obtained from official reports, electronic data and other sources which we believe reliable. While we cannot guarantee its entire accuracy or completeness, we believe it may be accepted as substantially correct. Past research performance is not an indication of future results. Any projections, outlooks or assumptions should not be construed to be indicative of the actual events which will occur. Back-tested data has inherent limitations because it does not reflect actual transactions. There is no representation that actual future results will be similar. The examples of specific research are included merely to illustrate the process and strategies which may be utilized. The officers of and/or Market Systems Research, Inc. may at times have a position on any security herein.
Appendix 10


![[ARCHIVED] 8040 9040 GCE Biology International PDF](https://static.fdocuments.us/doc/165x107/577cc30e1a28aba711950644/archived-8040-9040-gce-biology-international-pdf.jpg)