
The most important environmental issue?. The scientific study of the characteristics in the size and...
47
The most important environmental issue?
-
Upload
hillary-robinson -
Category
Documents
-
view
212 -
download
0
Transcript of The most important environmental issue?. The scientific study of the characteristics in the size and...

The most importantenvironmental issue?


The scientific study of the characteristics in the size and structure of human and non-human populations


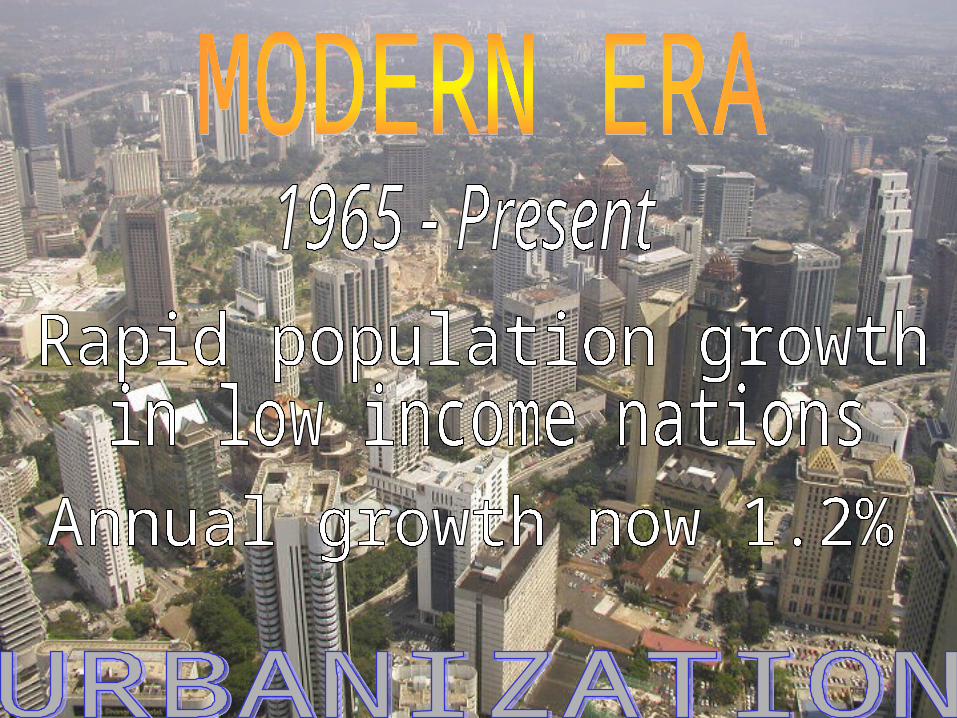
Increasing our Carrying Capacity
Figure 7.5


Figure 7.8
Population Density

Figure 7.15


Number of live births per 1000women of childbearing age
# of live births per 1000 women withina specified age range
# of children expected to be born tothe average woman in her lifetime

TFR by Region

(TFR)

Total Fertility Rate can be controlled
•Quality education for both sexes andwomens’ empowerment
•Social security for the aged•Access to contraception and family
planning•Quality health care and low infant
mortality rates•Urbanization (children in school)

Family Planning and TFR• Nations
that invested in family planning (green) reduced TFRs more than similar nations that did not (red).
Figure 7.17a

Female Education and TFR
• Female literacy and school enrollment are correlated with total fertility rate:
• More-educated women have fewer children.
Figure 7.16


Latvia 8 Germany 9 Bulgaria 9 Slovenia 9 Estonia 9Italy 9 Bosnia and Herzegovina 9Slovakia 10Ukraine 10Greece 10Austria 10 Russia 10 Belarus 10Czech Republic 10 Belgium 10 Spain 10 Romania 10 Andorra 10 Croatia 10Luxembourg 10 San Marino 10 Japan 10

Niger 49 Mali 47 Afghanistan 47 Chad 47 Uganda
46 Somalia 46 Angola 45Liberia 45 Democratic Republic of Congo 45Burkina Faso 44 Malawi 44 Sierra Leone 43 Yemen 43 Benin 43 Guinea 42 Madagascar 42 Mauritania 42Sao Tome and Principe 42 Djibouti 40

Malawi 24 Niger 23 Zambia 23 Swaziland 22 Ethiopia 21 Botswana 21 Zimbabwe 20 Namibia 20 Rwanda 20 Somalia 19 Mali 19 Uganda
18 Burkina Faso 18 Mozambique 17 Guinea 17 Burundi 17 Afghanistan 17 Sierra Leone 17 Tanzania 17 Western Sahara 17Chad 17

For a live update, see:http://opr.princeton.edu/popclock/

Figure 7.7

Source: Population concern
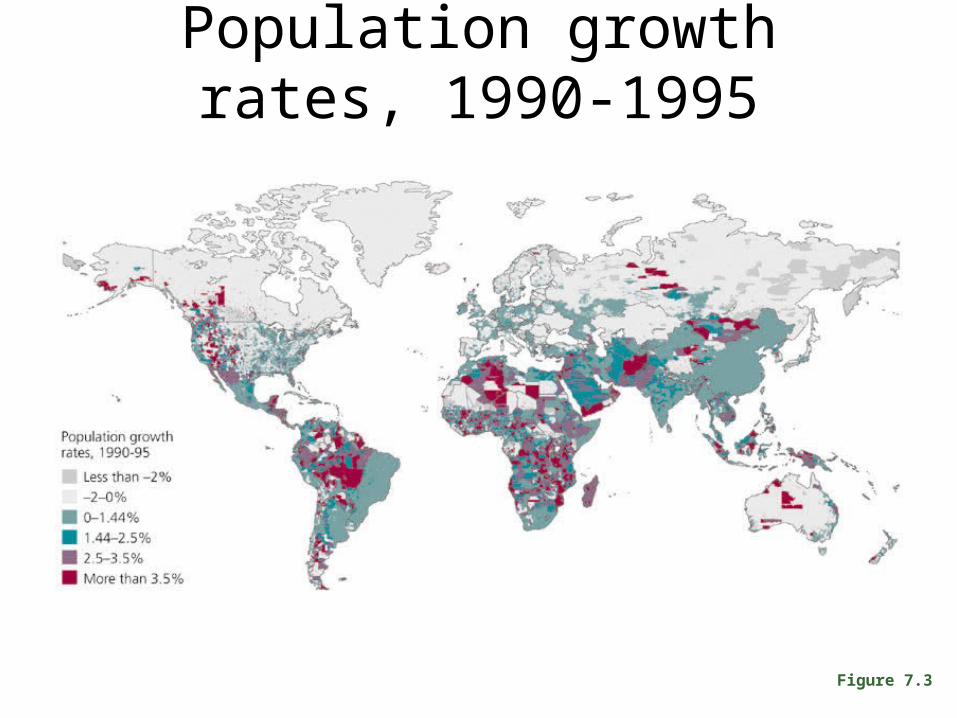
Population growth rates, 1990-1995
Figure 7.3

China
One ChildPolicy

Age structure: “Graying populations”
• China’s aging population will mean fewer working-age citizens to finance social services for retirees. Figure 7.11c

Age structure: “Graying populations”
• Demographers project that China’s population will become older over the next two decades.
Figure 7.11a,b

China’s natural rate of change has fallen

Malnutrition has beena distribution problem
What does the future hold?

Source: Committee for the National Institute for the Environment

Per-capita availability ofResources peaked in the 1960’s and 1970’s

Source: FAO


HIV/AIDS and Human Population• Infects 1 in 5 people in southern African nations
• Infects at least 5 million new people each year
• Kills babies born to infected mothers
• Has orphaned 14 million children
• Has cut 15 years off life expectancies in parts of southern Africa
• May inhibit demographic transition, leading to population
Figure 7.27

Source: World Bank

The population sometimes continuesto rise after fertility falls below thereplacement level, due to agedistribution.

Age structure
Figure 7.9

Age structure: Age pyramids
• Canada (left) has a much slower growing population than does Madagascar (right).
Figure 7.10

Poorer countries will experience most future population growth
• 98% of the population increase will occur in developing nations
Figure 7.20

Figure 7.23

The Wealth Gap
• The richest 20% of the world’s people consumes 86% of its resources, and has >80 times the income of the poorest 20%.
Figure 7.25


