Mobile Internet - Mobile Usage & Habits of MENA Internet users, January 2011

The Mobile Internet
Phenomena ReportMay 2021

Welcome
2
The Mobile Internet
Phenomena ReportMay 2021
Copyright © 2021 Sandvine. All rights reserved. All other trademarks are property of their respective owners.
The internet and key applications keep everyone connected in challenging times
The COVID-19 pandemic is continuing
to accelerate mobile traffic growth and
profoundly change how we engage,
communicate, interact, and transact in our
daily lives.
New 5G and cloud technologies will be
pivotal for mobile operators to capture
the opportunities presented by these
transformative changes.
Sandvine is privileged to work with network
operators to help deliver a better experience
and ultimately connectivity to many internet
users.
Never before have consumers, enterprises
and network operators given network quality
as much attention as they are now.
It is now clear that network users are able to
do more than ever while on the move. This
edition of the report covers global views of
the composition of traffic on the internet.
Data LexiconDownstream: Traffic volume downloaded
from the internet. Examples would be a video
stream, a file download, or an app download
from iTunes.
% Downstream: Percent of application traffic
taken from all downstream traffic on the data
sample.
Upstream: Traffic volume uploaded to the
internet. Examples would be requests for
content, interactive messaging sessions, or
streams of a gaming session from a console.
% Upstream: Percent of application traffic
taken from all upstream traffic on the data
sample.
Connections: Represents the number of
“conversations” occurring for an application.
Some applications use a single connection
for all traffic, others use many connections to
transfer data or video to the end user.
About SandvineSandvine’s market leading Service Innovation and Intelligence portfolio helps customers deliver
exceptional digital experiences and grow revenues. Our ability to classify over 95% of network traffic
across mobile and fixed networks by user, application, device, location, and other parameters creates
uniquely rich, real-time network and service data. We then apply machine learning-based contextual
insights to improve performance and enhance digital services.
Our real-time data and extensive global deployments with over 160 global service providers covering 2.5
billion users have made us a global authority on evolving internet phenomena.
We are committed to delivering the preeminent view of global trends and distilled insights into the internet
application ecosystem. As our global reach continues to expand across fixed, mobile, cable, satellite, and
WiFi networks, we will bring you viewpoints on these trends and special topics through our report series.
Our goal with this report is to inform our customers and the global community on the mobile ‘internet
phenomena’ we live through every day, and to expose both challenges and opportunities to build a more
collaborative ecosystem, providing a robust connected experience for users.
We hope you enjoy the report. If you have feedback or suggestions on how we can make this report better,
contact us at [email protected]. If you’re an OTT content provider and have an application you
want covered in the phenomena report, click here.
About The Mobile Internet Phenomena DataThe data in this edition of The Mobile Internet
Phenomena Report is drawn from Sandvine’s
installed base of mobile operators worldwide.
The report does not include significant data from
either China or India, but the data represents a
portion of Sandvine’s installed base, a statistically
significant segment of the internet population.
This edition is solely focused on mobile data in order
to provide a targeted model that mobile operators
can draw from to begin their planning process.
The Mobile Internet Phenomena Report ranks
applications based on their “traffic share.” The
fascinating data that fuels the report illustrates the
disconnect between “market share” for companies
defined by subscriber counts and how often
subscribers use a service.
Traffic share is defined as the percentage of network
resources used by a specific application relative to
other applications.
Download previous Internet Phenomena ReportsSee what trends and data shaped global and mobile
internet usage in the recent past. Click here to visit
Sandvine’s Internet Phenomena Report library and
download previous Internet Phenomena Reports.

Section 1: Global News Section 3: Looking Forward
EXECUTIVE OVERVIEWA brief overview of the key findings in this issue of The Mobile
Internet Phenomena Report.
MOBILE APPLICATION CATEGORY TRAFFIC SHARE What application categories are the leading consumers of
internet bandwidth? The real question is, how much traffic on the
internet is video?
MOBILE TRENDS: GLOBAL TOP MOVERSWho are the biggest movers beyond the top 10? With visibility
to over 5000+ applications, we take a look at how the new normal on
the network is shaking up which application usage.
DAY IN THE LIFE OF A MOBILE NETWORKMobile operators are focused on providing differentiated
experiences. How do operators ensure quality of experience (QoE) in
today’s changing applications landscape?
5G INNOVATE The era of 5G and the Internet of Things (IoT) is upon us.
The time to act is now to ensure that service innovation and
intelligence at the core of 5G business decisions.
VIDEO-FIRST ECONOMY What is a video-first economy? Take a deeper dive into what services have changed in the past year and
how to engineer the network of the future. With the transition to work-from-home, how have mobile networks
been affected?
VIDEO SPOTLIGHTAs short-form video takes over, video quality and constant connectivity are key. Video is now over 48%
of all traffic happening on a network, so understanding hourly trends matters to ensure network subscribers
have a great experience. Take a deep dive and understand how YouTube, on a regular day, compares to overall
video trends on a mobile network.
SOCIAL SPOTLIGHTSocial usage overall has grown in 2021 and has become more critical, with people looking to stay
connected together more than ever during the stay-at-home orders. Take a look at the top five ‘social’ services
and how social is being experienced on a mobile network.
TIKTOK VS SNAPCHAT With TikTok becoming a behemoth in the social sharing and entertainment category, how do TikTok and
Snachap stack up?
MESSAGING SPOTLIGHTTake a look at the top five messaging services and the transformations within messaging with a spotlight
on Zoom.
Section OverviewThe Mobile Internet
Phenomena ReportMay 2021
3Copyright © 2021 Sandvine. All rights reserved. All other trademarks are property of their respective owners.
Section 2: Phenomena Spotlights
7
8
9
10
17
11
12

Video Streaming, Social Networking and Web Browsing continue to be the categories driving growthThe interactive network is driven by applications
that help keep us, our businesses, and our families
connected. Video Streaming, Web, and Social are
the three top categories. These categories include
the most ‘QoE-sensitive’ applications with which
consumers often have poor experiences – whether
it is a web page not loading or a video stalling.
Category highlightsVideo Streaming:
Consumer mobile networks have become more
critical to our personal and professional relationships.
Relationships are now being built and nurtured
online, predominately through video. It is therefore
no surprise that Video Streaming continues to take
the top traffic spot. YouTube and TikTok reign this
category with tremendous growth in the past year.
Their easy to watch, ever-changing new content
continue to capture the imagination.
What is surprising is the shift in the ranking of
applications within this category. Read more in the
video spotlight.
Social Sharing:
Social Sharing has been slowly evolving from a static
to a dynamic medium. Now more than ever, dynamic
content such as reels, video snaps, and stories are
helping people feel connected when being together
just isn’t possible. The increased reliance on social
sharing to build and maintain connections has made
a high quality of experience critical in this category.
This introduces new challenges for networks
worldwide. TikTok, Zoom, Skype, Snapchat,
FaceTime, and even Facebook Live were all in the
top 50 upstream applications as part of the new
video-first economy. The use of social applications
on mobile networks is matching typical work and
school hours again as stay-at-home orders are lifted.
Learn more in the social spotlight.
Messaging:
Out with the old, in with the new. Gone are the days
of SMS texting as messaging applications and video-
based messaging become prevalent. Especially on
the upstream, we are seeing messaging applications
become a critical part of the mobile experience.
Memes, voice messages, and reactions are enriching
the content we share via messaging. Learn more in
the messaging spotlight.
5G Experience ExpectationsThe improved performance of 4G and the coming
promise of 5G will continue to drive consumers to
adopt new technology to have the best experience.
Unlike best-effort 4G networks, 5G allows service
providers to design network slices around
applications to deliver a unique enterprise and
consumer experience.
Video chatting is now done on the move
Executive Global OverviewThe Mobile Internet
Phenomena ReportMay 2021
4Copyright © 2021 Sandvine. All rights reserved. All other trademarks are property of their respective owners.
GLOBAL APPLICATION CATEGORY TRAFFIC SHARE
Rank Change Category Downstream Upstream
1 - Video Streaming 48.9% 19.4%
2 - Social Networking 19.3% 16.6%
3 2 Web 13.1% 23.1%
4 -1 Messaging 6.7% 20.4%
5 - Gaming 4.3% 1.9%
6 -2 Marketplace 4.1% 1.2%
7 2 File Sharing 1.3% 6.6%
8 -1 Cloud 1.1% 6.7%
9 -3 VPN and Security 0.9% 3.9%
10 - Audio 0.2% 0.2%
Global Mobile Application Traffic ShareThe Mobile Internet
Phenomena ReportMay 2021
5Copyright © 2021 Sandvine. All rights reserved. All other trademarks are property of their respective owners.
Holding steadyYouTube: YouTube maintains the number one
position on mobile networks despite the continued
rise of WiFi usage and alternative social network
video sources.
Facebook Video: Facebook Video meets the
consumer demand for short-form video as well as
serving as a way to keep us connected.
Facebook: Facebook continues to be the ‘go-to’
daily social network for billions of people. It has
become a powerful targeted advertising machine
and marketplace.
Moving upWhatsApp: WhatsApp continues to be the leading
mobile messaging platform worldwide. The fourth
Facebook property in the top 10, it has replaced
text messaging for over 1.5B users a month and is
strong in every region of the world.
TikTok: TikTok shows the largest rank change among
the top 10, moving up the charts and continuing
strong growth and engagement during 2020. TikTok
beat records for app downloads. In the first quarter
of 2020, the platform generated the most downloads
for any app ever with more than 315 million installs
globally across iTunes and Google Play.
Moving downInstagram: Instagram continues to grow in
importance in the social landscape, with video
being a central part of the value offering for users,
influencers, and advertisers. However, while its total
usage has increased, Instagram’s overall traffic share
has fallen as WhatsApp and TikTok take over.
Netflix: Netflix is decreasing in popularity on
mobile networks. Users have increasingly moved
to fixed networks to stream their favorite shows as
they spend more time in their homes working and
learning remotely.
What are the top 10 applications on mobile networks?It is no surprise that YouTube remains on the throne with its short-form videos dominating mobile
networks. YouTube, Facebook Video, and TikTok lead the way, driven by consumers who are less
likely to purchase a cable subscription or pay for over-the-top services.
Fresh and new content, from current events and new recipes to fitness programs, are valued at a premium.
YouTube remains the clear leader in this category.
GLOBAL APPLICATION TRAFFIC SHARE
Rank Change Category Downstream Upstream
1 - YouTube 20.4% 4.2%
2 - Facebook Video 11.3% 2.9%
3 7 TikTok 6.8% 2.7%
4 - Facebook 6.2% 2.3%
5 Google 5.4% 0.9%
6 -3 Instagram 5.1% 0.7%
7 iTunes 4.7% 0.5%
8 1 WhatsApp 1.8% 0.7%
9 -6 Netflix 1.8% 1.0%
10 -3 Google Play 1.6% 0.4%

Global Top MoversThe Mobile Internet
Phenomena ReportMay 2021
6Copyright © 2021 Sandvine. All rights reserved. All other trademarks are property of their respective owners.
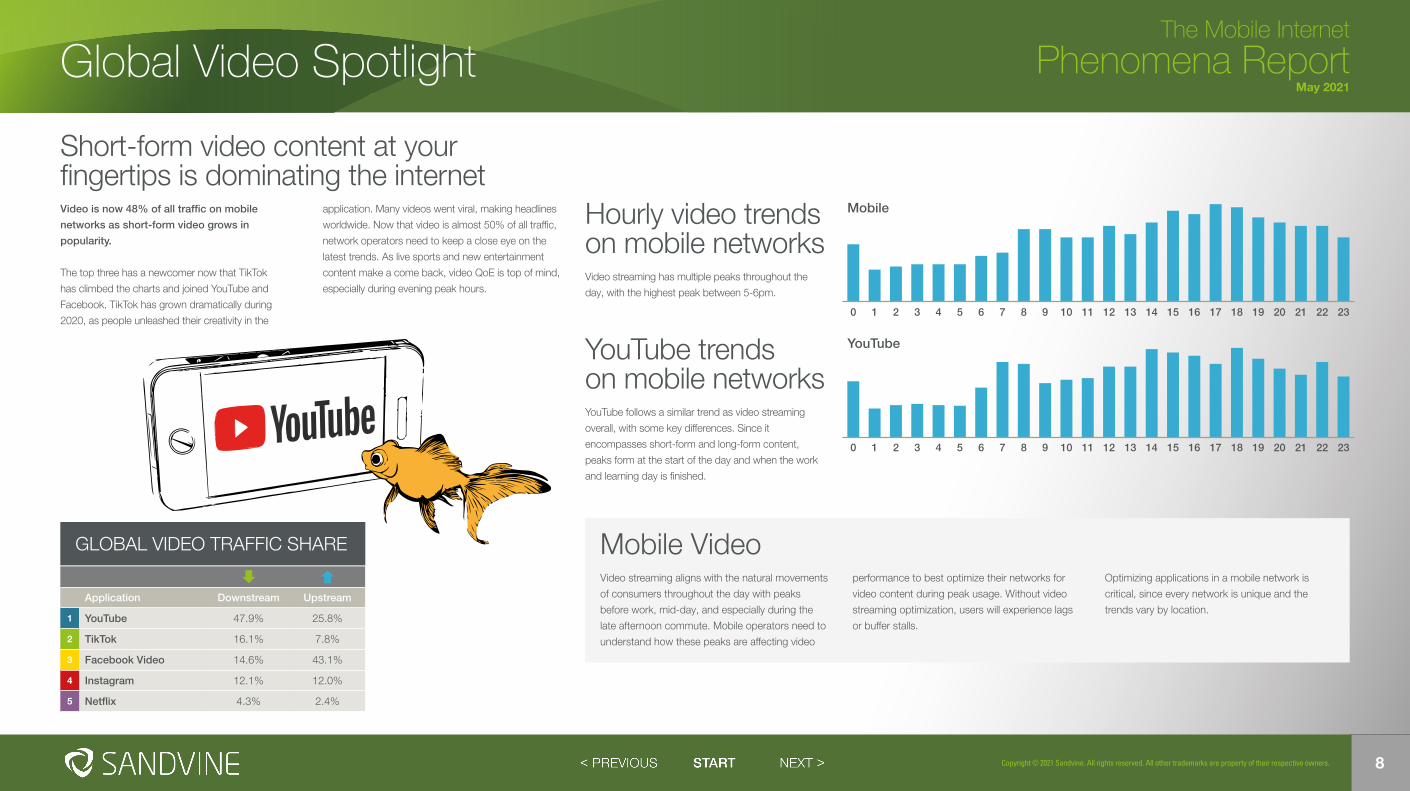
TikTok Global Ranking 3 (+7)Snapchat Global Ranking 36 (+5)TikTok is now a giant compared to Snapchat.
Box Global Ranking 328 (+82)Box, a content management and file sharing service for large enterprise businesses, has shown notable growth over the last year. As businesses move to the cloud, this is an application to watch.
Discord Global Ranking 19 (+42)Discord has been growing explosivelywith over 14 million active daily users. By partnering with Fortnite and Twitch, Discord is shaping up to be a place where hanging out is easy and fun.
Zoom Global Ranking 41
(+10)
Microsoft Teams Global Ranking 49
(+20)
Enterprises are relying heavily on applications that connect their workforces. Business-grade QoE is now critical to keep workers connected and able to conduct business on the go. The surge in taking meetings while walking is driving a rise in the use of business communication applications on mobile networks.

Global Video-First Economy in 2021 The Mobile Internet
Phenomena ReportMay 2021
7Copyright © 2021 Sandvine. All rights reserved. All other trademarks are property of their respective owners.
How have mobile networks been affected by
the transition to work-from-home? Business
video conferencing, on-line learning, and remote
productivity tools are becoming more prevalent
on mobile networks. These applications require
a consistent upstream and downstream network
connection.
As these video-first economy applications become
more popular on mobile networks, mobile operators
need to understand not just what applications are
dominating, but also the experience consumers
have with them. They also need to look to 5G Fixed
Wireless Access as a significant opportunity to meet
home network demands.
As regions re-open their economies, some morning
and evening commuting will resume as consumers
returning to their typical lifestyles. At the same time,
several consumers will continue working and learning
remotely on a more permanent basis. For this reason,
business and learning applications will continue to
grab a larger share of traffic on mobile networks
throughout the day.
Looking back at 2020 fixed networks The Mobile Internet Phenomena COVID-19 Spotlight Report issued in May 2020 highlighted the video-
first economy phenomena. Upstream video traffic surged 135% while downstream traffic grew 68%.
Fixed network growth has been
dominated by a video-first economy
with massive growth over the first
part of 2020. This represents a
significant opportunity for future 5G
fixed wireless acess networks.
Online GamingTwitch Downstream Traffic178% growthTwitch Upstream Traffic238% growth
Virtual Schooling
Google Classroom Downstream Traffic204% growthGoogle Classroom Upstream Traffic161% growth
Video StreamingOverall Downstream Traffic 66% growthOverall Upstream Traffic 67% growth
Video Conferencingand Telemedicine
Zoom Downstream Traffic 1940% growthZoom Upstream Traffic 1700% growth
Overall Downstream Traffic 390% growthOverall Upstream Traffic 233% growth
Overall Work-From-HomeApplication Traffic GrowthDownstream Growth 68%Upstream Growth 135%
What is a video-first economy?Network operators need to understand the
video-first economy to meet the needs of
consumer and enterprises networks.
As enterprises go digital, they are increasingly
delivering services over video rather than in-person.
Remote workers are also using video as their
primary way of communicating with customers,
partners, and peers. Large companies such as
Microsoft are making work-from-home permanent.
This will have a lasting effect on internet traffic.
Connected video is keeping schools, healthcare,
and businesses functioning by providing critical
links among teachers, students, patients, and
employees alike.
What applications define a video-first economy?
• Video conferencing
• Online learning, with connected video
• Remote work productivity tools, with
enriched communication
• Remote medical consultations
WhatsApp Global Ranking 8Line Global Ranking 28Zoom Global Ranking 41MS Teams Global Ranking 49Skype Global Ranking 54
Looking forward – what does this mean for the mobile network?
Global Video SpotlightThe Mobile Internet
Phenomena ReportMay 2021
8Copyright © 2021 Sandvine. All rights reserved. All other trademarks are property of their respective owners.
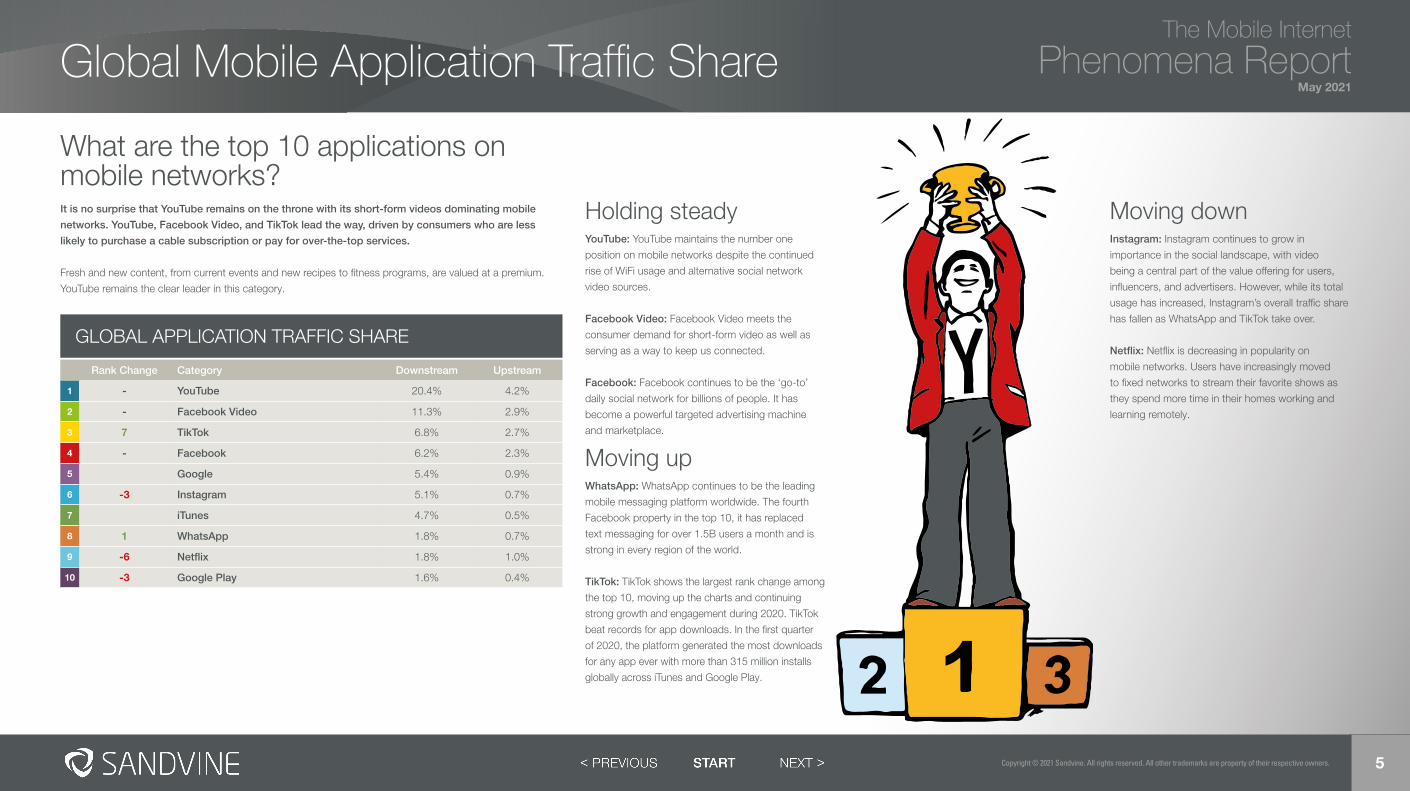
GLOBAL VIDEO TRAFFIC SHARE
Application Downstream Upstream
1 YouTube 47.9% 25.8%
2 TikTok 16.1% 7.8%
3 Facebook Video 14.6% 43.1%
4 Instagram 12.1% 12.0%
5 Netflix 4.3% 2.4%
Short-form video content at your fingertips is dominating the internetVideo is now 48% of all traffic on mobile
networks as short-form video grows in
popularity.
The top three has a newcomer now that TikTok
has climbed the charts and joined YouTube and
Facebook. TikTok has grown dramatically during
2020, as people unleashed their creativity in the
application. Many videos went viral, making headlines
worldwide. Now that video is almost 50% of all traffic,
network operators need to keep a close eye on the
latest trends. As live sports and new entertainment
content make a come back, video QoE is top of mind,
especially during evening peak hours.
YouTube trends on mobile networksYouTube follows a similar trend as video streaming
overall, with some key differences. Since it
encompasses short-form and long-form content,
peaks form at the start of the day and when the work
and learning day is finished.
0 21 4 8 12 16 206 10 14 18 225 9 13 17 213 7 11 15 19 23
YouTube
Hourly video trends on mobile networks Video streaming has multiple peaks throughout the
day, with the highest peak between 5-6pm.
0 21 4 8 12 16 206 10 14 18 225 9 13 17 213 7 11 15 19 23
Mobile
Mobile Video Video streaming aligns with the natural movements
of consumers throughout the day with peaks
before work, mid-day, and especially during the
late afternoon commute. Mobile operators need to
understand how these peaks are affecting video
performance to best optimize their networks for
video content during peak usage. Without video
streaming optimization, users will experience lags
or buffer stalls.
Optimizing applications in a mobile network is
critical, since every network is unique and the
trends vary by location.

Global Social SpotlightThe Mobile Internet
Phenomena ReportMay 2021
9Copyright © 2021 Sandvine. All rights reserved. All other trademarks are property of their respective owners.
Social applications are keeping us connected more than ever beforeSocial usage overall has grown in 2021 and
become more critical – with people looking to
stay on-line more than ever during the stay-at-
home orders.
Facebook continues to be the main way the world
keeps connected. Social networks have fallen into
a demographic cycle where Facebook is catering to
a more mature audience, Instagram appeals to the
millennials, and Twitter is all the rage for Gen Z.
Instagram, Facebook’s sibling, is #2 worldwide and is
becoming the marketing channel of choice for brands
going after younger audiences, who only want to see
relevant ads.
International social networks such as Odnoklassniki
and QQ, also dominate mobile networks and are in
the top five by traffic volume. This is a reminder that
local social networks have gained in popularity.
GLOBAL SOCIAL TRAFFIC SHARE
Application Downstream Upstream
1 Facebook 50.5% 75.0%
2 Instagram 41.9% 20.8%
3 Twitter 2.4% 1.6%
4 Odnoklassniki 1.9% 0.4%
5 QQ 0.7% 0.3%
Hourly social trends on mobile Social usage peaks after 3pm – 5pm on a mobile
network as consumers switch to off mode and catch
up with friends and family.
Hourly social trends on fixed In a typical fixed network, social usage is fairly
consistent throughout the day as people are working
from home, while keeping several of their social
applications going in the background.
0 21 4 8 12 16 206 10 14 18 225 9 13 17 213 7 11 15 19 23
Mobile
Mobile social Social application usage on a mobile network peaks
from 3pm – 6pm as consumers move from a typical
work or school day to catching up or chatting with
friends and family. Interestingly, in comparison
to fixed networks where consumers often leave
applications running in the background, users will
close and only intermittently interact with their social
applications which causes dynamic usage.
Understanding these trends is key to providing
a high quality of experience to consumers. With
enriched video options, memes, and the ability to
send video, these applications require operators
to be very aware of the services customers are
interested in using and design the network to meet
these needs.
0 21 4 8 12 16 206 10 14 18 225 9 13 17 213 7 11 15 19 23
Fixed
TikTok and SnapchatThe Mobile Internet
Phenomena ReportMay 2021
10Copyright © 2021 Sandvine. All rights reserved. All other trademarks are property of their respective owners.
TikTok isn’t just another fleeting trend – it’s here
to stay. For those unfamiliar with the platform,
TikTok is often referred to as “snapchat reboot.”
The two platforms share similar features.
However, TikTok’s offering centers on video
sharing of short clips set to music, while
Snapchat is a photo and video messaging
application where users can post ‘stories.’
Celebrities have been using TikTok creatively as a
means to keep in touch with their fans and this has
caused a massive surge in users and application
usage. TikTok beat records for app downloads, so
much so that in the first quarter of 2020 the platform
generated the most downloads for any app ever in
a quarter with more than 315 million installs globally
across the App Store and Google Play.
Snapchat punches above its weight with “only” ~
348M monthly users. However, those that do use it
are rabid consumers and creators of content, with the
app being used frequently for text, voice, and video
messages both to individuals as well as groups.
TikTok has peaks on usage at 1pm, 5pm, and at 7pm – as people consume short-form video.
0 21 4 8 12 16 206 10 14 18 225 9 13 17 213 7 11 15 19 23
TikTok
0
Snapchat has peaks at 5pm, aligning to the younger demographic pattern that uses its services.
21 4 8 12 16 206 10 14 18 225 9 13 17 213 7 11 15 19 23
Snapchat
36
3
Aug Oct DecSept Nov Jan45
Glo
bal
Ap
plic
atio
n Tr
affic
Sha
re R
ank
1
35
30
25
20
15
10
5
40
TikTok Snapchat

Global Messaging Spotlight
11
The Mobile Internet
Phenomena ReportMay 2021
Copyright © 2021 Sandvine. All rights reserved. All other trademarks are property of their respective owners.
Keeping us connected with enriched content – memes, voice, and reactions. WhatsApp continues to be the leading mobile
messaging platform worldwide. It has replaced
text messaging for over 1.5B users a month and
is strong in every region of the world. Snapchat,
Facebook, Line, and Skype come next in popularity
as consumers switch between messaging platforms
to stay connected with the world.
Messaging applications are a critical part of the
mobile experience. Memes, voice messages, and
reactions are continuing to enrich messaging content.
GLOBAL MESSAGING TRAFFIC SHARE
Application Downstream Upstream
1 WhatsApp 31.4% 9.0%
2 Snapchat 16.5% 2.7%
3 Facebook VoIP 14.3% 31.7%
4 LINE 12.1% 24.4%
5 Skype 4.1% 1.3%
Mobile messaging Messaging application usage peaks at 5pm as
consumers shift from a typical work or school day
to catching up and chatting with friends or family.
These applications require constant connectivity
and a high upstream quality of experience. In a
mobile network, as consumers move, hand-offs
and congestion management are critical for these
types of sensitive applications.
The availability of video messaging and other
enriched options is driving consumers to use the
mobile network like never before.
Hourly messaging trends on mobile Messaging applications peak at 5pm on a mobile
network as consumers switch to “off” mode and start
catching up with friends and family. This is similar to
social applications.0 21 4 8 12 16 206 10 14 18 225 9 13 17 213 7 11 15 19 23
Mobile
Zoom trends on mobile On a typical mobile network, Zoom usage peaks
mid-day as people take calls or join Zoom meetings
while grabbing lunch or taking their daily walks. The
usage of zoom follows a typical workday with busy
hour starting at 10am when the day gets underway,
peaking at 3pm, and then again at 5pm as the work
day ends.
Peaks in Zoom on mobile networks also aligns with
the peak hours for meetings. These peaks in mobile
networks could also be a result of a poor QoE on
fixed networks during peak times resulting in users
switching to mobile networks to have a better
connection. Another zoom peak occurs between
7pm and 8pm in the evening where it is used for
social and family events.
0 21 4 8 12 16 206 10 14 18 225 9 13 17 213 7 11 15 19 23
Zoom

A Day in the Life of a Mobile Network The Mobile Internet
Phenomena ReportMay 2021
12Copyright © 2021 Sandvine. All rights reserved. All other trademarks are property of their respective owners.
Mobile network service intelligenceMobile networks that deliver a great experience
to their customers have the best customer
satisfaction ratings, the least churn, and users are
often willing to pay a premium.
How do mobile operators ensure a differentiated,
high quality of experience in today’s ever changing
landscape of applications? Networks that deliver best
effort speeds and then advertise (without delivery) the
maximum download speed is a scenario that is likely
to disappoint the user.
Video: Video, especially short-form video like
YouTube, requires a good downstream throughput
to generally deliver an acceptable experience. Keep
the buffers on the device full, and the user won’t see
any momentary network congestion or delay. This
is particularly challenging to deal with during heavy
congestion events. How can operators ensure that all
subscribers are happy with their video experience?
Social Sharing: Isn’t this just social networking?
Actually no, because the big picture of social
networking includes much more than just Facebook
and Instagram traffic now. All of those pictures and
videos are uploaded directly into a cloud (iCloud,
Google Photo, Samsung Cloud, etc.), uploaded to
one or many social networks, and then discussed
(or shared again) over messaging networks. The
ecosystem is no longer just browsing Facebook feeds
and posting texts. It has become a rich upstream
traffic mix that users are monetizing. As a result, users
have become more sensitive to bad QoE and they will
churn if their expectations are not met.
Messaging: Messaging applications have created
a rich user experience – with more VoIP, video, and
chat possibilities than ever to keep in touch. Leading
the consumer into the video-first economy, these
applications are driving the upstream changes. In
particular, these applications need connectivity and
throughput on the upstream to keep connected as
every packet delivered counts in making sure the
connection goes through.
Sandvine Active Network Intelligence Portal
Mobile operators that understand services and how
they change over time will be able to deliver the best
services to their customers. This understanding
allows operators to:
• Know which applications matter to their
subscribers and at what time of day
• Assure subscriber quality of experience
• Create and evolve innovative services that delight
their subscribers

A Day in the Life of a Mobile Network The Mobile Internet
Phenomena ReportMay 2021
13Copyright © 2021 Sandvine. All rights reserved. All other trademarks are property of their respective owners.
Applications are the heart of the mobile network The best way to truly understand application
quality of experience is to take a deep dive into an
average day in a mobile network and understand
the evolution of services throughout the day.
Mobile Network Data Sample
The data presented is a summary analysis of multiple
North American mobile networks analyzed over the
month of January 2021 at hourly intervals.
Mobile network of today By looking at an average day in a mobile
network, we are going to sample different
time periods to understand how applications
and services change throughout the day. We
are mapping three distinct time periods –
the morning when the traffic picks up, the
afternoon with a peak at around 5pm, and the
evening when there is a change in application
usage.
Peak Times
Understanding peak times is vital to delivering a
great application quality of experience. It comes
as little surprise that mobile network traffic peaks
between 3pm and 6pm when work and school
are finishing up. However, different services peak
during different times of the day and it is vital for
network operators to understand what matters to
subscribers and when.
0
NIGHT MORNING AFTERNOON EVENING
21 4 8 12 16 206 10 14 18 225 9 13 17 213 7 11 15 19 23
A day in the life of your networkSandvine’s panel of network experts are ready to help you understand the applications that are driving a day in the life of your network.
Click here to learn more and speak with our experts.
Click here
A Day in the Life of a Mobile Network The Mobile Internet
Phenomena ReportMay 2021
14Copyright © 2021 Sandvine. All rights reserved. All other trademarks are property of their respective owners.
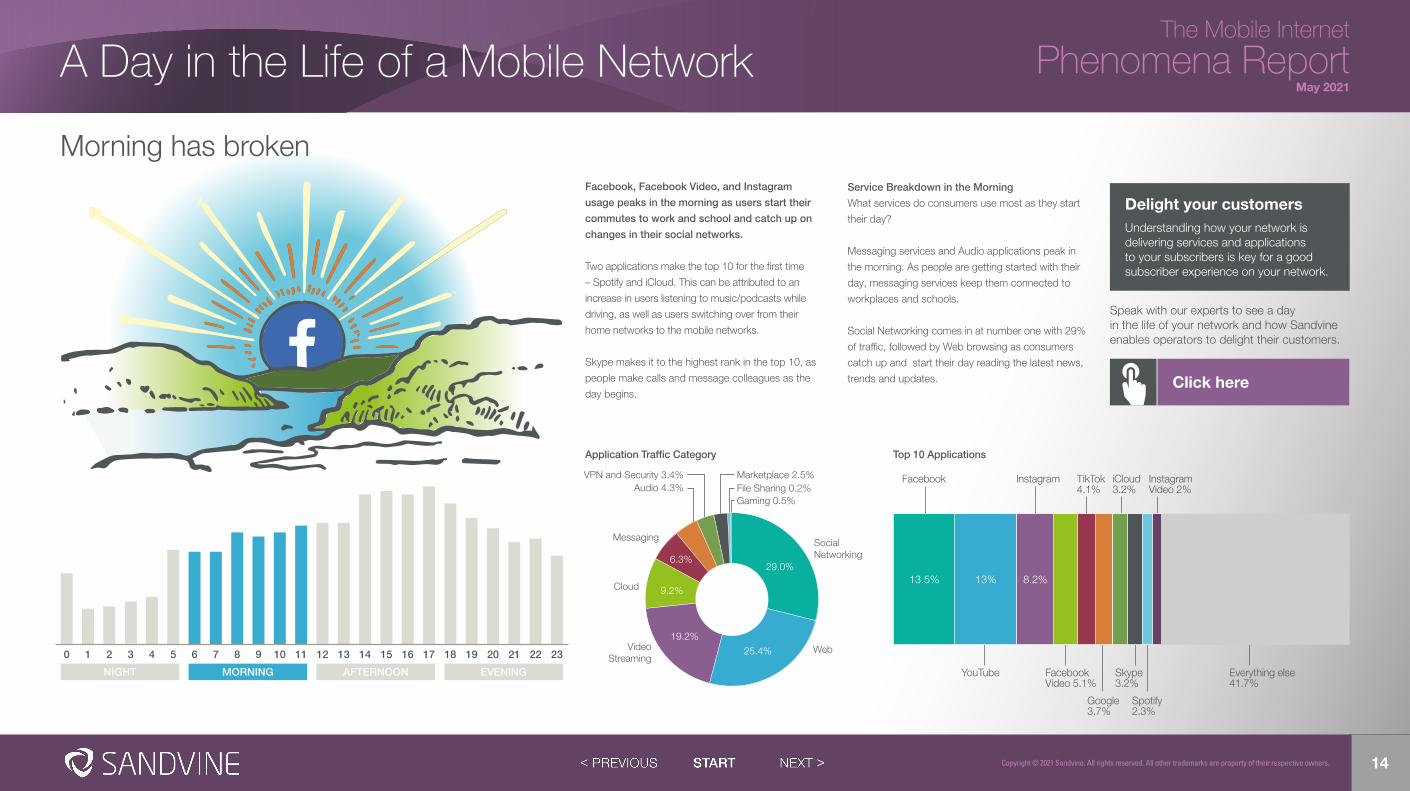
Facebook, Facebook Video, and Instagram
usage peaks in the morning as users start their
commutes to work and school and catch up on
changes in their social networks.
Two applications make the top 10 for the first time
– Spotify and iCloud. This can be attributed to an
increase in users listening to music/podcasts while
driving, as well as users switching over from their
home networks to the mobile networks.
Skype makes it to the highest rank in the top 10, as
people make calls and message colleagues as the
day begins.
Service Breakdown in the Morning
What services do consumers use most as they start
their day?
Messaging services and Audio applications peak in
the morning. As people are getting started with their
day, messaging services keep them connected to
workplaces and schools.
Social Networking comes in at number one with 29%
of traffic, followed by Web browsing as consumers
catch up and start their day reading the latest news,
trends and updates.
Morning has broken
0
NIGHT MORNING AFTERNOON EVENING
21 4 8 12 16 206 10 14 18 225 9 13 17 213 7 11 15 19 23
Application Traffic Category
File Sharing 0.2%Gaming 0.5%
Marketplace 2.5%VPN and Security 3.4%Audio 4.3%
Messaging
Cloud
SocialNetworking
VideoStreaming
Web
6.3%
9.2%
19.2%
25.4%
29.0%
Top 10 Applications
Facebook Instagram
YouTube FacebookVideo 5.1%
Skype 3.2%
Everything else 41.7%
Google 3.7%
Spotify 2.3%
TikTok4.1%
iCloud3.2%
Instagram Video 2%
13.5% 13% 8.2%
Delight your customersUnderstanding how your network is delivering services and applications to your subscribers is key for a good subscriber experience on your network.
Speak with our experts to see a day in the life of your network and how Sandvine enables operators to delight their customers.
Click here

A Day in the Life of a Mobile Network The Mobile Internet
Phenomena ReportMay 2021
15Copyright © 2021 Sandvine. All rights reserved. All other trademarks are property of their respective owners.
Afternoon delight YouTube takes over the number one spot in
the afternoon as people catch up with video
highlights and their favorite podcasts.
Netflix also makes an appearance in the top 10
as mobile consumers entertain themselves and as
students make their way home and catch up on the
latest shows.
Social networking dominates the top five, with people
glued to mobile screens to consume interesting,
ever-changing content.
Service Breakdown in the Afternoon
As the day progresses, consumers turn to mobile
networks for more Video Streaming services. These
service rise two places to take the number one spot
with a 10% increase in traffic since the morning. This
is an important trend for mobile operators to take into
account to provide a great quality of experience on
their network.
Social Networking is still the second most used
service. We see Web applications usage reducing
as consumers turn to other services for their
entertainment. Messaging applications take
over Cloud as the work day winds down.
0
NIGHT MORNING AFTERNOON EVENING
21 4 8 12 16 206 10 14 18 225 9 13 17 213 7 11 15 19 23
Application Traffic Category
File Sharing 0.3%Gaming 1.7%Marketplace 1.8%Audio 3.0%
VPN and Security 3.4%
5.6%
5.8%
22.8%
27.0%
28.6%VideoStreaming
SocialNetworking
Web
Messaging
Cloud
Top 10 Applications
YouTube Instagram
Facebook TikTok 4.9%
iCloud 2.5%
Everything else 41.3%
Google 3.7%
Spotify 2.5%
Facebook Video 4.5%
Netflix2.6%
Skype 2.3%
14% 13% 8.9%
Plan for the network of the futureBalancing capacity expansion and coverage extensions while maintaining the best possible application experience for your subscribers makes planning for the future difficult.
Speak with our experts to see a day in the life of your network and how Sandvine enables operators to plan for the network of the future.
Click here

A Day in the Life of a Mobile Network The Mobile Internet
Phenomena ReportMay 2021
16Copyright © 2021 Sandvine. All rights reserved. All other trademarks are property of their respective owners.
From dusk till dawnIn the evening, YouTube stays in the number one
spot with Netflix making its first appearance in
the top five. Consumers are looking for video-first
content as Facebook, Instagram, TikTok, and
Facebook Video round out the top 6.
As a reflection of the changing dynamics of how we
remain connected to the world with video, FaceTime
and Snapchat make it into the top 10. Social
Networking remains the second most used service,
with Web following closely behind. Messaging,
Cloud, and Audio round out the top five services
that are being used on the mobile network in the
evening hours.
Service Breakdown in the Evening
As the evening commute winds down, Video
Streaming services take over the network. The bulk of
the network is going towards entertainment video and
video-first application types as consumers are looking
to unwind after a busy day.
0
NIGHT MORNING AFTERNOON EVENING
21 4 8 12 16 206 10 14 18 225 9 13 17 213 7 11 15 19 23
Application Traffic Category
VideoStreaming
SocialNetworking
Gaming 1.3%Marketplace1.7%Audio 3.0%
Cloud
Messaging
Web
VPN and Security 3.3%
5.5%
5.7%
20.8%
26.0%
32.5%
Top 10 Applications
YouTube InstagramNetflix 5.1%
iTunes 2.7%
FaceTime 2.4%
15.9% 11.6% 7.6%
Facebook TikTok 6.7%
Google 2.5%
Everything else 38.7%
Facebook Video 4.8%
Snapchat 2.0%
Provide a world class customer experienceUnderstanding the overall customer experience is critical for service planning as well as customer engagement management.
Speak with our experts to see a day in the life of your network, and how Sandvine enables marketing teams to provide a world class customer experience.
Click here
5G InnovateThe Mobile Internet
Phenomena ReportMay 2021
17Copyright © 2021 Sandvine. All rights reserved. All other trademarks are property of their respective owners.
Are you ready?5G networks are expected to deliver up to 50x
more speed, 10x less in end-to-end latency, and
1,000x more capacity than 4G.
The era of 5G and the Internet of Things is upon us.
The time to act is now to ensure that 5G networks
have service innovation and intelligence at the core of
business decisions.
5G is transforming the communications landscape
as smart cities, smart vehicles, smart industries,
and smart homes change the way people engage,
transact, and share information. This places enormous
performance and traffic demands on both mobile
consumer and private enterprise networks and opens
up innovative service opportunities.
For consumers, it allows service providers to
go beyond charging for faster data to delivering
personalized services and engaging immersive
experiences such as augmented reality games and
entertainment, remote healthcare, and automated
home and vehicle services.
For enterprises, it enables real-time communications,
precision production lines and asset tracking, secure
smart city transportation, public safety and healthcare
applications, and enhanced financial and retail
experiences and transactions. Many of these services
will be enabled by connected machines and sensors.
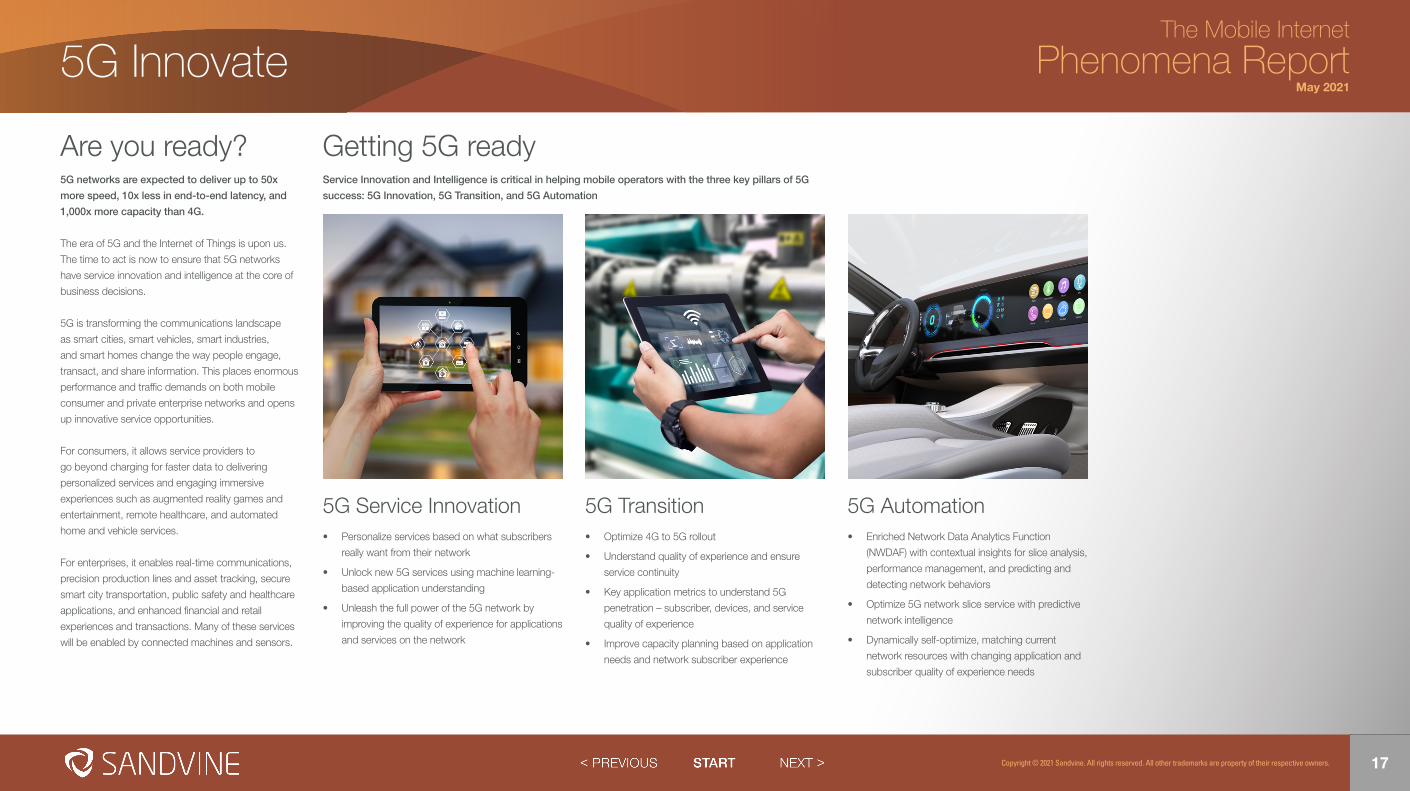
Getting 5G readyService Innovation and Intelligence is critical in helping mobile operators with the three key pillars of 5G
success: 5G Innovation, 5G Transition, and 5G Automation
5G Service Innovation• Personalize services based on what subscribers
really want from their network
• Unlock new 5G services using machine learning-
based application understanding
• Unleash the full power of the 5G network by
improving the quality of experience for applications
and services on the network
5G Transition• Optimize 4G to 5G rollout
• Understand quality of experience and ensure
service continuity
• Key application metrics to understand 5G
penetration – subscriber, devices, and service
quality of experience
• Improve capacity planning based on application
needs and network subscriber experience
5G Automation• Enriched Network Data Analytics Function
(NWDAF) with contextual insights for slice analysis,
performance management, and predicting and
detecting network behaviors
• Optimize 5G network slice service with predictive
network intelligence
• Dynamically self-optimize, matching current
network resources with changing application and
subscriber quality of experience needs
Understanding 5G servicesVideo is the #1 use case for immediate 5G
opportunities.
Video detection versus video streaming seems
simple enough. However, the needs of each service,
user expectations, and network traffic impacts vary
significantly.
About 75% of businesses use video monitoring today.
Service providers have an opportunity to transform
the landscape by offering bundles that add more
value. These bundles can focus on real-time detection
using sensors that monitor risk, recognize faces, and
highlight incidents.
How does this impact 5G networks? Network
operators need to create services that are valued by
the end user, understand the quality of experience,
and meet user needs.
Let’s take a deep dive into two popular smart home
applications for consumers – Nest and Ring – to
understand how each application/category has
specific QoE requirements on the 5G network of
the future.
5G InnovateThe Mobile Internet
Phenomena ReportMay 2021
18Copyright © 2021 Sandvine. All rights reserved. All other trademarks are property of their respective owners.
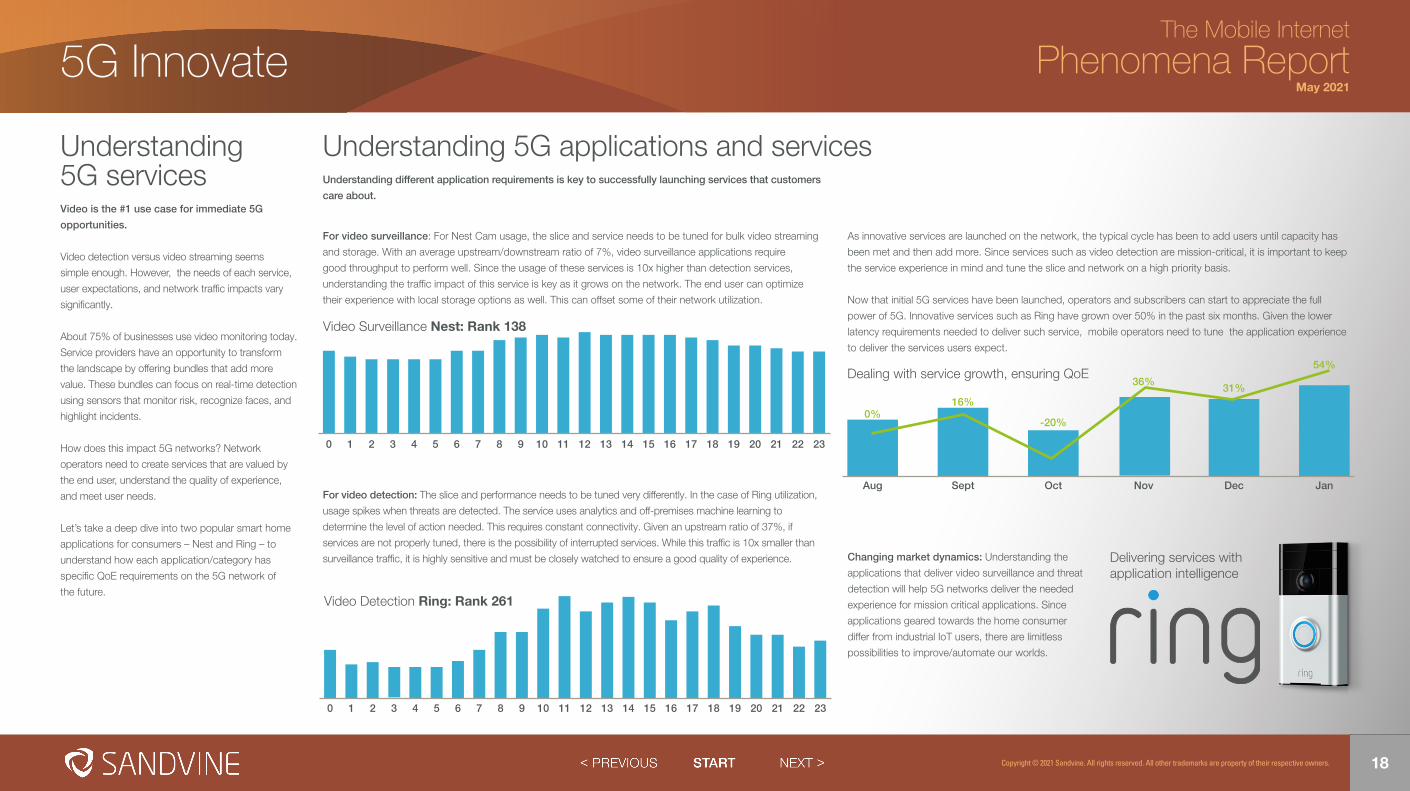
For video surveillance: For Nest Cam usage, the slice and service needs to be tuned for bulk video streaming
and storage. With an average upstream/downstream ratio of 7%, video surveillance applications require
good throughput to perform well. Since the usage of these services is 10x higher than detection services,
understanding the traffic impact of this service is key as it grows on the network. The end user can optimize
their experience with local storage options as well. This can offset some of their network utilization.
For video detection: The slice and performance needs to be tuned very differently. In the case of Ring utilization,
usage spikes when threats are detected. The service uses analytics and off-premises machine learning to
determine the level of action needed. This requires constant connectivity. Given an upstream ratio of 37%, if
services are not properly tuned, there is the possibility of interrupted services. While this traffic is 10x smaller than
surveillance traffic, it is highly sensitive and must be closely watched to ensure a good quality of experience.
As innovative services are launched on the network, the typical cycle has been to add users until capacity has
been met and then add more. Since services such as video detection are mission-critical, it is important to keep
the service experience in mind and tune the slice and network on a high priority basis.
Now that initial 5G services have been launched, operators and subscribers can start to appreciate the full
power of 5G. Innovative services such as Ring have grown over 50% in the past six months. Given the lower
latency requirements needed to deliver such service, mobile operators need to tune the application experience
to deliver the services users expect.
Changing market dynamics: Understanding the
applications that deliver video surveillance and threat
detection will help 5G networks deliver the needed
experience for mission critical applications. Since
applications geared towards the home consumer
differ from industrial IoT users, there are limitless
possibilities to improve/automate our worlds.
Understanding 5G applications and servicesUnderstanding different application requirements is key to successfully launching services that customers
care about.
0 21 4 8 12 16 206 10 14 18 225 9 13 17 213 7 11 15 19 23
Video Surveillance Nest: Rank 138
0 21 4 8 12 16 206 10 14 18 225 9 13 17 213 7 11 15 19 23
Video Detection Ring: Rank 261
Aug OctSept Dec JanNov
Dealing with service growth, ensuring QoE
0%-20%
16%31%
54%
36%
Delivering services with application intelligence

Contact us Phenomena RoadmapWant to know more about Sandvine?
NEXT STEPS WITH SANDVINE Now that you know what applications are driving internet consumer trends, plan for 2021 with Sandvine.
Reach out to [email protected] if you have any questions or to meet with our team of experts.
DO YOU HAVE REQUESTS FOR INSIGHTS?We love inbound requests for data from our customers, prospects, industry analysts, and press. Many of the topics we cover in the Phenomena Report cross boundaries from tech into entertainment, and we welcome inquiries where we can help give clarity to the market. If you have questions, please reach out to Sandvine at [email protected]
We will also blog regularly; if you missed some of our recent ones, check out the Phenomena Spotlights:https://www.sandvine.com/blog
WHERE TO NEXT? The plan for The Internet Phenomena Reports is to regain a regular cadence with two main reports each year, and several spotlight reports when the data speaks to us.
We have plans for a fixed network report later this year or early next year to break out the differences between the two network types.
If you are a Sandvine customer or prospect, please contact us for a detailed view of your region and access type. Our capability is unmatched in the industry for classifying traffic in your network and helping you via pre-packaged use cases with strong ROI or TCO.
SANDVINE’S API GATEWAYWant to make sure Sandvine has your application covered in our report? We have an API that you can use to keep us up-to-date:https://www.sandvine.com/api-gateway
ACTIVE NETWORK INTELLIGENCE (ANI)Visit www.sandvine.com to learn about our ANI solutions.
ACTIONABLE DATAHow can The Mobile Internet Phenomena data become actionable in your network? Check out our Use Case eBook to find out.https://www.sandvine.com/use-case-ebook
RESOURCESCome see our Resources page for a wide range of videos, webinars, and whitepapers:www.sandvine.com/resources
What’s next?The Mobile Internet
Phenomena ReportMay 2021
19Copyright © 2021 Sandvine. All rights reserved. All other trademarks are property of their respective owners.