THE MISSING PROFITS OF NATIONS NATIONAL BUREAU OF …
45
NBER WORKING PAPER SERIES THE MISSING PROFITS OF NATIONS Thomas R. Tørsløv Ludvig S. Wier Gabriel Zucman Working Paper 24701 http://www.nber.org/papers/w24701 NATIONAL BUREAU OF ECONOMIC RESEARCH 1050 Massachusetts Avenue Cambridge, MA 02138 June 2018 We thank the Danish Tax Administration for data access and numerous conversations. Zucman acknowledges financial support from the FRIPRO program of the Research Council of Norway. Tørsløv acknowledges financial support from the Danish Ministry of Taxation, who fully funded his current research. The authors retain sole responsibility for the views expressed in this research, which do not necessarily reflect the views of the National Bureau of Economic Research. NBER working papers are circulated for discussion and comment purposes. They have not been peer-reviewed or been subject to the review by the NBER Board of Directors that accompanies official NBER publications. © 2018 by Thomas R. Tørsløv, Ludvig S. Wier, and Gabriel Zucman. All rights reserved. Short sections of text, not to exceed two paragraphs, may be quoted without explicit permission provided that full credit, including © notice, is given to the source.
Transcript of THE MISSING PROFITS OF NATIONS NATIONAL BUREAU OF …
NBER WORKING PAPER SERIES
THE MISSING PROFITS OF NATIONS
Thomas R. TørsløvLudvig S. WierGabriel Zucman
Working Paper 24701http://www.nber.org/papers/w24701
NATIONAL BUREAU OF ECONOMIC RESEARCH1050 Massachusetts Avenue
Cambridge, MA 02138June 2018
We thank the Danish Tax Administration for data access and numerous conversations. Zucman acknowledges financial support from the FRIPRO program of the Research Council of Norway. Tørsløv acknowledges financial support from the Danish Ministry of Taxation, who fully funded his current research. The authors retain sole responsibility for the views expressed in this research, which do not necessarily reflect the views of the National Bureau of Economic Research.
NBER working papers are circulated for discussion and comment purposes. They have not been peer-reviewed or been subject to the review by the NBER Board of Directors that accompanies official NBER publications.
© 2018 by Thomas R. Tørsløv, Ludvig S. Wier, and Gabriel Zucman. All rights reserved. Short sections of text, not to exceed two paragraphs, may be quoted without explicit permission provided that full credit, including © notice, is given to the source.

The Missing Profits of NationsThomas R. Tørsløv, Ludvig S. Wier, and Gabriel ZucmanNBER Working Paper No. 24701June 2018JEL No. F23,H26,H87
ABSTRACT
By combining new macroeconomic statistics on the activities of multinational companies with the national accounts of tax havens and the world's other countries, we estimate that close to 40% of multinational profits are shifted to low-tax countries each year. Profit shifting is highest among U.S. multinationals; the tax revenue losses are highest for the European Union and developing countries. We show theoretically and empirically that in the current international tax system, tax authorities of high-tax countries do not have incentives to combat profit shifting to tax havens. They instead focus their enforcement effort on relocating profits booked in other high-tax countries—in effect stealing revenue from each other. This policy failure can explain the persistence of profit shifting to low-tax countries despite the high costs involved for high-tax countries. We provide a new cross-country database of GDP, corporate profits, trade balances, and factor shares corrected for profit shifting, showing that the global rise of the corporate capital share is significantly under-estimated.
Thomas R. TørsløvUniversity of Copenhagen,Øster Farimagsgade 5DK-1353 [email protected]
Ludvig S. WierUniversity of CopenhagenØster Farimagsgade 5DK-1353 [email protected]
Gabriel ZucmanDepartment of EconomicsUniversity of California, Berkeley530 Evans Hall, #3880Berkeley, CA 94720and [email protected]
An Appendix and Data is available at http://gabriel-zucman.eu/missingprofits/
1 Introduction
Perhaps the most striking development in tax policy throughout the world over the last few
decades has been the decline in corporate income tax rates. Between 1985 to 2018, the global
average statutory corporate tax rate has fallen by more than half, from 49% to 24%. In 2018,
most spectacularly, the United States cut its rate from 35% to 21%.
Why are corporate tax rates falling? The standard explanation is that globalization makes
countries compete harder for productive capital, pushing corporate tax rates down. By cutting
their rates and providing public services and infrastructure more e�ciently, countries can attract
more machines, plants, and equipment, which makes workers more productive and boosts their
wage. Global economic integration has made capital location more sensitive to di↵erences in
taxes and led to a more perfect competition between nations. This theory provides a consistent
explanation for the global decline in tax rates observed over the last twenty years and o↵ers
nuanced normative insights (see Keen and Konrad, 2013, for a survey of the large literature on
tax competition).
Our paper asks a simple question: is this view of globalization and of the striking tax policy
changes of the last years well founded empirically? Our simple answer is “no.” Machines don’t
move to low-tax places; paper profits do. By our estimates, close to 40% of multinational profits
are artificially shifted to tax havens in 2015. This tax avoidance and the failure to curb it are the
main reason why corporate tax rates are falling globally—not tax competition for productive
capital. The decline in corporate tax rate is the result of policies in high-tax countries—not a
necessary by-product of globalization. The redistributive consequences of this process are major,
and di↵erent than in the textbook model of tax competition. Instead of increasing capital stocks
in low-tax countries, boosting wages along the way, profit shifting merely reduces the taxes paid
by multinationals, which mostly benefits their shareholders, who tend to be wealthy.
It is apparent to many observers that the textbook model of tax competition doesn’t capture
the behavior of today’s largest multinational companies well. These firms don’t seem to move
much tangible capital to low-tax places—they don’t even have much tangible capital to start
with. Instead, they avoid taxes by shifting accounting profits. In 2016 for instance, Google
Alphabet made $19.2 billion in revenue in Bermuda, a small island in the Atlantic where it
barely employs any worker nor owns any tangible assets, and where the corporate tax rate is
zero percent.1 Contrary to the central postulate of the tax competition model, Bermuda does
1https://www.bloomberg.com/news/articles/2018-01-02/google-s-dutch-sandwich-shielded-16-billion-euros-from-tax.
1

not have much to gain from attracting paper profits that don’t improve wages for the population
and that it taxes at 0%. Despite this, the standard view of tax competition between nations
continues to permeate much of the discussion about tax policy. The most likely reason is that
we do not currently have comprehensive estimates of how much profits multinationals shift to
low-tax places. Nor do we have good explanations for why this form of tax avoidance, if its
costs for governments in high-tax countries really is substantial, persists. Our paper bridges
this gap by making two contributions, one empirical and one theoretical.
Our first—and most important—contribution is to produce new estimates of the size of
global profit shifting using the macroeconomic data of tax havens. To our knowledge, it is
the first time that tax haven macro data are used to estimate the amount of profits shifted to
low-tax places. An advantage of this approach is that it enables us to compute the amount
of profits shifted o↵shore in a direct and transparent way. Until recently, the data published
by tax havens were too limited to conduct this exercise meaningfully. But in recent years,
following data improvement e↵orts coordinated by, e.g., the OECD and the IMF, the statistical
institutes of most of the world’s developed countries—including the major tax havens—have
started releasing new international investment data known as foreign a�liates statistics. These
statistics record the amount of wages paid by a�liates of foreign multinational companies and
the profits these a�liates make. We draw on these statistics to create a new global database
recording the profits reported in each country by local vs. foreign corporations. This database
enables us to have the first comprehensive map of where profits are booked globally.
We stress at the outset that we are well aware of the deficiencies of existing international
investment data. The complex structures used by multinationals to organize their global ac-
tivity and minimize their tax bills raise considerable challenges for statistical authorities. But
these macro data are at present the most comprehensive that exist to study profit shifting—a
phenomenon that has become so important that we cannot wait for perfect data to study it, and
which has indeed been analyzed in the past by many authors using less comprehensive data than
we now have. In addition, we feel that the best way for scholars to contribute to future data
improvement is to use the existing international investment statistics in a systematic manner, so
as to better identify their limits and how these limits could be overcome. Our article, therefore,
can also be viewed as an attempt to assess the internal consistency of the macro data of all the
world’s countries, and to pinpoint the areas in which progress needs to be made.
In the first step of our empirical work, we construct and analyze a simple macro statistic:
the ratio of pre-tax corporate profits to wages. Thanks to the new foreign a�liates statistics
2

exploited in this paper, we can compute this ratio for foreign vs. local firms separately. Our
investigation reveals spectacular findings. In non-haven countries, foreign firms are systemati-
cally less profitable than local firms. In tax havens, by contrast, they are systematically more
profitable—and hugely so. While for local firms the ratio of taxable profits to wages is typically
around 30%–40%, for foreign firms in tax havens the ratio is an order of magnitude higher—
as much as 800% in Ireland. This corresponds to a capital share of corporate value-added of
80%–90% (vs. around 25% in local firms). To understand these high profits, we provide de-
compositions into real e↵ects (more productive capital used by foreign firms in tax havens) and
shifting e↵ects (above-normal returns to capital and receipts of interest). The results show that
the high profits-to-wage ratios of tax havens are essentially explained by shifting e↵ects. Over-
all, we find that close to 40% of multinational profits—defined as profits made by multinational
companies outside of the country where their parent is located—are shifted to tax havens in
2015.
In the second step of our empirical work, we use new bilateral balance of payments statistics
to trace the profits booked in tax havens to the countries where they have been made in the
first place—and would have been taxed in a world without profit shifting. This allows us to
provide the first comprehensive view of the cost of profit shifting for governments worldwide.
We find that governments of the European Union and developing countries are the prime losers
of this shifting. By our estimate, tax avoidance by multinationals reduces E.U. corporate tax
revenue by around 20%. When we look at where the firms that shift profits are headquartered,
we find that U.S. multinationals shift comparatively more profits than multinationals from other
countries.
Our second contribution is to explain why, despite the high revenue costs involved, high-tax
countries in Europe, developing countries, and the rest of the world have been unable to protect
their tax base. Our innovation is to focus on the incentives faced by tax authorities, which
had not been studied until now. We show theoretically that the fiscal authorities of high-tax
countries do not have incentives to combat shifting to tax havens, but instead to focus their
enforcement e↵ort on relocating profits booked by multinationals in other high-tax countries.
Chasing the profits booked in other high-tax places is feasible (the information exists), cheap
(there is little push-back from multinationals, since it does not a↵ect much their global tax bill),
and fast (a framework exists to settle disputes between high-tax countries quickly). This type
of enforcement crowds out enforcement on tax havens, which is hard (little data exists), costly
(as multinationals spend large resources to defend their shifting to low-tax locales), and lengthy
3
(due to a lack of cooperation between haven and non-haven countries).
We provide the first analysis of data on tax disputes between tax authorities. Our analysis
shows, consistent with the theory, that the vast majority of high-tax countries enforcement
e↵ort are directed at other high-tax countries. In e↵ect, non-haven countries steal revenue from
each other while letting tax havens flourish.
This policy failure is reinforced by the incentives of tax havens. Although some of them
like Bermuda have 0% corporate tax rates, most, like Ireland and Luxembourg, have low but
positive rates. By lightly taxing the large amount of profits they attract, they have been able
to generate more tax revenue, as a fraction of their national income, than the United States
and non-haven European countries that have much higher rates. The low revenue-maximizing
rate of tax havens can explain the rise of the supply of tax avoidance schemes documented in
the literature—such a favorable tax rulings granted to specific multinationals—and in turn the
rise of profit shifting since the 1980s. The incentives of tax havens, however, are not enough to
explain the persistence of this shifting—to understand it, one has to understand why high-tax
countries’ fiscal authorities have so far failed to curb it.
Our findings have implications for policy. First, they suggest that cutting corporate tax
rates, as the United States did at the end of 2017, is less likely to generate quick positive
e↵ects on wages than textbook economic models suggest. For wages to rise, productive capital
needs to increase, which can happen fast if capital flows from abroad, much less so if paper
profits—not productive capital—is what moves across countries. Second, profit shifting raises
new challenges for tax policy. It reduces the e↵ective rates paid by multinationals corporations
compared to what local firms pays. Whatever one’s view about the e�ciency cost of capital
taxes, this seems di�cult to justify—especially if part of the profits of multinationals derive form
rents, which standard models suggest should be taxed. Profit shifting reduces the taxes paid by
the wealthy—as ownership of these firms is highly concentrated—which might call for o↵setting
changes in individual income taxation, or changes in the way multinational companies are taxed
(such as the adoption of a formula apportionment system making profit shifting harder).
Our results also suggest that some of the current policy e↵orts aimed at reducing tax avoid-
ance by multinational corporations may in fact exacerbate it. The OECD has launched an
initiative to curb base erosion and profit shifting. Action 14 of this plan calls for more e↵ective
dispute resolution mechanisms (OECD, 2015). But the easier it is for, say, the French tax au-
thority to relocate profits booked in Germany, the less resources it will devote to chasing the
profits shifted to Bermuda—increasing shifting to low-tax locales and reducing corporate tax
4

revenue globally. A more e↵ective way for high-tax countries to curb profit shifting might be to
impose economic sanctions (such as trade tari↵s) to the jurisdictions that enable it. Our work
provides transparent, easy to compute metrics for policy makers to track how much profits tax
havens attract, how much they gain in tax revenue and other countries lose. These statistics,
which we will update regularly online, could be used to monitor the impact of the policies
implemented to reduce tax avoidance.
Last, our findings show that headline economic indicators, including GDP, corporate profits,
trade balances, and corporate labor and capital shares, are significantly distorted. The flip side
of the high profits recorded in tax havens is that output, net exports and profits recorded in
non-haven countries are too low. We provide a new database of corrected macro statistics for
all OECD countries and the largest emerging economies. Adding back the profits shifted out
of high-tax countries increases the corporate capital share significantly. By our estimates, the
rise in the European corporate capital share since the early 1990s is twice as large as recorded
in the national account data used, e.g., by Karabarbounis and Neiman (2014). This finding
has important implications for current debates about the changing nature of technology and
inequality. We provide concrete proposals to improve economic statistics and the monitoring of
global economic activity.
The rest of this paper proceeds as follows. In Section 2 we relate our work to the literature.
Section 3 outlines our conceptual framework and data. We present our estimate of the amount
of profit shifted to tax havens globally in Section 4, before decomposing this total by country
(which countries lose more? which multinationals shift more?) in Section 5. Section 6 analyzes
the incentives that tax authorities face and why high-tax countries have failed so far to curb
profit shifting. We present our corrected estimates of GDP, corporate profits, trade balances,
and factor shares in Section 7, and conclude in Section 8. There are numerous intricacies in the
financial activities of tax havens and the international statistics. The most important ones are
discussed in the article; others are detailed in a comprehensive Online Appendix that enable
the reader to reproduce all our estimates step by step starting from publicly available data. All
the data used in this research are available online too.2
2 Related Literature
Profit shifting by multinationals has attracted considerable attention among economists, policy
makers, and the public. Yet despite the interest for these questions, we do not have a compre-
2The Appendix and dataset are available online at http://gabriel-zucman.eu/missingprofits.
5
hensive view of how much profits are shifted globally. On the one hand, a large micro literature
studies this question using financial accounts micro data, but these data do not capture well the
subsidiaries of multinational companies in low-tax places—and therefore largely miss the profits
shifted to these havens. On the other hand, a nascent macro literature studies profit shifting
using macro data which are more comprehensive, but this literature has so far mostly focused
on data published by the United States—hence on shifting by U.S. multinationals. Our paper
pushes the literature forward by systematically exploiting a new source of data: the macroeco-
nomic statistics of tax havens. We start by relating our work to previous attempts to estimate
profit shifting. We highlight the main di↵erences between our work and previous studies, and
refer the reader to Appendix Section D for a detailed comparison of our results with earlier
estimates.
2.1 Microeconometric Estimates of Profit Shifting
A large body of work studies profit shifting using corporate financial and balance-sheet micro-
data, collected in the Orbis database of Bureau van Dijk.3 Profit shifting is estimated by running
regressions of the following form:
log(⇡ic) = ↵ + �(⌧p � ⌧c) + �Firmi + �Countryc + ✏ic (1)
where ⇡ic denotes the pre-tax profits booked by company i in country c, ⌧c the tax rate in country
c, ⌧p the tax rate in the company’s parent’s country, and Firmi and Countryc firms and country
controls. A positive � is interpreted as evidence of profit shifting, and the global amount of
profits shifted for tax reasons is extrapolated from the estimated �. The OECD (2015) uses this
methodology for its o�cial estimate of the size of base erasion and profit shifting (see Johansson
et al., 2016).4
One limitation of this procedure is that little data exists about the profits booked by multina-
tionals in low-tax countries. Orbis provides accurate information about the global consolidated
profits of most of the world’s multinationals (see, e.g., Cobham and Loretz, 2014). Multina-
tional companies, however, are generally not required to publish their profits country by country
3See Kalemli-Ozcan et al. (2015) for a presentation of these data.4The literature considers four measures for the incentives to shift profits: (1) the di↵erential with the tax rate
of the parent’s country (e.g., Dharmapala and Riedel, 2013); (2) the weighted tax rate di↵erential with all othersubsidiaries (e.g., Huizinga and Laeven, 2008); (3) the unweighted tax rate di↵erential with other subsidiaries(e.g., Johansson et al. 2016), and (4) the simple corporate tax rate (e.g., Lohse and Riedel, 2013). On a prioriground, it is unclear which of these measures is preferable. Heckemeyer and Overesch (2013) give an overviewof 26 studies using this approach; see also Wier (2018).
6

or subsidiary by subsidiary. Orbis relies on administrative information in public business reg-
istries (collected by Chambers of Commerce throughout the world) to record how much profits
multinationals make in their various subsidiaries. Because countries such as France maintain
comprehensive registries, almost all the profits made by French resident firms (including sub-
sidiaries of foreign multinationals) can be seen in Orbis. In 2010 for instance, the national
accounts of France report that French resident corporations made $240 billion in pre-tax profits
after net interest payments. In Orbis one finds a very close figure, $237 billion. But in many
of the world’s countries, including prominent corporate tax havens, public registries are much
more limited: they either do not exist (e.g., Bermuda), or when they do no income information
is available (e.g., United States, Ireland, Switzerland).5 As a result, much of the profits booked
by multinationals in these countries are not visible in Orbis. For instance, as shown by Figure
1, Orbis correctly reports that the worldwide consolidated profits of Apple were 55.3 billion
euros in 2016. But if one adds up all the profits recorded in Orbis by all of Apple’s subsidiaries
throughout the world, then one finds only 2.0 billion euros. None of the profits made by Apple
in the United States or in Ireland, Jersey, or similar tax havens—which are known to be used by
Apple6—are visible. Similarly large discrepancies are observed for Google Alphabet, Facebook,
and Nike.
And these firms are far from isolated cases. In Figure 2, we compare the true consolidated
global profits of each multinational in Orbis to the sum of its subsidiary-by-subsidiary profits.
In 2012, only 17% of the global profits of multinationals could be traced in Orbis—83% were
booked in subsidiaries unknown to Orbis, or for which no profits data was available. The
problem is particularly acute for low- and zero-tax countries.7
The limited reporting of data in tax havens, already noted in the literature (e.g., Dowd et
al., 2017), has two implications. First, it means that estimating equation 1 above with publicly
available financial accounts data is likely to deliver estimates of � that are downwards biased.
5In the Spring of 2017, the United Kingdom announced that it would mandate its overseas territories (e.g.,Bermuda, the British Virgin Islands, and the Cayman Islands) to develop public registries of the owners ofcompanies formed there by the end of 2020. This initiative doesn’t capture the Crown Dependencies (such asJersey, Guernsey and Isle of Man). It is unclear whether income or balance sheet information will be madeavailable in these registries.
6See for instance the detailed U.S. Senate (2014) investigation on Apple’s corporate tax structure; see also theanalysis of leaked documents from the “Paradise Papers” at https://www.nytimes.com/2017/11/06/world/apple-taxes-jersey.html.
7A number of papers study shifting by U.S. multinationals using data from the Bureau of Economic Analysison the activities of U.S. multinationals abroad (see, e.g., Desai et al., 2003, Clausing, 2009) and IRS data(e.g., Altshuler and Grubert, 2005; Grubert, 2013; Dowd, Landefeld and Moore, 2017, and De Simone, Millsand Stomberg, 2017). These data do not su↵er from the problems in Orbis, as U.S. multinationals have to(confidentially) report information on all their subsidiaries to the BEA and to the IRS. These data, however, canonly be used to study shifting by U.S. multinationals, while we are interested in shifting by all multinationals.
7

Multinational companies usually try to shift profits in a discreet manner (e.g., for public relation
reasons). In the extreme case where they only shift profits to subsidiaries that do not publish
income statements, then the estimated � in Orbis is zero, while in actual facts it is positive
and possibly large. This bias could explain the puzzling disconnect noted by Dharmapala
(2014) between the relatively small estimated profit shifting elasticities from recent research
and the “anecdotal evidence suggesting extensive income shifting among major multinational
corporations.” Second, estimating equation 1 with publicly available financial accounts data
can lead to biased inferences about the location of shifted profits. For instance, if only high-tax
countries have public registries, then one can find that all profit shifting takes place between
high-tax countries—whereas in actual facts this shifting may be second-order relative to the
shifting to zero-tax countries.8
The main contribution of our paper is to bring in direct evidence on the amount of profits
shifted o↵shore by analyzing the macro data published by tax havens. These data had not
been systematically used so far, probably because a number of important havens did not report
su�cient data and the statistics were hard to interpret. We leverage recent improvements: first,
and most importantly, a number of major tax havens now public foreign a�liates statistics
which provide direct information on the amount of profits made by foreign corporations. Second,
following the implementation of the 6th edition of the IMF Balance of Payments Manual (IMF,
2009), most tax havens now publish balance of payments statistics that capture royalty and other
service payments more accurately than in the past. Third, all tax havens from the European
Union now report harmonized, bilateral balance of payments statistics to the E.U. statistical
institute, Eurostat. These data allow us to directly estimate what fraction of global corporate
profits are shifted to places where taxes are low, and out of where the profits are being shifted.
The tax havens macro data we use in this paper are more comprehensive than the data
available in Orbis or similar databases, for one simple reason. While Orbis has to rely on
publicly available corporate registries, statistical authorities have access to a much broader
8Inferring the amount of profits shifted globally from financial accounts micro data (using variants of equation1 above) faces other limitations which have been noted in the literature. Most of the work in this area focuseson estimating the marginal e↵ects of tax di↵erentials on reported pre-tax profits. This raises a number of issues.First, as already noted, it is unclear which tax di↵erential matters to capture the incentives to shift profits.Second, it is unclear that marginal tax di↵erentials matter much in explaining the behavior of multinationalcompanies. The most prominent cases of profit shifting involve corner solutions where highly valuable intangibleassets are shifted once and for all, independently of any change in tax laws. Third, the standard approach (assummarized by equation 1 above) under-estimates profit shifting if all firms shift profits, with the ones that havea parent in a low-tax country simply shifting more. Last, this approach misses modern forms of profit shifting,where a firm is incorporated in a tax haven (say Luxembourg), and from there directly sells services (such asdigital subscriptions to music or movie databases) to foreign clients without any subsidiary abroad.
8
set of information to compile their cross-border investment, national accounts, and balance of
payments statistics—most importantly corporate income tax returns, censuses of the activities
of domestic and foreign corporations, and (private) income statements and balance sheets. As
a result, the macro flow of profits recorded in these macro data is much larger than the one in
Orbis. However, the macro data of tax havens are still imperfect and need to be corrected, as
we discuss below.
2.2 Macro Estimates of Profit Shifting
A nascent literature takes a macro perspective to study multinationals’ profit shifting. The
OECD (2015) itself, while it used Orbis for its o�cial BEPS estimate, also suggested that global
macro data be used to estimate profit shifting. Most of this literature uses U.S. statistics, hence
focuses on U.S. multinationals or foreign multinationals operating in the United States only
(Clausing, 2009, 2016; Zucman, 2014; Guvenen et al., 2018). In this paper, by contrast, we take
a global perspective and estimate profit shifting by all the world’s multinationals.
Two recent studies, UNCTAD (2015) and Crivelli et al. (2015), use global macro data to
study profit shifting and are the most closely related to our work. These studies, however, do
not base their estimates on the macro data of tax havens, but on the data reported by the
United States, European countries, and other non-haven countries.9 The tax haven macro data
we use in this paper allow us to overcome three limitations of these data. First, with macro
data from non-haven countries only, one cannot directly see how much tax multinationals avoid
by shifting profits, because one does not observe the taxes paid abroad by these firms. Second,
one cannot directly infer which countries lose revenue—that is, out of which countries profits
are being shifted. For instance, Zucman (2014, 2015) reports that more than half of the foreign
direct investment income of the United States comes from tax havens. This statistic reflects
the fact that U.S. multinationals make sizable profits in their subsidiaries in Ireland, Bermuda,
Luxembourg, and similar havens. However it does not reveal whether these profits have been
made in the United States, in Europe, or in developing countries.10 The tax havens data allow
9A number of papers in international finance (e.g., Lane and Milesi-Ferretti, 2018) also use tax haven macrodata. This literature attempts to characterize patterns in international investment, not to estimate the size ofprofit shifting as we do here.
10Clausing (2009) estimates how much of the profits shifted o↵shore by U.S. multinationals are shifted outof the United States by apportioning the o↵shore profits of U.S. firms proportionally to the amount of a�liateintra-firm transactions that occur with the United States. Our paper generalizes this approach by using balanceof payments data (which capture all transactions, not only transactions within divisions of U.S. multinationals)and focusing on the types of cross-border transaction that are particularly conducive of profit shifting; seeSection 3 below.
9

us to address this issue, because they show which countries pay interest, royalties, and service
payments to tax havens—i.e., out of where profits are being shifted. Third, as we show below,
the tax haven data better cover the service flows between havens and non-havens, which allows
us to obtain a better estimate of the amount of profits shifted out of high-tax places than
would be obtained using data of high-tax countries only. For instance, the services exported
by Luxembourg to the non-haven E.U. countries are more than twice larger when seen from
Luxembourg than from the non-haven E.U. countries.
2.3 Literature on Tax Competition
Our paper is also related to the large literature on international tax competition. While a large
body of work focuses on competition for productive investment, a number of studies consider
profit shifting, its interaction with competition for productive capital, the incentives of tax
havens, and the costs involved for non-haven countries.11 We make several contributions to
this literature. First, and most importantly, our paper is the first to highlight the incentives
of tax authorities, to show that these authorities do not combat shifting to tax havens but
instead try to relocate profits booked in other high-tax countries, and to explain why. This
insight can explain why tax avoidance by multinationals persists despite its revenue costs for
high-tax countries. Second, we are the first to quantify the benefits that tax havens derive by
supplying tax avoidance services to foreign multinationals. This computation could not be done
in a comprehensive manner previously due to the lack of macro estimates of the profits shifted
to these havens.
3 Conceptual Framework and Methodology
There are two main steps in our empirical analysis: first we estimate the amount of profits shifted
to tax havens; second we apportion these profits to the countries where they have been made in
the first place (or to the countries where tax-avoiding multinationals are headquartered). We
discuss each step in turn.
11See Desai et al. (2006); Slemrod and Wilson (2009); Hong and Smart (2010); Johannesen (2010); theapplication of the Kanbur and Keen (1993) model of commodity tax competition to profit shifting in Keen andKonrad (2013).
10

3.1 Macroeconomic Profitability Ratios
We base our estimate of the amount of profits shifted to tax havens on macro data on corporate
profits that we collected for all the world’s countries including tax havens. Our key statistic of
interest is the ratio ⇡ of pre-tax corporate profits to wages. A high ⇡ is indicative of inward profit
shifting, while a low ⇡ is indicative of outward profit shifting. We are interested in how this
statistic varies across countries, and how it varies within countries but across firms depending
on whether firms are foreign or not.
We define ⇡ at the country level as follows. Using standard notations, we denote by Y the
corporate output of a country, obtained by combining e↵ective labor AL and capital K. We
include in the corporate sector all resident corporations, both non-financial and financial. Part
of corporate output is paid to workers, and the rest, corporate profits, accrues to the owners
of capital: Y = F (K,AL) = rK + wL. The capital share of corporate output is ↵ = rK/Y
and the ratio of corporate profits to wages is ↵/(1 � ↵). Corporations pay p percent of their
profits rK in net interest. We define corporate profits as (1 � p) · rK. Our ratio of interest
⇡ measures how much taxable profits are generated by resident firms per dollar of wage paid:
⇡ = (1 � p) · ↵/(1 � ↵).12 We subtract net interest paid from corporations’ profits because
interest payments are typically deductible from the corporate tax base while interest received
(e.g., by banks) is typically taxable. At the country level, net interest paid by corporations is
generally small (interest paid by non-financial corporations is typically o↵set by interest received
by financial corporations), so ⇡ is usually close to ↵/(1�↵). As we shall see, the main exception
involves tax havens which receive net interest from foreign countries; for them ⇡ > ↵/(1�↵). We
also subtract depreciation from profits, because depreciation is deductible from taxable profits.
Thus Y , ↵, r, and ⇡ are all net of capital depreciation.
There are three forms of profit shifting, and each a↵ects the recorded profit-to-wage ratio ⇡.
First, multinational groups manipulate intra-group exports and import prices: subsidiaries in
high-tax countries export goods and services at low prices to related firms in low-tax countries,
and import from them at high prices.13 Such transfer price manipulations reduces ⇡ in high-tax
countries and increases it in tax havens. Second, multinationals shift profits using intra-group
interest payments: a�liates in high-tax countries borrow money (potentially at relatively high
12Our measure of wage always include non-wage employee compensation (such as retirement benefits, healthbenefits, payroll taxes, etc.). That is, “wage” in this article always refers to what is called “employee compen-sation” in the national accounts.
13There is extensive evidence of such transfer price manipulations in the literature; see, e.g., Clausing (2003);Bernard, Jensen and Schott (2006), Cristea and Nguyen (2016).
11
interest rates) from a�liates in low-tax countries, which again reduces ⇡ in high-tax countries
and increases it in tax havens.14 Last, multinationals locate intangibles—such as proprietary
trademarks, logos, and algorithms—in tax haven a�liates. These a�liates then receive royalties
which boost ⇡ and reduces taxable profits in non-havens countries.
In addition to the profits-to-wage ratio at the country level (⇡), we are also interested in
the profits-to-wage ratio for foreign corporations (⇡f ) and local firms (⇡l) within each country.
Following internationally-agreed guidelines, foreign firms include all firms where foreign investors
own more than 50% of shares with voting rights. However this condition is su�cient but not
necessary: there are some other ways firms can be foreign-controlled (see Eurostat, 2012, for a
detailed discussion). Local firms are all firms that are not foreign. A positive ⇡f � ⇡l gap is
indicative of inward profit shifting into foreign firms, while a negative ⇡f � ⇡l gap is indicative
of outward profit shifting by foreign firms.
We compute ⇡ in tax havens and non-haven countries using harmonized national accounts
data that follow the 2008 System of National Accounts (United Nations, 2009). We include in
our list of tax havens all the countries considered as havens by Hines and Rice (1993), as well
as Belgium and the Netherlands.15 The basic data source to compute ⇡ is the OECD’s detailed
national accounts by sector (Table 14A). This source covers the most prominent corporate tax
havens: Ireland, Luxembourg, Netherlands, Belgium, and Switzerland. For the other tax havens
(such as Singapore, Hong Kong, and Puerto Rico) we have gathered all the national account
data from each country’s own statistical authorities. When no national accounts were available
(which is the case for a number of Caribbean tax havens, most importantly Bermuda and
the Cayman Islands), we imputed data based on counterpart countries’ statistics, as described
in details in the Online Appendix Section A. We compute profitability for foreign vs. local
firms within each country using harmonized foreign a�liates (FATS) statistics. These data are
disseminated by Eurostat and the OECD. When no FATS data are available, we impute ⇡f and
⇡l by using balance of payments data and counterpart country statistics (see Online Appendix
Section A).
Table 1 presents summary statistics for global output and profits. In 2015, global gross
14For instance, Desai, Foley, and Hines (2016) show that U.S.-owned a�liates in low-tax countries use tradecredit to lend, whereas those in high-tax countries use trade credit to borrow.
15The Netherlands was not considered as a tax haven by Hines and Rice (1993) because U.S. multinationalsreported paying relatively high tax rates there in 1982; but as we show in Appendix Table A.11, this is not thecase anymore: the tax rate paid by a�liates of U.S. multinationals in the Netherlands was 12% in 2015. Belgiumis a borderline case that is sometimes considered a tax haven in the literature (e.g., because of the deductibilityof notional interest on equity). As shown in Figure 3 below, Belgium’s profitability ratio is only barely higherthan that of non-havens, and we estimate that only $13 billion were shifted to Belgium in 2015 (Table 2 below).Hence excluding Belgium from our list of tax havens would not make any significant di↵erence to our results.
12
value-added (i.e., global GDP) reached $75 trillion and global net value-added (i.e., after cap-
ital depreciation) about $63 trillion. About 54% of global net value-added was produced by
corporations; the rest was produced by governments, households, and non-corporate businesses.
Within corporations, the capital share of net value-added was about 1/3 and the labor share
about 2/3. Out of the $11.5 trillion in net-of-depreciation corporate profits, close to 15% ($1.7
trillion) were made in a�liates of foreign firms. This $1.7 trillion number includes all the profits
made by, say, Apple in France, Germany, Ireland, Jersey, etc., but not by Apple in the US
(where its headquarter is located). It is what we call “multinational profits.” That is, multi-
national profits include all the profits made by multinational companies outside of the country
where their parent is located. Out of these multinational profits, we estimate that more than
$600 billion, i.e., close to 40%, were shifted to tax havens.
3.2 Decomposition of Tax Havens Profits: Real Capital vs. Shifting
Conceptually, a high profits-to-wage ratio in tax havens can be due to two things: either there’s
a lot capital used in production (and the marginal return to capital is not too low), or profits
are being artificially shifted o↵shore. We are interested in identifying which fraction of the high
profits booked by multinationals in their tax haven a�liates are due to real capital vs. paper
profits moving to where taxes are low.
To do this, it is convenient to start by considering the simple case where all countries—havens
and non-havens—have the same aggregate Cobb-Douglas production function Y = K↵(AL)1�↵.
If net interest paid (p) is zero and ↵ = 25%, then all countries have a true ⇡ = 33% and any
deviation of the recorded ⇡ from this value reflects profit shifting. Specifically, countries with
recorded ⇡ above 33% attract paper profits from abroad (they have ⇡f > ⇡l = 33%), while
countries with recorded ⇡ below 33% shift profits abroad (they have ⇡f < ⇡l = 33%).
In the more general case where countries have a constant elasticity of substitution (CES)
production function, ⇡ varies with the capital stock depending on the value of the capital-labor
elasticity of substitution �. If � > 1, then countries with a high capital intensityK/AL have high
profit-to-wage ratios ⇡. Conversely, if � < 1, then countries with a low capital intensity have
low ⇡. To identify the contribution of capital intensity to profits-to-wage ratios, we decompose
⇡ into three components:
⇡ =K
wL· r · (1� p) (2)
Where r is the measured return to productive capital, including any abnormal return (above
13

the marginal product of capital) due to tax-induced profit shifting. We then make assumptions
about the value of the elasticity of substitution � to infer what fraction of the variation in ⇡ can
be attributed to di↵erences in capital intensities. A large micro literature finds � < 1, while a
nascent macro literature finds � > 1 (Karabarbounis and Neiman, 2014; Piketty and Zucman,
2014). As we shall see, our estimate of the amount of profits shifted to tax haven a�liates will
not depend on the assumed �, because it turns out that foreign corporations in tax havens have
similar capital intensity than those in high-tax countries. As a result, whatever assumption one
makes about �, di↵erences in capital intensity cannot explain more than a small fraction of the
high ⇡f of tax havens—almost all of it is due to artificial profit shifting.
3.3 How we Apportion the Shifted Profits
To apportion the shifted profits to the countries where they have been made in the first place,
we track the cross-border flows of tax havens as recorded in their balance of payments.
Profit shifting a↵ects the balance of payments of tax havens in two polar ways. First, it
inflates their trade surplus (because of intra-group transfer price manipulations) and the net
interest they receive (because of intra-group loans). Second, the profits accruing to the foreign
owners of a�liates where profits are shifted show up as high direct investment equity income
paid (dividends plus reinvested earnings). By following the bilateral trade and interest flows of
tax havens, one can identify the countries out of which profits are shifted. By following their
bilateral direct investment equity income payments, one can identify the countries where the
multinationals that shift profits are headquartered. We do so using the bilateral balances of
payments of tax havens that follow the 6th edition of the IMF (2009) Balance of Payments
Manual.16
More precisely, to identify the countries out of which profits are shifted, we follow the desti-
nation of tax havens’ service exports and intra-group interest payments.17 We disregard goods
exports, which are typically less conducive of profit shifting because reference prices are easily
16The data are particularly good for Switzerland and the European Union tax havens (Ireland, Luxembourg,Belgium, Netherlands, Malta, and Cyprus) which must report detailed statistics to Eurostat, the Europeanstatistical institute, complying with the latest international guidelines. When no bilateral flow data are available(as is the case for a number of non-E.U. tax havens), we impute data using counterpart country statistics, seeOnline Data Appendix Section B.
17This procedure is consistent with the way that profit shifting is perceived by U.S. policy makers: in December2017, the United States introduced a “base-erosion anti-avoidance tax” (BEAT) tax that presumes that servicestransactions by multinational firms with related parties are motivated by tax avoidance. An alternative approachwould involve trying to figure where production has “truly” taken place. However in many cases, it is impossibleto determine where production takes place (e.g., the creation of intangibles occurs through the cooperation andinteraction of subsidiaries in various countries). See Devereux and Vella (2017) for a discussion.
14

observable by tax authorities.18 Among services, we focus on exports of rights to use intel-
lectual property (patents and trademarks), headquarter services (administration, management
and advertising), information and communication technology services, and financial services,
which have been found in the literature to be most conducive of shifting (Hebous and Johan-
nesen, 2016). One advantage of using the service exports data reported by tax havens is that
they are more comprehensive than service imports data recorded by counterpart countries. As
shown in Appendix B, the service exports recorded by the 6 E.U. tax havens (Ireland, Luxem-
bourg, Netherlands, Belgium, Malta, Cyprus) to the 22 non-haven E.U. countries exceed the
recorded imports by more than 30% (and more than 50% for Luxembourg). One likely expla-
nation for this gap is that importers’ data miss (at least some of) the services that are exported
by tax-haven corporations directly to foreign customers, such as digital music subscriptions,
ride-sharing services, and various Internet services (server space, voice over IP, etc.).19 There is
evidence that the typical business structure of digital services multinationals involves shifting in-
tellectual property to tax haven subsidiaries and then directly selling services to final customers
without involving any non-haven subsidiary (see, e.g., Pomeroy, 2016). Using tax haven data
is critical to capture such profit shifting, which cannot be quantified by looking at intra-group
transactions as in the transfer pricing literature, since there is no intra-group transaction.
4 The Level and Rise of Global Profit Shifting
4.1 Above Normal Profitability in Tax Havens
We start the analysis by displaying in Figure 3 how the profit-to-wage ratio ⇡ varies across
countries. Among non-haven countries, ⇡ average 36% in 2015. That is, for any dollar of wage
paid, corporations made 36 cents in taxable profits. This ratio does not vary much across
developed, non-haven countries; for instance it is 31% in the United States, 39% in Sweden,
42% in the United Kingdom.20 By contrast, tax havens are abnormally profitable. In Singapore
18See Appendix Section D, where we discuss the evidence in the literature on the magnitude of profit shiftingthrough the mis-pricing of intra-firm goods trade vs. other channels.
19When a firm incorporated in Luxembourg directly exports digital services to French customers withoutgoing through a French subsidiary, French statistical authorities cannot rely on corporate income statementsto capture such flows, and have to use other—typically less comprehensive—data sources, such as householdconsumption surveys. Beginning 2014, value-added taxes have started to be imposed in France (and other E.U.countries) on direct foreign-business-to-consumer sales. In principle, VAT returns could be used as inputs tobetter estimate French imports of services. Looking forward, systematically using VAT returns could help fixthe imports-exports service mismatch between havens and non-havens countries.
20As reported in Appendix Table A.2., profitability ratios are higher in developing countries. This reflects thefact that the capital share of corporate output is typically higher in poorer countries, potentially due, e.g., tothe presence of rents generated by natural resources and to lower labor bargaining power (lower unionization
15

and Hong Kong, the macroeconomic profit-to-wage ratio exceeds 100%; in Ireland, Puerto Rico,
and Luxembourg, it exceeds 200%.
The true profitability ratios of tax havens are higher than recorded in their national ac-
counts, because the o�cial statistics miss some of the profits made by a�liates of multinational
companies. We know this because parents of multinational companies receive more profits from
their a�liates in tax havens (in the form of dividends and reinvested earnings) than what these
a�liates report paying to their parents. At the global level, more direct investment equity
income is received than paid.21 This gap reaches about $200 billion in 2015. In Appendix B,
we decompose it in a comprehensive way by leveraging the bilateral direct investment income
data of all the world’s countries. We find that the bulk of it comes from missing payments by
a�liates located in Ireland, Luxembourg, Netherlands, and Caribbean tax havens. In Figure 3
we correct for this problem by adding the missing profits paid by tax havens a�liates to U.S.
and E.U. parents. That is, we add the discrepancy between direct investment equity income
received by the United States and non-haven E.U. countries from Ireland, the Netherlands,
Luxembourg, etc., and the income that these havens record paying to the United States and
European Union countries. Most of the discrepancy comes from missing payments to the United
States. The United States has the world’s most sophisticated system for recording the activities
of its multinationals abroad, based on exhaustive census-like surveys conducted every five years
since 1950, and quasi-exhaustive, detailed surveys conducted annually since 1982 (see Appendix
Section A.1). Therefore the U.S. data are likely to be more accurate than those reported by
tax havens, which are likely in particular to miss some of the profits made by special purpose
entities (due to a lack of comprehensive enough corporate registries, non-response to surveys, or
other data issues; see, e.g., Angulo and Hierro, 2017; Damgaard and Elkjaer, 2017; and our dis-
cussion and supplementary results in Appendix A). By construction, our correction ensures that
at the global level, parents receive as much profits from their subsidiaries as what subsidiaries
pay to their parents (i.e., global net direct investment income adds up to zero). Note that it is
possible that some parents themselves under-estimate the income that accrues to them in their
o↵shore subsidiaries—in which case we would under-estimate the amount of profits booked in
rates, low or no minimum wages).21By contrast, for portfolio and other investment income—i.e., cross-border capital income other than pay-
ments within divisions of multinational companies—the opposite gap exists in the data: more income is paidthan received. As shown in Zucman (2013), this can be explained by the fact that dividends and interest earnedby households on their o↵shore bank accounts are duly recorded by the paying country but not by the payee. Forinstance if a French household has a bank account in Switzerland and owns U.S. equities on her Swiss account,the dividends paid by the U.S. are duly recorded in the U.S. balance of payments, but neither Switzerland norFrance records any dividend receipt. Alstadsæter et al. (2018) provide estimates of o↵shore household wealthby country.
16

tax havens. We discuss alternative corrections in Appendix A.
The high profitability of tax havens is driven by foreign corporations. It does not owe to
structurally higher capital shares in places where taxes are low (which could in principle be
the case if low-tax countries also have pro-capital and anti-labor institutions, such as bans on
unions, no or low minimum wages, etc.). In fact, as shown by Figures 4 and 5, the local firms
of tax havens are generally as profitable as the local firms of non-haven countries. Foreign
corporations, on the other hand, have extremely high profitability ratios in tax havens, e.g.,
800% in Ireland. This corresponds to a capital share of corporate value-added of 80%-90% (vs.
around 25%–30% in local firms). By contrast, and strikingly, in almost all non-haven countries
foreign firms are less profitable than local firms. Thus, there is a clear trace in global macro
data of shifting from high- to low-tax a�liates, in such a way that profitability is systematically
over-stated in tax havens and under-stated elsewhere.
The profitability of haven firms has surged since the 1980s. As shown in the top panel
of Figure 6, in Ireland—the tax haven for which the longest and highest quality time series
exist—⇡ was around 25–30% in the early 1970s, a level similar to that recorded in the United
States. Profitability started rising in the 1980s and then increased sharply in the mid-1990s. In
2015, the profits-to-wage ratios recorded by Ireland increased particularly strongly. That year,
recorded real GDP grew 26.3%—largely reflecting transfers of multinational intangible assets
to the island (see e.g., OECD, 2016). By contrast, in non-haven countries ⇡ never dramatically
varies. It has tended to increase since the 1980s, driven by the rise in the capital share of
corporate value-added, but this increase pales in comparison to the upsurge in the profitability
of tax havens’ corporations.
In the bottom panel of Figure 6, we can see that the rise in the profitability of tax havens
over time is not specific to Ireland. When we look at all the majority-owned a�liates of U.S.
multinationals throughout the world, a similar pattern emerges. In the early 1970s, the haven
and non-haven a�liates of U.S. multinationals were as profitable, with a ⇡ ratio around 50%.
Since then, profitability for haven a�liates has sharply increased: for them ⇡ exceeds 350%
today, while it has stayed constant for non-haven a�liates.
4.2 Decomposing The High Profits of Haven A�liates
Why are the tax haven a�liates of foreign multinationals so profitable? The available data
suggest that their high profits essentially stem from high rates of returns on assets—not high
capital intensities. We show this by focusing on the majority-owned a�liates of U.S. multina-
17
tionals in tax havens, for which the data is particularly good. Crucially, the outward FATS of
the United States include information on the stock of capital used by foreign a�liates of U.S.
multinationals, in contrast to the outward FATS of other countries and the inward FATS of tax
havens, which currently don’t.
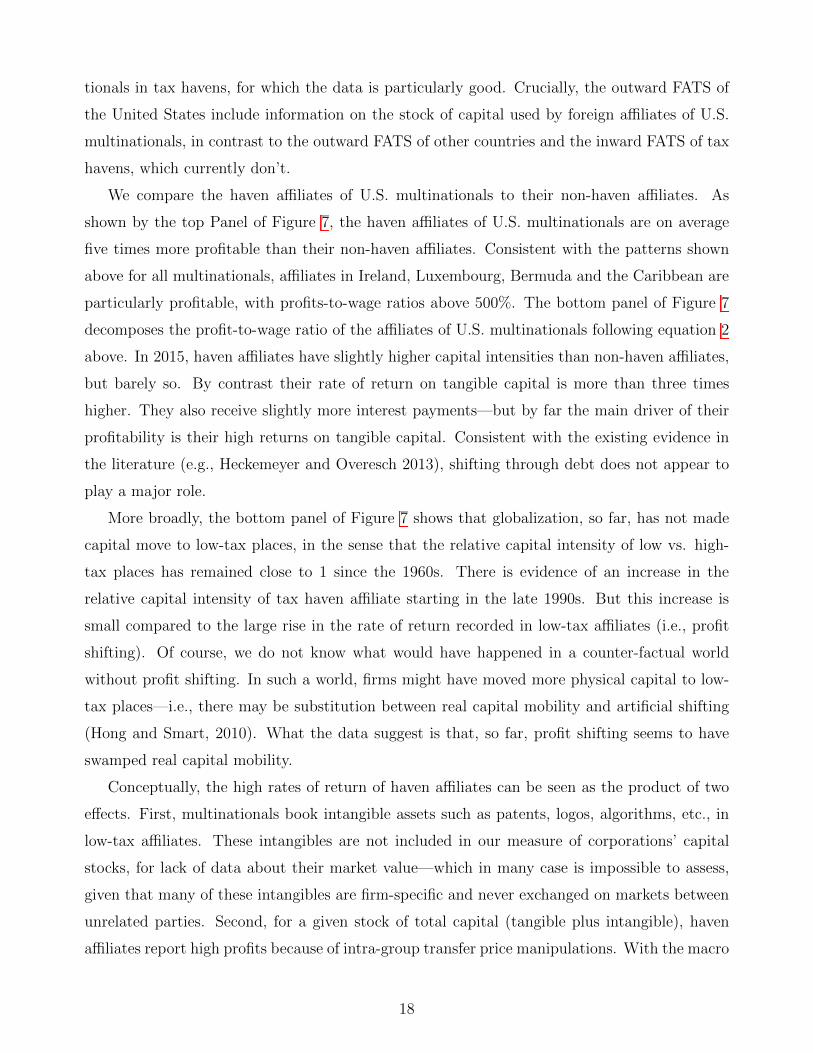
We compare the haven a�liates of U.S. multinationals to their non-haven a�liates. As
shown by the top Panel of Figure 7, the haven a�liates of U.S. multinationals are on average
five times more profitable than their non-haven a�liates. Consistent with the patterns shown
above for all multinationals, a�liates in Ireland, Luxembourg, Bermuda and the Caribbean are
particularly profitable, with profits-to-wage ratios above 500%. The bottom panel of Figure 7
decomposes the profit-to-wage ratio of the a�liates of U.S. multinationals following equation 2
above. In 2015, haven a�liates have slightly higher capital intensities than non-haven a�liates,
but barely so. By contrast their rate of return on tangible capital is more than three times
higher. They also receive slightly more interest payments—but by far the main driver of their
profitability is their high returns on tangible capital. Consistent with the existing evidence in
the literature (e.g., Heckemeyer and Overesch 2013), shifting through debt does not appear to
play a major role.
More broadly, the bottom panel of Figure 7 shows that globalization, so far, has not made
capital move to low-tax places, in the sense that the relative capital intensity of low vs. high-
tax places has remained close to 1 since the 1960s. There is evidence of an increase in the
relative capital intensity of tax haven a�liate starting in the late 1990s. But this increase is
small compared to the large rise in the rate of return recorded in low-tax a�liates (i.e., profit
shifting). Of course, we do not know what would have happened in a counter-factual world
without profit shifting. In such a world, firms might have moved more physical capital to low-
tax places—i.e., there may be substitution between real capital mobility and artificial shifting
(Hong and Smart, 2010). What the data suggest is that, so far, profit shifting seems to have
swamped real capital mobility.
Conceptually, the high rates of return of haven a�liates can be seen as the product of two
e↵ects. First, multinationals book intangible assets such as patents, logos, algorithms, etc., in
low-tax a�liates. These intangibles are not included in our measure of corporations’ capital
stocks, for lack of data about their market value—which in many case is impossible to assess,
given that many of these intangibles are firm-specific and never exchanged on markets between
unrelated parties. Second, for a given stock of total capital (tangible plus intangible), haven
a�liates report high profits because of intra-group transfer price manipulations. With the macro
18

data at our disposal, we cannot separate the role of intangibles vs. intra-group transfer prices
in explaining the high rates of returns recorded by haven a�liates. However, this distinction is
not relevant for our purposes: both of these techniques e↵ectively shift profits out of high-tax
places without any tangible assets moving across borders.
Another indication that the high ⇡f of tax havens is due to artificial shifting, not tangible
capital moving to low-tax places, is that haven a�liates are systematically more profitable within
sector, including in service industries that barely use tangible capital at all. We illustrate this in
the Appendix with the case of U.S. a�liates. The haven a�liates of U.S. multinationals are an
order of magnitude more profitable than non-haven a�liates in the same sector. Profit shifting
is not limited to just a few sectors of the economy, such as information and communication
technology (where intangible capital plays a large role): it is an across-the-board phenomenon.
To form our benchmark estimate of the amount of profits shifted to tax havens, we set
⇡f equal to ⇡l within each tax haven. That is, we assume that absent profit shifting, foreign
corporations would be as profitable as local firms. We have conducted extensive robustness
checks, presented in Appendix Section A, and found only second-order e↵ects on our results.22
We present our estimate of the amount of profits shifted in each tax haven in the bottom panel
of Table 2. In total, more than $600 billion in profits were shifted to tax havens in 2015, which
is close to 40% of multinational profits. By our estimates, Ireland is the number one shifting
destination, accounting for more than $100 billion alone. Singapore, the Netherlands, Caribbean
tax havens, and Switzerland come next. Due to the complex structures used by multinational
companies, allocating the shifted profits to specific jurisdictions involves a margin of error (for
instance, the frontier between Ireland and Bermuda is not always clear). This uncertainty,
however, does not a↵ect our estimate of the global amount of profits shifted o↵shore.
5 Decompositions of the Shifted Profits
5.1 Sales vs. Residence Allocation
The top panel of Figure 8 presents our estimate of where the shifted profits come from. The
pink bar allocates the roughly $600bn in excess profits in tax havens across source countries
proportionally to the bilateral intra-group interest received by tax havens and their bilateral
exports of risky services (i.e., services conducive of profit shifting, such as exports of intellectual
22For instance, we let ⇡f and ⇡l di↵er for non-shifting reasons by computing capital intensity in the foreignvs. local sector, and considering that both sectors have the same CES production but with an elasticity ofsubstitutions between capital and labor � di↵erent than one. Because in practice foreign corporations in taxhavens are not particularly capital intensive, the impact on our results is negligible.
19

property). As described in Appendix C, we find that the amount of intra-group interest received
and risky services exported by tax havens (above and beyond what could be expected given the
size of their economies) totals about $600bn. That is, it matches our independent estimate of the
amount of profits shifted in tax havens (based on setting ⇡f = ⇡l in tax havens). This consistency
of findings obtained using completely di↵erent data and methodologies lends support to the view
that $600bn is indeed the correct order of magnitude for the amount of profits shifted to tax
havens globally. We find that about 35% of the shifted profits come from E.U. (non-haven)
countries, close to 30% from developing countries, and about 25% from the United States.
We also allocate the profits shifted to tax havens to the countries where the ultimate owners
of the tax haven subsidiaries are located (blue bar in the top panel of Figure 8). To do so, we
draw on the bilateral direct investment statistics on an ultimate ownership basis compiled by
Damgaard and Elkjaer (2017), who exploit the data recently made available by OECD countries
following the implementation of the 6th edition of the IMF (2009) Balance of Payments Manual
(see Appendix Section C.2 for a detailed discussion). Multinationals from all countries shift
profits, but we find that U.S. multinationals are the main “shifters”: about half of all the
shifted profits ultimately accrue to U.S. parents, while about 30% accrue to E.U. parents. As
explained in Wright and Zucman (2018), the higher shifting intensity of U.S. multinationals can
be explained by the specific provisions contained in the U.S. tax code before 2018 and by U.S.
policies adopted in the mid-1990s that facilitated shifting from foreign high-tax countries to tax
havens (what is known as check-the-box regulations).
In the bottom panel of Figure 8, we compute the losses of corporate income tax revenue
implied by our estimate of where the shifted profits come from. That is, we assume that intra-
group interest payments to tax havens and imports of risky services from tax havens reduce the
tax base in non-haven countries, and we compute how much revenue would be collected absent
these flows, everything else equal. By our estimate, corporate tax avoidance by multinationals
reduces the corporate tax revenue of the European Union by around 20%. For the world as a
whole, the tax revenue loss is around 10%.
The top two panels of Table 2 provide country-by-country estimates of the amount of shifted
profits and of the tax revenue loss involved for governments worldwide. The revenue loss varies
significantly among countries. One of the reasons is that the share of corporate profits that
come from multinational corporations varies, as some economies are more open than others.
In Japan and some of the largest developing countries (e.g., China), a high share of profits
originate from local firms; this tends to limit the amount of shifted profits. Moreover, the size
20
of the revenue losses is correlated with the corporate income tax rate: within the European
Union, higher tax countries (such as France and Italy) experience higher losses than lower tax
countries (such as Eastern European countries). This correlation is consistent with the notion
that higher corporate tax rates give more incentives to shift.
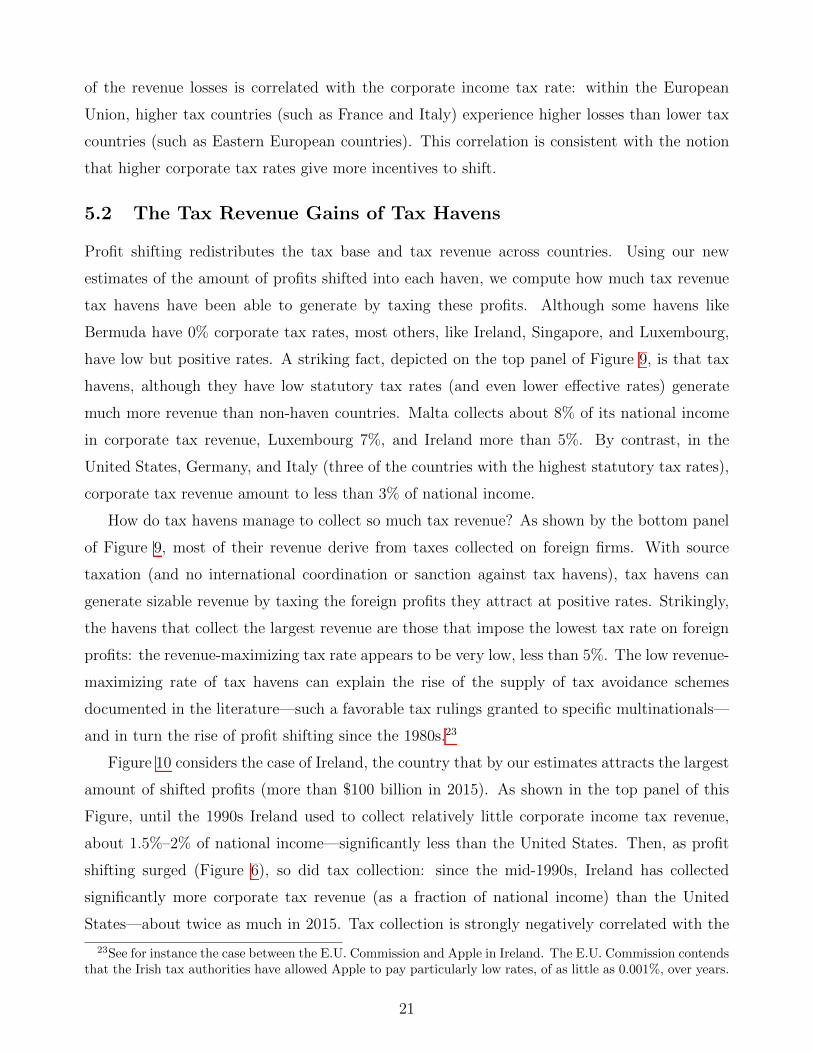
5.2 The Tax Revenue Gains of Tax Havens
Profit shifting redistributes the tax base and tax revenue across countries. Using our new
estimates of the amount of profits shifted into each haven, we compute how much tax revenue
tax havens have been able to generate by taxing these profits. Although some havens like
Bermuda have 0% corporate tax rates, most others, like Ireland, Singapore, and Luxembourg,
have low but positive rates. A striking fact, depicted on the top panel of Figure 9, is that tax
havens, although they have low statutory tax rates (and even lower e↵ective rates) generate
much more revenue than non-haven countries. Malta collects about 8% of its national income
in corporate tax revenue, Luxembourg 7%, and Ireland more than 5%. By contrast, in the
United States, Germany, and Italy (three of the countries with the highest statutory tax rates),
corporate tax revenue amount to less than 3% of national income.
How do tax havens manage to collect so much tax revenue? As shown by the bottom panel
of Figure 9, most of their revenue derive from taxes collected on foreign firms. With source
taxation (and no international coordination or sanction against tax havens), tax havens can
generate sizable revenue by taxing the foreign profits they attract at positive rates. Strikingly,
the havens that collect the largest revenue are those that impose the lowest tax rate on foreign
profits: the revenue-maximizing tax rate appears to be very low, less than 5%. The low revenue-
maximizing rate of tax havens can explain the rise of the supply of tax avoidance schemes
documented in the literature—such a favorable tax rulings granted to specific multinationals—
and in turn the rise of profit shifting since the 1980s.23
Figure 10 considers the case of Ireland, the country that by our estimates attracts the largest
amount of shifted profits (more than $100 billion in 2015). As shown in the top panel of this
Figure, until the 1990s Ireland used to collect relatively little corporate income tax revenue,
about 1.5%–2% of national income—significantly less than the United States. Then, as profit
shifting surged (Figure 6), so did tax collection: since the mid-1990s, Ireland has collected
significantly more corporate tax revenue (as a fraction of national income) than the United
States—about twice as much in 2015. Tax collection is strongly negatively correlated with the
23See for instance the case between the E.U. Commission and Apple in Ireland. The E.U. Commission contendsthat the Irish tax authorities have allowed Apple to pay particularly low rates, of as little as 0.001%, over years.
21

statutory corporate tax rate (bottom panel of Figure 10): when the tax rate was high (around
50% until the late 1980s), tax collection was low; since the rate was cut to 12.5% in the 1990s,
tax collection has been high. Whenever they choose non-zero rates—even rates e↵ectively quite
close to zero—tax havens derive clear benefits from attracting paper profits. However, although
tax havens do collect revenue, profit shifting significantly reduces corporate income tax payments
globally: for each $1 paid in tax to a haven, close to 5$ are avoided in high-tax countries. More
than redistributing tax bases across countries, profit shifting redistributes income to the benefit
of the shareholders of multinational companies. Because equity ownership is concentrated, these
shareholders tend to be wealthy, hence profit shifting tends, everything else equal, to increase
inequality. This stands in contrast with tax competition for real capital which has ambiguous
e↵ects on inequality, as it can increase wages.
6 The Incentives of Tax Authorities
Why is a high fraction of multinationals’ profits shifted to tax havens? The incentives of tax
havens can explain the rise of shifting since the 1980s, but they are not enough to explain
why, despite the high revenue costs involved, this profit has persisted since then. Why haven’t
non-haven countries been able to defend their tax base? To understand why profit shifting has
persisted so far, one has to understand how tax authorities throughout the world—in partic-
ular in Europe, the region where revenue losses are the highest—attempt to enforce taxes on
multinational companies and the incentives they face.
6.1 Transfer Price Correction and Mutual Agreement Procedures
To ensure profits are taxed where they have been made (i.e., the prevailing internationally-
agreed rules), tax authorities in high-tax countries routinely audit large companies. They check
that intra-group transactions are conducted at arm’s length (i.e., as if the subsidiaries of a given
multinational group were independent entities). When they find it is not the case, they can
attempt to ask multinationals to correct their transfer prices, which results in a relocation of
taxable income across countries.
In the current international tax system, tax authorities have incentives to relocate profits
booked in other high-tax countries—not profits shifted to havens. Take the case of France. e1 re-
located to France is worth the same to France whether it comes from Germany or from Bermuda.
But it is easier for the French tax authority to relocate e1 booked in Germany, for three reasons.
First, it is feasible, because information exists on the profits booked in Germany (from Orbis),
22

while no or little information typically exists on the profits booked in Bermuda.24 Second,
it is more likely to succeed, because firms are unlikely to spend much resources opposing this
transfer price correction: for them, whether profits are booked in France or Germany makes little
di↵erence to their global tax bill, since the tax rates in France and Germany are similar. Third,
if there is a dispute between France and Germany, it is likely to be settled relatively quickly
through the dispute resolution agreements in force among OECD countries and E.U. countries.25
The correction of transfer prices involving transactions between France and Germany crowds out
the correction of transfer prices involving transactions between France and low-tax countries.
Such corrections are harder to make (less data exist on the profits booked in tax havens), more
costly (as firms spend legal resources to defend their transfer pricing optimization), and take
more time (due to a lack of cooperation with some tax havens). In Section E.2 of the Online
Appendix, we formalize this argument and make precise the conditions under which it is optimal
for high-tax countries to focus their enforcement resources on relocating profits booked in other
high-tax countries.
6.2 Patterns in International Tax Enforcement
This theory is supported by the available data. Our analysis of the enforcement activities of tax
authorities globally shows that most transfer price corrections are between high-tax countries.
These corrections typically do not increase the taxes paid by multinationals, but merely re-
shu✏e tax payments across high-tax places.
In 2014, the audit firm EY conducted a transfer price authority survey in which they asked
26 major economies which countries were the main focus of their transfer price correction e↵orts.
As shown by the top panel of Figure 11, throughout the world, countries most often targeted
in transfer price disputes are high-tax countries. The United States comes first, followed by
Germany, and Japan. Among tax havens, only Switzerland and the Netherlands show up as
24In recent years, governments have sought to get access to more information by asking multinational firms toreport country-by-country breakdowns of their profits. We discuss below how more information a↵ects enforce-ment.
25OECD countries have created dispute settlement mechanisms making it easy for a tax authority in countryA to relocate profits that it considers have been mistakenly booked in country B. In the European Union, a strictsystem—known as the Arbitrage Convention—is in place to ensure that disputes among two E.U. countries aresettled within two years. If the tax authorities do not come to terms in that time frame, an external panel isbrought in to settle the case. The procedure works as follows. After a tax authority has decided on a transferprice correction nationally, the firm may ask the tax authority to enter into a Mutual Agreement Procedure withthe countries suspected of having excessive taxable income. The tax authority that increased its own tax basewill then approach the country that it perceives as the one having to reduce its tax base. Bluntly put, the taxauthority conducting the transfer price correction will ask a foreign government to pay for this. For an economicanalysis of mutual agreement procedures, see Becker and Davies (2014).
23

being sometimes targeted. Ireland (which according to our estimates is the number one shifting
destination in 2015) is never among the top 3 targets.
Furthermore, as shown by the bottom panel of Figure 11, in the European Union 90 percent
of all mutual agreement procedures are between two high-tax countries. Cases involving tax
havens (Ireland, Luxembourg, Netherlands, Belgium, Cyprus, Malta) are rare. One caveat
here is that firms might not care to initiate a mutual agreement procedure with a tax haven
if they are not paying any tax in that haven. We would thus like to see the composition of
the transfer price correction initiated by the tax authority (and not only the distribution of
mutual agreement procedure cases). Such data is not available at the EU level, but we have
been granted granted access to such statistics in Denmark. As reported in the Appendix, the
vast majority of transfer price corrections initiated by the Danish tax authorities involve other
high tax countries. As Denmark has a moderate corporate tax rate (22% in 2015), this finding
implies that the majority of transfer price corrections initiated by Denmark involve countries
with higher rates—hence, if successful, ultimately lower the taxes paid by the targeted firms.
Could more information lead tax authorities to focus more of their resources on curbing
shifting to low-tax places? Our analysis suggests that more information is in itself not enough
to address the enforcement problem uncovered in this paper. Even if the tax authorities had
access to perfect information on the amount of profits booked by each firm in each country,
multinational companies would still have incentives to fight tax authorities (e.g., by spending
substantial legal resources) when these authorities attempt to relocate profits booked in low-tax
places. Internalizing this, tax authorities would still have incentives to try to chase the profits
booked in high-tax places instead (see Appendix E.2 for a formal discussion). Better information
is necessary to address the enforcement issues discussed in this paper, but not su�cient. The
enforcement problem is inherent to the way governments currently tax multinational companies
(i.e., inherent to the use of transfer prices to allocate taxable income across countries). It
would, however, disappear if governments taxed the consolidated profits of multinationals and
used an apportionment formula to allocate profits across countries (similar to the way U.S.
States tax U.S. profits). In such a system, intra-group exports, imports, and interest payments
are irrelevant, hence profit shifting as it currently exists is not possible.
7 Macro Statistics Corrected for Profit Shifting
The flip side of the high profits recorded in tax havens is that profits recorded in non-haven
countries are too low. In both cases, core macroeconomic statistics are distorted. In the coun-
24

tries where shifted profits are booked (i.e., tax havens), GDP, corporate profits, the capital
share of corporate value-added, and trade balances are over-estimated. In non-haven countries,
by contrast, these indicators are under-estimated. In this section, we present macroeconomic
statistics corrected for the e↵ect of profit shifting for all OECD countries, all tax havens, and
the main emerging economies. All our estimates are available online in Appendix Tables C.5
and C.5b; in this section we focus on discussing the methodology and main results.26
Not all forms of profit shifting a↵ect the data in the same way. The manipulation of intra-
group transfer prices and the o↵shoring of intangibles a↵ect GDP, corporate operating surplus,
factor shares, and trade balance. But profit shifting through the use of intra-group interest
payments does not. According to our estimates, about 1/7 of the profits globally shifted to tax
havens are shifted via interest payments (intra-group interest received by tax havens are about
1/7 the size of the exports of services most conducive of profit shifting recorded by tax havens).
Our corrected macroeconomic statistics take this fact into account.
Table 3 presents our estimates of capital shares and trade balances corrected for profit
shifting. A number of results are worth noting. First, accounting for profit shifting significantly
increases the capital share of corporate value-added in non-haven countries.27 Consistent with
our earlier results that showed that European countries are particularly a↵ected, we find that
the capital share is under-estimated by about 2% to 2.5% points in the main E.U. countries
(Germany, United Kingdom, France, Italy), which is more than in the United States (1.1 point).
Because there was almost no profit shifting before the 1980s (see, e.g., Figure 6) the higher level
of the capital share implies a higher rise in the capital share over the last few decades. By our
estimates, the rise in the European corporate capital share since the early 1990s is twice as large
as recorded in the national account data used, e.g., by Karabarbounis and Neiman (2014).
Profit shifting also has significant e↵ect on trade balances. For instance, after accounting for
profit shifting, Japan, the U.K., France, and Greece turn out to have trade surpluses in 2015,
in contrast to the published data that record trade deficits. According to our estimates, the
26Bruner, Rassier, and Ruhl (2018) present US macroeconomic statistics corrected for profit shifting anddiscuss how the e↵ect of profit shifting cascades through the economic accounts; see also Avdjiev et al. (2018).Compared to these studies, our contribution is to o↵er a set of correction for all countries (not only the UnitedStates), and in such a way that global accounts balance (i.e., that the global direct investment income balanceadds up to zero). Our results for the United States are broadly consistent with the results of Bruner, Rassier,and Ruhl (2018) who find that accounting for profit shifting increases U.S. GDP by 1.5 percent.
27Note that it does not necessarily increase the capital share of national income, as the profits of the o↵shoresubsidiaries that belong to domestic shareholders enter national income in the form of direct investment incomereceived from the rest of the world. We focus here on correcting domestic corporate value-added, corporateoperating surplus, and corporate factor shares (which are the factor shares used in most of the literature on thedecline of the labor share, e.g., Karabarbounis and Neiman, 2014).
25
true trade deficit of the United States was 2.1% of GDP in 2015, instead of 2.8% in the o�cial
statistics—that is, a quarter of the recorded trade deficit of the United States is an illusion of
multinational corporate tax avoidance.28
8 Conclusion
What have we learned from this paper? In our view the main finding is that there is nothing
natural in the decline of corporate income tax rates. Profit shifting, more than tax competition
for productive capital, is the key driver of this decline. It is not a necessary by-product of
globalization and technological change, but the result of policies—in particular tax enforcement
issues—in high-tax countries. Globalization does not imply that corporate income tax rates are
bound to fall.
Tax avoidance by multinationals is quantitatively significant: by our estimates, close to
40% of multinational profits are shifted to tax havens in 2015. This shifting rose and persists
because it increases tax revenue (not wages) in tax havens, and because the incentives of high-tax
countries’ fiscal authorities, quite counter-intuitively, prevent them from curbing it.
We stress that our estimates of the amount of profits shifted by multinationals globally is
conservative. Our investigation has uncovered important statistical gaps that limit our ability
to monitor global economic activity and constrain tax enforcement. Statistical improvements
are necessary. To solve the asymmetries in bilateral foreign a�liates and direct investment
statistics (in particular between the United States and European tax havens), national statistical
authorities need to be authorized to exchange micro-data. The foreign a�liates statistics that
we exploited in this paper need to be compiled by more countries and expanded to include
more information, such as interest payments, corporate income taxes paid, and capital stocks
(as the United States already does). A number of Caribbean tax havens do not currently
publish comprehensive enough national account (for instance, they set profits to zero in the
o↵shore sector). Last and maybe most importantly, many countries—including the United
States and a number of tax havens—could improve their public corporate registries so that
all firms are included and profit information is made publicly available at the subsidiary level.
Altogether, these improvements would significantly improve our ability to study globalization
and its distributional e↵ects.
28See Sandholtz (2018) for an estimation based on U.S. bilateral trade data.

References
Alstadsæter, Annette, Niels Johannesen, and Gabriel Zucman. 2018. “Who Owns theWealth in Tax Havens? Macro Evidence and Implications for Global Inequality”. Journal of
Public Economics, forthcoming.Altshuler, Rosanne and Grubert, Harry. 2005. “The Three Parties in the Race to the Bot-tom: Host Governments, Home Governments and Multinational Companies”. CESifo WorkingPaper Series No. 1613Angulo, Emma and Alicia Hierro. 2014. “Asymmetries in the Coordinated Direct Invest-ment Survey: What Lies Behind?”. IMF working paper.Avdjiev Stefan, Mary Everett, Philip R. Lane, and Hyun Song Shin. 2018. “Trackingthe international footprints of global firms”, BIS Quarterly Review, March, p. 47-66.Becker, Johannes and Ronald B. Davies. 2014. “A Negotiation-Based Model of Tax-Induced Transfer Pricing”. CESifo working paper #4892.Bernard, Andrew B., J. Bradford Jensen, and Peter K. Schott. 2006. “TransferPricing by U.S. Based Multinational Firms”. NBER working paper #12493.Bruner, Jennifer, Dylan G. Rassier, and Kim J. Ruhl. 2018. “Multinational ProfitShifting and Measures throughout Economic Accounts”, working paper.Clausing, Kimberly A. 2009. “Multinational firm tax avoidance and tax policy”. National
Tax Journal, 62 (4): 703–725.Clausing, Kimberly A. 2011. “The revenue e↵ects of multinational firm income shifting.”Tax Notes, p.1580–1586.Clausing, Kimberly A. 2015. “The E↵ect of Profit Shifting on the Corporate Tax Base inthe United States and Beyond”, working paper.Cobham, Alex and Simon Loretz. 2014. “International Distribution of the Corporate TaxBase: Implications of Di↵erent Apportionment Factors under Unitary Taxation.” ICTD workingpaper #27.Cristea, Anca D. and Daniel X. Nguyen. 2016. “Transfer Pricing by Multinational Firms:New Evidence from Foreign Firm Ownerships.” American Economic Journal: Economic Policy,
8(3): 170–202.Damgaard Jannick, and Thomas Elkjaer. 2017. “The Global FDI Network: Searching forUltimate Investors”, working paper, Danmarks Nationalbank.De Simone, Lisa, Lillian F. Mills, and Bridget Stomberg. 2017. “Using IRS Data toIdentify Income Shifting to Foreign A�liates.” Working paper.Desai, Mihir A., C. Fritz Foley, and James R. Hines Jr.. 2003. “Chains of Ownership,Regional Tax Competition, and Foreign Direct Investment.” in Herrmann, Heinz and RobertLipsey (eds.) Foreign Direct Investment in the Real and Financial Sector of Industrial Countries.
Springer Verlag: Heidelberg.Desai, Mihir A., C. Fritz Foley, and James R. Hines Jr.. 2006. “The Demand for TaxHaven Operations.” Journal of Public Economics, 90: 513–531Desai, Mihir A., C. Fritz Foley, and James R. Hines Jr. 2016. “Trade Credit andTaxes.” Review of Economics and Statistics, 98(1): 132–??139.
27

Devereux, Michael P. and John Vella. 2017. “Implications of digitalization for interna-tional corporate tax reform.” Oxford University Center for Business Taxation Working paper17/07.Dharmapala, Dhammika. 2014. “What Do We Know About Base Erosion and Profit Shift-ing? A Review of the Empirical Literature.”” CESIFO Working Paper #4612.Dharmapala, Dhammika, and Nadine Riedel. 2013. “Earnings shocks and tax-motivatedincome-shifting: evidence from European multinationals.” Journal of Public Economics 97:95–107.Dowd, Tim, Paul Landefeld, and Anne Moore. 2017. “Profit Shifting of U.S. Multina-tionals.” Journal of Public Economics, 148: 1–13Eurostat. 2012. “Foreign A�liaTes Statistics (FATS) Recommendations Manual.’”Grubert, Harry. 2013. “Foreign taxes and the growing share of U.S. multinational companyincome abroad: profits, not sales, are being globalized.” National Tax Journal, 65(2): 247–281.Guvenen, Fatih, Raymond J. Mataloni Jr., Dylan G. Rassier, and Kim J. Ruhl.2018. “O↵shore Profit Shifting and Domestic Productivity Measurement”, Federal ReserveBank of Minneapolis working paper #751.Heckemeyer, Jost H., and Michael Overesch. 2013. “Multinationals? Profit Response toTax Di↵erentials: E↵ect Size and Shifting Channels.” ZEW Discussion Papers 13-045.Hong, Qing, and Michael Smart. 2010. “In Praise of Tax Havens: International TaxPlanning and Foreign Direct Investment.” European Economic Review, 54(1): 82–95.Huizinga, Harry, and Luc Laeven. 2008. “International profit shifting within multination-als: a multi- country perspective.” Journal of Public Economics, vol. 92, 1164–1182.International Monetary Fund. 2009. “Balance of Payments Manual,” 6th Edition.Johannesen, Niels. 2010. “Imperfect Tax Competition for Profits, Asymmetric Equilibriumand Beneficial Tax Havens.” Journal of International Economics, 81(2): 253–64.Johansson, Asa, Øystein Bieltvedt Skeie, Stephane Sorbe, and Carlo Menon. 2017.“Tax Planning by Multinational Firms: Firm-Level Evidence from a Cross-Country Database”,OECD Economics Department working paper 1355.Kalemli-Ozcan, Sebnem, Bent Sørensen, Carolina Villegas-Sanchez, Vadym Volosovych,and Sevcan Yesiltas. 2015. “How to Construct Nationally Representative Firm Level Datafrom the ORBIS Global Database.” NBER Working Paper No. 21558.Kanbur, Ravi and Keen, Michael. 1993. “Jeux Sans Frontieres: Tax Competition and TaxCoordination When Countries Di↵er in Size.” American Economic Review, 83(4): 877–892Karabarbounis, Loukas and Brent Neiman. 2014. “The Global Decline of the LaborShare.” Quarterly Journal of Economics 129(1), 61-103.Keen, Michael, and Kai Konrad. 2013. “The Theory of International Tax Competitionand Coordination,” Handbook of Public Economics, vol. 5.Lane, Philip R. and Gian Maria Milesi-Ferretti. 2018. “The External Wealth of NationsRevisited: International Financial Integration in the Aftermath of the Global Financial Crisis,”IMF Economic Review, 66:189–222.Lohse, Theresa, and Nadine Riedel. 2013. “Do Transfer Pricing Laws Limit InternationalIncome Shifting? Evidence from European Multinationals”, working paper.
28

Markle, Kevin S. 2012. “A Comparison of Tax Motivated Income Shifting of Multinationalsin Territorial and Worldwide Countries.” Contemporary Accounting Research, 33(1): 7–43.Organization for Economic Co-operation and Development.. 2015. “Base Erosion andProfit Shifting, Final Report”,Organization for Economic Co-operation and Development. 2016. “Irish GDP up by26.3% in 2015?”, available online at http://www.oecd.org/sdd/na/Irish-GDP-up-in-2015-OECD.pdf.Piketty, Thomas, and Gabriel Zucman. 2014. “Capital is Back: Wealth-Income Ratios inRich Countries, 1700–2010,” Quarterly Journal of Economics, 129(3), 1255–1310.Pomeroy, James. 2016. “The Rise of the Digital Natives.” HSBC report, September.Sandholtz, William H. 2018. “Corporate Tax Rate Di↵erentials and Transfer Mispricing:Evidence from Bilateral Trade Data”, working paper.Slemrod, Joel and John D. Wilson. 2009. “Tax competition with parasitic tax havens.”Journal of Public Economics, 93, 1261–1270.United Nations. 2008. “System of National Accounts 2008.”Wier, Ludvig. 2018. “Big and Unprofitable: How 10% of Multinational Firms Do 98% ofProfit Shifting”, working paper.Zucman, Gabriel. 2013. “The Missing Wealth of Nations: Are Europe and the US netDebtors or net Creditors?” Quarterly Journal of Economics, 128(3), 1321–1364.Zucman, Gabriel. 2014. “Taxing Across Borders: Tracking Personal Wealth and CorporateProfits,” Journal of Economic Perspectives, 28(4), 121–148.Zucman, Gabriel. 2015. The Hidden Wealth of Nations: The Scourge of Tax Havens, Chicago:University of Chicago Press.
29

Table 1: Global Output, Corporate Output, and Corporate Taxes Paid (2015)
Trillions of current US$
% of net corporate
profitsGlobal gross output (GDP) 75,038
Depreciation 11,940
Net output 63,098
Net corporate output 34,083 296%
Net corporate profits 11,515 100%
Net profits of foreign-controlled corp. 1,703 15%
Of which: shifted to tax havens 616 5%
Net profits of local corporations 9,812 85%
Corporate income taxes paid 2,154 19%
Notes: Profits of foreign corporations include all the profits made by companies more than 50% owned by a foreign country; profits of localcorporations equal all corporate profits minus the profits of foreign corporations. Source: Appendix Tables C.5 and A.3.

Table 2: Shifted Profits: Country-by-Country Estimates (2015)
Reported pre-tax profits
Of which: Local firms
Of which: Foreign firms
Shifted profits
Effective corporate tax rate
Corp. tax revenue
loss/gain (% collected)
Australia 179 151 28 12 30% 7%Austria 48 37 11 4 18% 11%Canada 143 96 47 17 35% 9%Chile 68 58 10 5 15% 11%Czech Republic 34 16 17 2 20% 5%Denmark 52 47 5 3 15% 8%Estonia 4 3 1 0 12% 10%Finland 25 21 4 3 20% 11%France 188 156 32 32 27% 21%Germany 553 510 43 55 11% 28%Greece 23 21 1 1 19% 7%Hungary 21 11 10 2 11% 21%Iceland 2 2 0 0 19% 22%Israel 54 48 6 1 17% 2%Italy 212 199 13 23 18% 19%Japan 634 602 32 28 26% 6%Korea 248 246 3 4 18% 2%Latvia 4 3 1 0 10% 7%Mexico 325 302 23 12 12% 10%New Zealand 44 37 6 1 18% 5%Norway 76 69 7 5 22% 8%Poland 88 68 19 4 10% 8%Portugal 27 22 5 3 23% 9%Slovakia 12 6 5 1 25% 5%Slovenia 3 2 1 0 18% 6%Spain 159 138 21 14 18% 14%Sweden 63 39 24 9 23% 13%Turkey 213 209 4 5 6% 8%United Kingdom 425 353 72 61 17% 18%United States 1,889 1,737 153 142 21% 14%
Brazil 274 245 30 13 20% 8%China 2,069 1,906 162 55 20% 3%Colombia 59 52 7 1 29% 2%Costa Rica 13 12 1 1 12% 19%India 376 368 8 9 10% 8%Russia 290 253 37 11 14% 5%South Africa 76 68 9 4 25% 6%
Belgium 80 48 32 -13 19% 16%Ireland 174 58 116 -106 4% 58%Luxembourg 91 40 51 -47 3% 50%Malta 14 1 13 -12 5% 90%Netherlands 195 106 89 -57 10% 32%Caribbean 102 4 98 -97 2%` 100%Bermuda 25 1 25 -24 0%Singapore 120 30 90 -70 8% 41%Puerto Rico 53 10 43 -42 3% 79%Hong Kong 95 45 50 -39 18% 33%Switzerland 95 35 60 -58 21% 20%Other -51
OECD countries
Main developing countries
Tax havens
Source: Appendix Tables A.6., A.7, C.4d, and C.4.

Table 3: Macro Statistics Corrected for Profit Shifting (2015)
Corrected capital share
Difference with published data
Corrected trade balance
Difference with published data
Australia 26% +1.1% -1.4% +0.8%Austria 29% +1.3% 4.1% +0.8%Canada 24% +1.4% -1.4% +0.9%Chile 51% +1.5% 1.8% +1.8%Czech Republic 39% +1.0% 6.5% +0.7%Denmark 31% +1.2% 8.2% +0.8%Estonia 35% +1.1% 5.0% +0.9%Finland 28% +1.6% 0.9% +1.0%France 19% +2.1% 0.4% +1.1%Germany 31% +1.8% 9.2% +1.2%Greece 43% +1.1% 0.3% +0.5%Hungary 39% +2.3% 10.4% +1.5%Iceland 33% +3.4% 9.5% +2.0%Israel 37% +0.2% 3.2% +0.2%Italy 30% +1.9% 3.9% +1.0%Japan 28% +0.8% 0.0% +0.5%Korea 37% +0.4% 8.0% +0.2%Latvia 31% +0.9% -0.5% +0.6%Mexico 71% +0.6% -1.2% +0.9%New Zealand 44% +0.7% 1.4% +0.7%Norway 41% +1.2% 6.5% +1.0%Poland 45% +0.9% 3.7% +0.6%Portugal 33% +1.8% 2.8% +1.1%Slovakia 35% +1.1% 3.4% +0.6%Slovenia 18% +0.9% 9.1% +0.4%Spain 29% +1.6% 3.4% +1.0%Sweden 31% +2.2% 6.3% +1.4%Turkey 55% +0.4% -2.3% +0.5%United Kingdom 31% +2.5% 0.2% +1.8%United States 27% +1.1% -2.1% +0.7%
Brazil 26% +1.0% -0.3% +0.5%China 44% +0.5% 3.7% +0.4%Colombia 54% +0.5% -5.9% +0.4%Costa Rica 45% +1.9% 1.6% +1.7%India 56% +0.5% -2.6% +0.4%Russia 40% +0.8% 8.9% +0.7%South Africa 39% +1.4% 0.0% +1.0%
OECD countries
Main developing countries
Source: Appendix Tables C.5 and C.5b.
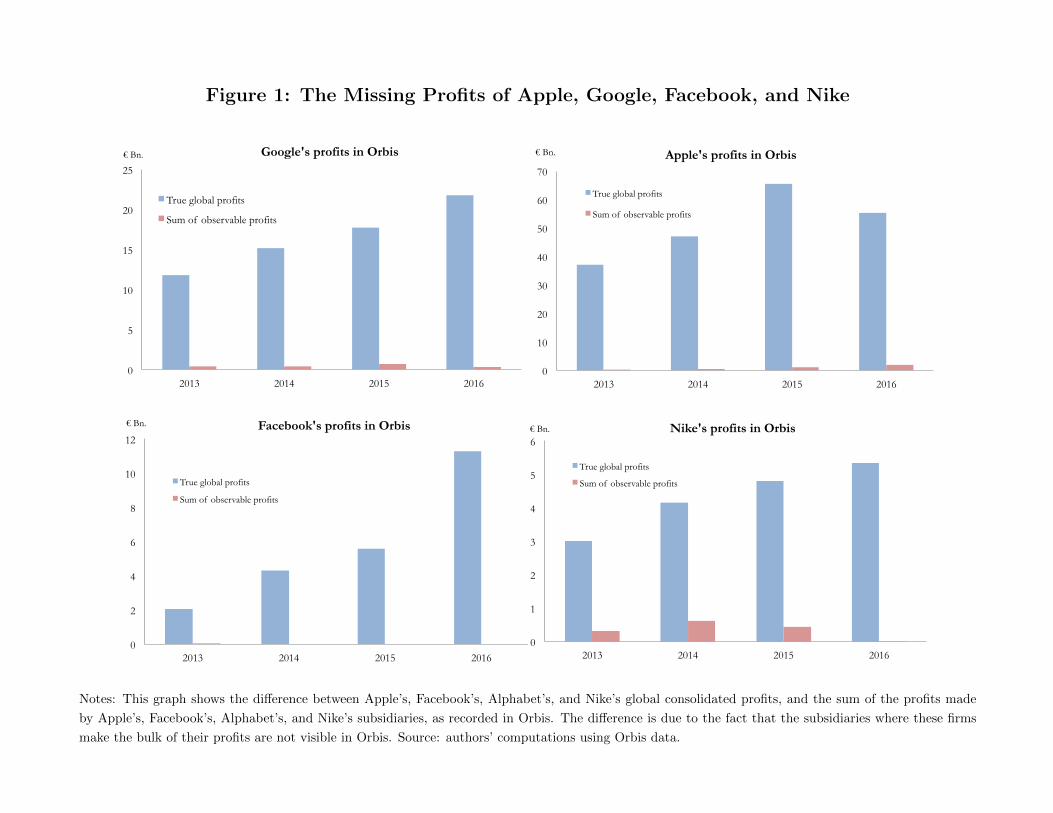
Figure 1: The Missing Profits of Apple, Google, Facebook, and Nike
0
5
10
15
20
25
2013 2014 2015 2016
€ Bn. Google's profits in Orbis
True global profits
Sum of observable profits
Note: This graph shows Google's global consolidated profits, and the sum of the profits made by Google's subsidiaries, as recorded in Orbis. The difference is due to the fact that the subsidiaries where Google makes the bulk of its profits are not visible in Orbis.
0
10
20
30
40
50
60
70
2013 2014 2015 2016
€ Bn. Apple's profits in Orbis
True global profits
Sum of observable profits
Note: This graph shows Apple's global consolidated profits, and the sum of the profits made by Apple's subsidiaries, as recorded in Orbis. The difference is due to the fact that the subsidiaries where Apple makes the bulk of its profits are not visible in Orbis.
0
2
4
6
8
10
12
2013 2014 2015 2016
€ Bn. Facebook's profits in Orbis
True global profits
Sum of observable profits
Note: This graph shows Facebook's global consolidated profits, and the sum of the profits made by Facebook's subsidiaries, as recorded in Orbis. The difference is due to the fact that the subsidiaries where Facebook makes the bulk of its profits are not visible in Orbis.
0
1
2
3
4
5
6
2013 2014 2015 2016
€ Bn. Nike's profits in Orbis
True global profits
Sum of observable profits
Note: This graph shows Nike's global consolidated profits, and the sum of the profits made by Nike's subsidiaries, as recorded in Orbis. The difference is due to the fact that the subsidiaries where Nike makes the bulk of its profits are not visible in Orbis.
Notes: This graph shows the di↵erence between Apple’s, Facebook’s, Alphabet’s, and Nike’s global consolidated profits, and the sum of the profits made
by Apple’s, Facebook’s, Alphabet’s, and Nike’s subsidiaries, as recorded in Orbis. The di↵erence is due to the fact that the subsidiaries where these firms
make the bulk of their profits are not visible in Orbis. Source: authors’ computations using Orbis data.
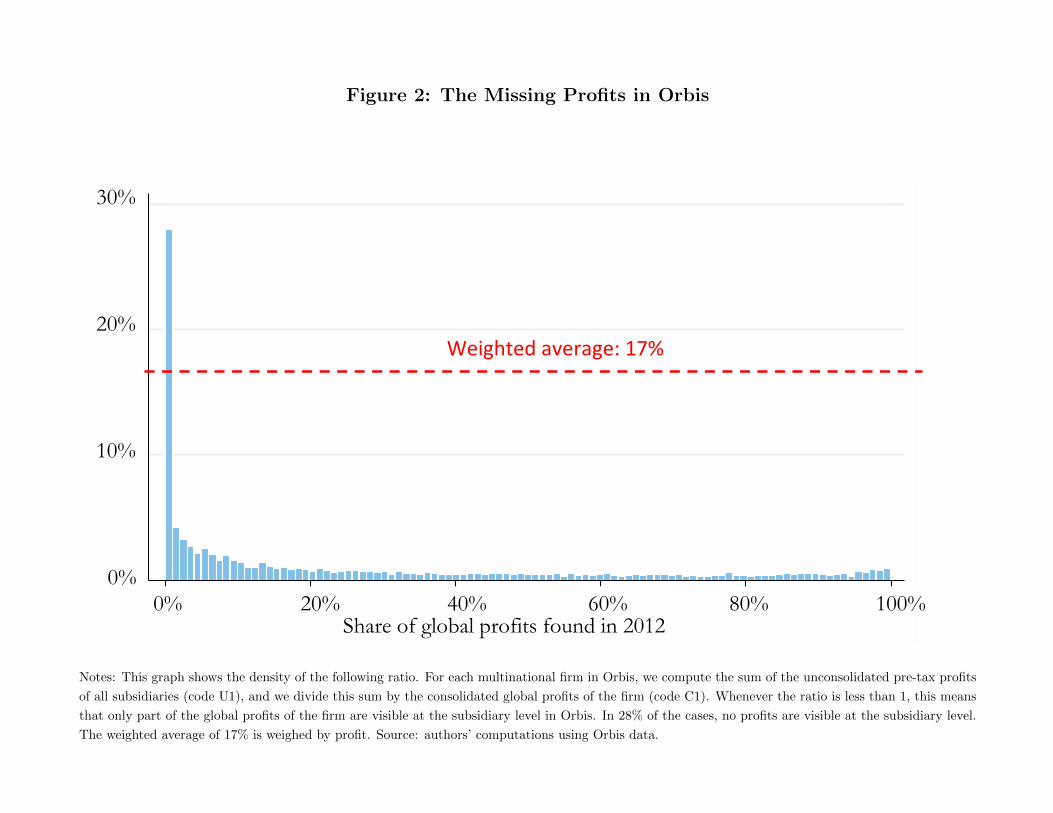
Figure 2: The Missing Profits in Orbis
Note: This graph shows the imperfect coverage in Orbis. For each multinational firm we take the sum of profits made by all subsidiaries registered in Orbis and divide by the global profits of the same multinal firm. Whenever the share is lower than 1 this means that we only see part of the global profits in Orbis. .
Weighted average = 0.172
0.1
.2.3
0 .2 .4 .6 .8 1Share of profits found in 2012
Fraction of firms
Weighted average: 0.17
Share of global profits found in 2012
The missing profits in Orbis
0% 20% 40% 60% 80% 100%
30%
20%
10%
0%
Weighted average: 17%
Notes: This graph shows the density of the following ratio. For each multinational firm in Orbis, we compute the sum of the unconsolidated pre-tax profits
of all subsidiaries (code U1), and we divide this sum by the consolidated global profits of the firm (code C1). Whenever the ratio is less than 1, this means
that only part of the global profits of the firm are visible at the subsidiary level in Orbis. In 28% of the cases, no profits are visible at the subsidiary level.
The weighted average of 17% is weighed by profit. Source: authors’ computations using Orbis data.

Figure 3: Pre-tax Corporate Profits (% Compensation of Employees)
0%
50%
100%
150%
200%
250%
300%
Luxem
bourg
Ire
land
Puerto
Rico
Sin
gapo
re Hon
g Kon
g Neth
erlan
ds
Belgium
Germ
any
Italy
United
King
dom
Japan
Sp
ain
Austra
lia
United
State
s Sw
itzerl
and
Canad
a Fran
ce
Pre-tax corporate profits (% of compensation of employees )
Average among non-havens: 36%
Notes: the bar shows the ratio of pre-tax corporate profits (net of interest and depreciation) to compensation of employees in 2015, as recorded in national
accounts data. Source: Appendix Table A.7.

Figure 4: Profitability in Foreign vs. Local Firms
1675%
0%
200%
400%
600%
800%
Puerto
Rico
Ire
land
Luxem
bourg
Sw
itzerl
and
Singa
pore
Hong K
ong
Netherl
ands
Belg
ium
United
State
s Aus
tralia
United
King
dom
Spain
Jap
an
France
Germ
any
Italy
Pre-tax corporate profits (% of compensation of employees)
Foreign firms
Local firms
Notes: data are for 2015. Source: Appendix Table A.7.
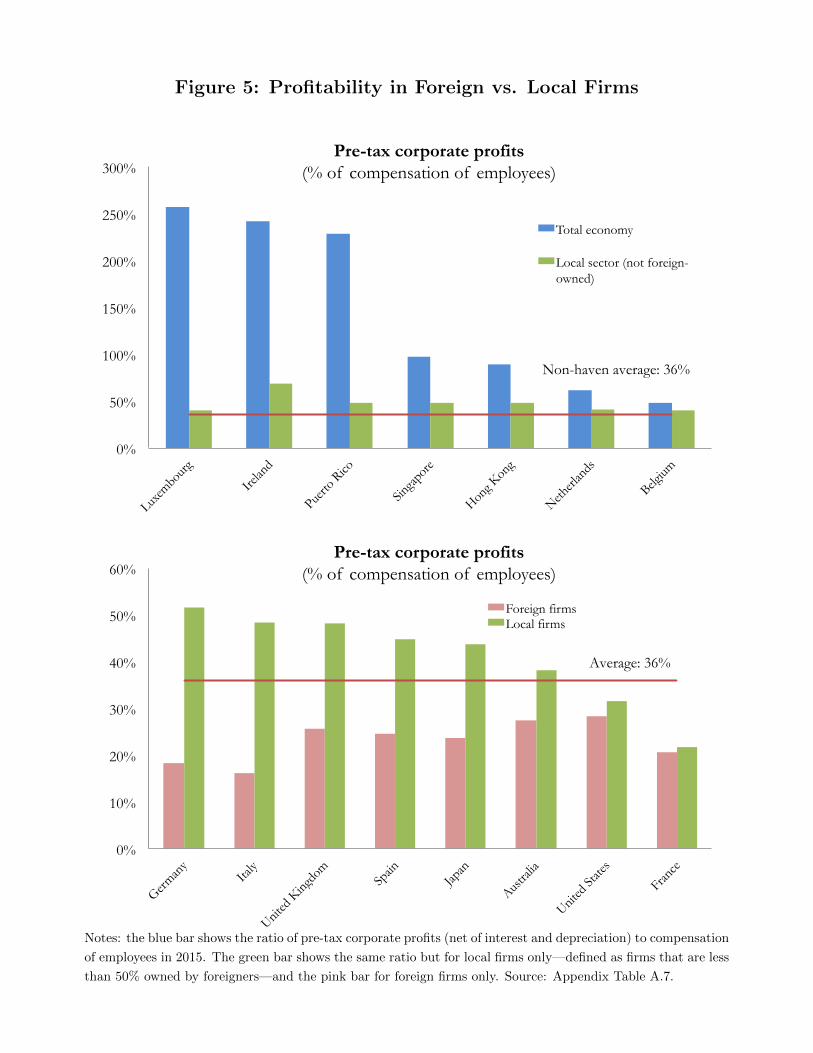
Figure 5: Profitability in Foreign vs. Local Firms
0%
50%
100%
150%
200%
250%
300%
Luxem
bourg
Irelan
d
Puerto
Rico
Singa
pore
Hong K
ong
Netherl
ands
Belgium
Pre-tax corporate profits (% of compensation of employees)
Total economy
Local sector (not foreign-owned)
Non-haven average: 36%
0%
10%
20%
30%
40%
50%
60%
German
y Ita
ly
United
King
dom
Spain
Japan
Austra
lia
United
State
s
France
Pre-tax corporate profits (% of compensation of employees)
Foreign firms Local firms
Average: 36%
Notes: the blue bar shows the ratio of pre-tax corporate profits (net of interest and depreciation) to compensation
of employees in 2015. The green bar shows the same ratio but for local firms only—defined as firms that are less
than 50% owned by foreigners—and the pink bar for foreign firms only. Source: Appendix Table A.7.

Figure 6: The Rise of Profit Shifting
0%
50%
100%
150%
200%
250%
1970 1975 1980 1985 1990 1995 2000 2005 2010 2015
Pre-tax corporate profits (% of compensation of employees)
Ireland
United States
0%
50%
100%
150%
200%
250%
300%
350%
1966 1971 1976 1981 1986 1991 1996 2001 2006 2011 2016
Pre-tax profits of affiliates of U.S. multinationals (% of compensation of employees)
Tax haven affiliates
Non-haven affiliates
Notes and source: see text.

Figure 7: The Profits of US Firms: Havens vs. Non-Haven A�liates
0%
100%
200%
300%
400%
500%
600%
700%
800%
Irelan
d
Bermud
a & C
ar.
Luxem
bourg
Switz
erlan
d
Singa
pore
Netherl
ands
China
Japan
Mex
ico
Belgium
Canad
a In
dia
United
King
dom
Italy
German
y
France
Brazil
Taxable profits of affiliates of U.S. multinationals in 2015 (% of compensation of employees)
Average among non-haven affiliates: 49%
0%
100%
200%
300%
400%
500%
1966 1971 1976 1981 1986 1991 1996 2001 2006 2011 2016
The profitability of the affiliates of US multinationals (ratio of Haven affiliates / Non-haven affiliates)
Physical capital / wage (K/wL)
Operating surplus / physical capital (r)
Net interest received (1-p)

Figure 8: Allocating the Shifted Profits
0%
10%
20%
30%
40%
50%
EU US Developing countries Rest of OECD
% o
f to
tal p
rofit
s sh
ifted
to ta
x ha
vens
Allocating the profits shifted to tax havens
Where the shifted profits come from
To whom the shifted profits accrue
0%
2%
4%
6%
8%
10%
12%
14%
16%
18%
20%
EU US Developing countries Rest of OECD
Tax revenue lost due to profit shifting (% of corporate tax revenue collected)
Global average: 10%
Note: In the benchmark scenario, o↵shore profits are allocated proportionally to the sum of high-risk services
imported from and FDI interest paid tax havens. In the “residence” scenario, o↵shore profits are allocated based
each country’s share of global FDI income credits. Estimates are for 2015.

Figure 9: Corporate Tax Revenue in Tax Havens
0%
1%
2%
3%
4%
5%
6%
7%
8%
Malt
a
Luxem
bourg
Cypru
s
Hong K
ong
Japan
Austra
lia
Irelan
d
Canad
a
Belgium
Switz
erlan
d
Korea
Singa
pore
Mex
ico
United
King
dom
Netherl
ands
France
Puerto
Rico
Spain
German
y
United
State
s Ita
ly
Polan
d
Corporate income tax revenue (% of national income)
Average among non-havens: 3.5%
0%
20%
40%
60%
80%
100%
Malt
a
Puerto
Rico
Irelan
d
Luxem
bourg
Cypru
s
Singa
pore
Hong K
ong
Netherl
ands
Switz
erlan
d
Corporate tax revenue collected & tax rate on shifted profits
Revenue collected on shifted profits, % of total revenue
Tax rate on shifted profits
Notes: data are for 2015. Source: Appendix Tables A.3., A.6., A.7, and A.11.

Figure 10: The Redistribution of Corporate Income Tax Revenue
0%
1%
2%
3%
4%
5%
1970 1975 1980 1985 1990 1995 2000 2005 2010 2015
Corporate income tax revenue (% net national income)
Ireland
United States
0
10
20
30
40
50
0%
1%
2%
3%
4%
5%
1970 1975 1980 1985 1990 1995 2000 2005 2010 2015
Corporate income tax revenue vs. tax rate in Ireland
Tax revenue (left) (% of national income) Nominal tax rate (right)
Notes and source: see text.

Figure 11: How Tax Authorities Enforce Taxes on Multinationals
0
2
4
6
8
10
12
14
Uni
ted
Stat
es
Ger
man
y
Japa
n
Net
herla
nds
Switz
erla
nd
Fran
ce
Kor
ea
UK
Aus
tral
ia
Aus
tria
Nor
way
Chi
na
Sing
apor
e
Cay
man
Den
mar
k
Can
ada
Cze
ch
Taiw
an
Finl
and
Pola
nd
Brit
ish
virg
in
Hon
g K
ong
Pana
ma
Swed
en
# of times country is among top 3 targets
Countries most often targeted in transfer price disputes
0%
10%
20%
30%
40%
50%
60%
70%
80%
90%
100%
EU high tax country EU tax haven
% of total Counterpart in Mutual Agreement Procedures in the EU
Notes and source: see text.