The Minority AIDS Initiative National - PEP-C Home Cross-Site Evaluation... · The Minority AIDS...
68
Transcript of The Minority AIDS Initiative National - PEP-C Home Cross-Site Evaluation... · The Minority AIDS...
2
The Minority AIDS Initiative National Cross-Site Evaluation: An Overview
Presenters:
Darigg Brown, Ph.D.Nilufer Isvan, Ph.D.
Program Evaluation for Prevention Contract
(PEP-C)
Grantee Training
February 11, 2016

First Things First…
• Audio
– Your computer’s speakers or
– Dial: 866-503-4560; Participant Code: 1031268581
• Webinar is being recorded, use listen-only mode
• Participant Questions
– Use the Q & A box on your screen at any time
• Technical Issues
– Use Q & A box to reach our TA Team
3
Downloadable Files on Your Screen
• Slides for the current webinar
• Copies of draft instruments
• To download:
– Click on the file name to highlight
– Click the Download button
4
Agenda
• Introduction
• Federal reporting requirements
• The cross-site logic model & evaluation questions
• Cross-site evaluation data sources
– Process & implementation
– Participant-level outcomes
– Community-level outcomes
• Online data systems under development
• Discussion
4
Annual Performance Reporting
Government Performance and Results Act (GPRA)
• Originally enacted in 1993
• Currently: GPRA Modernization Act of 2010
• Federally funded programs required to report performance measures & meet targets
• Each year’s performance used to justify budget requests for following year
6

SAMHSA/CSAP’s MAI GPRA Measures
7
Measure TargetActual
(FY2013)
Number of program participants exposed to substance abuse prevention education services (Output)
5,734 6,437
Percent of program participants that rate the risk of harm from substance abuse as great (all ages) (Outcome)
88.0% 96.2%
Percent of program participants who report no use of alcohol at pre-test who remain non-users at post-test (all ages) (Outcome)
91.2% 89.2%
Percent of participants who report no illicit drug use at pre-test who remain non-users at post-test (all ages) (Outcome)
92.6% 93.9%
Number of persons tested for HIV through the Minority AIDS Initiative prevention activities (Outcome)
Baseline 36,707
9
Source: CSAP Accountability Report, Volume XII, FY 2013.

HHS Core Indicators for HIV
• 7 Core indicators, mostly measuring treatment and secondary prevention outcomes
• CSAP reports 3 of the indicators, adapted for primary prevention programs:
– Numbers tested for HIV
– Number of positive tests
– Number of homeless (or unstably housed) individuals tested for HIV
8

Cross-Site Evaluation Questions (1)
• Baseline characteristics of the people served
• Populations were targeted, strategies implemented, services provided
• Changes in participants’ knowledge, attitudes, behaviors, access to healthcare
• Individual-level factors and grantee characteristics associated with participant outcomes
9

• Changes in the normative environment and in health disparities at the community level
• Factors associated with changes at the community level
• Strategies and combinations of strategies associated with participant- and community-level changes
10
Cross-Site Evaluation Questions (2)

MAI Cross-Site Evaluation Logic Model
11
· MAI funding
· TTA · Needs assessment
· Capacity building
· Strategic planning
· Implementation
o # Direct prevention
o # Environmental
strategies
o # HIV/HCV testing
o # Referrals and
service linkages
· Evaluation
· Knowledge
· Attitudes
· Risk perceptions
· Self-efficacy
· Intentions
· Social norms
· Awareness of and
access to health
services
· Changes in
community social
norms and attitudes
around alcohol use
and risky sexual
behaviors associated
with HIV/HCV
transmission
Distal
(Environmental Level)
Proximal
(Individual Level)
Inputs OutcomesOutputs
· # Served by demog.
· # Trained in SA, HIV,
HCV prevention
· # Tested for HIV/
HCV, # positive,
# counseled, and
# linked to care
· # Tested for the first
time
· # Number with
knowledge of test
results
· Any alcohol use
· Binge/heavy drinking
· Any illicit drug use
· Unprotected sex
· Sex while drunk or
high
Intermediate
(Individual Level)Activities Participants
Individual-Level Moderators
· Sociodemographics
· Victimization
· Discrimination
· Mental health
· Criminal justice involvement
· Social support
Grantee-Environment
Level Moderators
· Fidelity
· Baseline prevalence of HIV/
HCV/STIs
· Baseline social/economic
characteristics
PROCESS & IMPLEMENTATION DATA
12

Quarterly Progress Reports
• Data collection tool under review by the Office of Management and Budgets (OMB)
• Online data entry tool under development
• Future trainings
– Detailed content after OMB approval
– Technical training before online system launch
13
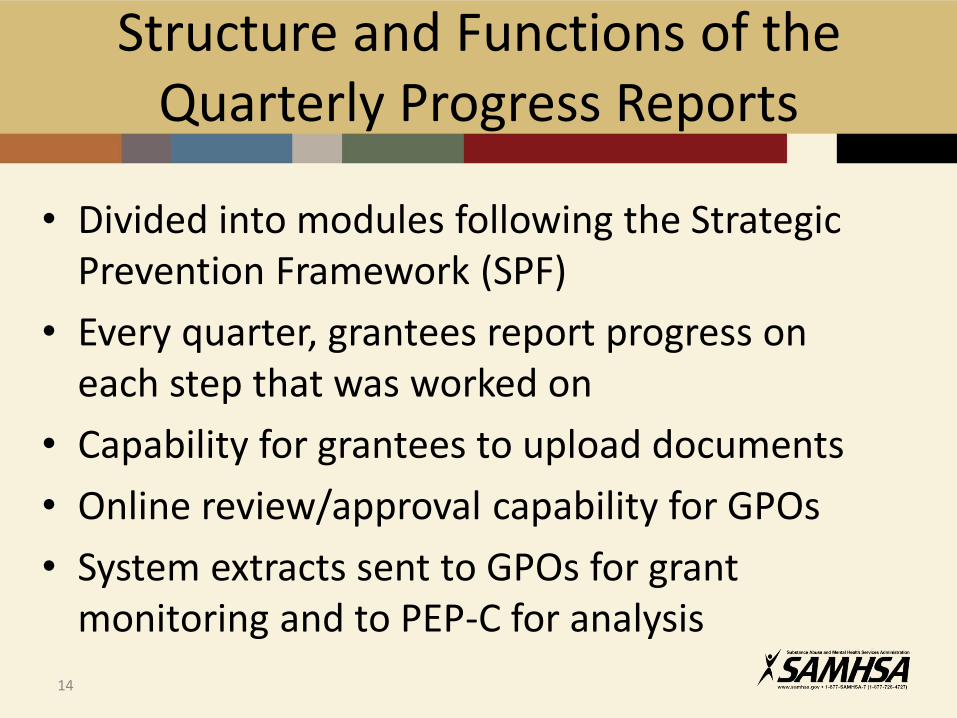
Structure and Functions of the Quarterly Progress Reports
• Divided into modules following the Strategic Prevention Framework (SPF)
• Every quarter, grantees report progress on each step that was worked on
• Capability for grantees to upload documents
• Online review/approval capability for GPOs
• System extracts sent to GPOs for grant monitoring and to PEP-C for analysis
14

EVALUATING DIRECT SERVICES WITH PARTICIPANT-LEVEL DATA
15

CSAP’s Six Strategies Framework
16
Prevention Strategies
Direct Indirect
Environmental
Strategies
Information
Dissemination
Alternative
Drug-Free
Activities
Community-Based
Processes
Prevention
Education
Problem
Identification
& Referral
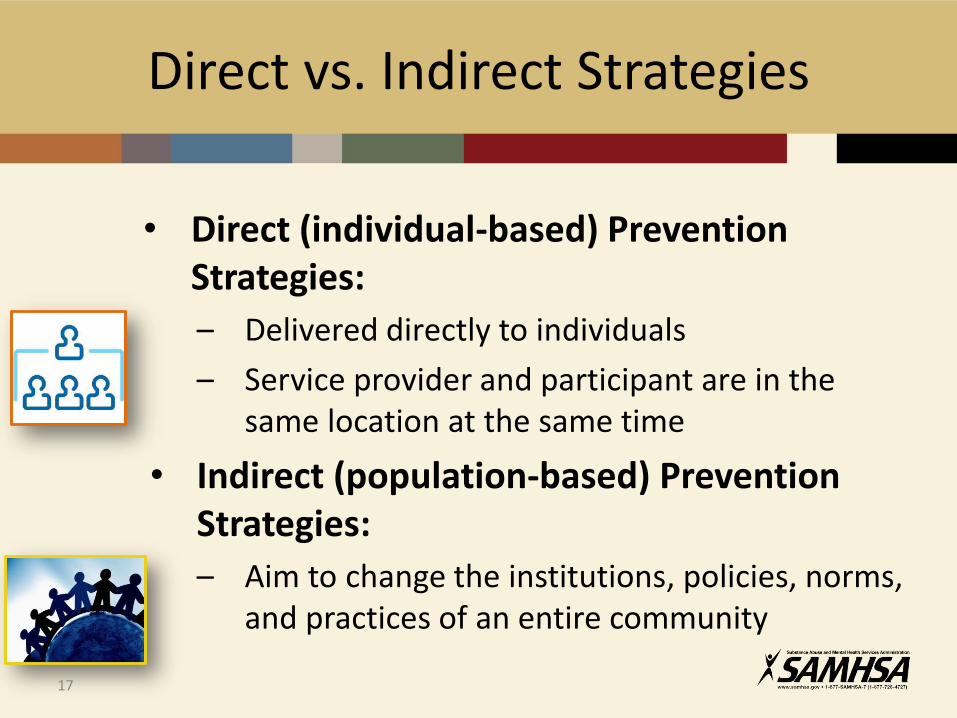
• Direct (individual-based) Prevention Strategies:
– Delivered directly to individuals
– Service provider and participant are in the same location at the same time
• Indirect (population-based) Prevention Strategies:
– Aim to change the institutions, policies, norms, and practices of an entire community
Direct vs. Indirect Strategies
17
18
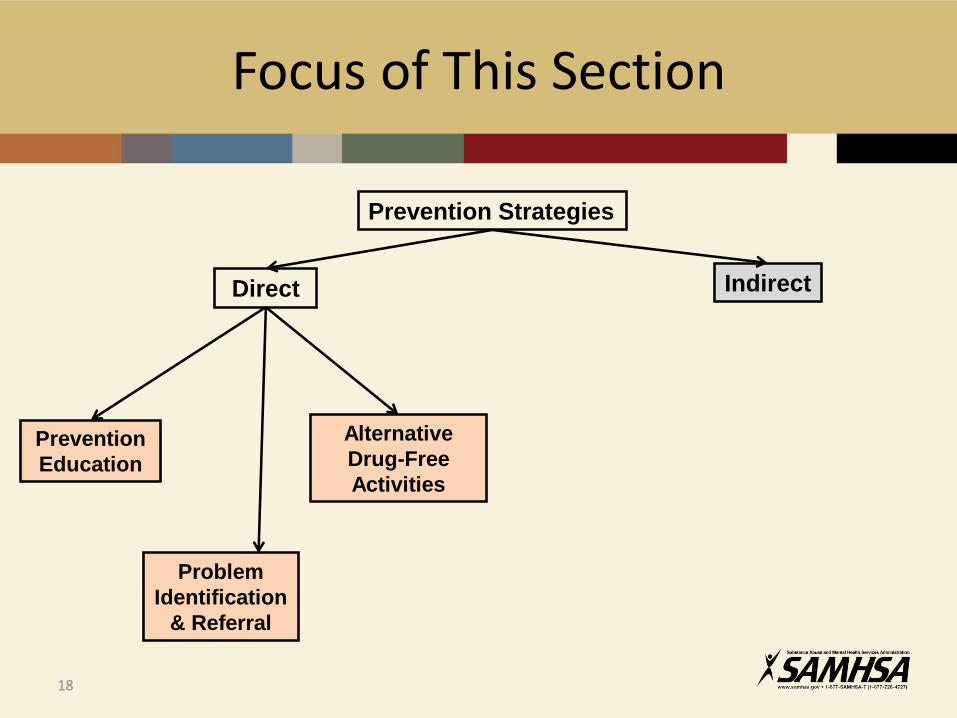
Focus of This Section
Prevention Strategies
Direct Indirect
Alternative
Drug-Free
Activities
Prevention
Education
Problem
Identification
& Referral

Direct Services – Examples
• HIV or substance abuse prevention education classes
• Motivational interviewing
• Problem identification, referral, and case management services
• One-on-one or group counseling
• Refusal skills training
• HIV testing 19
MAI Participant-Level Instruments
The National Minority SA/HIV Prevention Initiative has four standard instruments
• Youth Questionnaire
• Adult Questionnaire
• Group Dosage Form
• Individual Dosage Form
11
When Not to Administer the Participant-Level Instruments
Participant-level data collection protocol does not apply to:
• Individuals contacted through community outreach or other recruitment efforts only
• Individuals who only receive testing or vaccination services
– Data reported in the aggregate in the Quarterly Progress Reports
21

Frequently Asked Question
22
We use a peer-led prevention approach.
Should we collect participant-level data from the peer mentors/educators that we train?

Response: “Depends on Content”
23
• Collect participant data if:– Peer mentors/educators receive services expected
to change their knowledge, attitudes, behaviors (KAB) related to SA and HIV
• Do not collect participant data if:– Peer training is restricted to skills such as outreach
and recruitment and not expected to change KAB related to SA and HIV
Record Management Section
• Included in all instruments (questionnaires anddosage forms)
• Filled out ONLY by a staff member with access to the necessary information
• Must be completed prior to administering questionnaires to participants
26
Record Management Fields
• Grant ID
• Unique Participant ID
• Interview type
• Interview date
• Intervention(s) received
• Service duration
• Intervention vs. comparison group
25
Questionnaire Sections
• SECTION 1: Facts About You– Demographic and socioeconomic information
– Output measures (people served)
– Disparities in outcomes
• SECTION 2: Attitudes & Knowledge– HIV knowledge, perception of risk, self-efficacy
– Proximal outcomes (expected to change soon after program)
• SECTION 3: Behavior & Relationships– Substance use, risky sexual behaviors, emotional support
– May take some time to change (at least 30 days)26

Participant Burden Reduction
Participants with shorter service duration receive:
• Fewer questions on the questionnaire
• Fewer survey administrations
23
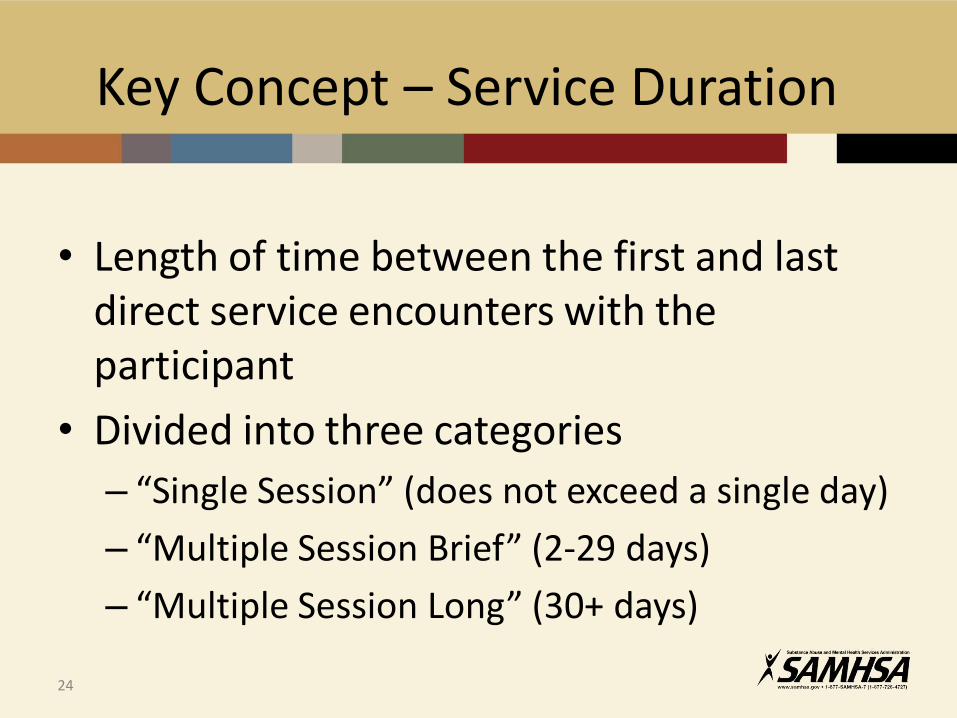
Key Concept – Service Duration
• Length of time between the first and last direct service encounters with the participant
• Divided into three categories
– “Single Session” (does not exceed a single day)
– “Multiple Session Brief” (2-29 days)
– “Multiple Session Long” (30+ days)
24
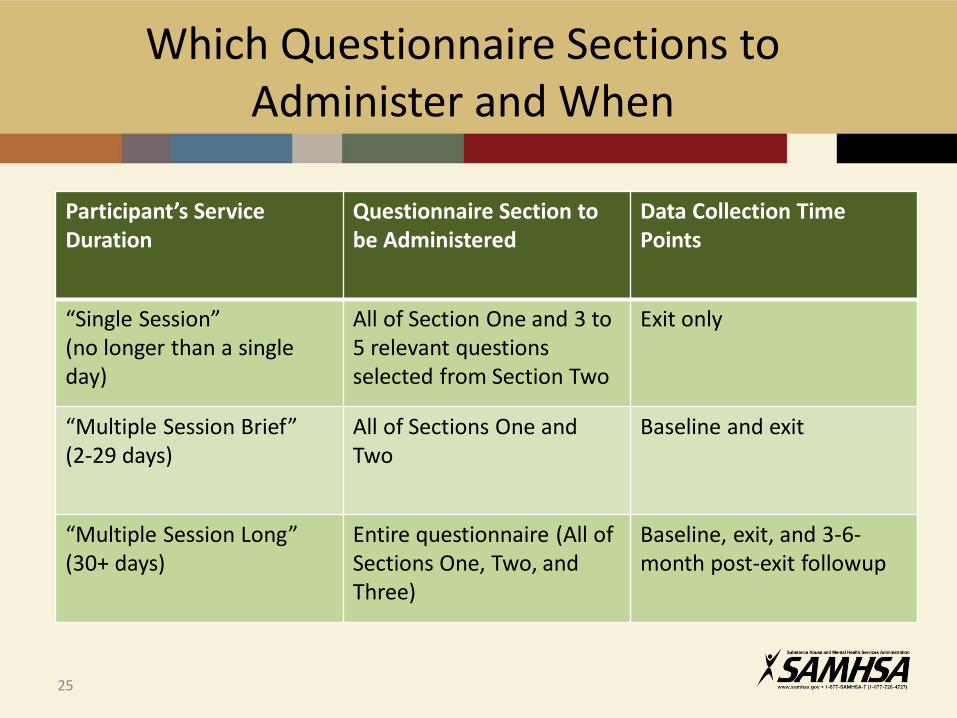
Which Questionnaire Sections to Administer and When
Participant’s Service Duration
Questionnaire Section to be Administered
Data Collection Time Points
“Single Session”(no longer than a single day)
All of Section One and 3 to 5 relevant questions selected from Section Two
Exit only
“Multiple Session Brief”(2-29 days)
All of Sections One and Two
Baseline and exit
“Multiple Session Long”(30+ days)
Entire questionnaire (All of Sections One, Two, and Three)
Baseline, exit, and 3-6-month post-exit followup
25

Grant Identification Number
• Enter the grant identification number assigned by SAMHSA/CSAP
If this number is missing or inaccurate, the data record cannot be processed or used in evaluation
28

Study Design Group
• Intervention Group▫ Group receiving services
• Comparison Group▫ Group NOT receiving any
services
• Comparison groups are NOTrequired by CSAP. Select “Intervention” for all of your participants if you are not using a comparison group
Records with missing Study Design Group cannot be used in the evaluation.
29
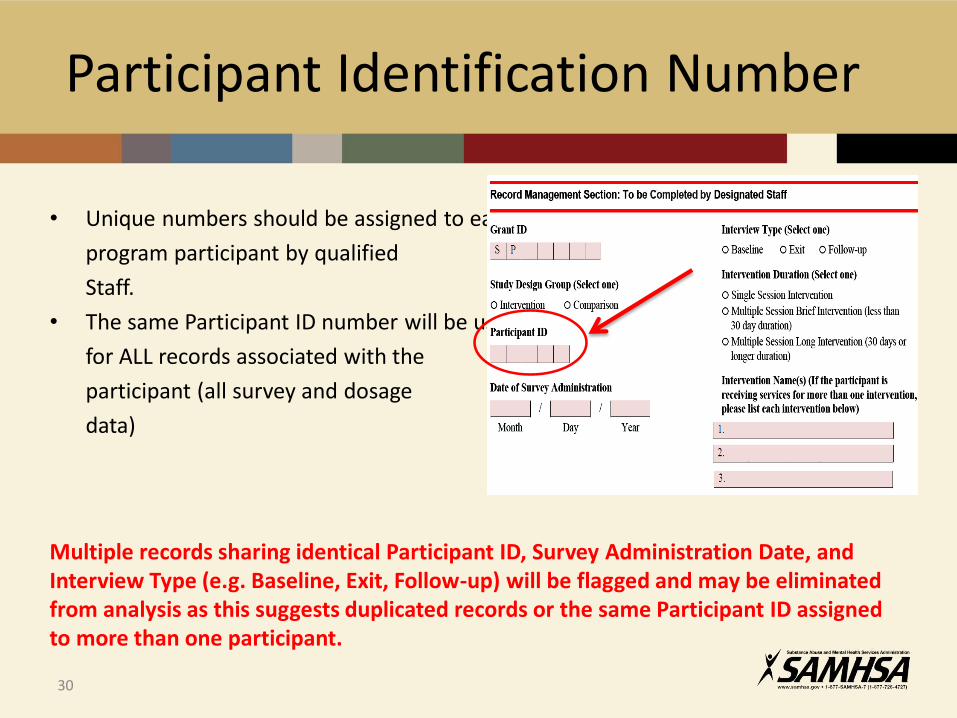
Participant Identification Number
• Unique numbers should be assigned to each
program participant by qualified
Staff.
• The same Participant ID number will be used
for ALL records associated with the
participant (all survey and dosage
data)
Multiple records sharing identical Participant ID, Survey Administration Date, and Interview Type (e.g. Baseline, Exit, Follow-up) will be flagged and may be eliminated from analysis as this suggests duplicated records or the same Participant ID assigned to more than one participant.
30

Date of Survey Administration
• The 2-digit month, 2-digit day, and 4-digit year should be entered.
• This should be the date that the questionnaire was administered, not the date the data were entered.
Records with missing, incomplete, or inaccurate administration date information cannot be used in evaluation.
If administration dates are out of order (e.g. date of exit interview is before the baseline interview), neither record can be used in the evaluation.
31
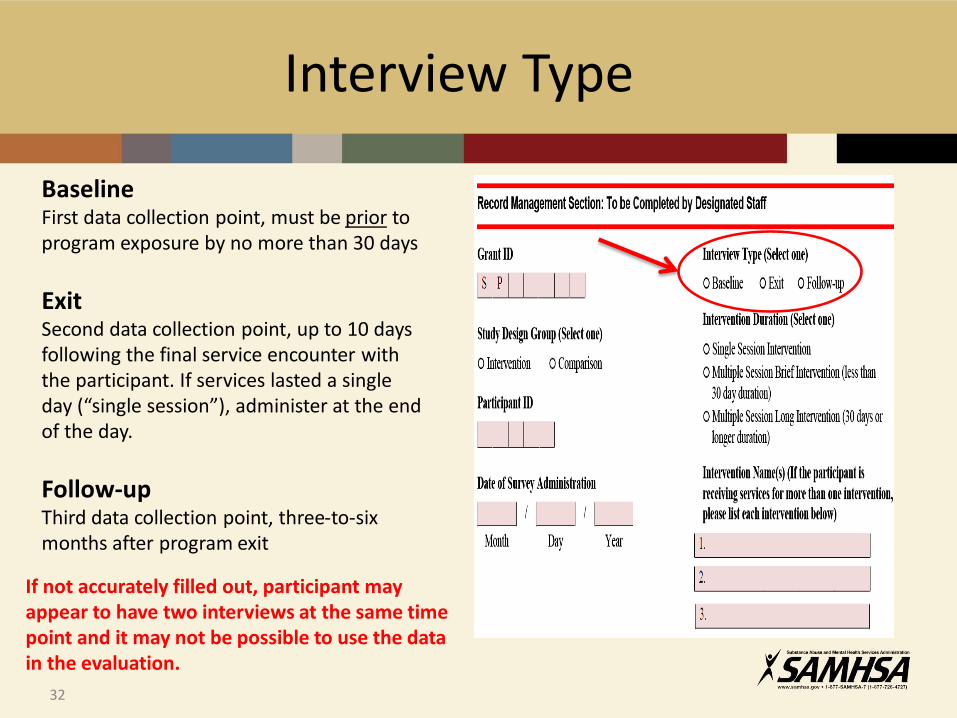
Interview Type
BaselineFirst data collection point, must be prior to program exposure by no more than 30 days
ExitSecond data collection point, up to 10 days following the final service encounter with the participant. If services lasted a single day (“single session”), administer at the end of the day.
Follow-upThird data collection point, three-to-six months after program exit
If not accurately filled out, participant may appear to have two interviews at the same time point and it may not be possible to use the data in the evaluation.
32
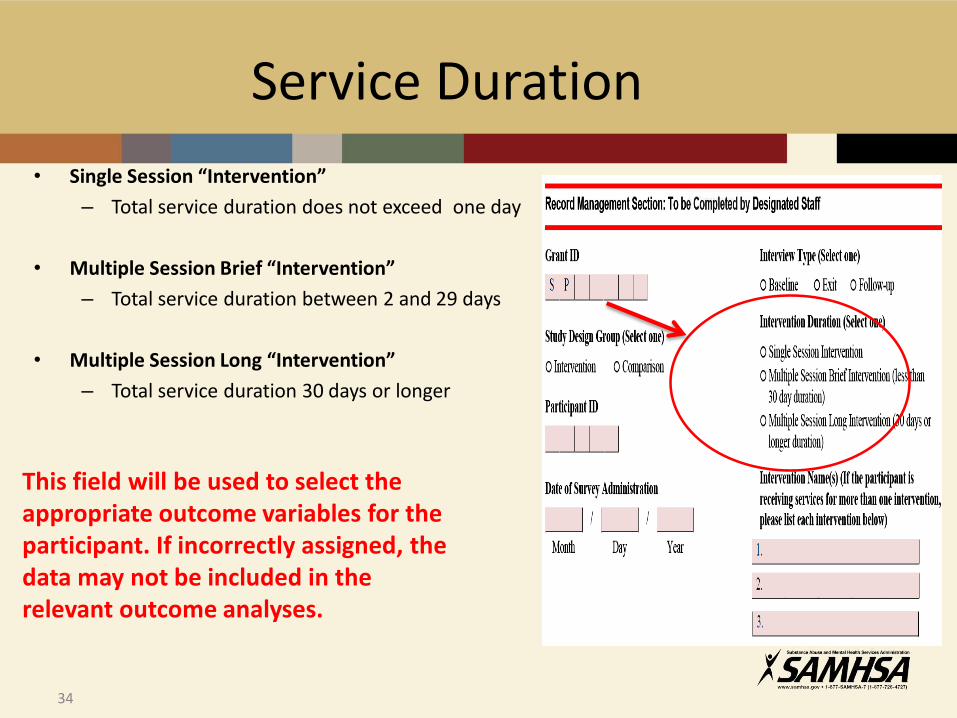
Service Duration
• Single Session “Intervention”
– Total service duration does not exceed one day
• Multiple Session Brief “Intervention”
– Total service duration between 2 and 29 days
• Multiple Session Long “Intervention”
– Total service duration 30 days or longer
This field will be used to select the appropriate outcome variables for the participant. If incorrectly assigned, the data may not be included in the relevant outcome analyses.
34

Frequently Asked Question
36
Before services begin, we may not know how long the participant will stay in our program.
How do we fill out “Intervention Duration” in the baseline survey?

Response: “Informed Guess”
37
• Enter “best guess” at baseline
• Enter actual duration of services at exit
• Cross-site team will make the necessary correction before analysis
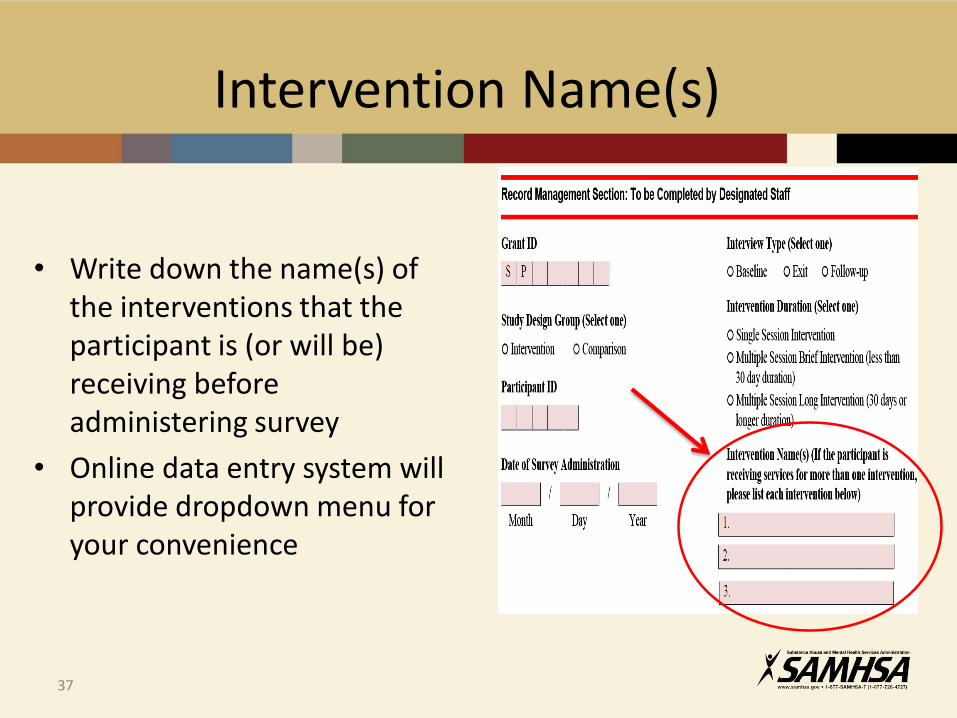
Intervention Name(s)
• Write down the name(s) of the interventions that the participant is (or will be) receiving before administering survey
• Online data entry system will provide dropdown menu for your convenience
37
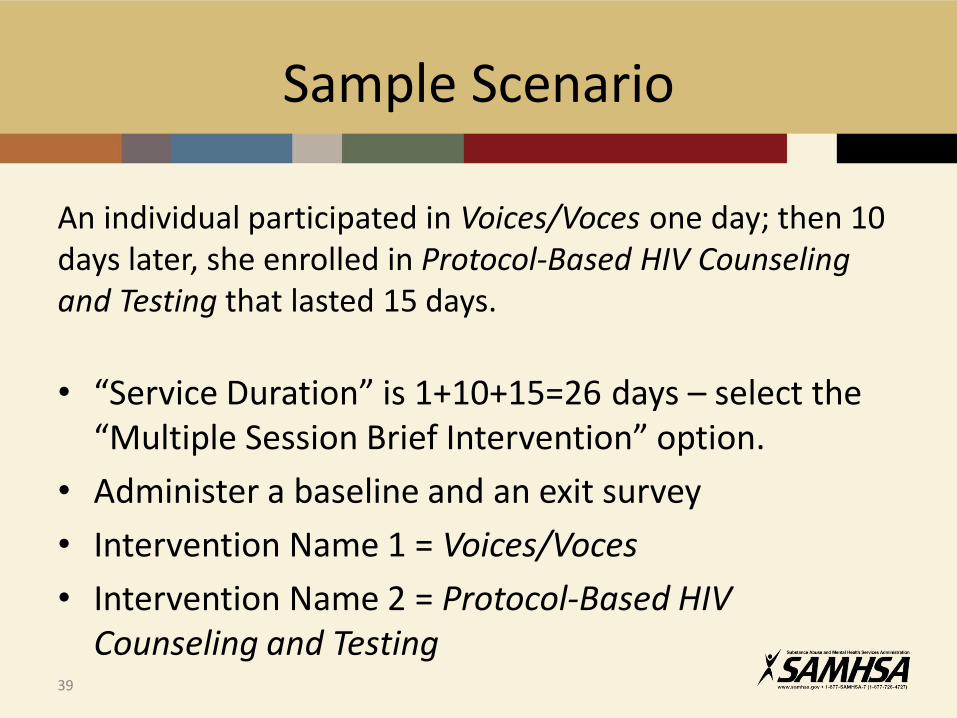
Sample Scenario
An individual participated in Voices/Voces one day; then 10 days later, she enrolled in Protocol-Based HIV Counseling and Testing that lasted 15 days.
• “Service Duration” is 1+10+15=26 days – select the “Multiple Session Brief Intervention” option.
• Administer a baseline and an exit survey
• Intervention Name 1 = Voices/Voces
• Intervention Name 2 = Protocol-Based HIV Counseling and Testing
39

Preparing the Questionnaire
• Familiarize survey administration staff with the questionnaires (training materials will be provided)
• Determine the total duration of funded services that the participant is intended to receive
• Prepare appropriate section(s) of appropriate questionnaire (youth or adult)
• Determine timing of Baseline, Exit, and Follow-up data collection
• Complete the record management section before giving to participants
42
Administering the Questionnaire
• Who administers the questionnaires?– Qualified staff familiar with the instruments and trained in survey administration
– Service providers should not administer questionnaires
• Choose a space that provides sufficient ventilation, lighting, and privacy
• Budget an appropriate amount of time to complete the questionnaire– Single-day services : ~ 5 minutes
– Services lasting 2 – 29 days: ~ 30 minutes
– Services lasting 30+ days: ~ 50 minutes
• Allow extra time for administrative issues (reading instructions, etc.)
• Provide services or referrals in the event the questionnaire items about personal issues such as partner abuse cause emotional distress among participants
43
Dosage Data
42
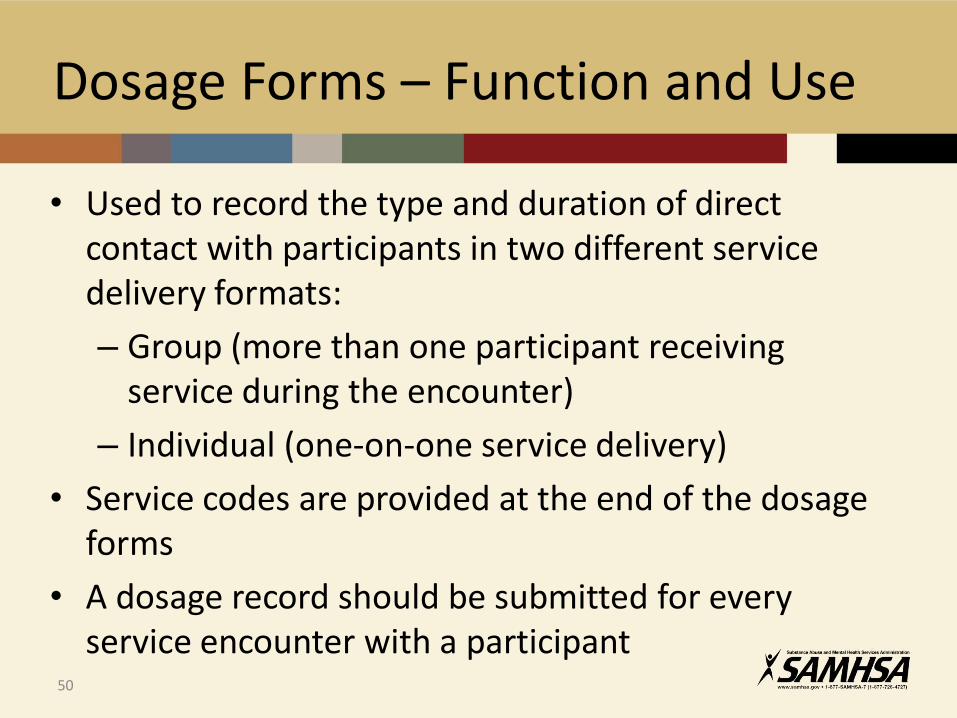
Dosage Forms – Function and Use
• Used to record the type and duration of direct contact with participants in two different service delivery formats:
– Group (more than one participant receiving service during the encounter)
– Individual (one-on-one service delivery)
• Service codes are provided at the end of the dosage forms
• A dosage record should be submitted for every service encounter with a participant
50

• Record management fields:
• Encounter Date
• Grant ID
• Administration Format
• Participant ID Number(s)
• Data fields:
• Service Code(s)
• Duration Code(s) (in minutes, rounded up to the nearest 5-min. interval)
Dosage records with missing or invalid record management information may be excluded from the evaluation
Dosage Forms – Contents
51

Individual Dosage Form
Example:
On March 22, 2010, Marie (ID#65471) participated in a behavioral health intervention. It included an individual HIV education session and an HIV testing counseling session at the Jones Health Center (Grant ID SP00009). The education session lasted 88 minutes and the HIV testing counseling lasted 15 minutes. She decided not to stay for testing on that particular day but may come back.
Month Day Year Grant ID Grp.Typ. Adm. Frmt.
Participant ID #
0 3 2 2 1 0 S P 0 0 0 0 9 1 1 6 5 4 7 1
Individual Service Code
Duration Code
#1 01 02 03 04 05
06 06a 07 9 0
08 09 10 11 12
13 14 15 (Closest 5-
minute interval)
#2 01 02 03 04 05
06 06a 07
1 5
08 09 10 11 12
13 14 15 (Closest 5-
minute interval)
52

Group Dosage Form
Example:
Cityside Prevention Center (Grant ID SP00017) holds a 2-hour group counseling session for adults once a week. On April 12, 2010, 12 people attended. The session went over the normal 2 hour time slot by 4 minutes.
Encounter Date Group Service Code Duration Code
Month Day Year
#1
11 12 13 14 15 16 17 18 1 2 5
0 4 1 2 1 0 19 20 21 21a 22 23 24 25 (To the closest 5-
minute interval)
Grant ID
S P 0 0 0 1 7
#2
11 12 13 14 15 16 17 18
19 20 21 21a 22 23 24 25 (To the closest 5-
minute interval)
Grp. Type Adm. Frmt.
1 2
#3
11 12 13 14 15 16 17 18
19 20 21 21a 22 23 24 25 (To the closest 5-
minute interval)
Participant ID Numbers:
0 5 4 7 2 1 3 6 3 4 1 4 7 6 5
5 2 1 7 5 5 2 1 3 8 6 8 4 8 3
2 5 7 3 4 2 1 7 6 6
1 3 6 9 1 3 2 8 6 5
9 4 5 7 6 6 2 5 3 8
53
Questions?
47
EVALUATING INDIRECT STRATEGIES WITH COMMUNITY-LEVEL DATA
48
Terminology Alert!
Multiple definitions!
• Different agencies may use terms differently
• Terminology may differ by academic discipline or journal
• Terminology we will use: SAMHSA/CSAP’s “Six Strategies Framework”
49
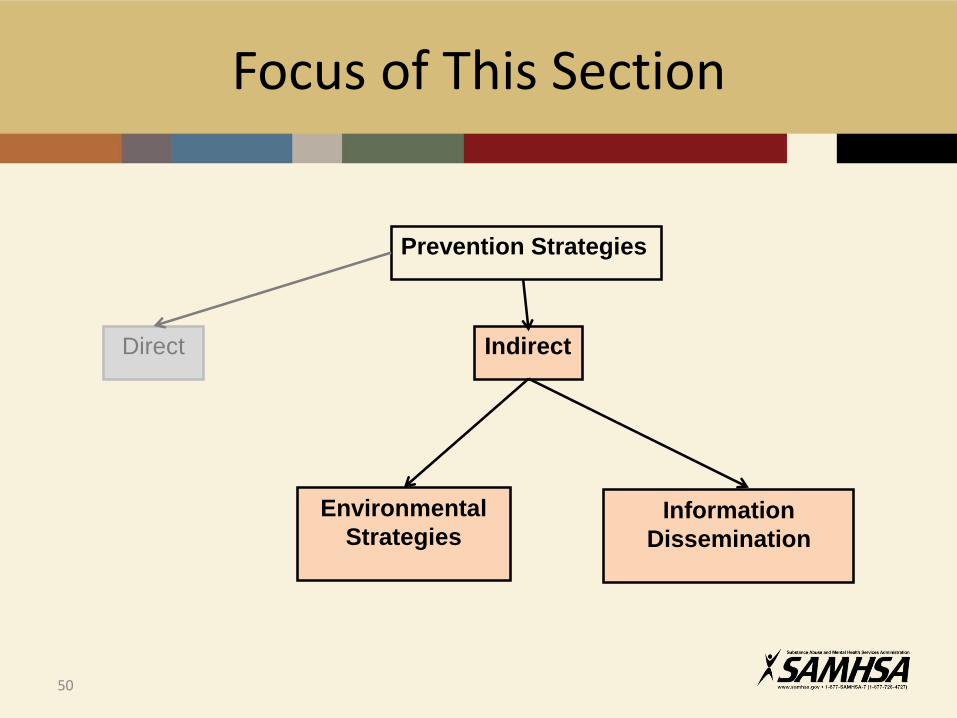
Focus of This Section
50
Prevention Strategies
Direct Indirect
Environmental
StrategiesInformation
Dissemination

Definition: Aim to change community standards, codes, and practices related to undesirable health behaviors in the general population
Subcategories
– Legal and regulatory initiatives
– Service, access, systems change, and action-oriented initiatives
51
Environmental Strategies
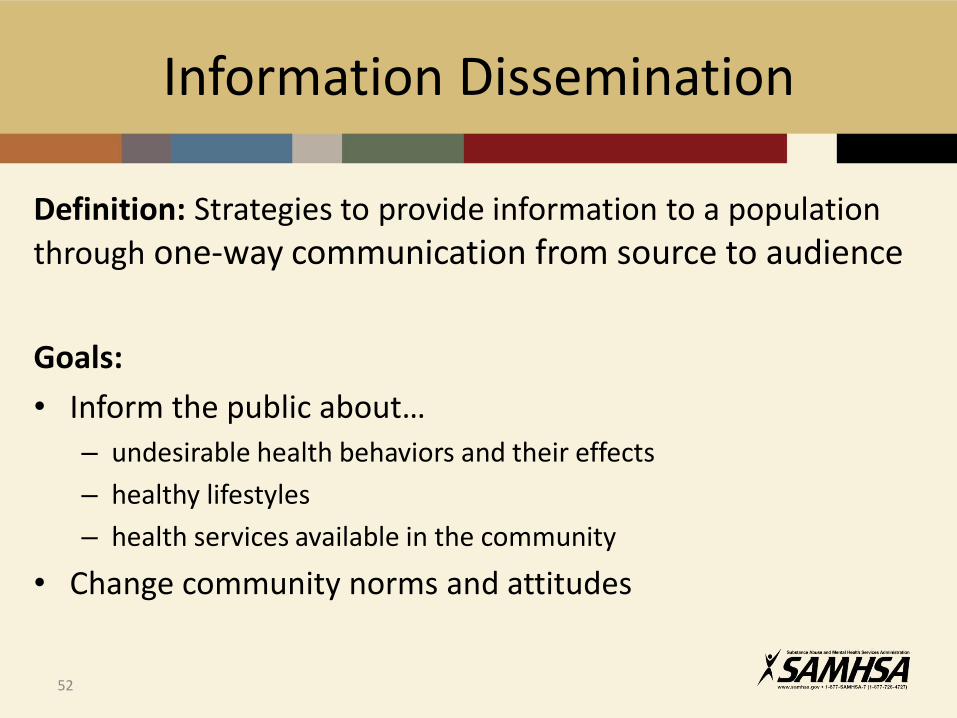
Definition: Strategies to provide information to a population
through one-way communication from source to audience
Goals:
• Inform the public about…
– undesirable health behaviors and their effects
– healthy lifestyles
– health services available in the community
• Change community norms and attitudes
Information Dissemination
52

Terminology Alert!
• Some definitions classify social norms campaigns and social marketing as environmental strategies
• The Six Strategies Framework classifies them under information dissemination
53
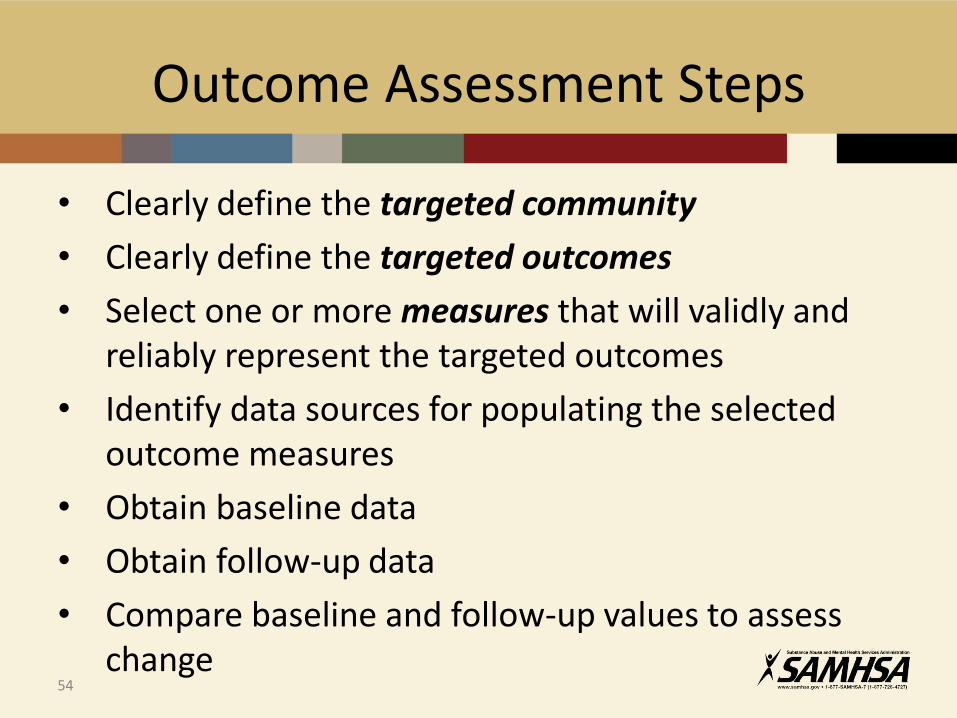
Outcome Assessment Steps
• Clearly define the targeted community
• Clearly define the targeted outcomes
• Select one or more measures that will validly and reliably represent the targeted outcomes
• Identify data sources for populating the selected outcome measures
• Obtain baseline data
• Obtain follow-up data
• Compare baseline and follow-up values to assess change
54

Identifying the Target Community
Indirect Strategy Targeted Community
Condom distribution on campus All students enrolled in the institution
Partnering with a school district to implement a Student Prevention Leaders
program in every schoolStudents enrolled in the district schools
Running a TV ad with a prevention message
Population group reached by the TV channels on which the ad aired
Installing billboards on every bus in a community
Entire community served by the bus system
55
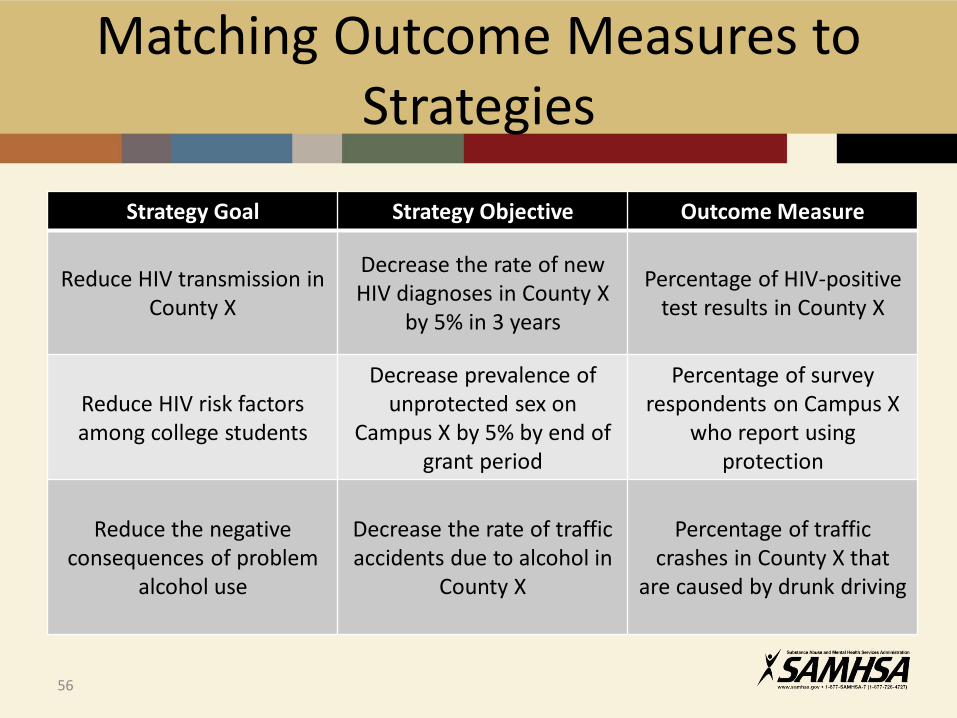
Matching Outcome Measures to Strategies
Strategy Goal Strategy Objective Outcome Measure
Reduce HIV transmission in County X
Decrease the rate of new HIV diagnoses in County X
by 5% in 3 years
Percentage of HIV-positivetest results in County X
Reduce HIV risk factors among college students
Decrease prevalence of unprotected sex on
Campus X by 5% by end of grant period
Percentage of survey respondents on Campus X
who report using protection
Reduce the negative consequences of problem
alcohol use
Decrease the rate of trafficaccidents due to alcohol in
County X
Percentage of traffic crashes in County X that
are caused by drunk driving
56
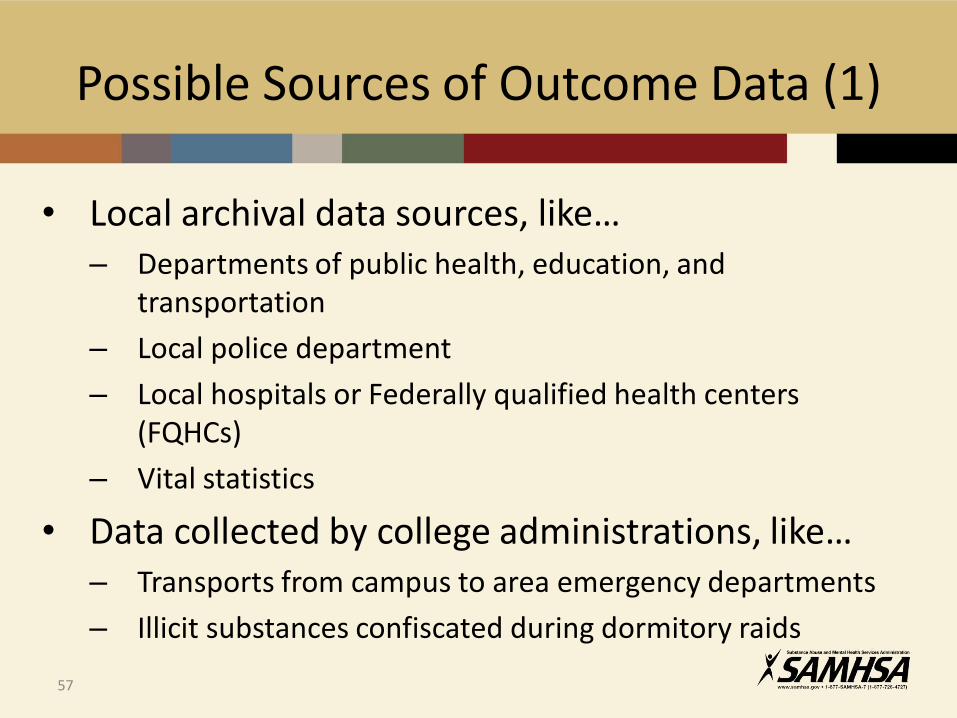
Possible Sources of Outcome Data (1)
• Local archival data sources, like…– Departments of public health, education, and
transportation
– Local police department
– Local hospitals or Federally qualified health centers (FQHCs)
– Vital statistics
• Data collected by college administrations, like…– Transports from campus to area emergency departments
– Illicit substances confiscated during dormitory raids
57

• Uniform Crime Reports (UCR) published by the Federal Bureau of Investigation
• Fatality Analysis Reporting System (FARS) maintained by the National Highway Traffic Safety Administration (NHTSA)
• Behavioral Risk Factor Surveillance System (BRFSS) maintained by the Centers for Disease Control and Prevention (CDC)
58
Possible Sources of Outcome Data (2)
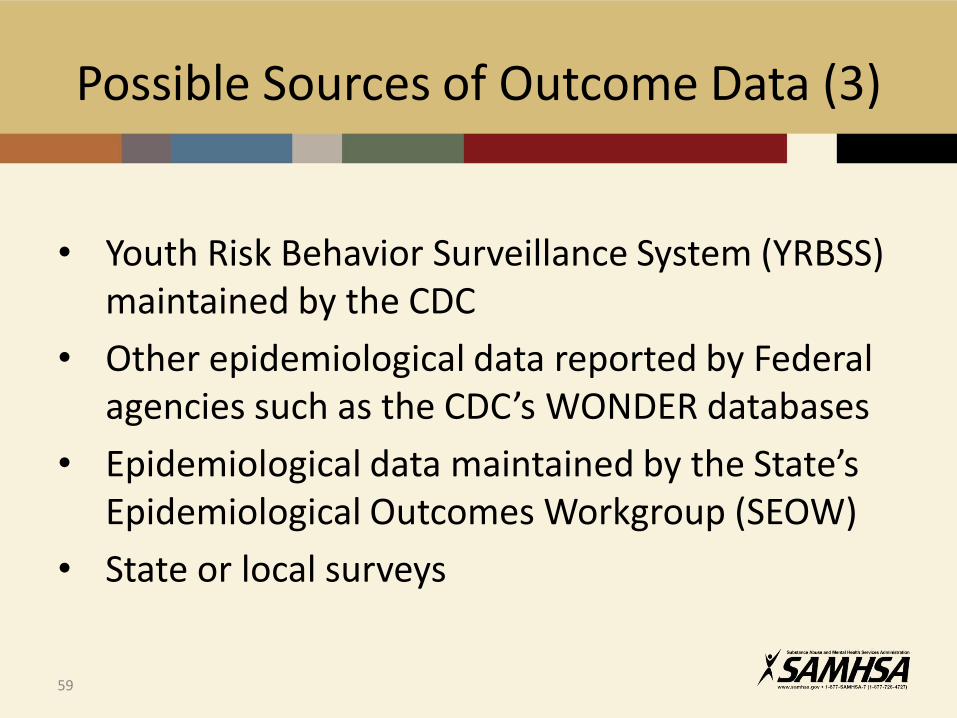
• Youth Risk Behavior Surveillance System (YRBSS) maintained by the CDC
• Other epidemiological data reported by Federal agencies such as the CDC’s WONDER databases
• Epidemiological data maintained by the State’s Epidemiological Outcomes Workgroup (SEOW)
• State or local surveys
59
Possible Sources of Outcome Data (3)

• College surveys such as CORE
• College health clinic records
• Dormitory alcohol inspection results
60
Possible Sources of Outcome Data (4)
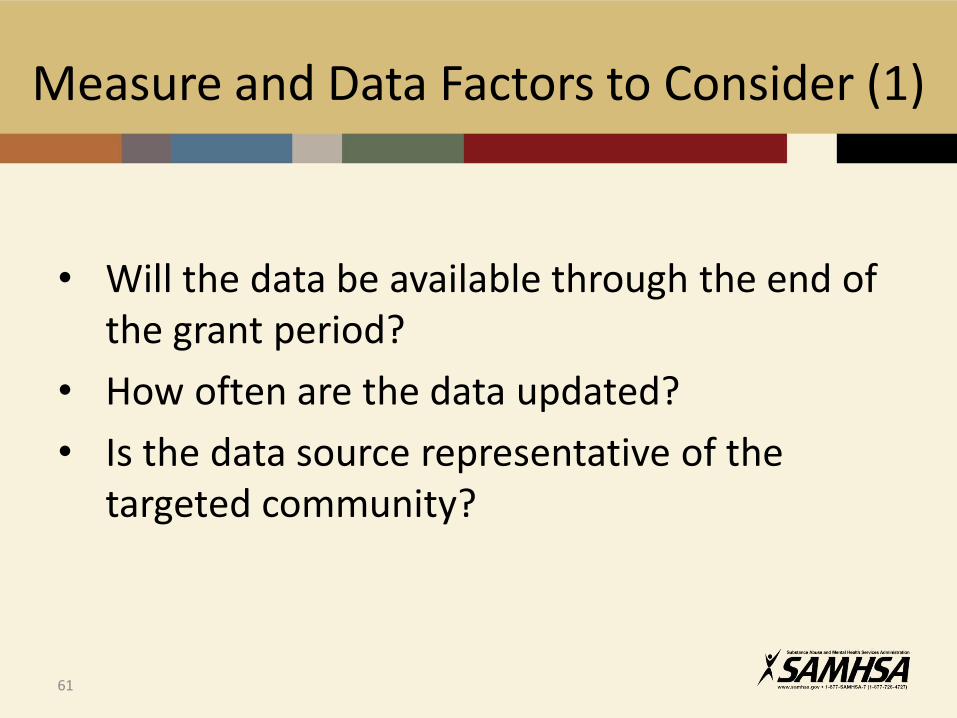
Measure and Data Factors to Consider (1)
• Will the data be available through the end of the grant period?
• How often are the data updated?
• Is the data source representative of the targeted community?
61
• Is the measure sensitive to changes in the desired outcome?
• Is the measure specific to the desired outcome?
62
Measure and Data Factors to Consider (2)
You have collected
your data….
Now what?58
Participant-Level Data Submission
Completed questionnaires and dosage forms can be entered into digital format for analysis in one of two ways:
• Online data entry system under development
• Standard templates and coding manuals under development for preparing and uploading data
60
Community-Level Data Submission
• Online data entry tool under development
• Will capture information on
– Data source (e.g. administrative, surveillance, survey, description of the population)
– Measure description (e.g. rate, percent, average)
– Calculated value – baseline value & annual updates
• Technical trainings will be provided before system launch
65

Questions?
66

Future Questions and TA Requests
E-mail: [email protected]
Phone: 866-558-0724
Your question will be triaged to a Cross-Site Team member best qualified to respond
Of course, you can always contact your SAMHSA Project Officer with your questions and TA requests
67
Webinar Satisfaction Survey
Please take a few minutes to complete the Satisfaction Survey:
https://www.surveymonkey.com/r/H6FRLZQ
68