The middle-income trap - definitions, theories and ...
37
Munich Personal RePEc Archive The middle-income trap - definitions, theories and countries concerned: a literature survey Glawe, Linda and Wagner, Helmut Fernuniversität in Hagen 9 May 2016 Online at https://mpra.ub.uni-muenchen.de/71196/ MPRA Paper No. 71196, posted 13 May 2016 04:21 UTC
Transcript of The middle-income trap - definitions, theories and ...

Munich Personal RePEc Archive
The middle-income trap - definitions,
theories and countries concerned: a
literature survey
Glawe, Linda and Wagner, Helmut
Fernuniversität in Hagen
9 May 2016
Online at https://mpra.ub.uni-muenchen.de/71196/
MPRA Paper No. 71196, posted 13 May 2016 04:21 UTC
1
THE MIDDLE-INCOME TRAP – DEFINITIONS, THEORIES AND COUN-
TRIES CONCERNED: A LITERATURE SURVEY
Linda Glawea and Helmut Wagnerb
May 2016
Abstract. In recent years, a growing body of economic literature has focused on the
phenomenon of the so-called middle-income trap (MIT). The term usually refers to
countries that have experienced rapid growth and thus quickly reached middle-income
status, but then failed to overcome that income range to further catch up to the devel-
oped countries. This paper surveys the MIT literature. It begins by laying out different
approaches to defining the MIT (with a focus on the distinction between absolute and
relative approaches) and by presenting as well as classifying the most important empir-
ical studies. After a short overview of the currently identified MIT countries, the arti-
cle summarizes the main explanatory approaches, taking into account both the theoret-
ical foundations and the empirically identified triggering factors.
JEL: O10, O40
Keywords: middle-income trap, middle-income countries, economic growth, econom-
ic development, growth slowdowns, catching up
________________________
a,b University of Hagen, Faculty of Economics, Chair of Macroeconomics, 58084 Hagen, Germany, phone +4923319872640, fax +492331987391, e-mail [email protected] and [email protected]

2
1. Introduction
During the last decade the term “middle-income trap” (MIT) has entered into common
parlance and received much attention in scientific and non-scientific literature. The
term MIT commonly refers to countries that have experienced rapid growth, which
enabled them to reach the status of a middle-income country but have not been able to
finally catch up to the developed countries and achieve high-income status – instead
they became caught in the middle-income range (the so-called MIT).
At least conceptually, the MIT is a relatively new phenomenon and was first men-
tioned in 2007 in the World Bank report An East Asian Renaissance: Ideas for Eco-
nomic Growth by Gill and Kharas (2007, p. 17–18).1 Several years later, Kharas and
Kohli (2011) made another quite early contribution by raising the following questions:
“What Is the Middle Income Trap, Why do Countries Fall into It, and How Can It Be
Avoided?” Since then, many authors have discussed these issues. Our paper gives an
overview of these research efforts. It is, in our opinion, the first comprehensive survey
on MIT, where, in contrast to the previous MIT literature surveys (e.g., Im and Rosen-
blatt, 2013; Kanchoochat, 2014; Gill and Kharas, 2015),2 we set the following empha-
ses. First, we focus on the implications of the MIT definition for the empirical results
(Who is in the MIT?). In fact, there are a large number of different MIT definitions in
the literature. We discuss how the definition differences across studies affect the com-
position of the group of MIT countries identified by the studies. In this context, we do
not only elaborate the differences between the absolute and relative MIT definition
approaches but also the differences within these two subgroups. Second, we extensive-
ly discuss the theoretical foundations of the MIT, which are now only described super-
ficially in the literature. Among others, we distinguish between empirically identified
“triggering” factors and (mathematical and descriptive) theoretical models as these two
aspects are often not analyzed separately. Third, our survey provides an up-to-date
1 However, Garrett (2004) also describes the MIT but does not mention it explicitly. 2 For example, Im and Rosenblatt (2013) focus primarily on the empirical definitions of the MIT (in particular on the distinction between the absolute and relative thresholds). Kanchoochat (2014) develops a classification of the MIT literature based on the different solutions of the MIT problem proposed by different papers. That is, she concentrates primarily on the measures a country has to adopt to avoid the MIT. Finally, Gill and Kharas (2015) mention various empirical definitions and theoretical explanations, but concentrate especially on the evaluation of their 2007 paper.

3
review of the literature, i.e., includes the recent MIT studies. Fourth, the previous MIT
literature lacks a comprehensive survey that takes into account both the different defi-
nition approaches (and the implications for the identified MIT countries) and the theo-
retical explanations. Our paper tries to close this gap by giving a detailed overview and
critical analysis of these aspects of the MIT literature.
The paper is organized as follows. Section 2 describes the growing importance of
the MIT concept in scientific and public/political debate. Section 3 discusses various
MIT definitions. Section 4 deals with the countries identified as MIT countries by dif-
ferent empirical studies. Section 5 discusses the theoretical explanations of the MIT
and the empirically identified factors that increase the probability of getting caught in
an MIT. Finally, Section 6 briefly summarizes the main results and suggests topics for
further research.
2. On the Significance of the MIT Concept
The relevance of the MIT in terms of negative welfare effects follows almost immedi-
ately from its definition. The MIT is (per its definition) associated with a relatively
sustained growth slowdown: according to some definitions, an MIT persists for at least
50 years (see Section 3). Moreover, the direct effects of an MIT (in terms of income
losses) are, in general, accompanied by indirect effects, e.g., in the form of social con-
flicts. These effects can be elucidated by referring to one of the standard examples of
an MIT country, Brazil. After previously strong per capita growth for about three dec-
ades, Brazil’s per capita income has remained nearly unchanged since 1980 (which
marked the beginning of the country’s debt crisis) and only accounted for 21.8% of the
US per capita income in 2011.3 These developments are accompanied by weak social
and institutional indicators: Brazil not only records one of the highest income inequali-
ties worldwide, measured by the Gini coefficient, which accounts to 52.9% in 2013
(World Development Indicators, World Bank, 2016), but also performed much worse
than the developed countries (e.g., the US, Europe) with respect to institutional quality,
measured by the Worldwide Governance Indicators (World Bank, 2015). For example,
in 2014, Brazil’s “Control of Corruption” indicator value (which amounted to 44) was
3 Own calculations with data from the Penn World Tables (PWT) Version 8.0.

4
more than 33 percentage points lower than the EU average and more than 50 percent-
age points lower than Germany’s. Moreover, in 2014, Brazil’s rank was even lower
than the Latin American average (which was 52). Additionally, Brazil has been con-
fronted by a wave of protests that especially concern the poor economic situation of
the country and the mismanagement by the current government. Similar developments
can be observed in various other (Latin American) countries.
Therefore, it is not surprising that since its introduction in the late 2000s, the con-
cept of the MIT has received increasingly more attention in the academic literature.
Examples are: Eichengreen et al. (2011, 2013) who warn against the dangers of an
MIT for Chinese economic growth, and Edmund Phelps who mentioned the problem
of the MIT in his speech at the 2015 Pujiang Innovation Forum, in Shanghai, against
the background of necessary political measures that China has to undertake in order to
successfully avoid it. In addition, development organizations such as the World Bank
(see e.g., Gill and Kharas, 2007; Agénor et al., 2012; Jimenez et al., 2012; Flaaen et
al., 2013; Im and Rosenblatt, 2013) and the IMF (see e.g., Aiyar et al., 2013; Cherif
and Hasanov, 2015) have drawn increasing attention to the MIT. The 2012 World
Bank report, China 2030: Building a Modern, Harmonious, and Creative Society, is
one of the most (also publically) recognized publications of these development multi-
laterals (for example, the report is also mentioned in newspaper articles, e.g., by The
Economist). Interestingly, the first appearance of the term MIT was in the context of
the East Asian economies. The following articles also frequently focus on Asian coun-
tries (furthermore, there is extensive literature on Latin American MIT countries).
Figure 1 shows the annual cumulative number of research results for the term
“middle-income trap” listed in the online research database EBSCOhost, and also pre-
sents the annual cumulative results listed in the online research database Web of Sci-
ence (by Thomas Reuters). One can easily see that, in both cases, the number of re-
search results increases significantly between 2011 and 2012. In April 2016, there are
231 total search results in EBSCOhost4 and 52 in the Web of Science5.
4 The search results of EBSCOhost are limited to academic journals (168), journals (102), working pa-pers (24), books (18), magazines (13), trade publications (7), and reports (1) between 2009 and 2016. 5 Thereby 41 articles, eight editorial materials, two reviews and one book chapter between 2007 and 2016.

5
Figure 1. Search results for the term “middle-income trap”.
Source: EBSCOhost, Web of Science (Core Collection, by Thomas Reuters). Note:
The vertical axis shows the absolute number of search results. The search results from
EBSCOhost are limited to (academic) journals, working papers, books, magazines,
trade publications, and reports between 2009 and 2016.
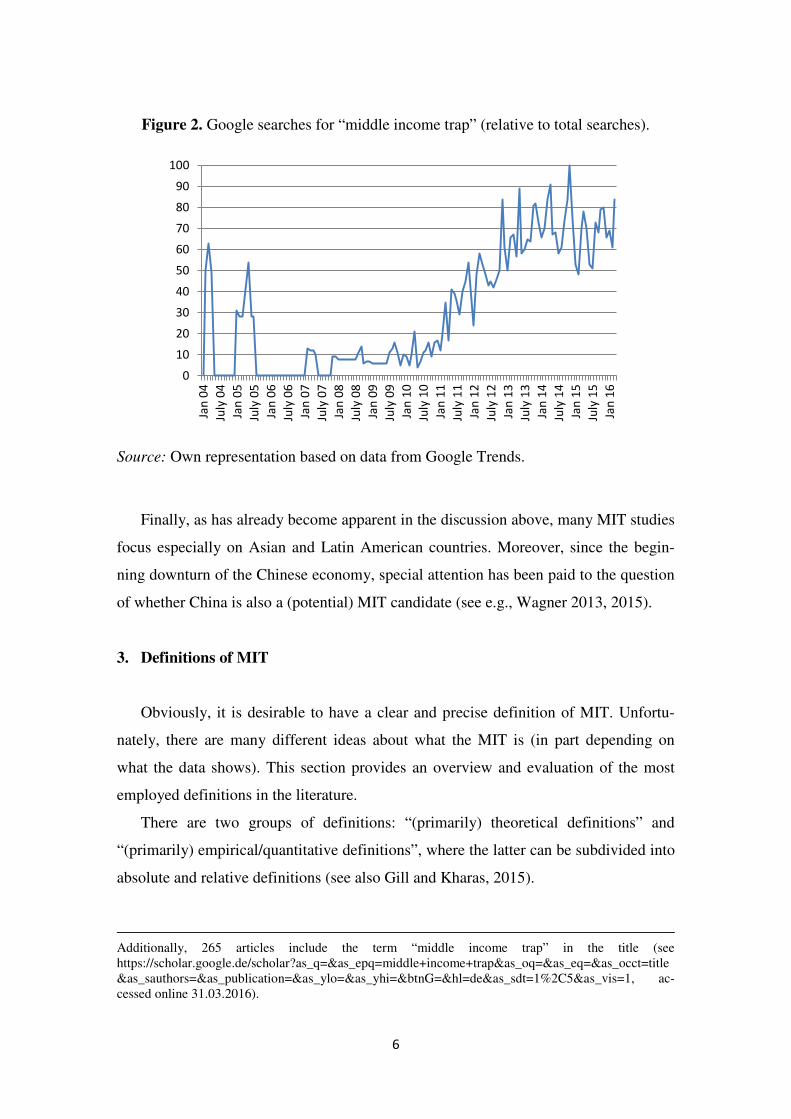
Inspired by Gill and Kharas (2015), Figure 2 shows the relative total searches in
Google Trends for the term “middle income trap” (extended with new data for the
years 2015 and 2016), illustrating the increasing interest since 2011.6 However, in con-
trast to the older data, it becomes apparent that this term was recognized before (alt-
hough it was not literally mentioned in the academic literature at that time), and that
there has, again, been a strong upward trend since the beginning of 2016.7 Meanwhile
there are more than 3,700 articles on Google Scholar dealing with the MIT, 3,260 re-
lating to China.8
6 Google Trends, Search Term: “middle income trap”, accessed online 31.03.2016. Information Google Trends: “Numbers represent search interest relative to the highest point on the chart. If at most 10% of searches for the given region and time frame were for ["middle income trap" it is considered] 100. This doesn't convey absolute search volume.” Gill und Kharas (2015) also refer to Google Trends. 7 Since the beginning of the slowdown of the Chinese economy in recent years, Google Searches for the term “middle income trap China” also show an upward trend. See Figure A.1 in Appendix A. 8 See https://scholar.google.de/scholar?q=+%22middle+income+trap%22+&btnG=&hl=de&as_sdt=1%2C5&as_vis=1, accessed online 31.03.2016 and https://scholar.google.de/scholar?q=+%22middle +income+trap%22+china&btnG=&hl=de&as_sdt=1%2C5&as_vis=1, accessed online 31.03.2016.
0
50
100
150
200
250
2007 2009 2010 2011 2012 2013 2014 2015 2016
EBSCOhost
Web of Science Database
6
Figure 2. Google searches for “middle income trap” (relative to total searches).
Source: Own representation based on data from Google Trends.
Finally, as has already become apparent in the discussion above, many MIT studies
focus especially on Asian and Latin American countries. Moreover, since the begin-
ning downturn of the Chinese economy, special attention has been paid to the question
of whether China is also a (potential) MIT candidate (see e.g., Wagner 2013, 2015).
3. Definitions of MIT
Obviously, it is desirable to have a clear and precise definition of MIT. Unfortu-
nately, there are many different ideas about what the MIT is (in part depending on
what the data shows). This section provides an overview and evaluation of the most
employed definitions in the literature.
There are two groups of definitions: “(primarily) theoretical definitions” and
“(primarily) empirical/quantitative definitions”, where the latter can be subdivided into
absolute and relative definitions (see also Gill and Kharas, 2015).
Additionally, 265 articles include the term “middle income trap” in the title (see https://scholar.google.de/scholar?as_q=&as_epq=middle+income+trap&as_oq=&as_eq=&as_occt=title&as_sauthors=&as_publication=&as_ylo=&as_yhi=&btnG=&hl=de&as_sdt=1%2C5&as_vis=1, ac-cessed online 31.03.2016).
0
10
20
30
40
50
60
70
80
90
100
Jan
04
July
04
Jan
05
July
05
Jan
06
July
06
Jan
07
July
07
Jan
08
July
08
Jan
09
July
09
Jan
10
July
10
Jan
11
July
11
Jan
12
July
12
Jan
13
July
13
Jan
14
July
14
Jan
15
July
15
Jan
16

7
The first group (theoretical definitions) especially covers the initial MIT articles
(e.g., Garrett, 2004; Gill and Kharas, 2007; Ohno, 2009; Kharas and Kohli, 2011).
They focus on the necessary political and institutional adjustments required when a
country enters the middle-income range. In this sense, the authors define the MIT as a
result of missing structural and institutional reforms (a kind of political failure). For
example, Gill and Kharas (2007, p. 5), characterize MIT countries as being “squeezed
between the low-wage poor country competitors that dominate in mature industries
and the rich-country innovators that dominate in industries undergoing rapid techno-
logical change”. According to Kharas and Kohli (2011, p. 282), countries are caught in
the MIT if they “cannot make a timely transition from resource-driven growth, with
low-cost labor and capital, to productivity-driven growth”. In a similar way, Garrett
(2004, pp. 93–94), argues that middle-income countries (MICs) have to “find ways to
‘tech up’ and enter the global knowledge economy, so as to escape the trap of having
to dumb down to compete in standardized manufacturing”.
The main problem with these definitions is the fact that they do not allow an un-
ambiguous answer to the question whether a country is in an MIT or not, thereby leav-
ing too much scope for interpretation. Therefore, we focus on the second group of def-
initions (empirical/quantitative definitions) that require a more precise definition of the
different components of the term MIT, namely “middle-income” and “trap”.
The latter term (trap) is quite easy to define as it has been used for a long time in
the growth literature. For example, Matsuyama (2008) and Azariadiz and Stachurski
(2005) particularly emphasize the following main characteristics of a trap:
• a self-perpetuating or self-reinforcing mechanism
• difficulty breaking out of it
• its persisting character (“stable steady state”).
These characteristics, originally used to define a poverty trap (which applies to
very poor countries), are also used in MIT definitions (see e.g., Cai, 2012; Im and Ros-
enblatt, 2013). The last point (persisting character), particularly, has been implemented
in empirical definitions of MIT (see Sections 2.1., 2.2. and Table 2). For example,
Woo et al.’s (2012) definition refers to an MIT period that is longer than 50 years. Ac-
8
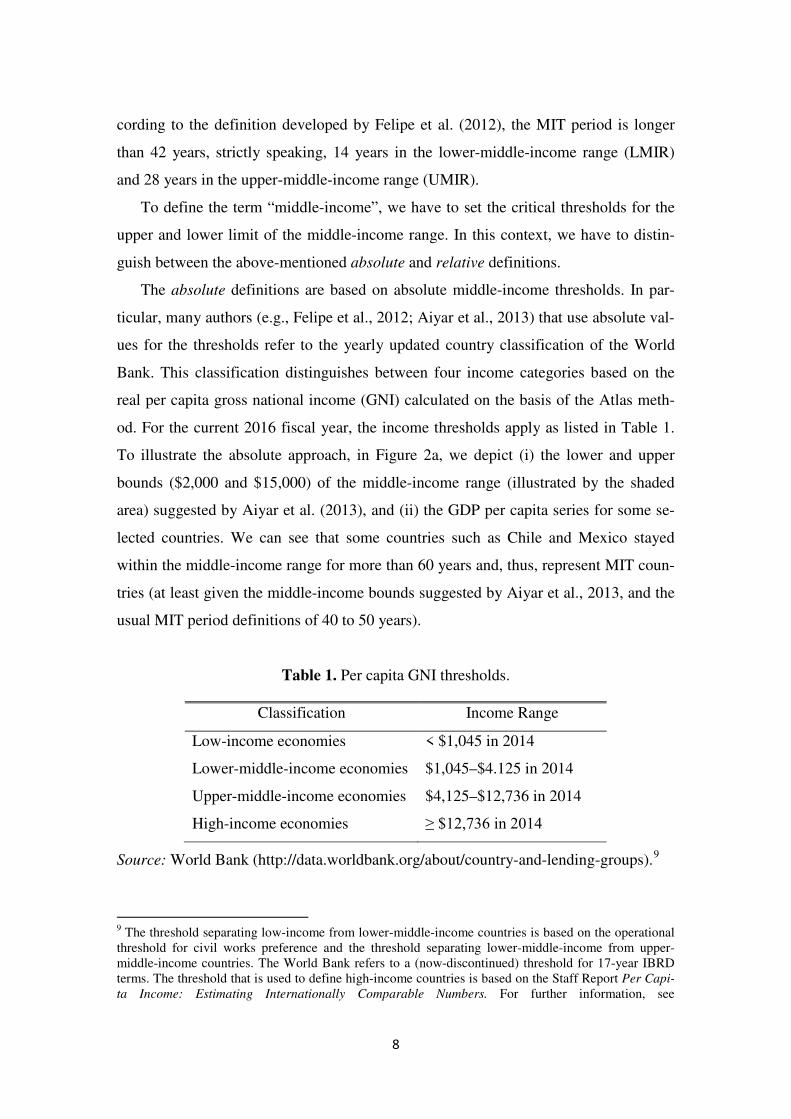
cording to the definition developed by Felipe et al. (2012), the MIT period is longer
than 42 years, strictly speaking, 14 years in the lower-middle-income range (LMIR)
and 28 years in the upper-middle-income range (UMIR).
To define the term “middle-income”, we have to set the critical thresholds for the
upper and lower limit of the middle-income range. In this context, we have to distin-
guish between the above-mentioned absolute and relative definitions.
The absolute definitions are based on absolute middle-income thresholds. In par-
ticular, many authors (e.g., Felipe et al., 2012; Aiyar et al., 2013) that use absolute val-
ues for the thresholds refer to the yearly updated country classification of the World
Bank. This classification distinguishes between four income categories based on the
real per capita gross national income (GNI) calculated on the basis of the Atlas meth-
od. For the current 2016 fiscal year, the income thresholds apply as listed in Table 1.
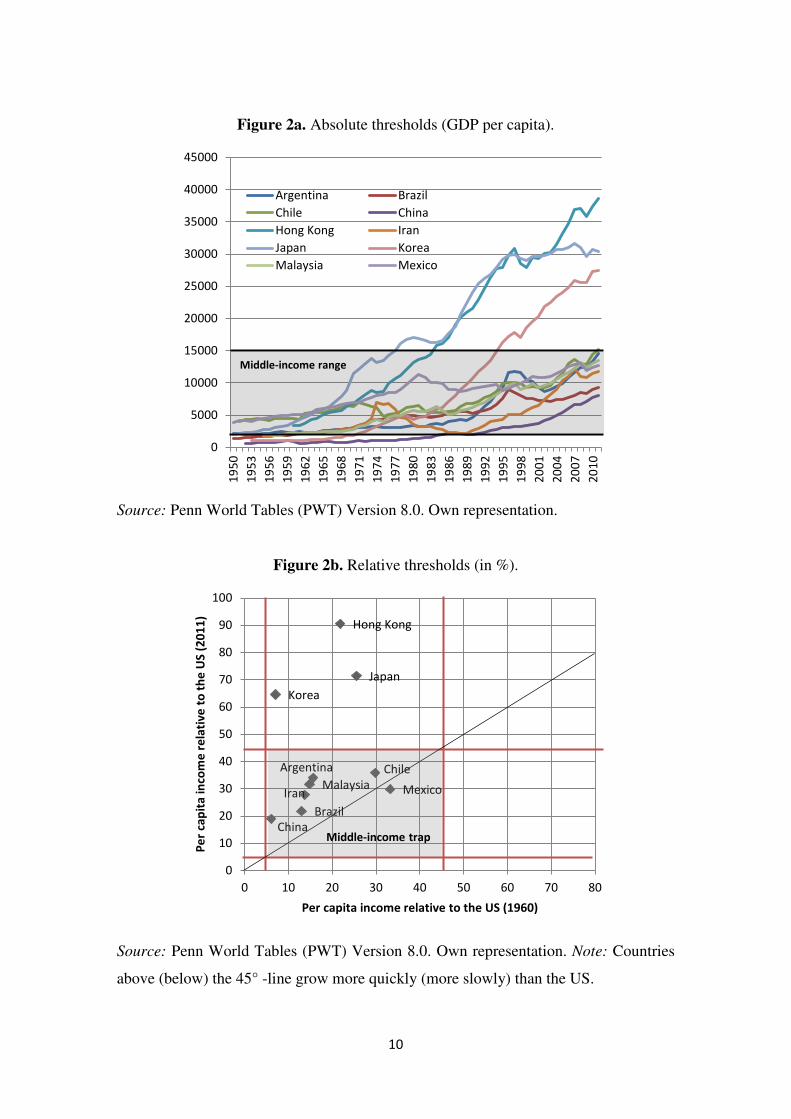
To illustrate the absolute approach, in Figure 2a, we depict (i) the lower and upper
bounds ($2,000 and $15,000) of the middle-income range (illustrated by the shaded
area) suggested by Aiyar et al. (2013), and (ii) the GDP per capita series for some se-
lected countries. We can see that some countries such as Chile and Mexico stayed
within the middle-income range for more than 60 years and, thus, represent MIT coun-
tries (at least given the middle-income bounds suggested by Aiyar et al., 2013, and the
usual MIT period definitions of 40 to 50 years).
Table 1. Per capita GNI thresholds.
Classification Income Range
Low-income economies < $1,045 in 2014
Lower-middle-income economies $1,045–$4.125 in 2014
Upper-middle-income economies $4,125–$12,736 in 2014
High-income economies ≥ $12,736 in 2014
Source: World Bank (http://data.worldbank.org/about/country-and-lending-groups).9
9 The threshold separating low-income from lower-middle-income countries is based on the operational threshold for civil works preference and the threshold separating lower-middle-income from upper-middle-income countries. The World Bank refers to a (now-discontinued) threshold for 17-year IBRD terms. The threshold that is used to define high-income countries is based on the Staff Report Per Capi-
ta Income: Estimating Internationally Comparable Numbers. For further information, see

9
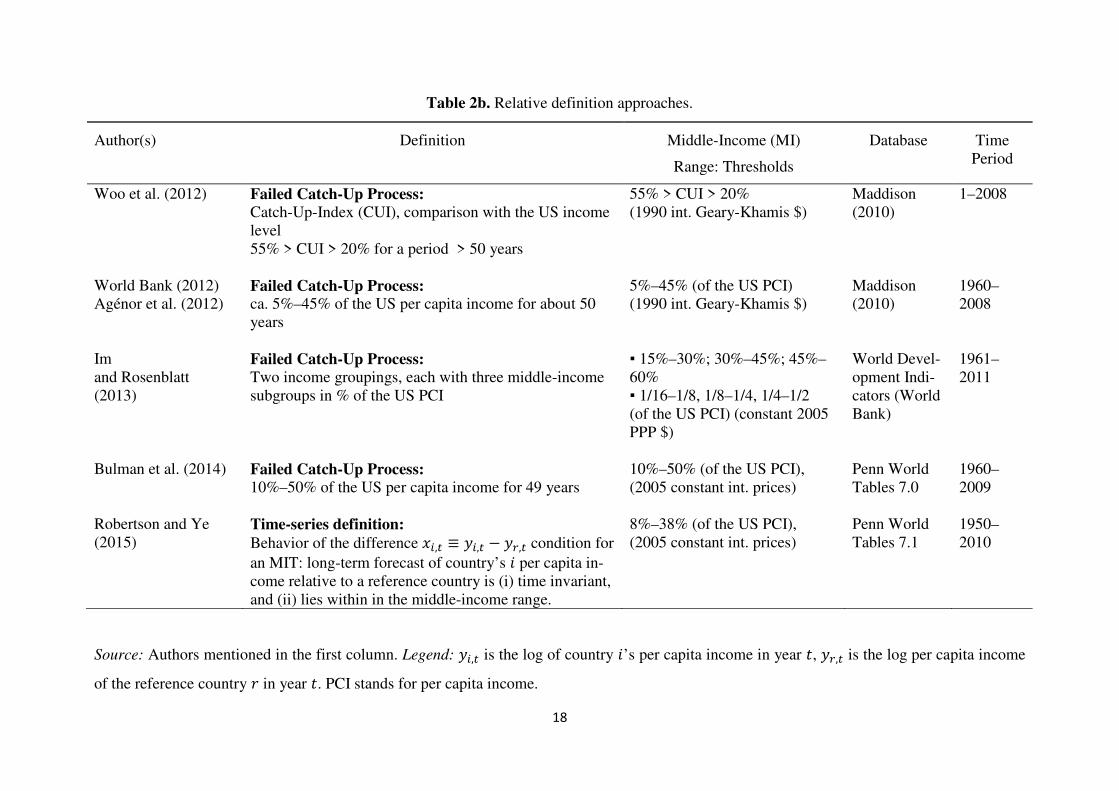
In contrast, the relative approach usually refers to the per capita income relative to
the US or another developed country. For example, Woo et al. (2012) define the mid-
dle-income range between 20% and 55% of the US per capita income. Alternatively,
Robertson and Ye (2015) argue that a country is in the middle-income range when its
per capita income is 8%–38% relative to the US’s. To illustrate the relative approach,
in Figure 2b we depict the relative thresholds suggested by the World Bank (2012).
The shaded area denotes the countries that were in the middle-income range between
1960 and 2011. Therefore, according to this definition, Argentina, Brazil, China, Iran,
Malaysia, and Mexico would be classified as MIT countries. Interestingly, according
to the World Bank definition, China is already in the MIT, contrasting the results of
the majority of other empirical studies.
Note that the thresholds used in Figures 2a and 2b, namely the thresholds suggest-
ed by Aiyar et al. (2013) and the World Bank (2012), are only examples of the many
different thresholds used within each definition group. That is, there are significant
differences in the thresholds within the group of absolute definitions and within the
group of relative definitions (see e.g., Tables 2a and 2b). These differences lead to
great variations in the empirical results (Who is in the MIT?) within each group (and
across groups), as we will discuss in Section 4.
https://datahelpdesk.worldbank.org/knowledgebase/articles/378833-how-are-the-income-group-thresholds-determined.
10
Figure 2a. Absolute thresholds (GDP per capita).
Source: Penn World Tables (PWT) Version 8.0. Own representation.
Figure 2b. Relative thresholds (in %).
Source: Penn World Tables (PWT) Version 8.0. Own representation. Note: Countries
above (below) the 45° -line grow more quickly (more slowly) than the US.
0
5000
10000
15000
20000
25000
30000
35000
40000
45000
19
50
19
53
19
56
19
59
19
62
19
65
19
68
19
71
19
74
19
77
19
80
19
83
19
86
19
89
19
92
19
95
19
98
20
01
20
04
20
07
20
10
Argentina Brazil
Chile China
Hong Kong Iran
Japan Korea
Malaysia Mexico
Middle-income range
Argentina
Brazil
Chile
China
Hong Kong
Iran
Japan
Korea
Malaysia Mexico
0
10
20
30
40
50
60
70
80
90
100
0 10 20 30 40 50 60 70 80
Pe
r ca
pit
a i
nco
me
re
lati
ve
to
th
e U
S (
20
11
)
Per capita income relative to the US (1960)
Middle-income trap

11
Im and Rosenblatt (2013) emphasize that the choice of the definition approach
does not only have strong implications for the descriptive statistics but is also relevant
for the type of analysis. The relative approaches are a good choice for analyzing abso-
lute convergence, or the income distribution between several countries. In contrast, the
absolute approaches appear to be more appropriate for addressing the question of why
some countries enter a period of stagnation (Im and Rosenblatt, 2013). Cherif and
Hasanov (2015) base their decision to use relative income thresholds on the fact that
the main development objective of every country is to reach the living standards of the
most advanced economies. The relative approach allows measuring how far an econo-
my is away from reaching this goal. Cai (2012) puts forward a similar argumentation.
The next subsection presents some of the most important absolute approaches
(Eichengreen et al., 2011, 2013; Felipe et al., 2012; Aiyar et al., 2012) followed by a
selection of relative definitions (Woo, 2011; World Bank, 2012; Agénor et al., 2012;
Im and Rosenblatt, 2013; Bulman et al., 2014; Robertson and Ye, 2015). Tables 2a and
2b then summarize the different definitions, the middle-income ranges, the database
used and the covered period of the absolute approaches and the relative approaches,
respectively.
3.1. Absolute Approaches
Eichengreen et al. (2011, 2013) define the MIT as a growth slowdown in emerging
market economies. According to their definition, a country experiences a growth slow-
down at time 𝑡𝑡 if, and only if: (1) the seven-year average growth rate of real per capita
income is 3.5% or greater prior to 𝑡𝑡; (2) after 𝑡𝑡, the growth rate is lower by at least two
percentage points; and (3) the per capita income is greater than $10,000 at 𝑡𝑡. Eichen-
green et al. (2013) come to the conclusion that growth slowdowns typically occur at
two different per capita income ranges, namely between $10,000 and $11,000, and
between $15,000 and $16,000. These results differ from the results of their 2011 study
in which they only identified the $15,000 to $16,000 range. It is important to note that
Eichengreen et al. (2013) used an updated version (Version 7.1) of the Penn World
Tables (PWT) database in contrast to Eichengreen et al. 2011 (who used Version 6.3).
Although it is still the same source, the data differs significantly, meaning some coun-

12
tries are no longer identified as MIT countries. This example illustrates the key weak-
ness of empirical MIT definitions. They are data sensitive, i.e., valid only for the data
source used to formulate the middle-income range. This fact reduces (a) the compara-
bility of the results and definitions across different studies, and (b) the theoretical in-
terpretability of the empirical findings (e.g., how can a change in the PWT version be
theoretically interpreted?); in other words, the definitions lose their generality and are
not separable from the data. This problem does not arise in theoretically founded MIT
definitions, which are formulated without a relation to a specific data source. This cri-
tique is closely related to another critique of empirical MIT definitions: Empirical def-
initions have no theoretical foundations that can be used to check whether the observed
MIT is merely a statistical singularity, an outcome of (unintended) selective data
choice, or a (theoretically) relevant economic phenomenon that (a) is independent of
space and time (of observation), and (b) can be expected to occur in the future as well.
Felipe et al. (2012) and Aiyar et al. (2013) come to similar results. Felipe et al.
(2012) distinguish between a lower and a higher MIT. Contrary to many other authors,
they focus on the average number of years a country has spent in the lower-middle-
income range ($2,000 to $7,250), or the upper-middle-income range ($7,250 to
$11,750) before it steps into the next higher income category. Their research results
indicate that a country has to overcome the LMIR in at most 28 years and the UMIR in
at most 14 years, respectively. To achieve this (i.e., to escape the MIT), a middle-
income country has to attain an average growth rate of at least 4.7% p.a. in the LMIR
and 3.5% in the UMIR.
Despite some similarities (particularly with regard to the definition of the MIT as
a growth slowdown), Aiyar et al.’s (2013) approach differs significantly from the ap-
proach of Eichengreen et al. (2013) with respect to the measurement method. Aiyar et
al. (2013) try to develop an approach that is better grounded in growth theory. The
MIT is considered as a special case of a growth slowdown, which in turn is defined as
a large, sudden, and persistent deviation of the growth path predicted by a conditional
convergence framework. Aiyar et al. (2013) use annual per capita income data for 138
countries over 11 periods (between 1955 and 2009). First, a regression is performed,
using per capita income growth rate (strictly speaking: the five-year rolling geometric
average) as the dependent variable and the lagged income level as well as (human)
13
capital as the independent variable. This regression yields a predicted growth rate for
every country at any given point in time. Aiyar et al. (2013) define a residual (𝑟𝑟𝑟𝑟𝑟𝑟𝑖𝑖𝑡𝑡) as
the difference between the actual and the predicted growth rate (of country 𝑖𝑖 at time 𝑡𝑡). According to their definition, the country 𝑖𝑖 experiences a growth slowdown if the re-
sidual of country 𝑖𝑖 in period 𝑡𝑡 is considerably smaller than that in the previous period
(𝑡𝑡 − 1) and also stays smaller in the following period (𝑡𝑡 + 1), where the period length
is five years. Overall, this means that the drop in growth has to be strong and sustained
(i.e. lasting for at least 10 years) to be classified as a growth slowdown. In their analy-
sis, the authors identify 123 growth slowdowns since 1960, which correspond to
around 11% of the total sample. Furthermore, they come to the conclusion that middle-
income countries are more likely to experience a growth slowdown than upper- or
lower-income countries. Regarding the classification, the authors choose a 2/15 defini-
tion, i.e., the upper and lower bound of an MIC is $2,000 and $15,000, respectively.
They also verify their results for 15 different middle-income ranges with the lower
threshold varying between $1,000 and $3,000, and the upper threshold between
$12,000 and $16,000, respectively (both in increments of thousands). Thus, the differ-
ent income ranges also have different lengths.

14
Table 2a. Absolute definition approaches.
Author(s) Definition Middle-Income Range: Thresholds
Database
Time Period
Eichengreen et al. (2011)
Growth Slowdown (GS) 𝑔𝑔𝑡𝑡,𝑡𝑡−𝑛𝑛 ≥ 0.035, 𝑔𝑔𝑡𝑡,𝑡𝑡+𝑛𝑛 − 𝑔𝑔𝑡𝑡,𝑡𝑡−𝑛𝑛 ≥ 0,02, 𝑦𝑦𝑡𝑡 ≥ 10,000
GS occurs typically between $15,000–$16,000 (PCI)
> $10,000 (2005 constant int. prices)
Penn World Ta-bles 6.3
1957–2007
Eichengreen et al. (2013)
Growth Slowdown (GS) 𝑔𝑔𝑡𝑡,𝑡𝑡−𝑛𝑛 ≥ 0.035, 𝑔𝑔𝑡𝑡,𝑡𝑡+𝑛𝑛 − 𝑔𝑔𝑡𝑡,𝑡𝑡−𝑛𝑛 ≥ 0,02, 𝑦𝑦𝑡𝑡 ≥ 10.000
GS between $10,000–$11,000 and $15,000–$16,000 (PCI)
> $10,000 (2005 constant int. prices)
Penn World Ta-bles 7.1
1957–2010
Felipe et al. (2012) Above-Average Time Spent in the Middle-Income Range
> 28 years in the LMIR (average growth rate of at least 4.7% to avoid the MIT) > 14 years in the UMIR (average growth rate of at least 3.5% to avoid the MIT)
$2,000–$11,750 (constant 1990 PPP $)
Maddison (2010), IMF da-tabase (April 2011)
1950–2010
Aiyar et al. (2013) Growth Slowdown (GS)
the residual (𝑟𝑟𝑟𝑟𝑟𝑟𝑖𝑖𝑡𝑡) of country 𝑖𝑖 at point 𝑡𝑡 is “much” smaller
than in the previous period (𝑡𝑡 − 1) and also stays “much” smaller in the following period (𝑡𝑡 + 1)
$2,000–$15,000 (varying, 2005 con-stant int. prices)
IMF staff calculation
1955–2009
Source: Authors mentioned in the first column. Legend: 𝑔𝑔𝑡𝑡,𝑡𝑡+𝑛𝑛 (𝑔𝑔𝑡𝑡,𝑡𝑡−𝑛𝑛) stands for the average growth rate of the real per capita income between
year 𝑡𝑡 and 𝑡𝑡 + 𝑛𝑛 (between year 𝑡𝑡 − 𝑛𝑛 and 𝑡𝑡). 𝑦𝑦𝑡𝑡 refers to the per capita GDP at time 𝑡𝑡. PCI stands for per capita income and PPP for purchasing
power parity.

15
3.2. Relative Approaches
In addition to the previously discussed absolute approaches, there is also an increasing
number of relative MIT definitions which focus on the (failed) catching up process
(relative to a developed country such as the US or Japan).
Woo et al. (2012) construct a Catch-Up Index (CUI), in which values are ex-
pressed as a percentage of the US per capita income by using population and GDP data
from Maddison (2010), (the latter measured in 1990 Geary-Khamis dollars).10 Accord-
ing to the authors, middle-income countries have a CUI between 20% and 55%. Woo
et al. (2012) base their decision to use these thresholds on the fact that most Western
European countries belong to the high-income group, whereas the majority of sub-
Saharan countries are low-income economies. However, Woo et al. (2012) note that
the results also apply for a wider range, between 15% and 60% of the US per capita
income. Unless these MICs are able to achieve US living standards within approxi-
mately 50 years, they are (regarded to be) caught in the MIT.
Agénor et al. (2012) and the World Bank (2012) are also orientated toward the rel-
ative approach (at least in their figures). Again, the US is chosen as the reference coun-
try. A country experiences an MIT if it stays within the range of roughly 5% to 45% of
the US per capita income (again, in 1990 international Geary-Khamis dollars) in the
period from 1960 to 2009.11
Im and Rosenblatt (2013) also prefer a relative definition approach. They focus on
the probability of a country entering the next income category. Contrary to most of the
other articles, they use a trisection of the middle-income range in “lower-middle”,
“middle-middle”, and “upper-middle”. Furthermore, they use two different income
classifications: (1) < 15%, 15%–30%, 30%–45%, 45%–60%, and > 60% of the US
income; (2) < 1/16, 1/16–1/8, 1/8–1/4, 1/4–1/2 and > 1/2 of the US income, where the
values in bold indicate the tripartite middle-income range. Im and Rosenblatt (2013)
use per capita GDP data from Maddison (2010) for 127 countries within the period
from 1950 to 2008. They come to the conclusion that the transition from upper-middle
10 This approach is also used in some other publications, e.g., in Athukorala and Woo (2011). 11 See World Bank (2012, p. 12) and Agénor et al. (2012, p. 2), Fig. 1 (e1,6 ≈ 5 % and e1,8 ≈ 45 %, re-spectively). The authors refer here to the above-mentioned income classification of the World Bank (see Table 1 and footnote 11).
16
to high-income status is just as likely as the transition from the lower-middle to upper-
middle range. Therefore, they doubt the existence of the MIT. However, it is question-
able how far these results are due to the trisection of the middle-income range. It
would therefore be interesting to see how results change if one only uses two middle-
income sub-categories, as most of the other authors do.
Bulman et al. (2014) distinguish between “escapees” and “non-escapees”. Their
results show that escapees grow rapidly at all income levels (and all income ranges),
whereas non-escapees tend to grow slowly at any development stage (not only within
the middle-income range). Thus, their results do not support the idea of the MIT as a
prolonged growth slowdown at the middle-income range. Nevertheless, their analysis
implies an MIT definition that belongs to the relative definition approach12: they set
the lower- and upper-middle-income range thresholds at 10% and 50% of the US per
capita GDP (using data from the PWT 7.0).13 A country becomes a non-escapee of the
middle-income range if it remains within this range for the period from 1960 to 2009
(and alternatively between 1970 and 2009 due to data availability) and is not able to
reach high-income status (> 50% of the US per capita GDP).
Finally, Robertson and Ye (2015) develop a relative approach that is consistent
with the idea of club convergence and construct a “time-series definition” of the MIT.
They focus on the behavior of the log income gap 𝑥𝑥𝑖𝑖,𝑡𝑡 ≡ 𝑦𝑦𝑖𝑖,𝑡𝑡 − 𝑦𝑦𝑟𝑟,𝑡𝑡, where 𝑦𝑦𝑖𝑖,𝑡𝑡 is the
log of a country 𝑖𝑖’s per capita income in year 𝑡𝑡, and 𝑦𝑦𝑟𝑟,𝑡𝑡 is the log per capita income of
the reference country 𝑟𝑟 in year 𝑡𝑡, respectively. According to the authors, a country has
to satisfy the following conditions to be classified as an MIT country: the country 𝑖𝑖’s
per capita income (at 2005 constant prices, PPP adjusted) relative to the reference
country 𝑟𝑟 (a) has to be time invariant, and (b) has to lie within the middle-income
range, which is said to be 8%–36% of the US per capita GDP. The authors employ
these thresholds because they define middle-income countries as the middle 40% of
countries ranked by per capita income.
12 However, Bulman et al. (2014) could also be assigned to the theoretical definition approach as they also (additionally) define the MIT as a failed growth strategy of a middle-income country (see Bulman et al., 2014, p. 2). 13 Bulman et al. (2014) do not justify this choice of income thresholds but generalize it later to some extent.

17
Before we turn to the MIT countries identified in some of the above-mentioned ar-
ticles, in the next section, we take a brief look at an interesting aspect regarding data
choice in the previous literature. Three databases are frequently used to calculate the
GDP per capita and the corresponding growth rate. As shown in Table 2, most of the
authors use data from the Penn World Tables, the World Bank’s WDI, and the Maddi-
son (2010) database. Another comprehensive dataset is provided by Barro and Ursua
(2010), however, this dataset is still rarely used in academic literature. A revision of
the analysis using this data could make an additional contribution, since, as discussed
in Section 2.1, results seem to be sensitive to data choice. Moreover, the large number
of different middle-income categorizations used in the relative as well as in the abso-
lute approaches highlights the arbitrary nature of the choice of thresholds. As we will
see in Section 4, this also has strong implications for the number of identified MIT
countries.
18
Table 2b. Relative definition approaches.
Author(s) Definition Middle-Income (MI)
Range: Thresholds
Database
Time Period
Woo et al. (2012) Failed Catch-Up Process:
Catch-Up-Index (CUI), comparison with the US income level 55% > CUI > 20% for a period > 50 years
55% > CUI > 20% (1990 int. Geary-Khamis $)
Maddison (2010)
1–2008
World Bank (2012) Agénor et al. (2012)
Failed Catch-Up Process: ca. 5%–45% of the US per capita income for about 50 years
5%–45% (of the US PCI) (1990 int. Geary-Khamis $)
Maddison (2010)
1960–2008
Im and Rosenblatt (2013)
Failed Catch-Up Process:
Two income groupings, each with three middle-income subgroups in % of the US PCI
▪ 15%–30%; 30%–45%; 45%–60% ▪ 1/16–1/8, 1/8–1/4, 1/4–1/2 (of the US PCI) (constant 2005 PPP $)
World Devel-opment Indi-cators (World Bank)
1961–2011
Bulman et al. (2014)
Failed Catch-Up Process:
10%–50% of the US per capita income for 49 years
10%–50% (of the US PCI), (2005 constant int. prices)
Penn World Tables 7.0
1960–2009
Robertson and Ye (2015)
Time-series definition:
Behavior of the difference 𝑥𝑥𝑖𝑖,𝑡𝑡 ≡ 𝑦𝑦𝑖𝑖,𝑡𝑡 − 𝑦𝑦𝑟𝑟,𝑡𝑡 condition for
an MIT: long-term forecast of country’s 𝑖𝑖 per capita in-come relative to a reference country is (i) time invariant, and (ii) lies within in the middle-income range.
8%–38% (of the US PCI), (2005 constant int. prices)
Penn World Tables 7.1
1950–2010
Source: Authors mentioned in the first column. Legend: 𝑦𝑦𝑖𝑖,𝑡𝑡 is the log of country 𝑖𝑖’s per capita income in year 𝑡𝑡, 𝑦𝑦𝑟𝑟,𝑡𝑡 is the log per capita income
of the reference country 𝑟𝑟 in year 𝑡𝑡. PCI stands for per capita income.

19
4. Countries in the MIT
This section deals with the countries identified as MIT countries by different empirical stud-
ies.
The World Bank (2012) study is one of the most cited analyses in the MIT literature. The
authors present their results in a matrix with the field in the middle illustrating/presenting the
MIT. Of 101 middle-income countries in 1960, only 13 had managed to reach high-income
status by 2008, namely Equatorial Guinea, Greece, Hong Kong, Ireland, Israel, Japan, Mauri-
tius, Portugal, Puerto Rico, South Korea, Singapore, Spain, and Taiwan. Most of the remain-
ing 88 MIT countries are located in Latin America and the Middle East (see World Bank
2012, p. 12). Moreover, emphasis is placed on the fact that Latin American countries espe-
cially, and countries in the Middle East are subject to the MIT.
Felipe et al. (2012) identify 52 MICs in 2010, thereof 38 in the upper- and 14 in the low-
er-middle-income range. Thirty-five of these countries are caught in an MIT (30 in a lower
and five in a higher MIT).14 Additionally, eight countries are classified as potential MIT can-
didates (three for a lower and five for an upper MIT).15
Woo et al. (2012) focus on Latin American and East Asian economies. Following their
relative CUI approach, they identify five MIT countries in Latin America (namely Argentina,
Brazil, Chile, Mexico, and Venezuela).
Bulman et al. (2014) analyze the movement of countries between the three income cate-
gories during the period from 1960 (1970) to 2009 by using relative thresholds. As already
mentioned, the authors generally reject the existence of the MIT in the sense that (fast grow-
ing) countries inevitably become trapped after they achieved middle-income status. However,
they concede that some countries are nonetheless trapped within the middle-income range: of
41 middle-income countries in 1960, 10 were able to achieve high-income status (namely
Greece, Hong Kong, Ireland, Japan, Korea, Puerto Rico, Seychelles, Singapore, Spain, and
Taiwan),16 whereas 24 remained within the middle-income range and seven countries fell
14 Namely Albania, Algeria, Bolivia, Botswana, Brazil, Colombia, Congo (Rep.), Dominican Republic, Ecuador, Egypt, El Salvador, Gabon, Guatemala, Iran, Jamaica, Kenya, Jordan, Lebanon, Libya, Malaysia, Morocco, Namibia, Panama, Paraguay, Peru, Philippines, Romania, Saudi Arabia, South Africa, Sri Lanka, Swaziland, Syrian Arab Republic, Tunisia, Uruguay, Venezuela, Yemen (Rep.). Countries in bold are caught in the up-per-middle-income trap. 15 For example, according to the authors, Indonesia and Pakistan may soon enter a lower-middle-income trap. In addition, Poland, Oman, Mexico and Hungary are possible upper-middle-income-trap candidates (see Felipe et al., 2012 and Appendix Table 1.A). 16 In contrast to the World Bank (2012), Bulman et al. (2014) do not identify Equatorial Guinea, Israel, Mauri-tius, and Portugal as middle-income escapees.

20
back to the low-income group.17 In particular, they identify non-escapees in Latin America
(e.g., Mexico and Brazil), in Asia (e.g., Malaysia and Turkey) as well as in Europe (e.g., Por-
tugal and Cyprus).
Zhuang et al. (2015) categorize 125 countries with the help of an absolute approach (per
capita GNI in 2011 $). They identify 28 countries who have not managed to overcome mid-
dle-income status since 1987 – the year the income classification was introduced.18 Moreover,
using an extrapolation, they come to the conclusion that 18 of these countries have belonged
to the MIC group since 1962, which implies that they have been caught in an MIT for more
than 50 years (of these 18 countries, twelve are located in Latin America and three in Asia). In
accordance with the World Bank (2012) study, primarily Latin American and Asian countries
are affected.
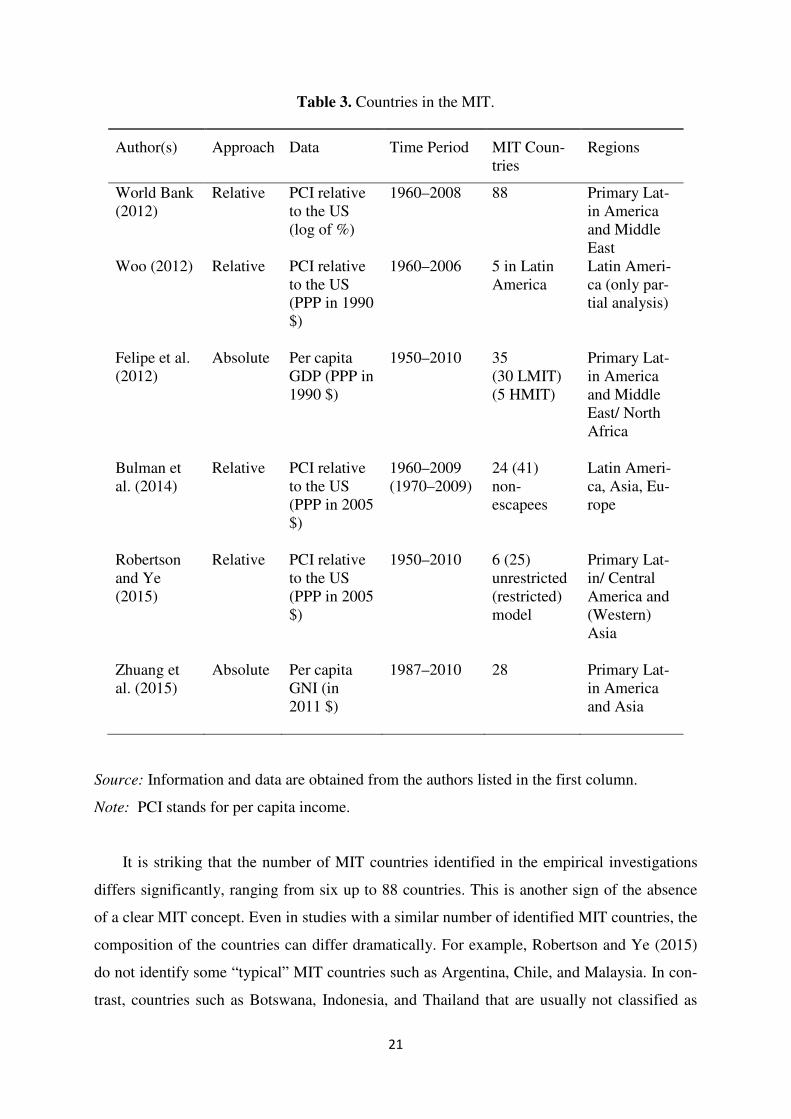
Robertson and Ye (2015) identify 46 middle-income countries in 2010 and study the
time-series properties of the per capita income data of these countries. They perform two
tests: a simple augmented Dickey-Fuller unit root test on the log per capita income gap 𝑥𝑥𝑖𝑖,𝑡𝑡19P
(“unrestricted model”) and a similar test without a long-run time trend in 𝑥𝑥𝑖𝑖,𝑡𝑡 (“restricted
model”), where the latter test reflects the (neoclassical) assumption that all the countries have
the same long-term growth rate. The two tests yield very different results (six MIT countries20
in the unrestricted model and 25 MIT countries21 in the restricted model). Most of the 25 MIT
countries from the restricted model can be found in Latin and Central America (five each) and
in Asia (six in Western Asia, three in (South) East Asia). Table 3 summarizes the main re-
sults. For detailed information on the MIT countries identified by Felipe et al. (2012), Zhuang
et al. (2012), and Robertson and Ye (2015), see Table B.1 in Appendix B.
17 These results change if the authors base their analysis on the period between 1970 and 2009, with 41 countries being classified as non-escapees of the middle-income range. 18 In contrast to Felipe et al. (2012), their list of MIT countries also includes Argentina, Belarus, Chile, Costa Rica, Lithuania, Mexico, Russian Federation, Thailand, and Turkey , but excludes Albania, Algeria, Botswana, Congo (Rep.), Ecuador, Egypt, Iran, Jamaica, Kenya, Libya, Namibia, Saudi Arabia, Sri Lanka, Swaziland, Ven-ezuela, and Yemen (Rep.). Hence, their empirically identified MIT countries differ in 25 cases; only 18 coun-tries are identified in both studies. 19 See Section 3.2. for a precise definition of 𝑥𝑥𝑖𝑖,𝑡𝑡. 20 Namely Cuba, El Salvador, Lebanon, Peru, Syria, and Thailand. 21 Namely Bolivia, Botswana, Bulgaria, Costa Rica, Guatemala, Honduras, Indonesia, Iran, Iraq, Jordan, Mexico, Mongolia, Morocco, Panama, Romania, South Africa, Swaziland, Tunisia, and Turkey (in addition to the coun-tries listed in footnote 22).
21
Table 3. Countries in the MIT.
Author(s) Approach Data Time Period MIT Coun-tries
Regions
World Bank (2012)
Relative PCI relative to the US (log of %)
1960–2008 88 Primary Lat-in America and Middle East
Woo (2012) Relative PCI relative to the US (PPP in 1990 $)
1960–2006 5 in Latin America
Latin Ameri-ca (only par-tial analysis)
Felipe et al. (2012)
Absolute Per capita GDP (PPP in 1990 $)
1950–2010 35 (30 LMIT) (5 HMIT)
Primary Lat-in America and Middle East/ North Africa
Bulman et al. (2014)
Relative PCI relative to the US (PPP in 2005 $)
1960–2009 (1970–2009)
24 (41) non-escapees
Latin Ameri-ca, Asia, Eu-rope
Robertson and Ye (2015)
Relative PCI relative to the US (PPP in 2005 $)
1950–2010 6 (25) unrestricted (restricted) model
Primary Lat-in/ Central America and (Western) Asia
Zhuang et al. (2015)
Absolute Per capita GNI (in 2011 $)
1987–2010 28 Primary Lat-in America and Asia
Source: Information and data are obtained from the authors listed in the first column.
Note: PCI stands for per capita income.
It is striking that the number of MIT countries identified in the empirical investigations
differs significantly, ranging from six up to 88 countries. This is another sign of the absence
of a clear MIT concept. Even in studies with a similar number of identified MIT countries, the
composition of the countries can differ dramatically. For example, Robertson and Ye (2015)
do not identify some “typical” MIT countries such as Argentina, Chile, and Malaysia. In con-
trast, countries such as Botswana, Indonesia, and Thailand that are usually not classified as

22
MIT countries satisfy their definition (Robertson and Ye, 2015, p. 14). However, some gen-
eralities have emerged. For example, in most of the empirical studies it has been observed that
the majority of the MIT countries is located in Latin America and Asia. Bulman et al.’s
(2014) results stand out as they identify many MIT countries (literally “non-escapees”) in
Europe. Furthermore, many studies (Zhuang et al., 2012, being an exception) consider a peri-
od of approximately 50–60 years.
As we have seen in Section 2 and also in Section 3, there are not only considerable dif-
ferences (regarding the question of which countries are in the MIT and which not) between
the absolute and the relative approach, but also within these two subgroups. This is because
(a) different authors use different MIT definitions (which differ by middle-income range and
number of years spent in that range), and (b) the employed data vary from analysis to analy-
sis. For example, because of such differences, the $15,000–$16,000 income range is identi-
fied as a growth slowdown range by Eichengreen et al. (2013), but not by Eichengreen et al.
(2011).
The MIT could also be regarded as a refining of a long-known fact of the 20th century
growth theory that there are only a few very rich countries (e.g., the US, Europe, and Austral-
ia) that were already relatively rich at the beginning of the 20th century and have remained so
since then. In contrast, the rest of the world (the middle-income and poverty trap countries) is
relatively “poor” and was not able to catch up to the rich/developed countries (apart from a
few exceptions). The MIT concept refines this law a little by stating that there are at least
some or many countries – depending on the empirical study – that have tried and will try to
catch up to the advanced countries. Thus, by using the MIT concept (and the previously
known concepts of poverty traps and developed economies) and the results from Table 3, we
can postulate the following stylized picture of the world: In most cases, Latin American, Mid-
dle East, and Asian countries are in the MIT. The rest of the world is either in the poverty trap
(the majority of Africa), or very rich (the US, Europe, Australia).
5. MIT Theories and Empirically Identified Factors Triggering MIT
This section deals with the possible explanations for the MIT. First, the main theoretical ex-
planations are presented, before we take a closer look at the triggering factors identified in
empirical studies.22
22 Of course, the subdivision of MIT explanations into “theoretical explanations” and “empirically identified triggering factors” is only one alternative among many. For example, Kanchoochat (2014) distinguishes between

23
5.1. Theoretical Explanations
There are two important lines of argument that help understand the mechanism of the MIT.
Both are based on the fact that the initial drivers of growth, i.e., factors that generate growth
in low-income countries, are no longer available once middle-income status is achieved.
The first elementary explanation approach of growth slowdowns is based on the Dual-sector
model developed by W. Arthur Lewis (1954), also known as the “Lewis model” (see e.g.,
Eichengreen, 2011; Agénor and Canuto, 2015; Zhuang et al., 2015). Henceforth, we refer to
this explanation as the “Lewis argument”. In the Lewis model, structural change is the main
growth driver: The early development stage of an economy is associated with the reallocation
of capital and workforce from the less productive agricultural sector to the more productive
industry sector. This process is associated with strong productivity gains.
The second of the two key explanation approaches focuses on the imitation of foreign
technologies and comparative advantage as the main drivers of growth and thus can be re-
ferred to as the “trade/imitation argument”: An economy in its early phase of development
can generate (transitory) growth if it specializes in labor-intensive and low-wage tasks/goods
(according to its comparative advantage), and succeeds in imitating the technology of more
advanced countries. (As we can see, these are the predictions of the (neo)classical trade litera-
ture and the leader–follower models, e.g., Barro and Sala-i-Martin, 1997).
While these two sources can generate growth at the early stages of development, they be-
come exhausted at some point in time. Then it is no longer possible to shift additional work-
force into the industrial sector, and wages begin to rise. Productivity gains by intersectoral
factor reallocation decrease (Lewis argument) and the country’s exporting position is weak-
ened. Moreover, returns from imported technologies decline (trade/imitation argument).
Overall, international competiveness is undermined giving rise to a growth slowdown. In or-
der to maintain growth there has to be a change in growth strategy. This is exactly what the
already-mentioned theoretical definition approaches state (namely that political and institu-
tional adjustments are necessary when a country enters the middle-income range; see Section
2). Moreover, this illustrates well the fact that the MIT might be a relatively new phenomenon
in a literary sense, but the underlying mechanism is well known. The frequently recommend-
ed strategy of innovation-driven growth (instead of the reallocation-, investment-, and imita-
the following classes (or “groups”) of MIT explanations: (a) explanations based on the quality of institutions and education (“group 1”), and (b) explanations based on the changes in export composition, where the latter group is subdivided depending on whether the export change is made by following (“group 2”) or defying (“group 3”) comparative advantage. Furthermore, she refers to the fact that the need for government intervention from group 1 to group 3 increases.

24
tion-based growth in the early stages of development) is also implied by many earlier growth
models that are not linked directly to the MIT. A good example is the model of Aghion and
Howitt (1992) in which the process of creative destruction serves as the main source of
growth. Additionally, the model of Acemoglu et al. (2006) stresses the importance of a timely
shift from an imitation to an innovation strategy. In line with Gerschenkorn (1962), they con-
sider convergence to the technological leader as a crucial factor for developing countries.
Agénor and Canuto (2015) choose another theoretical approach that also recognizes
productivity slowdown as one of the main causes of a growth slowdown. The authors empha-
size the interaction of three different determinants of productivity growth: (1) the individual
decision to obtain skills, (2) the access to different types of infrastructure, and (3) knowledge
network externalities. With regard to the theoretical foundation, it is important to mention that
Agénor and Canuto (2015) are among the very few who develop a concrete (mathematical)
model of the MIT. Their overlapping generations model (OLG model) takes into account both
knowledge spillovers and learning-by-doing effects. The authors distinguish between basic
infrastructure (e.g., roads) and advanced infrastructure (e.g., information and communication
technology, ICT), as well as between two types of skills, namely basic and advanced. The
latter can be obtained through investment in education in early adult life. Depending on the
individual skill level, different opportunities open up for the workforce as only high-skilled
labor can be employed in the design sector. If a worker has only basic skills, he/she can only
work in the final goods/industry sector, which has a lower productivity than the innovative
design sector. The activities in the design sector require advanced infrastructure. An MIT is
characterized by a “misallocation of talent” (see Agénor and Canuto, 2015, p. 643): This
means that countries may be caught in a development trap (a kind of vicious cycle) if too few
workers with advanced skills work in the productive design sector. One reason for this is a
lack of advanced infrastructure. This leads to lower productivity and to lower wages in the
design sector, which in turn results in fewer incentives to invest in higher education (which is
a crucial requirement for employment in the design sector). This interdependence is also re-
ferred to as the “two-way causality between education and innovation” (see Agénor and Ca-
nuto, 2015, p. 656).
To our knowledge, Dabús et al. (2016) are the only other ones who develop a mathemati-
cal model of the MIT, besides Agénor and Canuto (2015). Their model refers especially to
Argentina, studying a small, open, agricultural-goods producing economy. According to
Dabús et al. (2016), once an economy has reached a steady state, it can only achieve a new,
higher steady state if there is a major positive change in foreign conditions (in particular, there

25
has to be an increase in the demand for agricultural products in the advanced economies).
However, a negative change may occur as well, and lead to a lower steady state.
Especially with regard to the Asian economies, some authors (e.g., Ohno, 2009; Aoki,
2011) develop models with different development stages. Such models generally refer to five
phases (or stages) that an economy has to pass on the way to the stage of a developed, high-
income country. For the sake of completeness, it has to be mentioned that such gradual ap-
proaches have existed for several decades, with Rostow’s Book “The Stages of Economic
Growth: A Non-Communist Manifesto” from 1960 being probably the most important early
contribution. He distinguishes between five economic stages, namely “the traditional society,
the preconditions for take-off, the take-off, the drive to maturity, and the age of high mass-
consumption” (see Rostow, 1990, p. 4). In the following, we briefly present two recent ap-
proaches: Ohno (2009) and Aoki (2011).
Ohno (2009) primarily considers the ASEAN countries (Association of Southeast Asian
Nations) and uses a relative (catching up) definition approach. The basic structure of his mod-
el is presented in Figure 3. The successful transition from one stage to another depends on
how well a country is able to fulfill the corresponding requirements that vary from one stage
to the next. For example, at stage zero, the attraction of foreign direct investment (FDI) is a
crucial factor; at stage one, the expansion of the industrial basis, and measures relating to pri-
vatization, deregulation, and a favorable business environment gain importance. According to
Ohno (2009), countries experience a development trap especially during stage zero (in an
analogy to the poverty trap) and in stage two (in analogy to the MIT). With regard to the
ASEAN countries, he mentions Malaysia and Thailand as examples of MIT countries. In con-
trast, Korea and Taiwan have already successfully managed to reach stage three.

26
Figure 3. Stages of the catching up process in Ohno’s MIT model.
Source: Own representation based on Ohno (2009).
The transition from stage two to stage three is separated by an “invisible glass ceiling” a
country has to break through if it wants to reach high-income status. In order to do this, it is
important not to rely only on knowledge and skills from foreign partners, but to internalize
them through human capital accumulation. In this context, Ohno (2009) lists various concrete
measures adopted by some ASEAN countries to implement this idea. For example, he men-
tions the concept “manufacturing plus plus” that was introduced as part of the “Second Indus-
trial Master Plan (IMP2)” in Malaysia between 1996 and 2005. This concept contains a gen-
eral strategy for reaching stage three and, in particular, efforts to (a) restructure the domestic
production to include the production chain links that, in general, have a greater value added
(e.g., R&D, product development, and marketing), and (b) achieve higher productivity and,
thus, lift the value chain as a whole. Another example suggested by Ohno (2009) is the con-
cept “monozukuri” meaning “making things” (mono = the thing that is made; zukuri = the act
of making). The aim is to raise customer satisfaction instead of a pure profit orientation. The
required product quality is reached through the institutionalization of knowledge accumula-
tion within (partner) companies.
Another phase concept is developed by Aoki (2011). It is quite similar to Ohno’s ap-
proach, but focuses on China, Korea, and Japan. Aoki (2011) also divides the development
process into five phases, namely the Malthusian (M), the government-led (G), the Kuznets
(K), the human capital based (H), and the post-demographic-transition (PD) phase, which –
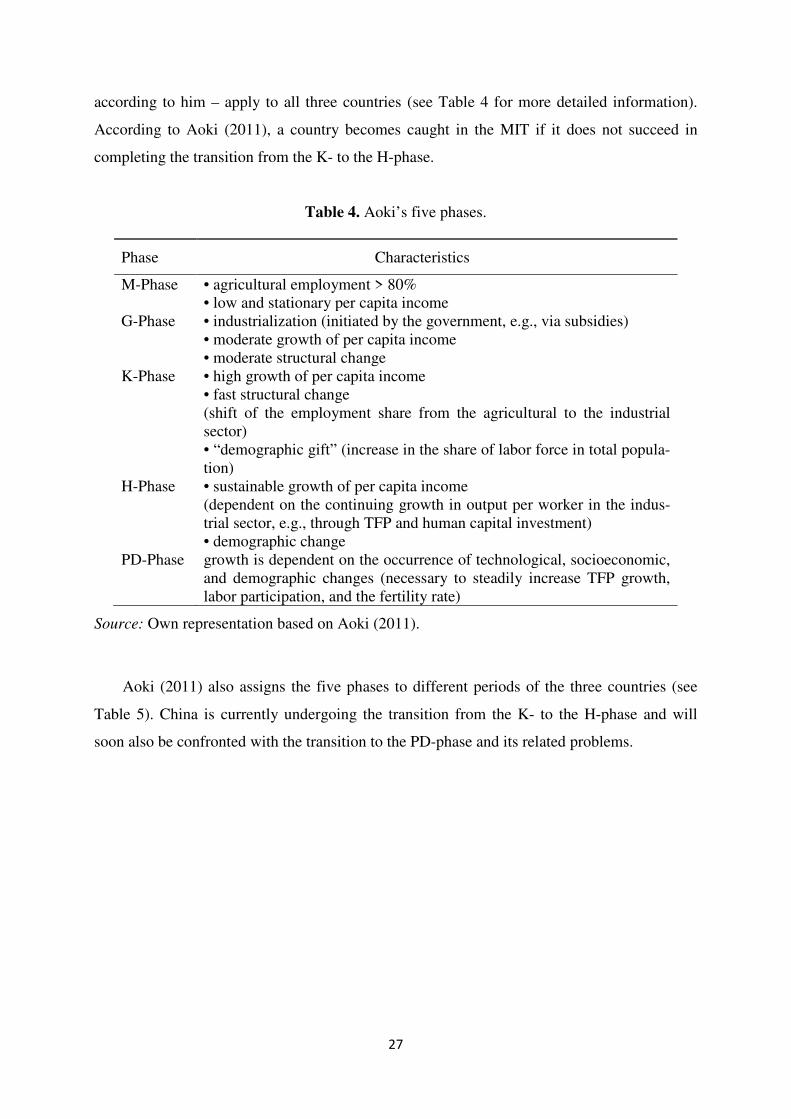
27
according to him – apply to all three countries (see Table 4 for more detailed information).
According to Aoki (2011), a country becomes caught in the MIT if it does not succeed in
completing the transition from the K- to the H-phase.
Table 4. Aoki’s five phases.
Phase Characteristics
M-Phase • agricultural employment > 80% • low and stationary per capita income
G-Phase • industrialization (initiated by the government, e.g., via subsidies) • moderate growth of per capita income • moderate structural change
K-Phase • high growth of per capita income • fast structural change (shift of the employment share from the agricultural to the industrial sector) • “demographic gift” (increase in the share of labor force in total popula-tion)
H-Phase • sustainable growth of per capita income (dependent on the continuing growth in output per worker in the indus-trial sector, e.g., through TFP and human capital investment) • demographic change
PD-Phase growth is dependent on the occurrence of technological, socioeconomic, and demographic changes (necessary to steadily increase TFP growth, labor participation, and the fertility rate)
Source: Own representation based on Aoki (2011).
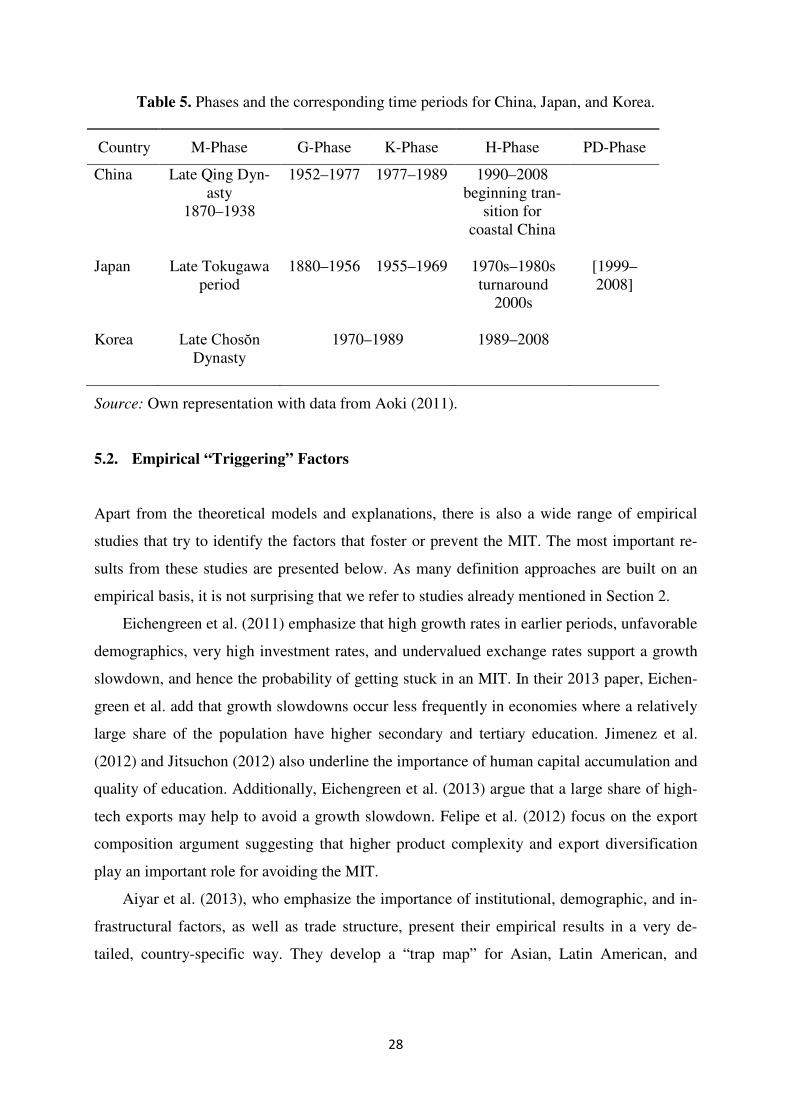
Aoki (2011) also assigns the five phases to different periods of the three countries (see
Table 5). China is currently undergoing the transition from the K- to the H-phase and will
soon also be confronted with the transition to the PD-phase and its related problems.
28
Table 5. Phases and the corresponding time periods for China, Japan, and Korea.
Country M-Phase G-Phase K-Phase H-Phase PD-Phase
China Late Qing Dyn-asty
1870–1938
1952–1977 1977–1989 1990–2008 beginning tran-
sition for coastal China
Japan Late Tokugawa period
1880–1956 1955–1969 1970s–1980s turnaround
2000s
[1999–2008]
Korea Late Chosŏn Dynasty
1970–1989 1989–2008
Source: Own representation with data from Aoki (2011).
5.2. Empirical “Triggering” Factors
Apart from the theoretical models and explanations, there is also a wide range of empirical
studies that try to identify the factors that foster or prevent the MIT. The most important re-
sults from these studies are presented below. As many definition approaches are built on an
empirical basis, it is not surprising that we refer to studies already mentioned in Section 2.
Eichengreen et al. (2011) emphasize that high growth rates in earlier periods, unfavorable
demographics, very high investment rates, and undervalued exchange rates support a growth
slowdown, and hence the probability of getting stuck in an MIT. In their 2013 paper, Eichen-
green et al. add that growth slowdowns occur less frequently in economies where a relatively
large share of the population have higher secondary and tertiary education. Jimenez et al.
(2012) and Jitsuchon (2012) also underline the importance of human capital accumulation and
quality of education. Additionally, Eichengreen et al. (2013) argue that a large share of high-
tech exports may help to avoid a growth slowdown. Felipe et al. (2012) focus on the export
composition argument suggesting that higher product complexity and export diversification
play an important role for avoiding the MIT.
Aiyar et al. (2013), who emphasize the importance of institutional, demographic, and in-
frastructural factors, as well as trade structure, present their empirical results in a very de-
tailed, country-specific way. They develop a “trap map” for Asian, Latin American, and

29
MENA23 middle-income countries. The trap map shows which of the seven identified factors
(Institutions, Demography, Communication, Road, Output Composition, Macroeconomic
Factors, and Trade) presents a particular growth slowdown risk for a country compared to the
other countries. The results are illustrated through the use of different colors, where red
shades indicate an increased risk, and green shades signal that the factor is not associated with
a higher risk of experiencing a growth slowdown. Aiyar et al. (2013) come to the conclusion
that Asian economies (in contrast to Latin American and MENA countries) more frequently
experience a growth slowdown due to the factor “communication” (or, strictly speaking, the
lack of it) measured by the number of telephone lines, whereas the factor “trade” (measured
by the indicators distance and regional integration) – unlike in Latin American countries –
serves as a growth slowdown buffer.
According to the descriptive analysis by Bulman et al. (2014), countries that managed to
escape the middle-income range experienced higher TFP growth, low inflation, as well as a
relatively rapid structural transformation process (from agriculture to industry) compared to
the countries that were not able to make a successful transition to the high-income range.
These escapees also have a relatively strong export-orientation, greater levels of human capi-
tal, better macroeconomic management, and a more equal income distribution in comparison
to the non-escapees. These results are only partly consistent with Bulman et al.’s (2014)
cross-country growth regression analysis according to which there is a positive impact of in-
dustrialization, openness, and equality on growth, but not of education and innovation on
growth.
The triggering factors identified by these empirical studies are largely in line with the
theoretical explanations mentioned above. For example, the importance of human capital (in
terms of education) stressed by many empirical investigations corresponds well with the ne-
cessity of technologically advanced products in innovation-based theories.
6. Conclusion
Our discussion indicates several topics for further research. First, the question of an appropri-
ate, clear, and generally accepted definition remains as one of the major problems of the MIT
concept. Thus, the development of a standard (empirical) definition is one of the key chal-
lenges of future research. Note, however, that although the various definition approaches gen-
23 The MENA region comprises countries of the Middle East and North Africa. See e.g., http://www.worldbank.org/en/region/mena.

30
erate quite different results, there are still some similarities that can be confirmed across most
of the studies: (1) most of the MIT countries are located in Asia and Latin America; and (2)
most studies using absolute thresholds tend to interpret the MIT as a growth slowdown,
whereas the majority of studies utilizing relative thresholds understand the MIT as a failed
catching up process.
Second, with regard to the theoretical foundation of the MIT concept, there seems to be a
lot of room for new research. Indeed, Agénor and Canuto (2015) are among the very few who
have developed a mathematical model of the MIT. In that context, growth theory could offer
many opportunities for further economic modeling of the MIT, and is surely a worthwhile
focus for future research. Many articles remain on the surface and are mainly descriptive/non-
mathematical. For example, the stage concepts of Ohno (2009) and Aoki (2011) are very in-
teresting concepts, but lack a deeper (theoretical or mathematical) foundation.
The existence of the MIT has been questioned in the literature. However, even if the MIT
turns out to be a myth in the sense that income traps occur with the same (or even higher) fre-
quency in other income categories, it is still important as various countries seem to be con-
fronted with it during the transition to a developed country status.
31
References
Acemoglu, D., Aghion, P. and Zilibotti, F. (2006) Distance to Frontier, Selection, and Eco-
nomic Growth. Journal of the European Economic Association 4(1): 37-74.
Aiyar, S., Duval, R., Puy, D., Wu, Y. and Zhang, L. (2013) Growth Slowdowns and the Mid-
dle-Income Trap. IMF Working Paper 13/71, International Monetary Fund, Washington, D.
C.
Agénor, P.-R. and Canuto, O. (2015) Middle-Income Growth Traps. Research in Economics
69(4): 641-660.
Agénor, P.-R., Canuto, O. and Jelenic, M. (2012) Avoiding Middle-Income Growth Traps.
Economic Premise, Poverty Reduction and Economic Management Network (PREM) Nr. 98:
The World Bank.
Aghion, P. and Howitt, P. (1992) A Model of Growth Through Creative Destruction. Econo-
metrica 60(2): 323-351.
Aoki, M. (2011) The Five-Phases of Economic Development and Institutional Evolution in
China and Japan. ADBI Working Paper Series No. 340.
Athukorala, P.-C. and Woo, W. T. (2011) Malaysia in the middle-income trap. Asian Eco-
nomic Panel Meeting, Columbia University, New York City (24th – 25th March 2011).
Azariadis, C. and Stachurski, J. (2005) Poverty Traps. In Durlauf, S. N. and Aghion, P. (eds.)
Handbook of Economic Growth (p. 296-384). Amsterdam: Elsevier.
Barro, R. J. and Sala-i-Martin, X. (1997) Technological Diffusion, Convergence, and Growth.
Journal of Economic Growth 2(1): 1-26.
Bulman, D., Eden M. and Nguyen, H. (2014) Transitioning from Low-Income Growth to
High-Income Growth – Is There a Middle Income Trap. Policy Research Working Paper No.
7104, World Bank.

32
Cai, F. (2012) Is There a “Middle-income Trap”? Theories, Experiences and Relevance to
China. China & World Economy 20(1): 49-61.
Cherif, R. and Hasanov, F. (2015) The Leap of the Tiger: How Malaysia Can Escape the
Middle-Income Trap. IMF Working Paper 15/131, International Monetary Fund, Washington,
D. C.
Dabús, C., Tohmé, F. and Carabello, M. A. (2016) A middle income trap in a small open
economy: Modeling the Argentinean case. Economic modeling 53: 436-444.
Eichengreen, B. (2011) Escaping the Middle Income Trap. Manuscript prepared for 2011
Economic Policy Symposium held by Federal Reserve Bank of Kansas City.
Eichengreen, B., Park, D. and Shin, K. (2011) When fast growing economies slow down: In-
ternational evidence and implications for China. NBER Working Papers, 16916, Cambridge.
-------- (2013) Growth slowdowns redux: New evidence on the middle-income trap. NBER
Working Papers, 18673, Cambridge.
Felipe, J., Abdon, A. and Kumar, U. (2012) Tracking the Middle-income Trap: What Is It,
Who Is in It, and Why? Levy Economics Institute of Bard College, Working Paper No. 715.
Flaaen, A., Ghani, E. and Mishra, S. (2013) How to Avoid Middle Income Traps? Evidence
from Malaysia. Policy Research Working Paper Series 6427, World Bank.
Garrett, G. (2004) Globalization’s Missing Middle. Foreign Affairs 83(6): 84-96.
Gerschenkron, A. (1962) Economic Backwardness in Historical Perspective. Cambridge:
Harvard University Press.
Gill, I. and Kharas, H. (2007) An East Asian Renaissance – Ideas for Economic Growth.
Washington, DC: World Bank.

33
-------- (2015) The Middle-Income Trap Turns Ten. Policy Research Working Paper No.
7403.
Im, F.G. and Rosenblatt, D. (2013) Middle-Income Traps – A Conceptual and Empirical Sur-
vey. Policy Research Working Paper No. 6594, World Bank.
Jimenez, E., Nguyen, V. and Patrinos, H. A. (2012) Stuck in the Middle? Human Capital De-
velopment and Economic Growth in Malaysia and Thailand. World Bank Policy Research
Working Paper No. 6283.
Jitsuchon, S. (2012) Thailand in a Middle-income Trap. TDRI Quarterly Review 27(2): 13–
20.
Kanchoochat, V. (2014) The Middle-income Trap Debate: Taking Stock, Looking Ahead.
Kokusai Mondai (International Affairs), No. 633.
Kharas, H. and Kohli, H. (2011) What is the Middle Income Trap, Why do Countries Fall into
It, and How Can It be Avoided? Global Journal of Emerging Market Economies 3(3): 281-
289.
Lewis, W. A. (1954) Economic Development with Unlimited Supplies of Labor. Manchester
School of Economic and Social Studies 22: 139-191.
Matsuyama, K. (2008) Poverty traps. In Durlauf, S. N. and Blume, L. (eds.) The New Pal-
grave Dictionary of Economics, 2. Edition. Palgrave Macmillan.
Ohno, K. (2009) Avoiding the Middle-Income Trap – Renovation Industrial Policy Formula-
tion in Vietnam. ASEAN Economic Bulletin 26(1): 25-43.
Robertson, P. E. and Ye, L. (2015) On the Existence of a Middle-Income Trap. University of
Western Australia Working Paper 13/12. An earlier version of this article appeared in 2013
under the same title.
34
Rostow, W. W. (1990) The Stages of Economic Growth: A Non-Communist Manifesto. Cam-
bridge: Cambridge University Press.
Wagner, H. (2013) Challenges to China’s Policy: Structural Change. Comparative Economic
Studies 55: 721-736.
-------- (2015) Structural Change and Mid-Income Trap – Under which conditions can China
succeed in moving towards higher income status. European Journal of Comparative Econom-
ics 12(2): 165-188.
Woo, W.T., Lu, M., Sachs, J. D. and Chen, Z. (2012) A New Economic Growth Engine for
China: Escaping the Middle-income Trap by Not Doing More of the Same. Singapore: World
Scientific Publishing Company and London: Imperial College Press.
World Bank (2012) China 2030: Building a Modern, Harmonious, and Creative High-Income
Society. Washington D.C.: World Bank.
-------- (2015) Worldwide Governance Indicators (WGI). Washington, DC: World Bank.
Available online at http://info.worldbank.org/governance/wgi/index.aspx#doc, 2015 Update.
-------- (2016) World Development Indicators (WDI). Washington, DC: World Bank. Availa-
ble online at http://data.worldbank.org/data-catalog/world-development-indicators, last updat-
ed 11/04/2016.
Zhuang, J., Vandenberg, P. and Huang, Y. (2012) Growing beyond the Low-Cost Advantage
– How the People’s Republic of China can Avoid the Middle-Income Trap. Mandaluyong
City, Philippines: Asian Development Bank.

35
Appendix A
Figure A.1. Google Searches for “middle income trap China”.
Source: Own representation based on data from Google Trends. Note: The black line indi-
cates the 5-year-average trend.
Appendix B
Table B.1. MIT-countries identified by Felipe et al. (2012), Zhuang et al. (2012), and Robert-
son and Ye (2015).
Country Felipe et al. (2012)
Zhuang et al. (2012)
Robertson/Ye (2015)
Albania LMIT Algeria LMIT Argentina MIT Bolivia LMIT MIT MIT Botswana LMIT MIT Brazil LMIT MIT Chile MIT Colombia LMIT Congo, Rep. LMIT Costa Rica MIT MIT Cuba MIT* Dominican Rep.
LMIT MIT
0
20
40
60
80
100
120Ju
ly 0
8
No
v 0
8
Ma
r 0
9
July
09
No
v 0
9
Ma
r 1
0
July
10
No
v 1
0
Ma
r 1
1
July
11
No
v 1
1
Ma
r 1
2
July
12
No
v 1
2
Ma
r 1
3
July
13
No
v 1
3
Ma
r 1
4
July
14
No
v 1
4
Ma
r 1
5
July
15
No
v 1
5
Ma
r 1
6

36
Ecuador LMIT Egypt LMIT El Salvador LMIT MIT MIT* Gabon LMIT Guatemala LMIT MIT MIT Honduras MIT Indonesia MIT Iran LMIT MIT Iraq MIT Jamaica LMIT Lebanon LMIT MIT* Libya LMIT Malaysia UMIT Mexico MIT MIT Mongolia MIT Morocco LMIT MIT Namibia LMIT Panama LMIT MIT MIT Paraguay LMIT MIT Peru LMIT MIT MIT* Philippines LMIT
Romania LMIT MIT Saudi Arabia UMIT South Africa LMIT MIT Sri Lanka LMIT Swaziland LMIT MIT Syria UMIT MIT* Thailand MIT* Tunisia LMIT MIT Turkey MIT Uruguay UMIT MIT Venezuela UMIT Yemen LMIT
Total 35 (30LMIT, 5UMIT)
28 24 (6*)
Source: Felipe et al. (2012), Zhuang et al. (2012), and Robertson and Ye (2015).
Note: “MIT”, “LMIT, and “UMIT” indicate that the country is in the “middle-income”, “low-
er-middle-income” and “upper-middle-income trap”, respectively. Blank space indicates that
the country is not in the middle-income trap. “*” indicates the MIT-countries that are identi-
fied within the unrestricted model of Robertson and Ye (2015). Countries in bold are identi-
fied by all three studies.