THE MIDDLE EAST HOTEL MARKET REVIEW 2017 Consulting, The Middle... · TRI CONSULTING – THE MIDDLE...
21
TRI CONSULTING – THE MIDDLE EAST HOTEL MARKET REVIEW 2017 THE MIDDLE EAST HOTEL MARKET REVIEW 2017
Transcript of THE MIDDLE EAST HOTEL MARKET REVIEW 2017 Consulting, The Middle... · TRI CONSULTING – THE MIDDLE...
TRI CONSULTING – THE MIDDLE EAST HOTEL MARKET REVIEW 2017
THE MIDDLE EAST HOTEL MARKET REVIEW
2017
TRI CONSULTING – THE MIDDLE EAST HOTEL MARKET REVIEW 2017
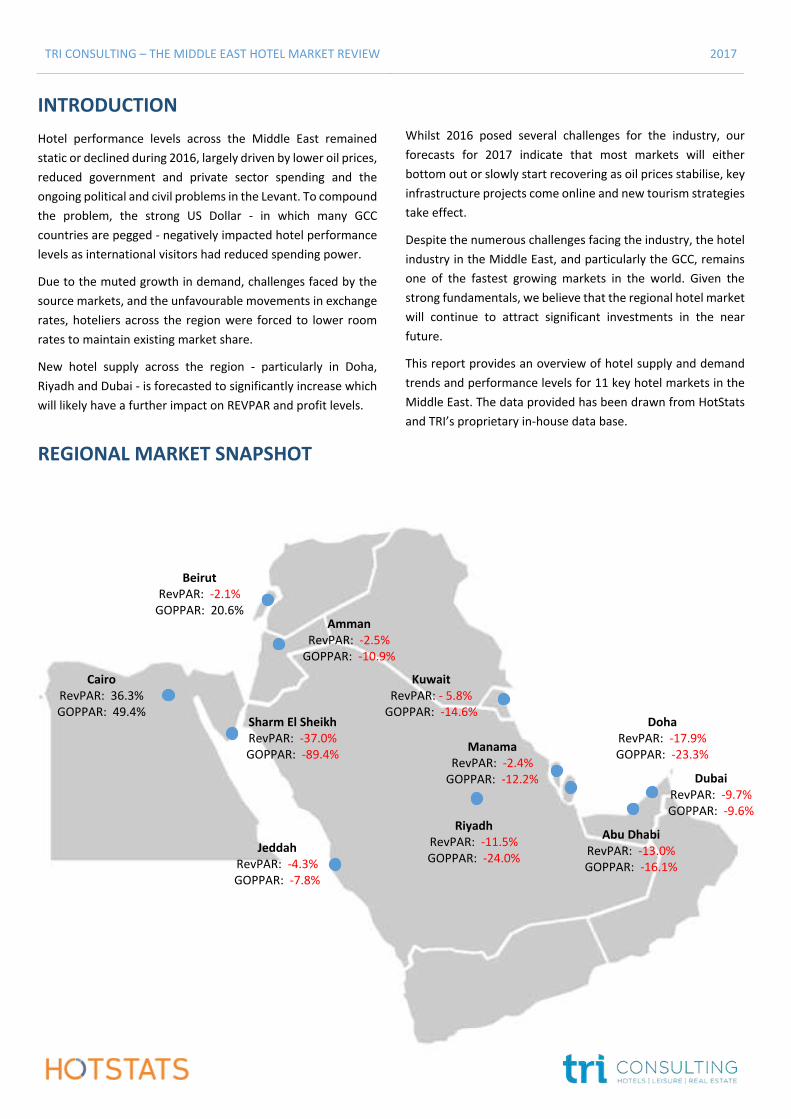
INTRODUCTION
Hotel performance levels across the Middle East remained
static or declined during 2016, largely driven by lower oil prices,
reduced government and private sector spending and the
ongoing political and civil problems in the Levant. To compound
the problem, the strong US Dollar - in which many GCC
countries are pegged - negatively impacted hotel performance
levels as international visitors had reduced spending power.
Due to the muted growth in demand, challenges faced by the
source markets, and the unfavourable movements in exchange
rates, hoteliers across the region were forced to lower room
rates to maintain existing market share.
New hotel supply across the region - particularly in Doha,
Riyadh and Dubai - is forecasted to significantly increase which
will likely have a further impact on REVPAR and profit levels.
REGIONAL MARKET SNAPSHOT
Whilst 2016 posed several challenges for the industry, our
forecasts for 2017 indicate that most markets will either
bottom out or slowly start recovering as oil prices stabilise, key
infrastructure projects come online and new tourism strategies
take effect.
Despite the numerous challenges facing the industry, the hotel
industry in the Middle East, and particularly the GCC, remains
one of the fastest growing markets in the world. Given the
strong fundamentals, we believe that the regional hotel market
will continue to attract significant investments in the near
future.
This report provides an overview of hotel supply and demand
trends and performance levels for 11 key hotel markets in the
Middle East. The data provided has been drawn from HotStats
and TRI’s proprietary in-house data base.
Jeddah
RevPAR: -4.3%
GOPPAR: -7.8%
Riyadh
RevPAR: -11.5%
GOPPAR: -24.0%
Abu Dhabi RevPAR: -13.0%
GOPPAR: -16.1%
Kuwait RevPAR: - 5.8%
GOPPAR: -14.6%
Manama
RevPAR: -2.4%
GOPPAR: -12.2%
Doha
RevPAR: -17.9%
GOPPAR: -23.3%
Beirut
RevPAR: -2.1%
GOPPAR: 20.6% Amman
RevPAR: -2.5%
GOPPAR: -10.9%
Cairo
RevPAR: 36.3%
GOPPAR: 49.4% Sharm El Sheikh
RevPAR: -37.0%
GOPPAR: -89.4%
Dubai RevPAR: -9.7%
GOPPAR: -9.6%
TRI CONSULTING – THE MIDDLE EAST HOTEL MARKET REVIEW 2017
UNITED ARAB EMIRATES
ABU DHABI | DUBAI
TRI CONSULTING – THE MIDDLE EAST HOTEL MARKET REVIEW 2017
UNITED ARAB EMIRATES - ABU DHABI
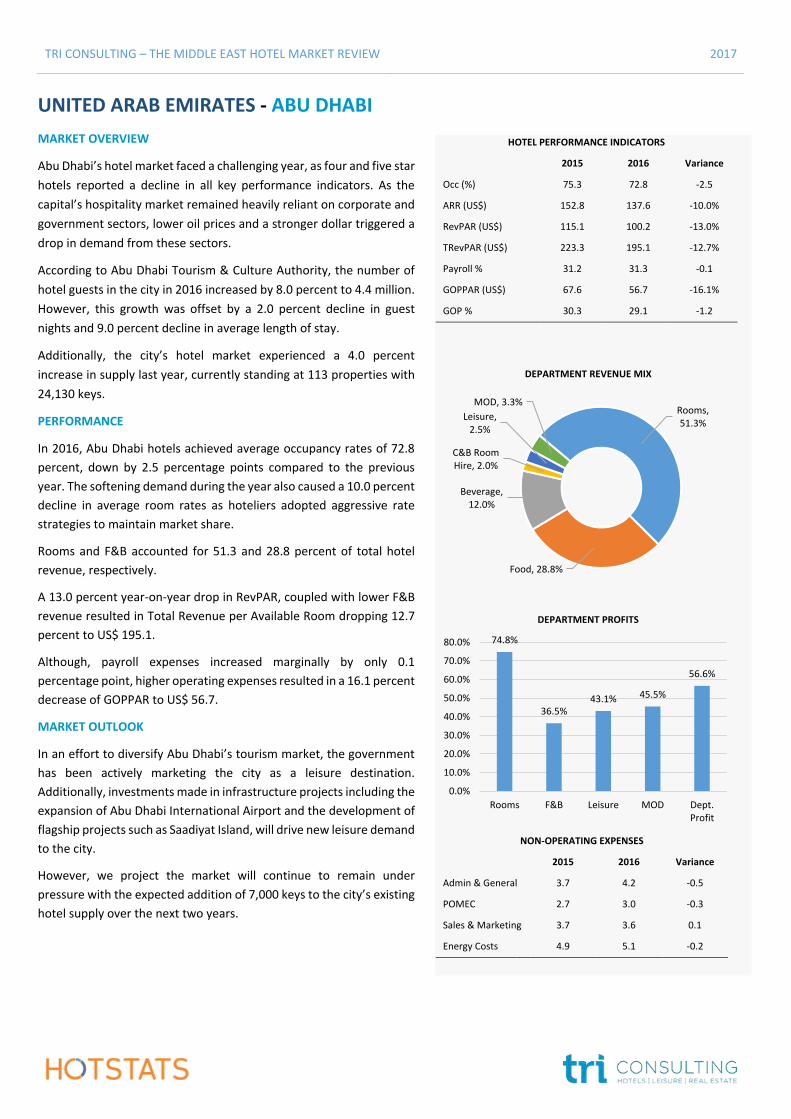
MARKET OVERVIEW
Abu Dhabi’s hotel market faced a challenging year, as four and five star
hotels reported a decline in all key performance indicators. As the
capital’s hospitality market remained heavily reliant on corporate and
government sectors, lower oil prices and a stronger dollar triggered a
drop in demand from these sectors.
According to Abu Dhabi Tourism & Culture Authority, the number of
hotel guests in the city in 2016 increased by 8.0 percent to 4.4 million.
However, this growth was offset by a 2.0 percent decline in guest
nights and 9.0 percent decline in average length of stay.
Additionally, the city’s hotel market experienced a 4.0 percent
increase in supply last year, currently standing at 113 properties with
24,130 keys.
PERFORMANCE
In 2016, Abu Dhabi hotels achieved average occupancy rates of 72.8
percent, down by 2.5 percentage points compared to the previous
year. The softening demand during the year also caused a 10.0 percent
decline in average room rates as hoteliers adopted aggressive rate
strategies to maintain market share.
Rooms and F&B accounted for 51.3 and 28.8 percent of total hotel
revenue, respectively.
A 13.0 percent year-on-year drop in RevPAR, coupled with lower F&B
revenue resulted in Total Revenue per Available Room dropping 12.7
percent to US$ 195.1.
Although, payroll expenses increased marginally by only 0.1
percentage point, higher operating expenses resulted in a 16.1 percent
decrease of GOPPAR to US$ 56.7.
MARKET OUTLOOK
In an effort to diversify Abu Dhabi’s tourism market, the government
has been actively marketing the city as a leisure destination.
Additionally, investments made in infrastructure projects including the
expansion of Abu Dhabi International Airport and the development of
flagship projects such as Saadiyat Island, will drive new leisure demand
to the city.
However, we project the market will continue to remain under
pressure with the expected addition of 7,000 keys to the city’s existing
hotel supply over the next two years.
HOTEL PERFORMANCE INDICATORS
2015 2016 Variance
Occ (%) 75.3 72.8 -2.5
ARR (US$) 152.8 137.6 -10.0%
RevPAR (US$) 115.1 100.2 -13.0%
TRevPAR (US$) 223.3 195.1 -12.7%
Payroll % 31.2 31.3 -0.1
GOPPAR (US$) 67.6 56.7 -16.1%
GOP % 30.3 29.1 -1.2
NON-OPERATING EXPENSES
2015 2016 Variance
Admin & General 3.7 4.2 -0.5
POMEC 2.7 3.0 -0.3
Sales & Marketing 3.7 3.6 0.1
Energy Costs 4.9 5.1 -0.2
Rooms, 51.3%
Food, 28.8%
Beverage, 12.0%
C&B Room Hire, 2.0%
Leisure, 2.5%
MOD, 3.3%
DEPARTMENT REVENUE MIX
74.8%
36.5%43.1% 45.5%
56.6%
0.0%
10.0%
20.0%
30.0%
40.0%
50.0%
60.0%
70.0%
80.0%
Rooms F&B Leisure MOD Dept.Profit
DEPARTMENT PROFITS
TRI CONSULTING – THE MIDDLE EAST HOTEL MARKET REVIEW 2017
UNITED ARAB EMIRATES - DUBAI
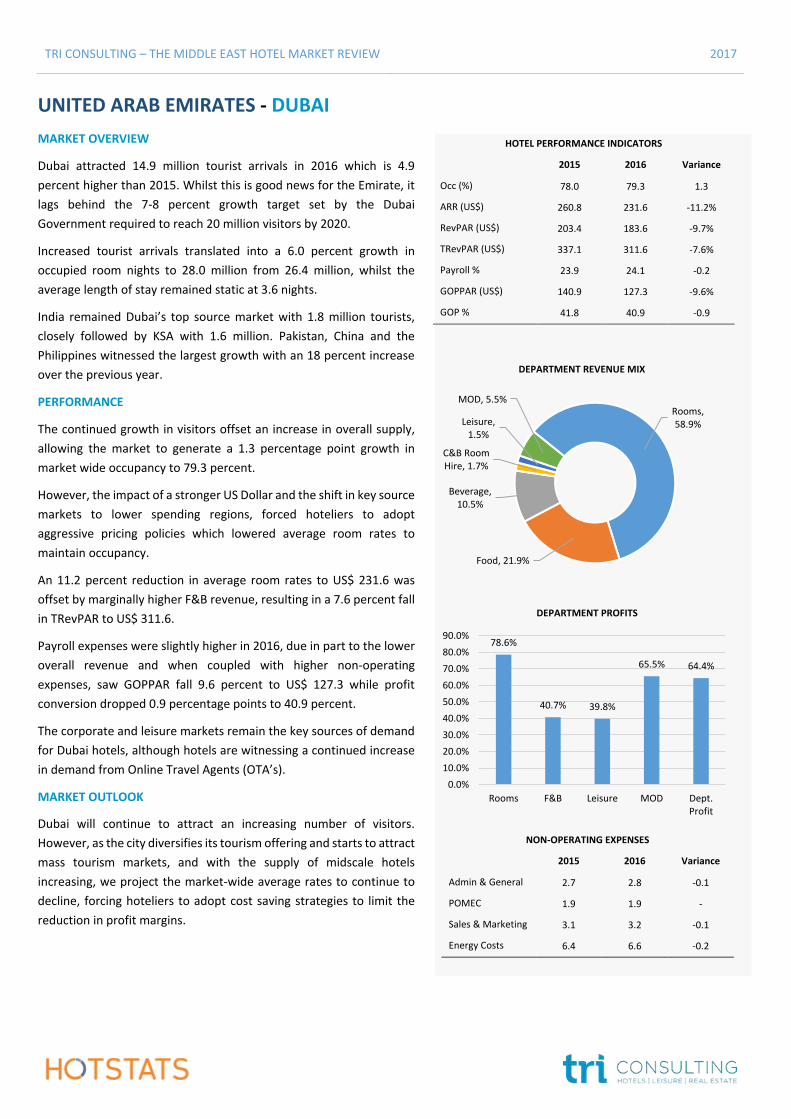
MARKET OVERVIEW
Dubai attracted 14.9 million tourist arrivals in 2016 which is 4.9
percent higher than 2015. Whilst this is good news for the Emirate, it
lags behind the 7-8 percent growth target set by the Dubai
Government required to reach 20 million visitors by 2020.
Increased tourist arrivals translated into a 6.0 percent growth in
occupied room nights to 28.0 million from 26.4 million, whilst the
average length of stay remained static at 3.6 nights.
India remained Dubai’s top source market with 1.8 million tourists,
closely followed by KSA with 1.6 million. Pakistan, China and the
Philippines witnessed the largest growth with an 18 percent increase
over the previous year.
PERFORMANCE
The continued growth in visitors offset an increase in overall supply,
allowing the market to generate a 1.3 percentage point growth in
market wide occupancy to 79.3 percent.
However, the impact of a stronger US Dollar and the shift in key source
markets to lower spending regions, forced hoteliers to adopt
aggressive pricing policies which lowered average room rates to
maintain occupancy.
An 11.2 percent reduction in average room rates to US$ 231.6 was
offset by marginally higher F&B revenue, resulting in a 7.6 percent fall
in TRevPAR to US$ 311.6.
Payroll expenses were slightly higher in 2016, due in part to the lower
overall revenue and when coupled with higher non-operating
expenses, saw GOPPAR fall 9.6 percent to US$ 127.3 while profit
conversion dropped 0.9 percentage points to 40.9 percent.
The corporate and leisure markets remain the key sources of demand
for Dubai hotels, although hotels are witnessing a continued increase
in demand from Online Travel Agents (OTA’s).
MARKET OUTLOOK
Dubai will continue to attract an increasing number of visitors.
However, as the city diversifies its tourism offering and starts to attract
mass tourism markets, and with the supply of midscale hotels
increasing, we project the market-wide average rates to continue to
decline, forcing hoteliers to adopt cost saving strategies to limit the
reduction in profit margins.
HOTEL PERFORMANCE INDICATORS
2015 2016 Variance
Occ (%) 78.0 79.3 1.3
ARR (US$) 260.8 231.6 -11.2%
RevPAR (US$) 203.4 183.6 -9.7%
TRevPAR (US$) 337.1 311.6 -7.6%
Payroll % 23.9 24.1 -0.2
GOPPAR (US$) 140.9 127.3 -9.6%
GOP % 41.8 40.9 -0.9
NON-OPERATING EXPENSES
2015 2016 Variance
Admin & General 2.7 2.8 -0.1
POMEC 1.9 1.9 -
Sales & Marketing 3.1 3.2 -0.1
Energy Costs 6.4 6.6 -0.2
Rooms, 58.9%
Food, 21.9%
Beverage, 10.5%
C&B Room Hire, 1.7%
Leisure, 1.5%
MOD, 5.5%
DEPARTMENT REVENUE MIX
78.6%
40.7% 39.8%
65.5% 64.4%
0.0%
10.0%
20.0%
30.0%
40.0%
50.0%
60.0%
70.0%
80.0%
90.0%
Rooms F&B Leisure MOD Dept.Profit
DEPARTMENT PROFITS
TRI CONSULTING – THE MIDDLE EAST HOTEL MARKET REVIEW 2017
KINGDOM OF SAUDI ARABIA
JEDDAH | RIYADH
TRI CONSULTING – THE MIDDLE EAST HOTEL MARKET REVIEW 2017
SAUDI ARABIA - JEDDAH
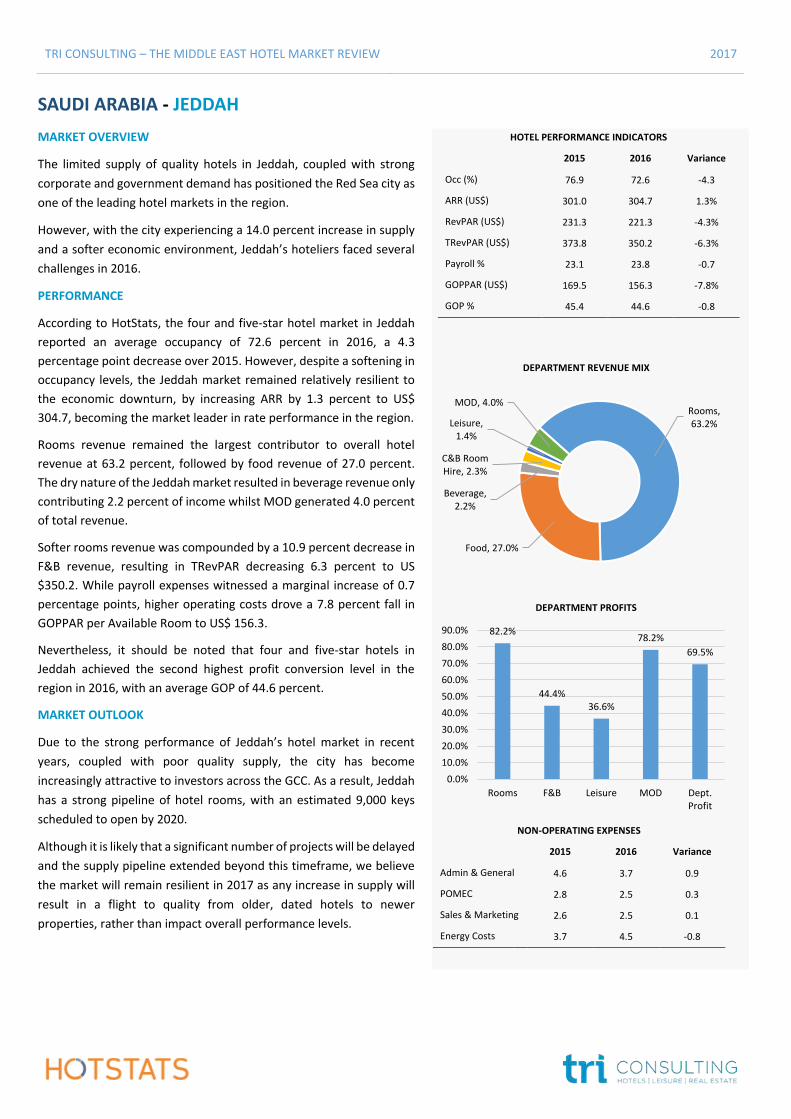
MARKET OVERVIEW
The limited supply of quality hotels in Jeddah, coupled with strong
corporate and government demand has positioned the Red Sea city as
one of the leading hotel markets in the region.
However, with the city experiencing a 14.0 percent increase in supply
and a softer economic environment, Jeddah’s hoteliers faced several
challenges in 2016.
PERFORMANCE
According to HotStats, the four and five-star hotel market in Jeddah
reported an average occupancy of 72.6 percent in 2016, a 4.3
percentage point decrease over 2015. However, despite a softening in
occupancy levels, the Jeddah market remained relatively resilient to
the economic downturn, by increasing ARR by 1.3 percent to US$
304.7, becoming the market leader in rate performance in the region.
Rooms revenue remained the largest contributor to overall hotel
revenue at 63.2 percent, followed by food revenue of 27.0 percent.
The dry nature of the Jeddah market resulted in beverage revenue only
contributing 2.2 percent of income whilst MOD generated 4.0 percent
of total revenue.
Softer rooms revenue was compounded by a 10.9 percent decrease in
F&B revenue, resulting in TRevPAR decreasing 6.3 percent to US
$350.2. While payroll expenses witnessed a marginal increase of 0.7
percentage points, higher operating costs drove a 7.8 percent fall in
GOPPAR per Available Room to US$ 156.3.
Nevertheless, it should be noted that four and five-star hotels in
Jeddah achieved the second highest profit conversion level in the
region in 2016, with an average GOP of 44.6 percent.
MARKET OUTLOOK
Due to the strong performance of Jeddah’s hotel market in recent
years, coupled with poor quality supply, the city has become
increasingly attractive to investors across the GCC. As a result, Jeddah
has a strong pipeline of hotel rooms, with an estimated 9,000 keys
scheduled to open by 2020.
Although it is likely that a significant number of projects will be delayed
and the supply pipeline extended beyond this timeframe, we believe
the market will remain resilient in 2017 as any increase in supply will
result in a flight to quality from older, dated hotels to newer
properties, rather than impact overall performance levels.
HOTEL PERFORMANCE INDICATORS
2015 2016 Variance
Occ (%) 76.9 72.6 -4.3
ARR (US$) 301.0 304.7 1.3%
RevPAR (US$) 231.3 221.3 -4.3%
TRevPAR (US$) 373.8 350.2 -6.3%
Payroll % 23.1 23.8 -0.7
GOPPAR (US$) 169.5 156.3 -7.8%
GOP % 45.4 44.6 -0.8
NON-OPERATING EXPENSES
2015 2016 Variance
Admin & General 4.6 3.7 0.9
POMEC 2.8 2.5 0.3
Sales & Marketing 2.6 2.5 0.1
Energy Costs 3.7 4.5 -0.8
Rooms, 63.2%
Food, 27.0%
Beverage, 2.2%
C&B Room Hire, 2.3%
Leisure, 1.4%
MOD, 4.0%
DEPARTMENT REVENUE MIX
82.2%
44.4%36.6%
78.2%
69.5%
0.0%
10.0%
20.0%
30.0%
40.0%
50.0%
60.0%
70.0%
80.0%
90.0%
Rooms F&B Leisure MOD Dept.Profit
DEPARTMENT PROFITS
TRI CONSULTING – THE MIDDLE EAST HOTEL MARKET REVIEW 2017
SAUDI ARABIA - RIYADH
MARKET OVERVIEW
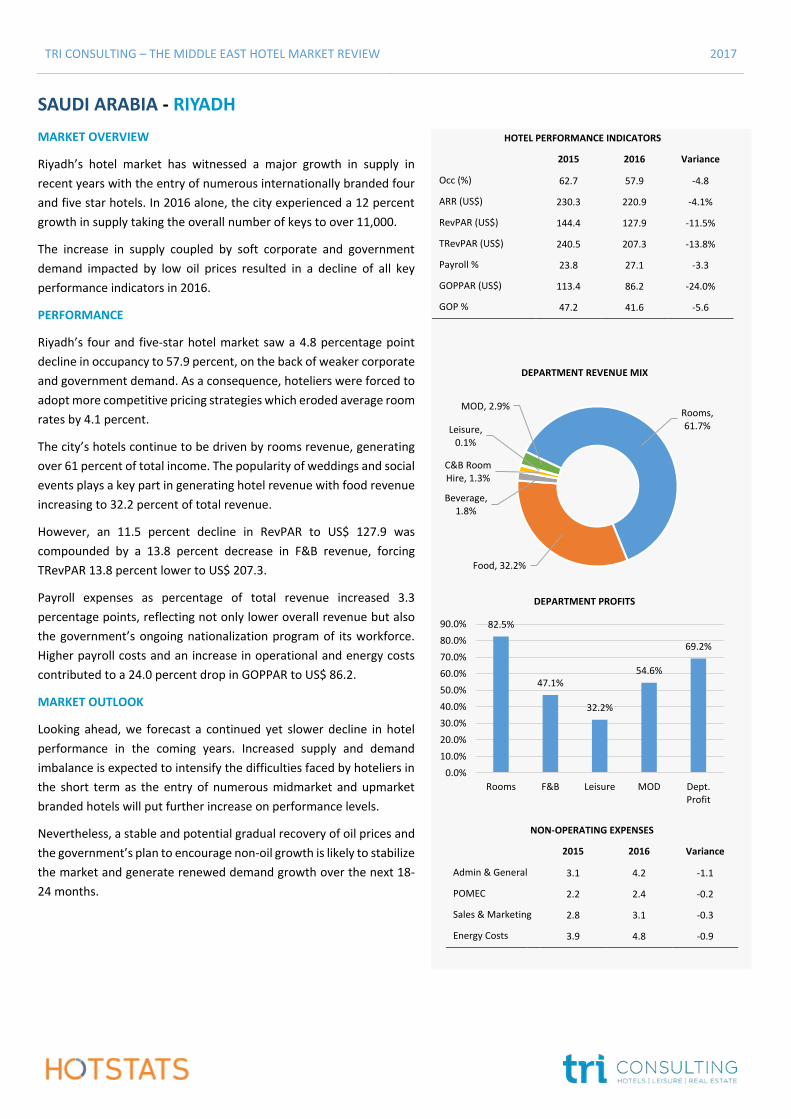
Riyadh’s hotel market has witnessed a major growth in supply in
recent years with the entry of numerous internationally branded four
and five star hotels. In 2016 alone, the city experienced a 12 percent
growth in supply taking the overall number of keys to over 11,000.
The increase in supply coupled by soft corporate and government
demand impacted by low oil prices resulted in a decline of all key
performance indicators in 2016.
PERFORMANCE
Riyadh’s four and five-star hotel market saw a 4.8 percentage point
decline in occupancy to 57.9 percent, on the back of weaker corporate
and government demand. As a consequence, hoteliers were forced to
adopt more competitive pricing strategies which eroded average room
rates by 4.1 percent.
The city’s hotels continue to be driven by rooms revenue, generating
over 61 percent of total income. The popularity of weddings and social
events plays a key part in generating hotel revenue with food revenue
increasing to 32.2 percent of total revenue.
However, an 11.5 percent decline in RevPAR to US$ 127.9 was
compounded by a 13.8 percent decrease in F&B revenue, forcing
TRevPAR 13.8 percent lower to US$ 207.3.
Payroll expenses as percentage of total revenue increased 3.3
percentage points, reflecting not only lower overall revenue but also
the government’s ongoing nationalization program of its workforce.
Higher payroll costs and an increase in operational and energy costs
contributed to a 24.0 percent drop in GOPPAR to US$ 86.2.
MARKET OUTLOOK
Looking ahead, we forecast a continued yet slower decline in hotel
performance in the coming years. Increased supply and demand
imbalance is expected to intensify the difficulties faced by hoteliers in
the short term as the entry of numerous midmarket and upmarket
branded hotels will put further increase on performance levels.
Nevertheless, a stable and potential gradual recovery of oil prices and
the government’s plan to encourage non-oil growth is likely to stabilize
the market and generate renewed demand growth over the next 18-
24 months.
HOTEL PERFORMANCE INDICATORS
2015 2016 Variance
Occ (%) 62.7 57.9 -4.8
ARR (US$) 230.3 220.9 -4.1%
RevPAR (US$) 144.4 127.9 -11.5%
TRevPAR (US$) 240.5 207.3 -13.8%
Payroll % 23.8 27.1 -3.3
GOPPAR (US$) 113.4 86.2 -24.0%
GOP % 47.2 41.6 -5.6
NON-OPERATING EXPENSES
2015 2016 Variance
Admin & General 3.1 4.2 -1.1
POMEC 2.2 2.4 -0.2
Sales & Marketing 2.8 3.1 -0.3
Energy Costs 3.9 4.8 -0.9
Rooms, 61.7%
Food, 32.2%
Beverage, 1.8%
C&B Room Hire, 1.3%
Leisure, 0.1%
MOD, 2.9%
DEPARTMENT REVENUE MIX
82.5%
47.1%
32.2%
54.6%
69.2%
0.0%
10.0%
20.0%
30.0%
40.0%
50.0%
60.0%
70.0%
80.0%
90.0%
Rooms F&B Leisure MOD Dept.Profit
DEPARTMENT PROFITS
TRI CONSULTING – THE MIDDLE EAST HOTEL MARKET REVIEW 2017
EGYPT
CAIRO | SHARM EL SHEIKH
TRI CONSULTING – THE MIDDLE EAST HOTEL MARKET REVIEW 2017
EGYPT - CAIRO
MARKET OVERVIEW
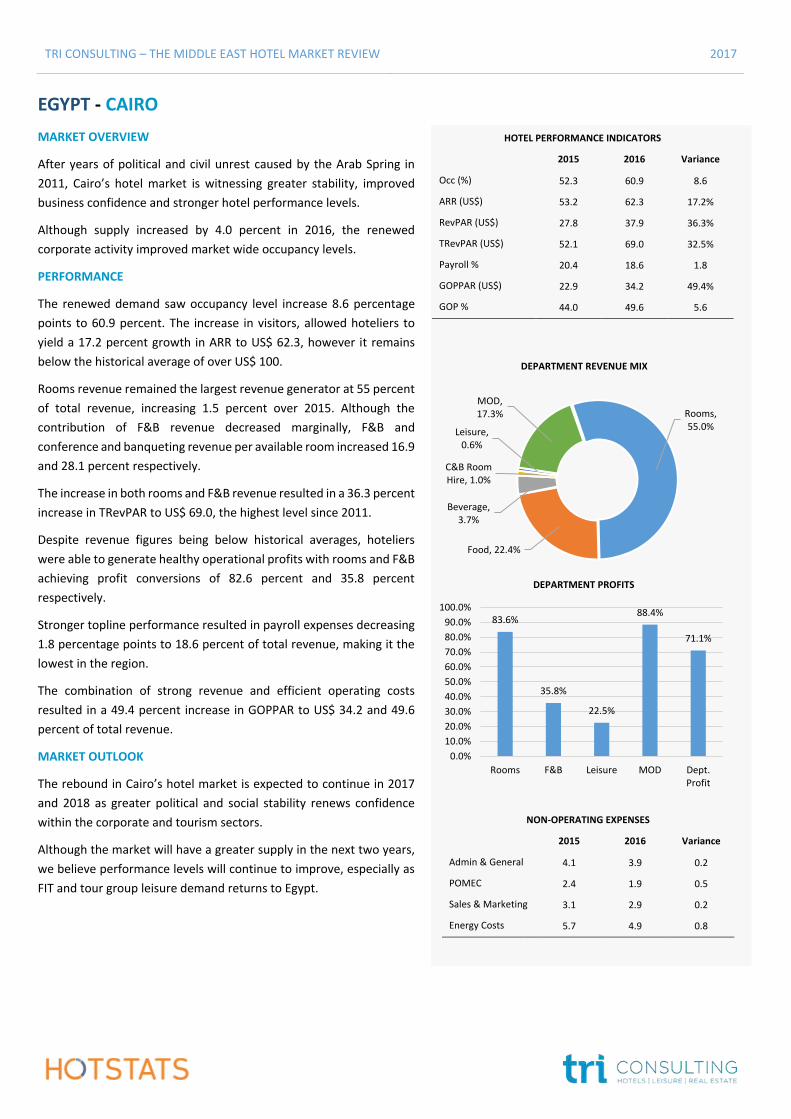
After years of political and civil unrest caused by the Arab Spring in
2011, Cairo’s hotel market is witnessing greater stability, improved
business confidence and stronger hotel performance levels.
Although supply increased by 4.0 percent in 2016, the renewed
corporate activity improved market wide occupancy levels.
PERFORMANCE
The renewed demand saw occupancy level increase 8.6 percentage
points to 60.9 percent. The increase in visitors, allowed hoteliers to
yield a 17.2 percent growth in ARR to US$ 62.3, however it remains
below the historical average of over US$ 100.
Rooms revenue remained the largest revenue generator at 55 percent
of total revenue, increasing 1.5 percent over 2015. Although the
contribution of F&B revenue decreased marginally, F&B and
conference and banqueting revenue per available room increased 16.9
and 28.1 percent respectively.
The increase in both rooms and F&B revenue resulted in a 36.3 percent
increase in TRevPAR to US$ 69.0, the highest level since 2011.
Despite revenue figures being below historical averages, hoteliers
were able to generate healthy operational profits with rooms and F&B
achieving profit conversions of 82.6 percent and 35.8 percent
respectively.
Stronger topline performance resulted in payroll expenses decreasing
1.8 percentage points to 18.6 percent of total revenue, making it the
lowest in the region.
The combination of strong revenue and efficient operating costs
resulted in a 49.4 percent increase in GOPPAR to US$ 34.2 and 49.6
percent of total revenue.
MARKET OUTLOOK
The rebound in Cairo’s hotel market is expected to continue in 2017
and 2018 as greater political and social stability renews confidence
within the corporate and tourism sectors.
Although the market will have a greater supply in the next two years,
we believe performance levels will continue to improve, especially as
FIT and tour group leisure demand returns to Egypt.
HOTEL PERFORMANCE INDICATORS
2015 2016 Variance
Occ (%) 52.3 60.9 8.6
ARR (US$) 53.2 62.3 17.2%
RevPAR (US$) 27.8 37.9 36.3%
TRevPAR (US$) 52.1 69.0 32.5%
Payroll % 20.4 18.6 1.8
GOPPAR (US$) 22.9 34.2 49.4%
GOP % 44.0 49.6 5.6
NON-OPERATING EXPENSES
2015 2016 Variance
Admin & General 4.1 3.9 0.2
POMEC 2.4 1.9 0.5
Sales & Marketing 3.1 2.9 0.2
Energy Costs 5.7 4.9 0.8
Rooms, 55.0%
Food, 22.4%
Beverage, 3.7%
C&B Room Hire, 1.0%
Leisure, 0.6%
MOD, 17.3%
DEPARTMENT REVENUE MIX
83.6%
35.8%
22.5%
88.4%
71.1%
0.0%
10.0%
20.0%
30.0%
40.0%
50.0%
60.0%
70.0%
80.0%
90.0%
100.0%
Rooms F&B Leisure MOD Dept.Profit
DEPARTMENT PROFITS
TRI CONSULTING – THE MIDDLE EAST HOTEL MARKET REVIEW 2017
EGYPT – SHARM EL SHEIKH
MARKET OVERVIEW
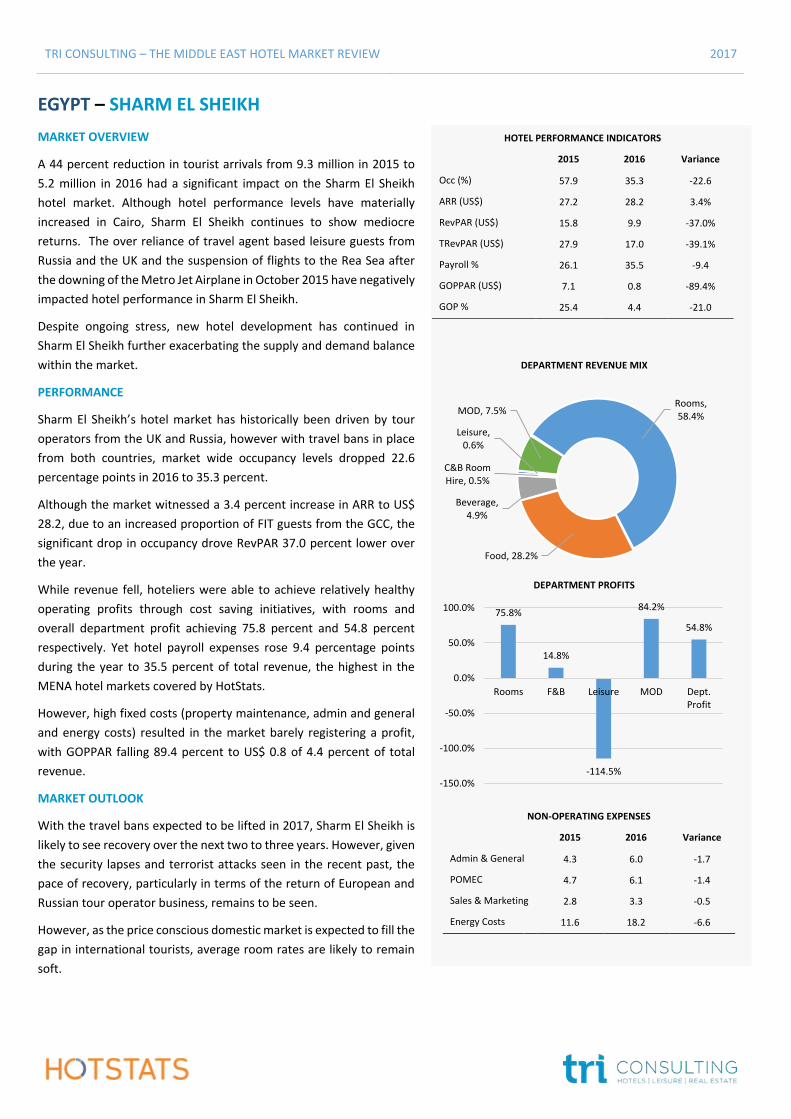
A 44 percent reduction in tourist arrivals from 9.3 million in 2015 to
5.2 million in 2016 had a significant impact on the Sharm El Sheikh
hotel market. Although hotel performance levels have materially
increased in Cairo, Sharm El Sheikh continues to show mediocre
returns. The over reliance of travel agent based leisure guests from
Russia and the UK and the suspension of flights to the Rea Sea after
the downing of the Metro Jet Airplane in October 2015 have negatively
impacted hotel performance in Sharm El Sheikh.
Despite ongoing stress, new hotel development has continued in
Sharm El Sheikh further exacerbating the supply and demand balance
within the market.
PERFORMANCE
Sharm El Sheikh’s hotel market has historically been driven by tour
operators from the UK and Russia, however with travel bans in place
from both countries, market wide occupancy levels dropped 22.6
percentage points in 2016 to 35.3 percent.
Although the market witnessed a 3.4 percent increase in ARR to US$
28.2, due to an increased proportion of FIT guests from the GCC, the
significant drop in occupancy drove RevPAR 37.0 percent lower over
the year.
While revenue fell, hoteliers were able to achieve relatively healthy
operating profits through cost saving initiatives, with rooms and
overall department profit achieving 75.8 percent and 54.8 percent
respectively. Yet hotel payroll expenses rose 9.4 percentage points
during the year to 35.5 percent of total revenue, the highest in the
MENA hotel markets covered by HotStats.
However, high fixed costs (property maintenance, admin and general
and energy costs) resulted in the market barely registering a profit,
with GOPPAR falling 89.4 percent to US$ 0.8 of 4.4 percent of total
revenue.
MARKET OUTLOOK
With the travel bans expected to be lifted in 2017, Sharm El Sheikh is
likely to see recovery over the next two to three years. However, given
the security lapses and terrorist attacks seen in the recent past, the
pace of recovery, particularly in terms of the return of European and
Russian tour operator business, remains to be seen.
However, as the price conscious domestic market is expected to fill the
gap in international tourists, average room rates are likely to remain
soft.
HOTEL PERFORMANCE INDICATORS
2015 2016 Variance
Occ (%) 57.9 35.3 -22.6
ARR (US$) 27.2 28.2 3.4%
RevPAR (US$) 15.8 9.9 -37.0%
TRevPAR (US$) 27.9 17.0 -39.1%
Payroll % 26.1 35.5 -9.4
GOPPAR (US$) 7.1 0.8 -89.4%
GOP % 25.4 4.4 -21.0
NON-OPERATING EXPENSES
2015 2016 Variance
Admin & General 4.3 6.0 -1.7
POMEC 4.7 6.1 -1.4
Sales & Marketing 2.8 3.3 -0.5
Energy Costs 11.6 18.2 -6.6
Rooms, 58.4%
Food, 28.2%
Beverage, 4.9%
C&B Room Hire, 0.5%
Leisure, 0.6%
MOD, 7.5%
DEPARTMENT REVENUE MIX
75.8%
14.8%
-114.5%
84.2%
54.8%
-150.0%
-100.0%
-50.0%
0.0%
50.0%
100.0%
Rooms F&B Leisure MOD Dept.Profit
DEPARTMENT PROFITS
TRI CONSULTING – THE MIDDLE EAST HOTEL MARKET REVIEW 2017
LEVANT
AMMAN | BEIRUT
TRI CONSULTING – THE MIDDLE EAST HOTEL MARKET REVIEW 2017
LEVANT - AMMAN
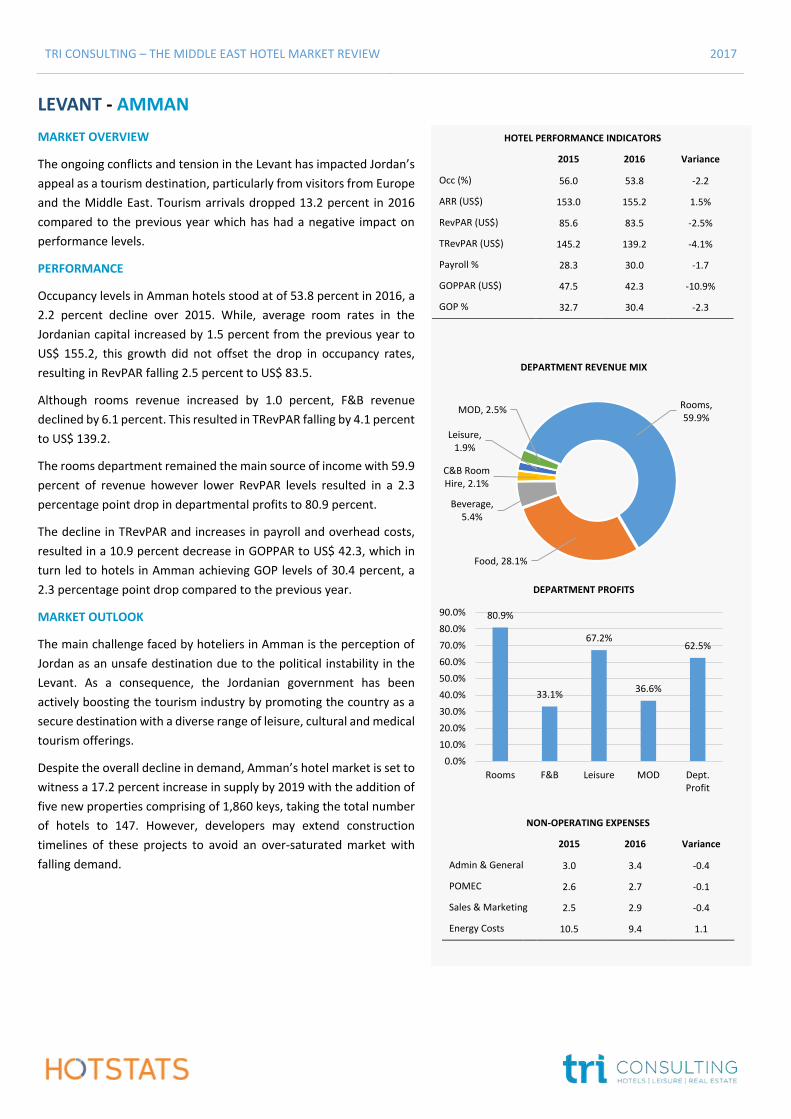
MARKET OVERVIEW
The ongoing conflicts and tension in the Levant has impacted Jordan’s
appeal as a tourism destination, particularly from visitors from Europe
and the Middle East. Tourism arrivals dropped 13.2 percent in 2016
compared to the previous year which has had a negative impact on
performance levels.
PERFORMANCE
Occupancy levels in Amman hotels stood at of 53.8 percent in 2016, a
2.2 percent decline over 2015. While, average room rates in the
Jordanian capital increased by 1.5 percent from the previous year to
US$ 155.2, this growth did not offset the drop in occupancy rates,
resulting in RevPAR falling 2.5 percent to US$ 83.5.
Although rooms revenue increased by 1.0 percent, F&B revenue
declined by 6.1 percent. This resulted in TRevPAR falling by 4.1 percent
to US$ 139.2.
The rooms department remained the main source of income with 59.9
percent of revenue however lower RevPAR levels resulted in a 2.3
percentage point drop in departmental profits to 80.9 percent.
The decline in TRevPAR and increases in payroll and overhead costs,
resulted in a 10.9 percent decrease in GOPPAR to US$ 42.3, which in
turn led to hotels in Amman achieving GOP levels of 30.4 percent, a
2.3 percentage point drop compared to the previous year.
MARKET OUTLOOK
The main challenge faced by hoteliers in Amman is the perception of
Jordan as an unsafe destination due to the political instability in the
Levant. As a consequence, the Jordanian government has been
actively boosting the tourism industry by promoting the country as a
secure destination with a diverse range of leisure, cultural and medical
tourism offerings.
Despite the overall decline in demand, Amman’s hotel market is set to
witness a 17.2 percent increase in supply by 2019 with the addition of
five new properties comprising of 1,860 keys, taking the total number
of hotels to 147. However, developers may extend construction
timelines of these projects to avoid an over-saturated market with
falling demand.
HOTEL PERFORMANCE INDICATORS
2015 2016 Variance
Occ (%) 56.0 53.8 -2.2
ARR (US$) 153.0 155.2 1.5%
RevPAR (US$) 85.6 83.5 -2.5%
TRevPAR (US$) 145.2 139.2 -4.1%
Payroll % 28.3 30.0 -1.7
GOPPAR (US$) 47.5 42.3 -10.9%
GOP % 32.7 30.4 -2.3
NON-OPERATING EXPENSES
2015 2016 Variance
Admin & General 3.0 3.4 -0.4
POMEC 2.6 2.7 -0.1
Sales & Marketing 2.5 2.9 -0.4
Energy Costs 10.5 9.4 1.1
Rooms, 59.9%
Food, 28.1%
Beverage, 5.4%
C&B Room Hire, 2.1%
Leisure, 1.9%
MOD, 2.5%
DEPARTMENT REVENUE MIX
80.9%
33.1%
67.2%
36.6%
62.5%
0.0%
10.0%
20.0%
30.0%
40.0%
50.0%
60.0%
70.0%
80.0%
90.0%
Rooms F&B Leisure MOD Dept.Profit
DEPARTMENT PROFITS
TRI CONSULTING – THE MIDDLE EAST HOTEL MARKET REVIEW 2017
LEVANT - BEIRUT
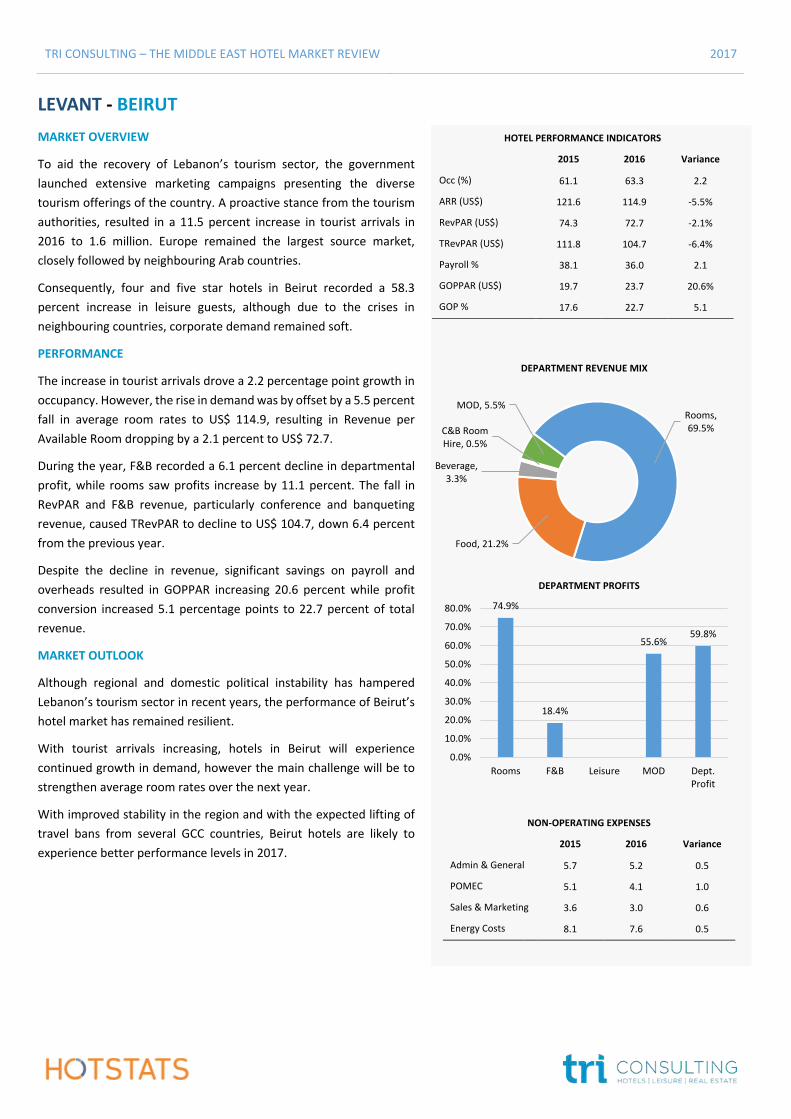
MARKET OVERVIEW
To aid the recovery of Lebanon’s tourism sector, the government
launched extensive marketing campaigns presenting the diverse
tourism offerings of the country. A proactive stance from the tourism
authorities, resulted in a 11.5 percent increase in tourist arrivals in
2016 to 1.6 million. Europe remained the largest source market,
closely followed by neighbouring Arab countries.
Consequently, four and five star hotels in Beirut recorded a 58.3
percent increase in leisure guests, although due to the crises in
neighbouring countries, corporate demand remained soft.
PERFORMANCE
The increase in tourist arrivals drove a 2.2 percentage point growth in
occupancy. However, the rise in demand was by offset by a 5.5 percent
fall in average room rates to US$ 114.9, resulting in Revenue per
Available Room dropping by a 2.1 percent to US$ 72.7.
During the year, F&B recorded a 6.1 percent decline in departmental
profit, while rooms saw profits increase by 11.1 percent. The fall in
RevPAR and F&B revenue, particularly conference and banqueting
revenue, caused TRevPAR to decline to US$ 104.7, down 6.4 percent
from the previous year.
Despite the decline in revenue, significant savings on payroll and
overheads resulted in GOPPAR increasing 20.6 percent while profit
conversion increased 5.1 percentage points to 22.7 percent of total
revenue.
MARKET OUTLOOK
Although regional and domestic political instability has hampered
Lebanon’s tourism sector in recent years, the performance of Beirut’s
hotel market has remained resilient.
With tourist arrivals increasing, hotels in Beirut will experience
continued growth in demand, however the main challenge will be to
strengthen average room rates over the next year.
With improved stability in the region and with the expected lifting of
travel bans from several GCC countries, Beirut hotels are likely to
experience better performance levels in 2017.
HOTEL PERFORMANCE INDICATORS
2015 2016 Variance
Occ (%) 61.1 63.3 2.2
ARR (US$) 121.6 114.9 -5.5%
RevPAR (US$) 74.3 72.7 -2.1%
TRevPAR (US$) 111.8 104.7 -6.4%
Payroll % 38.1 36.0 2.1
GOPPAR (US$) 19.7 23.7 20.6%
GOP % 17.6 22.7 5.1
NON-OPERATING EXPENSES
2015 2016 Variance
Admin & General 5.7 5.2 0.5
POMEC 5.1 4.1 1.0
Sales & Marketing 3.6 3.0 0.6
Energy Costs 8.1 7.6 0.5
Rooms, 69.5%
Food, 21.2%
Beverage, 3.3%
C&B Room Hire, 0.5%
MOD, 5.5%
DEPARTMENT REVENUE MIX
74.9%
18.4%
55.6%59.8%
0.0%
10.0%
20.0%
30.0%
40.0%
50.0%
60.0%
70.0%
80.0%
Rooms F&B Leisure MOD Dept.Profit
DEPARTMENT PROFITS
TRI CONSULTING – THE MIDDLE EAST HOTEL MARKET REVIEW 2017
REMAINDER OF GCC
DOHA | KUWAIT | MANAMA
TRI CONSULTING – THE MIDDLE EAST HOTEL MARKET REVIEW 2017
GCC - DOHA
MARKET OVERVIEW
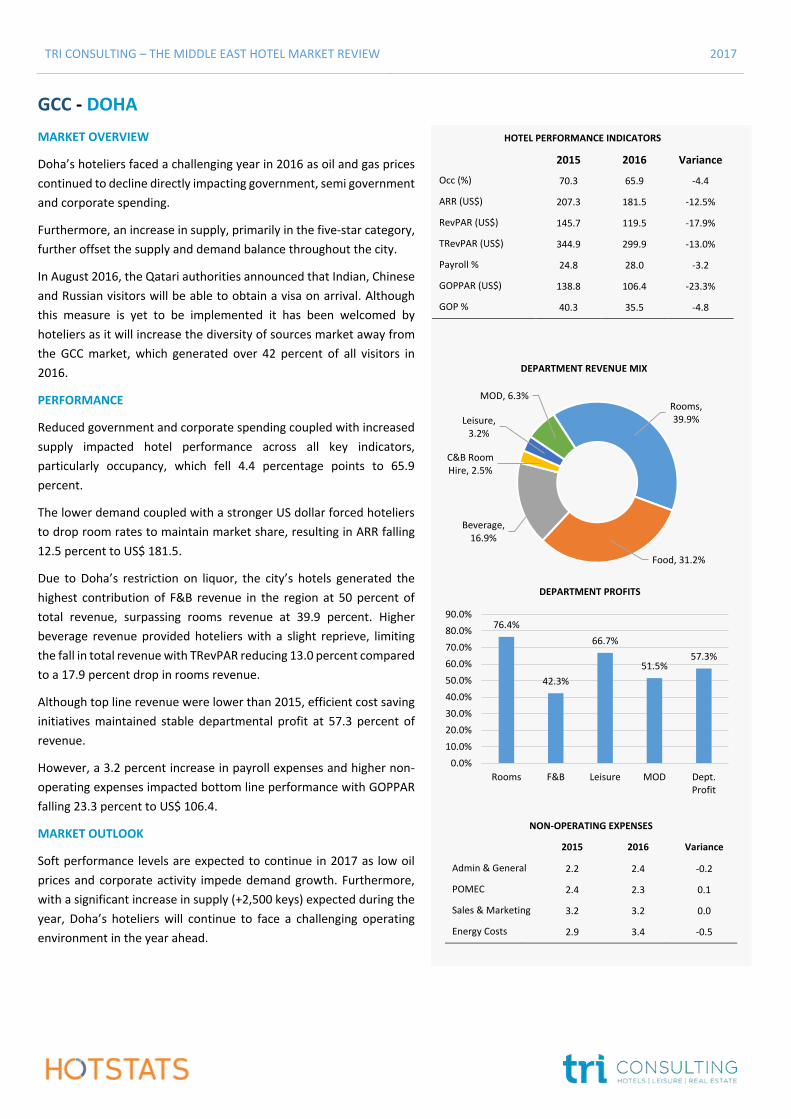
Doha’s hoteliers faced a challenging year in 2016 as oil and gas prices
continued to decline directly impacting government, semi government
and corporate spending.
Furthermore, an increase in supply, primarily in the five-star category,
further offset the supply and demand balance throughout the city.
In August 2016, the Qatari authorities announced that Indian, Chinese
and Russian visitors will be able to obtain a visa on arrival. Although
this measure is yet to be implemented it has been welcomed by
hoteliers as it will increase the diversity of sources market away from
the GCC market, which generated over 42 percent of all visitors in
2016.
PERFORMANCE
Reduced government and corporate spending coupled with increased
supply impacted hotel performance across all key indicators,
particularly occupancy, which fell 4.4 percentage points to 65.9
percent.
The lower demand coupled with a stronger US dollar forced hoteliers
to drop room rates to maintain market share, resulting in ARR falling
12.5 percent to US$ 181.5.
Due to Doha’s restriction on liquor, the city’s hotels generated the
highest contribution of F&B revenue in the region at 50 percent of
total revenue, surpassing rooms revenue at 39.9 percent. Higher
beverage revenue provided hoteliers with a slight reprieve, limiting
the fall in total revenue with TRevPAR reducing 13.0 percent compared
to a 17.9 percent drop in rooms revenue.
Although top line revenue were lower than 2015, efficient cost saving
initiatives maintained stable departmental profit at 57.3 percent of
revenue.
However, a 3.2 percent increase in payroll expenses and higher non-
operating expenses impacted bottom line performance with GOPPAR
falling 23.3 percent to US$ 106.4.
MARKET OUTLOOK
Soft performance levels are expected to continue in 2017 as low oil
prices and corporate activity impede demand growth. Furthermore,
with a significant increase in supply (+2,500 keys) expected during the
year, Doha’s hoteliers will continue to face a challenging operating
environment in the year ahead.
HOTEL PERFORMANCE INDICATORS
2015 2016 Variance
Occ (%) 70.3 65.9 -4.4
ARR (US$) 207.3 181.5 -12.5%
RevPAR (US$) 145.7 119.5 -17.9%
TRevPAR (US$) 344.9 299.9 -13.0%
Payroll % 24.8 28.0 -3.2
GOPPAR (US$) 138.8 106.4 -23.3%
GOP % 40.3 35.5 -4.8
NON-OPERATING EXPENSES
2015 2016 Variance
Admin & General 2.2 2.4 -0.2
POMEC 2.4 2.3 0.1
Sales & Marketing 3.2 3.2 0.0
Energy Costs 2.9 3.4 -0.5
Rooms, 39.9%
Food, 31.2%
Beverage, 16.9%
C&B Room Hire, 2.5%
Leisure, 3.2%
MOD, 6.3%
DEPARTMENT REVENUE MIX
76.4%
42.3%
66.7%
51.5%57.3%
0.0%
10.0%
20.0%
30.0%
40.0%
50.0%
60.0%
70.0%
80.0%
90.0%
Rooms F&B Leisure MOD Dept.Profit
DEPARTMENT PROFITS
TRI CONSULTING – THE MIDDLE EAST HOTEL MARKET REVIEW 2017
GCC - KUWAIT
MARKET OVERVIEW
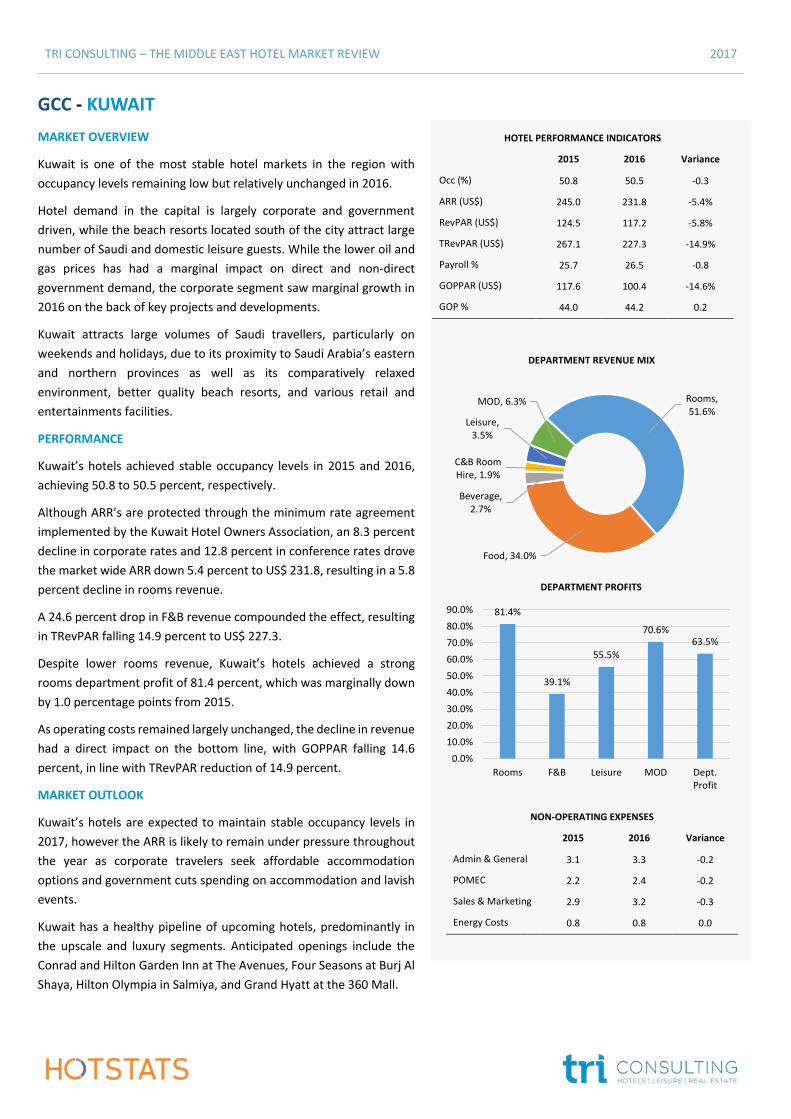
Kuwait is one of the most stable hotel markets in the region with
occupancy levels remaining low but relatively unchanged in 2016.
Hotel demand in the capital is largely corporate and government
driven, while the beach resorts located south of the city attract large
number of Saudi and domestic leisure guests. While the lower oil and
gas prices has had a marginal impact on direct and non-direct
government demand, the corporate segment saw marginal growth in
2016 on the back of key projects and developments.
Kuwait attracts large volumes of Saudi travellers, particularly on
weekends and holidays, due to its proximity to Saudi Arabia’s eastern
and northern provinces as well as its comparatively relaxed
environment, better quality beach resorts, and various retail and
entertainments facilities.
PERFORMANCE
Kuwait’s hotels achieved stable occupancy levels in 2015 and 2016,
achieving 50.8 to 50.5 percent, respectively.
Although ARR’s are protected through the minimum rate agreement
implemented by the Kuwait Hotel Owners Association, an 8.3 percent
decline in corporate rates and 12.8 percent in conference rates drove
the market wide ARR down 5.4 percent to US$ 231.8, resulting in a 5.8
percent decline in rooms revenue.
A 24.6 percent drop in F&B revenue compounded the effect, resulting
in TRevPAR falling 14.9 percent to US$ 227.3.
Despite lower rooms revenue, Kuwait’s hotels achieved a strong
rooms department profit of 81.4 percent, which was marginally down
by 1.0 percentage points from 2015.
As operating costs remained largely unchanged, the decline in revenue
had a direct impact on the bottom line, with GOPPAR falling 14.6
percent, in line with TRevPAR reduction of 14.9 percent.
MARKET OUTLOOK
Kuwait’s hotels are expected to maintain stable occupancy levels in
2017, however the ARR is likely to remain under pressure throughout
the year as corporate travelers seek affordable accommodation
options and government cuts spending on accommodation and lavish
events.
Kuwait has a healthy pipeline of upcoming hotels, predominantly in
the upscale and luxury segments. Anticipated openings include the
Conrad and Hilton Garden Inn at The Avenues, Four Seasons at Burj Al
Shaya, Hilton Olympia in Salmiya, and Grand Hyatt at the 360 Mall.
HOTEL PERFORMANCE INDICATORS
2015 2016 Variance
Occ (%) 50.8 50.5 -0.3
ARR (US$) 245.0 231.8 -5.4%
RevPAR (US$) 124.5 117.2 -5.8%
TRevPAR (US$) 267.1 227.3 -14.9%
Payroll % 25.7 26.5 -0.8
GOPPAR (US$) 117.6 100.4 -14.6%
GOP % 44.0 44.2 0.2
NON-OPERATING EXPENSES
2015 2016 Variance
Admin & General 3.1 3.3 -0.2
POMEC 2.2 2.4 -0.2
Sales & Marketing 2.9 3.2 -0.3
Energy Costs 0.8 0.8 0.0
Rooms, 51.6%
Food, 34.0%
Beverage, 2.7%
C&B Room Hire, 1.9%
Leisure, 3.5%
MOD, 6.3%
DEPARTMENT REVENUE MIX
81.4%
39.1%
55.5%
70.6%63.5%
0.0%
10.0%
20.0%
30.0%
40.0%
50.0%
60.0%
70.0%
80.0%
90.0%
Rooms F&B Leisure MOD Dept.Profit
DEPARTMENT PROFITS
TRI CONSULTING – THE MIDDLE EAST HOTEL MARKET REVIEW 2017
GCC - MANAMA
MARKET OVERVIEW
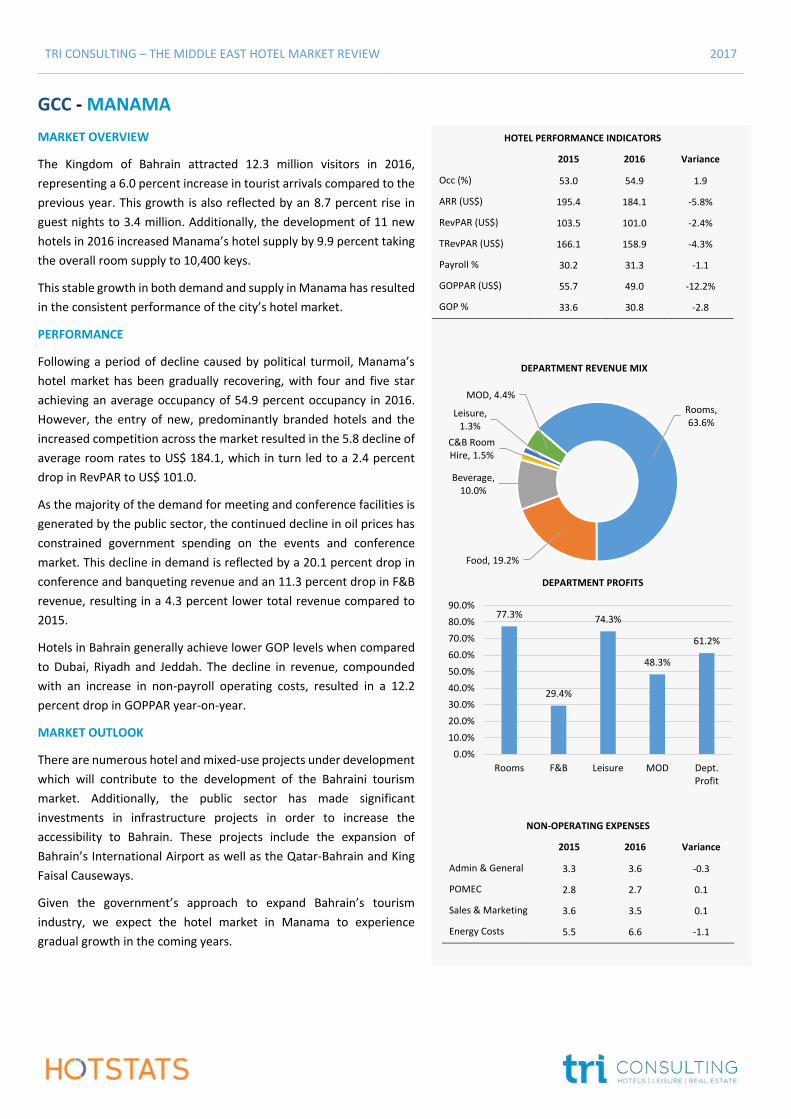
The Kingdom of Bahrain attracted 12.3 million visitors in 2016,
representing a 6.0 percent increase in tourist arrivals compared to the
previous year. This growth is also reflected by an 8.7 percent rise in
guest nights to 3.4 million. Additionally, the development of 11 new
hotels in 2016 increased Manama’s hotel supply by 9.9 percent taking
the overall room supply to 10,400 keys.
This stable growth in both demand and supply in Manama has resulted
in the consistent performance of the city’s hotel market.
PERFORMANCE
Following a period of decline caused by political turmoil, Manama’s
hotel market has been gradually recovering, with four and five star
achieving an average occupancy of 54.9 percent occupancy in 2016.
However, the entry of new, predominantly branded hotels and the
increased competition across the market resulted in the 5.8 decline of
average room rates to US$ 184.1, which in turn led to a 2.4 percent
drop in RevPAR to US$ 101.0.
As the majority of the demand for meeting and conference facilities is
generated by the public sector, the continued decline in oil prices has
constrained government spending on the events and conference
market. This decline in demand is reflected by a 20.1 percent drop in
conference and banqueting revenue and an 11.3 percent drop in F&B
revenue, resulting in a 4.3 percent lower total revenue compared to
2015.
Hotels in Bahrain generally achieve lower GOP levels when compared
to Dubai, Riyadh and Jeddah. The decline in revenue, compounded
with an increase in non-payroll operating costs, resulted in a 12.2
percent drop in GOPPAR year-on-year.
MARKET OUTLOOK
There are numerous hotel and mixed-use projects under development
which will contribute to the development of the Bahraini tourism
market. Additionally, the public sector has made significant
investments in infrastructure projects in order to increase the
accessibility to Bahrain. These projects include the expansion of
Bahrain’s International Airport as well as the Qatar-Bahrain and King
Faisal Causeways.
Given the government’s approach to expand Bahrain’s tourism
industry, we expect the hotel market in Manama to experience
gradual growth in the coming years.
HOTEL PERFORMANCE INDICATORS
2015 2016 Variance
Occ (%) 53.0 54.9 1.9
ARR (US$) 195.4 184.1 -5.8%
RevPAR (US$) 103.5 101.0 -2.4%
TRevPAR (US$) 166.1 158.9 -4.3%
Payroll % 30.2 31.3 -1.1
GOPPAR (US$) 55.7 49.0 -12.2%
GOP % 33.6 30.8 -2.8
NON-OPERATING EXPENSES
2015 2016 Variance
Admin & General 3.3 3.6 -0.3
POMEC 2.8 2.7 0.1
Sales & Marketing 3.6 3.5 0.1
Energy Costs 5.5 6.6 -1.1
Rooms, 63.6%
Food, 19.2%
Beverage, 10.0%
C&B Room Hire, 1.5%
Leisure, 1.3%
MOD, 4.4%
DEPARTMENT REVENUE MIX
77.3%
29.4%
74.3%
48.3%
61.2%
0.0%
10.0%
20.0%
30.0%
40.0%
50.0%
60.0%
70.0%
80.0%
90.0%
Rooms F&B Leisure MOD Dept.Profit
DEPARTMENT PROFITS
TRI CONSULTING – THE MIDDLE EAST HOTEL MARKET REVIEW 2017
COMPANY PROFILE
HotStats provides a unique profit and loss benchmarking service to hoteliers from the UK, Europe and the Middle East,
which enables monthly comparison of hotels’ performance against their competitors. It is distinguished by the fact that
it provides in excess of 100 performance metric comparisons covering 70 areas of hotel revenue, cost, profit and
statistics providing far deeper insight into the hotel operation than any other tool. The HotStats database currently totals
1,650 properties representing 360,000 rooms from 100 different brands; and HotStats is growing continuously.
HotStats also provides a suite of market intelligence reports to support developers’ and investors’ decisions in the
industry. HotStats has developed management information tools for the hospitality sector. And its tools are unlike any
other.
HOW TO GET IN CONTACT
Pablo Alonso
CEO
Mob: +44 (0)7521 077454
TRI CONSULTING – THE MIDDLE EAST HOTEL MARKET REVIEW 2017
COMPANY PROFILE
TRI is one of the region’s leading management consultancies in the fields of hotels, tourism, leisure and real estate. The
company was established in 1995, its founders the first dedicated hospitality advisory team in the region.
In the intervening decades, TRI has gained extensive experience in the Middle East, West Asia, Africa, the CIS, Europe,
North America and Australasia.
Our Core Services include:
Project Development Strategic Planning
- Market and Financial Feasibility Studies
- Pre-Feasibility Studies
- Highest & Best Use Studies
- Tourism Master Plans
- Competitive Benchmarking
- Custom Market Research
Hotel Management Contracts Asset Management
- Hotel Operator Search and Selection
- Hotel Management Contract Negotiation
- Contract Reviews
- Asset Acquisition & Disposition
- Operator Performance and Compliance
- Operational Reviews
HOW TO GET IN CONTACT
Peter Goddard
Managing Director
Mob: +971 50 654 1320
P.O. BOX 319331
Dubai,
United Arab Emirates
Tel: +971 345 4241
Email: [email protected]
Website: www.trimideast.com

TRI CONSULTING – THE MIDDLE EAST HOTEL MARKET REVIEW 2017