The Microwave Spectrum of Acetamide (CH3CONH2) in the Frequency Range from 12 to 200 GHz
11
Journal of Molecular Spectroscopy 215, 144–154 (2002) doi:10.1006/jmsp.2002.8612 The Microwave Spectrum of Acetamide (CH 3 CONH 2 ) in the Frequency Range from 12 to 200 GHz Akira Yamaguchi, Shin’nosuke Hagiwara, Hitoshi Odashima, Kojiro Takagi, and Shozo Tsunekawa Department of Physics, Toyama University, 3190 Gofuku, Toyama 930-8555, Japan E-mail: [email protected] Received April 26, 2002 The microwave spectrum of acetamide (CH 3 CONH 2 ) has been observed in the frequency range from 12 to 200 GHz. New 318 lines in the ground torsional state were assigned and analyzed together with previously reported lines on the basis of the internal axis method. A total of 430 lines were fitted to a weighted unitless standard deviation of 1.7, and molecular parameters were determined. C 2002 Elsevier Science (USA) Key Words: acetamide; CH 3 CONH 2 ; microwave spectrum; rotational transition; internal axis method; interstellar molecule. 1. INTRODUCTION Acetamide (CH 3 CONH 2 ) has an internal rotation of the methyl group whose potential barrier height is as low as ∼24 cm −1 (1). The torsion–rotation spectrum of this molecule is so complicated that only a few analyses of rotational transi- tions were made so far. Kojima et al. observed the microwave spectrum in the 12–40 GHz region, using a conventional Stark modulation spectrometer, and assigned 77 rotational transitions in the ground torsional state to determine molecular parameters and the dipole moment (1, 2). Heineking and Dreizler resolved the 14 N nuclear quadrupole hyperfine structures of 17 rotational transitions assigned by Kojima et al., using a Fourier-transform microwave (FTMW) spectrometer (3). The quadrupole coupling constants and hypothetical hyperfine-free transition frequencies were determined. The difference from the frequencies of unre- solved lines is ∼600 kHz at most. Quite recently Suenram et al. made additional FTMW measurements of the hyperfine struc- tures below 26 GHz and new millimeter-wave measurements in the 78–118 GHz region (4). A total of 115 transitions including previously reported ones were analyzed to determine 28 mole- cular parameters. With these parameters, it is possible to predict accurate transition frequencies of unmeasured lines. The maxi- mum J quantum number of the analyzed rotational transitions was, however, limited to 9 due to lack of measurements at higher frequencies. In the present study, we have extended measurements up to 200 GHz. A set of 318 new lines in the ground torsional state was assigned and analyzed together with the previously reported lines on the basis of an internal axis method (IAM) Hamiltonian (5). The data set covers the quantum number range 0 ≤ J ≤ 15. A total of 430 lines were fitted to a weighted unitless standard deviation of 1.7, and molecular parameters were determined. 2. EXPERIMENTAL PROCEDURE AND ASSIGNMENTS We have recorded the microwave spectrum of acetamide in the frequency range from 12 to 200 GHz. In the measurement, a synthesized sweeper (≤40 GHz) was used as a microwave source, which was combined with microwave amplifiers and multipliers to provide complete coverage of the 12–200 GHz range. Source modulation was used above 40 GHz, while Stark modulation was used in the 12–40 GHz region to prevent distor- tion of baselines. Details on our microwave spectrometer have been described elsewhere (6). More than 25 000 lines have been measured with an estimated uncertainty of 100 kHz. When studying a molecule with a good K a quantum number, methanol, for example, finding a series of rotational transitions with the same K a value, where K a is an eigenvalue of P a , the component of angular momentum along the internal a axis, al- lows us to make their definite assignments. For acetamide, how- ever, K a is not always a good quantum number. From the point of view of rotational energy, K c is a good quantum number because of the oblate character of acetamide, while, from the point of view of torsional energy, K a is a good quantum number. Suenram et al. have proposed a method to give a K a label to a rotation energy level in such a case (4). Even if K a is not a good quantum number, the intensities of transitions belonging to the same series, that is, having the same K a label, would be expected to change smoothly as the J quantum number increases. When a series of transitions are observed successively, more reliable assignments could be made. Furthermore, a systematic obser- vation of transitions enables us to confirm assignments using combination relations. For A-species, 34 series with K a ≤ 7 in the ground torsional state were found according to the prediction from the molecu- lar parameters determined by Suenram et al. The assignments 144 0022-2852/02 $35.00 C 2002 Elsevier Science (USA) All rights reserved.
-
Upload
akira-yamaguchi -
Category
Documents
-
view
214 -
download
0
Transcript of The Microwave Spectrum of Acetamide (CH3CONH2) in the Frequency Range from 12 to 200 GHz
Journal of Molecular Spectroscopy 215, 144–154 (2002)doi:10.1006/jmsp.2002.8612
The Microwave Spectrum of Acetamide (CH3CONH2)in the Frequency Range from 12 to 200 GHz
Akira Yamaguchi, Shin’nosuke Hagiwara, Hitoshi Odashima, Kojiro Takagi, and Shozo Tsunekawa
Department of Physics, Toyama University, 3190 Gofuku, Toyama 930-8555, Japan
E-mail: [email protected]
Received April 26, 2002
The microwave spectrum of acetamide (CH3CONH2) has been observed in the frequency range from 12 to 200 GHz. New318 lines in the ground torsional state were assigned and analyzed together with previously reported lines on the basis of theinternal axis method. A total of 430 lines were fitted to a weighted unitless standard deviation of 1.7, and molecular parameterswere determined. C© 2002 Elsevier Science (USA)
Key Words: acetamide; CH3CONH2; microwave spectrum; rotational transition; internal axis method; interstellar molecule.
1. INTRODUCTION
Acetamide (CH3CONH2) has an internal rotation of themethyl group whose potential barrier height is as low as∼24 cm−1 (1). The torsion–rotation spectrum of this moleculeis so complicated that only a few analyses of rotational transi-tions were made so far. Kojima et al. observed the microwavespectrum in the 12–40 GHz region, using a conventional Starkmodulation spectrometer, and assigned 77 rotational transitionsin the ground torsional state to determine molecular parametersand the dipole moment (1, 2). Heineking and Dreizler resolvedthe 14N nuclear quadrupole hyperfine structures of 17 rotationaltransitions assigned by Kojima et al., using a Fourier-transformmicrowave (FTMW) spectrometer (3). The quadrupole couplingconstants and hypothetical hyperfine-free transition frequencieswere determined. The difference from the frequencies of unre-solved lines is ∼600 kHz at most. Quite recently Suenram et al.made additional FTMW measurements of the hyperfine struc-tures below 26 GHz and new millimeter-wave measurements inthe 78–118 GHz region (4). A total of 115 transitions includingpreviously reported ones were analyzed to determine 28 mole-cular parameters. With these parameters, it is possible to predictaccurate transition frequencies of unmeasured lines. The maxi-mum J quantum number of the analyzed rotational transitionswas, however, limited to 9 due to lack of measurements at higherfrequencies.
In the present study, we have extended measurements up to200 GHz. A set of 318 new lines in the ground torsional statewas assigned and analyzed together with the previously reportedlines on the basis of an internal axis method (IAM) Hamiltonian(5). The data set covers the quantum number range 0 ≤ J ≤ 15.A total of 430 lines were fitted to a weighted unitless standarddeviation of 1.7, and molecular parameters were determined.
1440022-2852/02 $35.00C© 2002 Elsevier Science (USA)All rights reserved.
2. EXPERIMENTAL PROCEDURE AND ASSIGNMENTS
We have recorded the microwave spectrum of acetamide inthe frequency range from 12 to 200 GHz. In the measurement,a synthesized sweeper (≤40 GHz) was used as a microwavesource, which was combined with microwave amplifiers andmultipliers to provide complete coverage of the 12–200 GHzrange. Source modulation was used above 40 GHz, while Starkmodulation was used in the 12–40 GHz region to prevent distor-tion of baselines. Details on our microwave spectrometer havebeen described elsewhere (6). More than 25 000 lines have beenmeasured with an estimated uncertainty of 100 kHz.
When studying a molecule with a good Ka quantum number,methanol, for example, finding a series of rotational transitionswith the same Ka value, where Ka is an eigenvalue of Pa , thecomponent of angular momentum along the internal a axis, al-lows us to make their definite assignments. For acetamide, how-ever, Ka is not always a good quantum number. From the pointof view of rotational energy, Kc is a good quantum numberbecause of the oblate character of acetamide, while, from thepoint of view of torsional energy, Ka is a good quantum number.Suenram et al. have proposed a method to give a Ka label to arotation energy level in such a case (4). Even if Ka is not a goodquantum number, the intensities of transitions belonging to thesame series, that is, having the same Ka label, would be expectedto change smoothly as the J quantum number increases. Whena series of transitions are observed successively, more reliableassignments could be made. Furthermore, a systematic obser-vation of transitions enables us to confirm assignments usingcombination relations.
For A-species, 34 series with Ka ≤ 7 in the ground torsionalstate were found according to the prediction from the molecu-lar parameters determined by Suenram et al. The assignments

MICROWAVE SPECTRUM OF ACETAMIDE (CH3CONH2) 145
of most of 242 new lines were confirmed by loop checks usingcombination relations. For E-species, however, only 8 serieswith 0 ≤ Ka ≤ 3 in the ground torsional state were identified.For lines in these series, loop checks could not be carried outbecause other assigned transitions forming loops were not avail-able. Besides the lines falling into series, several lines were as-signed using combination relations. A total of 76 new lines wereobserved for E-species.
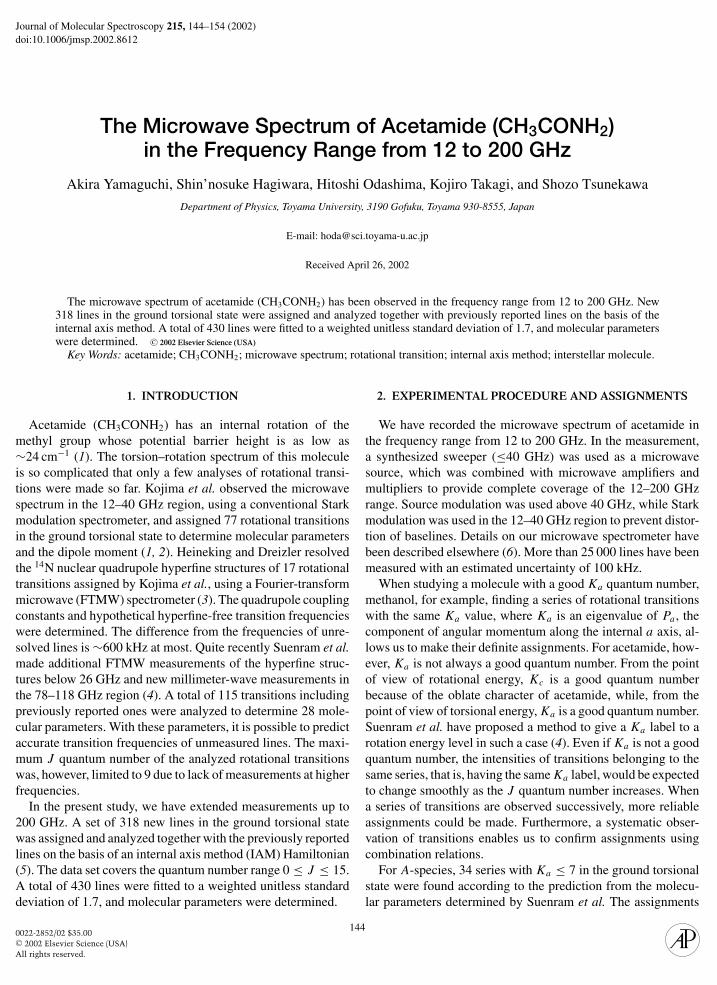
Newly assigned lines for A- and E-species are designated byTYAM in Tables 1 and 2, respectively. A rotational energy level
TABLE 1Observed Frequencies of Rotational Transitions of Acetamide in the Ground A Torsional Substate
J ′ K a′ K c′ p′ J ′′ K a′′ K c′′ p′′ Obs. Freq. (MHz)a O−C (MHz) Ref.b
2 1 1 − 2 0 2 + 13107.525(4) −0.001 HD3 1 2 − 3 0 3 + 23704.416(4) −0.001 HD6 1 5 − 6 0 6 + 56067.860(100) 0.371 TYAM7 1 6 − 7 0 7 + 66369.919(100) 0.190 TYAM8 1 7 − 8 0 8 + 76649.309(100) 0.083 TYAM9 1 8 − 9 0 9 + 86920.640(50) 0.142 NIST
10 1 9 − 10 0 10 + 97187.272(100) −0.044 TYAM11 1 10 − 11 0 11 + 107450.891(100) −0.108 TYAM12 1 11 − 12 0 12 + 117711.965(100) −0.203 TYAM13 1 12 − 13 0 13 + 127971.011(100) −0.159 TYAM14 1 13 − 14 0 14 + 138228.309(100) 0.110 TYAM15 1 14 − 15 0 15 + 148483.607(100) 0.241 TYAM
2 1 1 − 2 1 2 + 12427.404(4) 0.003 NIST3 1 2 − 3 1 3 + 23566.328(4) 0.002 NIST7 1 6 − 7 1 7 + 66369.919(100) 0.257 TYAM8 1 7 − 8 1 8 + 76649.309(100) 0.092 TYAM9 1 8 − 9 1 9 + 86920.640(50) 0.143 NIST
10 1 9 − 10 1 10 + 97187.272(100) −0.044 TYAM11 1 10 − 11 1 11 + 107450.891(100) −0.108 TYAM12 1 11 − 12 1 12 + 117711.965(100) −0.203 TYAM13 1 12 − 13 1 13 + 127971.011(100) −0.159 TYAM14 1 13 − 14 1 14 + 138228.309(100) 0.110 TYAM15 1 14 − 15 1 15 + 148483.607(100) 0.241 TYAM
2 2 1 − 2 1 2 + 19076.094(4) 0.002 HD3 2 2 − 3 1 3 + 26628.442(4) −0.011 HD8 2 7 − 8 1 8 + 76650.304(100) 0.107 TYAM9 2 8 − 9 1 9 + 86920.640(50) −0.004 NIST
10 2 9 − 10 1 10 + 97187.272(100) −0.065 TYAM11 2 10 − 11 1 11 + 107450.891(100) −0.111 TYAM12 2 11 − 12 1 12 + 117711.965(100) −0.204 TYAM13 2 12 − 13 1 13 + 127971.011(100) −0.159 TYAM14 2 13 − 14 1 14 + 138228.309(100) 0.110 TYAM15 2 14 − 15 1 15 + 148483.607(100) 0.241 TYAM
2 2 0 + 2 1 1 − 9254.418(4) 0.002 NIST3 2 1 + 3 1 2 − 12678.267(4) −0.002 HD4 2 2 + 4 1 3 − 21362.140(4) −0.008 NIST5 2 3 + 5 1 4 − 33097.310(100) 0.251 KYNT6 2 4 + 6 1 5 − 44647.326(100) 0.336 TYAM8 2 6 + 8 1 7 − 65853.294(100) 0.139 TYAM9 2 7 + 9 1 8 − 76185.747(100) 0.045 TYAM
11 2 9 + 11 1 10 − 96765.166(100) −0.044 TYAM12 2 10 + 12 1 11 − 107036.880(100) −0.160 TYAM13 2 11 + 13 1 12 − 117301.317(100) −0.252 TYAM
a The numbers in parentheses are the estimated experimental uncertainties in units of the last quoted digits.b KYNT, HD, NIST, and TYAM denote Refs. (2), (3), (4), and present work, respectively.
C© 2002 Elsevier
is denoted by either a set of quantum numbers (J, Ka, Kc, parity)for A-species or (J , signed Ka, Kc) for E-species in conformitywith the notation used by previous researchers (4). The Ka-labelis more effective to assignments than the τ -label used in Ref. (2)which indicates simply the order of the 2J + 1 sublevels of agiven J (7). It is noted that the parity for A-species and theKc-label for E-species are added to give more information.
As shown in Table 1, the four frequencies of the(J + 1)K a+1,K c+1 ← JK a,K c, (J + 1)K a+1,K c+1 ← JK a+1,K c,(J+1)K a,K c+1←JK a,K c, and (J+1)K a,K c+1←JK a+1,K c R-branch
Science (USA)

146 YAMAGUCHI ET AL.
TABLE 1—Continued
J ′ K a′ K c′ p′ J ′′ K a′′ K c′′ p′′ Obs. Freq. (MHz)a O−C (MHz) Ref.b
14 2 12 + 14 1 13 − 127560.018(100) −0.187 TYAM15 2 13 + 15 1 14 − 137813.761(100) −0.032 TYAM
3 2 1 + 3 2 2 − 9616.149(4) 0.007 NIST9 2 7 + 9 2 8 − 76185.747(100) 0.192 TYAM
11 2 9 + 11 2 10 − 96765.166(100) −0.041 TYAM12 2 10 + 12 2 11 − 107036.880(100) −0.160 TYAM13 2 11 + 13 2 12 − 117301.317(100) −0.252 TYAM14 2 12 + 14 2 13 − 127560.018(100) −0.187 TYAM15 2 13 + 15 2 14 − 137813.761(100) −0.032 TYAM
3 3 1 + 3 2 2 − 22769.635(4) 0.009 HD4 3 2 + 4 2 3 − 28207.607(100) 0.265 TYAM5 3 3 + 5 2 4 − 36099.970(100) −0.084 KYNT7 3 5 + 7 2 6 − 55622.156(100) 0.208 TYAM8 3 6 + 8 2 7 − 65894.049(100) 0.109 TYAM
10 3 8 + 10 2 9 − 86484.634(100) −0.076 TYAM11 3 9 + 11 2 10 − 96765.166(100) −0.245 TYAM12 3 10 + 12 2 11 − 107036.880(100) −0.191 TYAM13 3 11 + 13 2 12 − 117301.317(100) −0.257 TYAM14 3 12 + 14 2 13 − 127560.018(100) −0.187 TYAM15 3 13 + 15 2 14 − 137813.761(100) −0.032 TYAM
3 3 0 − 3 2 1 + 14441.705(4) 0.010 HD4 3 1 − 4 2 2 + 14210.349(4) 0.002 NIST5 3 2 − 5 2 3 + 19463.628(4) −0.017 NIST6 3 3 − 6 2 4 + 30094.077(100) 0.037 TYAM8 3 5 − 8 2 6 + 54242.416(100) 0.226 TYAM9 3 6 − 9 2 7 + 65054.694(100) 0.029 TYAM
10 3 7 − 10 2 8 + 75534.088(100) 0.109 TYAM11 3 8 − 11 2 9 + 85899.550(100) −0.016 TYAM12 3 9 − 12 2 10 + 96219.441(100) 0.089 TYAM13 3 10 − 13 2 11 + 106514.272(100) −0.217 TYAM
5 3 2 − 5 3 3 + 16261.362(4) 0.016 NIST11 3 8 − 11 3 9 + 85899.550(100) 0.189 TYAM12 3 9 − 12 3 10 + 96219.441(100) 0.121 TYAM13 3 10 − 13 3 11 + 106514.272(100) −0.212 TYAM
6 4 3 − 6 3 4 + 37005.039(100) −0.011 TYAM7 4 4 − 7 3 5 + 45358.647(100) 0.218 TYAM8 4 5 − 8 3 6 + 55040.758(100) 0.109 TYAM9 4 6 − 9 3 7 + 65243.179(100) 0.010 TYAM
10 4 7 − 10 3 8 + 75573.260(100) 0.044 TYAM12 4 9 − 12 3 10 + 96220.778(100) 0.089 TYAM13 4 10 − 13 3 11 + 106514.804(100) 0.088 TYAM
4 4 0 + 4 3 1 − 21762.719(4) −0.005 NIST5 4 1 + 5 3 2 − 18348.196(4) 0.009 NIST6 4 2 + 6 3 3 − 19422.841(4) −0.009 NIST7 4 3 + 7 3 4 − 26950.763(100) 0.032 TYAM9 4 5 + 9 3 6 − 52131.809(100) 0.284 TYAM
10 4 6 + 10 3 7 − 63776.571(100) 0.226 TYAM5 5 1 + 5 4 2 − 33629.540(100) −0.118 KYNT6 5 2 + 6 4 3 − 34987.862(100) 0.054 TYAM7 5 3 + 7 4 4 − 38944.954(100) 0.030 TYAM8 5 4 + 8 4 5 − 45686.679(100) 0.123 TYAM9 5 5 + 9 4 6 − 54520.866(100) −0.004 TYAM
10 5 6 + 10 4 7 − 64452.852(100) 0.122 TYAM11 5 7 + 11 4 8 − 74770.892(100) 0.171 TYAM13 5 9 + 13 4 10 − 95527.982(100) −0.318 TYAM14 5 10 + 14 4 11 − 105863.174(100) −0.260 TYAM
5 5 0 − 5 4 1 + 30173.900(100) 0.004 KYNT6 5 1 − 6 4 2 + 25149.383(4) 0.000 NIST7 5 2 − 7 4 3 + 22176.686(4) 0.007 NIST8 5 3 − 8 4 4 + 25258.902(4) 0.002 NIST
C© 2002 Elsevier Science (USA)

MICROWAVE SPECTRUM OF ACETAMIDE (CH3CONH2) 147
TABLE 1—Continued
J ′ K a′ K c′ p′ J ′′ K a′′ K c′′ p′′ Obs. Freq. (MHz)a O−C (MHz) Ref.b
9 5 4 − 9 4 5 + 35180.197(100) 0.253 TYAM10 5 5 − 10 4 6 + 48680.225(100) −0.022 TYAM
7 6 2 − 7 5 3 + 40209.445(100) −0.026 TYAM8 6 3 − 8 5 4 + 42143.039(100) 0.119 TYAM9 6 4 − 9 5 5 + 46897.685(100) 0.174 TYAM
10 6 5 − 10 5 6 + 54352.549(100) 0.203 TYAM11 6 6 − 11 5 7 + 63642.065(100) 0.363 TYAM
7 6 1 + 7 5 2 − 33742.950(100) −0.152 KYNT8 6 2 + 8 5 3 − 28030.973(100) 0.026 TYAM9 6 3 + 9 5 4 − 26340.032(100) 0.058 TYAM
10 6 4 + 10 5 5 − 31932.973(100) 0.246 TYAM7 7 0 − 7 6 1 + 46653.280(100) −0.116 TYAM9 7 2 − 9 6 3 + 36407.670(100) 0.170 KYNT
10 7 3 − 10 6 4 + 30821.861(100) 0.144 TYAM11 7 4 − 11 6 5 + 31162.325(100) 0.292 TYAM
1 0 1 + 0 0 0 + 14455.183(4) 0.003 NIST2 0 2 + 1 0 1 + 26304.533(4) 0.006 NIST7 0 7 + 6 0 6 + 77321.393(100) 0.080 TYAM8 0 8 + 7 0 7 + 87632.464(100) 0.004 TYAM9 0 9 + 8 0 8 + 97943.865(100) 0.028 TYAM
10 0 10 + 9 0 9 + 108255.196(100) 0.004 TYAM11 0 11 + 10 0 10 + 118566.539(100) 0.095 TYAM12 0 12 + 11 0 11 + 128877.515(100) −0.036 TYAM13 0 13 + 12 0 12 + 139188.286(100) −0.203 TYAM14 0 14 + 13 0 13 + 149499.134(100) −0.106 TYAM15 0 15 + 14 0 14 + 159809.515(100) −0.278 TYAM
2 1 2 + 1 1 1 + 24767.791(4) 0.006 NIST5 1 5 + 4 1 4 + 56690.238(100) 0.006 TYAM7 1 7 + 6 1 6 + 77320.885(100) −0.001 TYAM8 1 8 + 7 1 7 + 87632.464(100) 0.062 TYAM9 1 9 + 8 1 8 + 97943.865(100) 0.036 TYAM
10 1 10 + 9 1 9 + 108255.196(100) 0.005 TYAM11 1 11 + 10 1 10 + 118566.539(100) 0.095 TYAM12 1 12 + 11 1 11 + 128877.515(100) −0.036 TYAM13 1 13 + 12 1 12 + 139188.286(100) −0.203 TYAM14 1 14 + 13 1 13 + 149499.134(100) −0.106 TYAM15 1 15 + 14 1 14 + 159809.515(100) −0.278 TYAM
1 1 1 + 0 0 0 + 16672.047(4) 0.000 HD2 1 2 + 1 0 1 + 26984.790(100) 0.138 KYNT3 1 3 + 2 0 2 + 36492.680(100) −0.104 KYNT4 1 4 + 3 0 3 + 46473.478(100) 0.010 TYAM5 1 5 + 4 0 4 + 56713.370(100) 0.051 TYAM6 1 6 + 5 0 5 + 67012.111(100) 0.037 TYAM7 1 7 + 6 0 6 + 77321.393(100) 0.013 TYAM8 1 8 + 7 0 7 + 87632.464(100) −0.005 TYAM9 1 9 + 8 0 8 + 97943.865(100) 0.027 TYAM
10 1 10 + 9 0 9 + 108255.196(100) 0.004 TYAM11 1 11 + 10 0 10 + 118566.539(100) 0.095 TYAM12 1 12 + 11 0 11 + 128877.515(100) −0.036 TYAM13 1 13 + 12 0 12 + 139188.286(100) −0.203 TYAM14 1 14 + 13 0 13 + 149499.134(100) −0.106 TYAM15 1 15 + 14 0 14 + 159809.515(100) −0.278 TYAM
2 0 2 + 1 1 1 + 24087.672(4) 0.012 HD3 0 3 + 2 1 2 + 35674.630(100) 0.062 KYNT4 0 4 + 3 1 3 + 46312.343(100) 0.053 TYAM5 0 5 + 4 1 4 + 56686.764(100) 0.017 TYAM6 0 6 + 5 1 5 + 67008.113(100) 0.018 TYAM7 0 7 + 6 1 6 + 77320.885(100) 0.066 TYAM8 0 8 + 7 1 7 + 87632.464(100) 0.071 TYAM9 0 9 + 8 1 8 + 97943.865(100) 0.037 TYAM
C© 2002 Elsevier Science (USA)
148 YAMAGUCHI ET AL.
TABLE 1—Continued
J ′ K a′ K c′ p′ J ′′ K a′′ K c′′ p′′ Obs. Freq. (MHz)a O−C (MHz) Ref.b
10 0 10 + 9 1 9 + 108255.196(100) 0.005 TYAM11 0 11 + 10 1 10 + 118566.539(100) 0.095 TYAM12 0 12 + 11 1 11 + 128877.515(100) −0.036 TYAM13 0 13 + 12 1 12 + 139188.286(100) −0.203 TYAM14 0 14 + 13 1 13 + 149499.134(100) −0.106 TYAM15 0 15 + 14 1 14 + 159809.515(100) −0.278 TYAM
8 1 7 − 7 1 6 − 97911.808(100) −0.149 TYAM9 1 8 − 8 1 7 − 108215.150(50) 0.041 NIST
10 1 9 − 9 1 8 − 118521.911(100) −0.099 TYAM11 1 10 − 10 1 9 − 128830.116(100) −0.010 TYAM12 1 11 − 11 1 10 − 139138.698(100) −0.023 TYAM13 1 12 − 12 1 11 − 149447.446(100) −0.044 TYAM14 1 13 − 13 1 12 − 159756.297(100) 0.027 TYAM15 1 14 − 14 1 13 − 170064.993(100) 0.034 TYAM
5 2 4 − 4 2 3 − 66692.315(100) −0.019 TYAM6 2 5 − 5 2 4 − 77236.185(100) 0.040 TYAM8 2 7 − 7 2 6 − 97906.761(100) 0.059 TYAM9 2 8 − 8 2 7 − 108214.050(50) −0.226 NIST
10 2 9 − 9 2 8 − 118521.911(100) 0.027 TYAM11 2 10 − 10 2 9 − 128830.116(100) 0.008 TYAM12 2 11 − 11 2 10 − 139138.698(100) −0.020 TYAM13 2 12 − 12 2 11 − 149447.446(100) −0.044 TYAM14 2 13 − 13 2 12 − 159756.297(100) 0.027 TYAM15 2 14 − 14 2 13 − 170064.993(100) 0.034 TYAM
2 2 1 − 1 1 0 − 39701.320(100) −0.061 KYNT4 2 3 − 3 1 2 − 58643.384(100) −0.074 TYAM5 2 4 − 4 1 3 − 67600.218(100) −0.077 TYAM6 2 5 − 5 1 4 − 77435.406(100) −0.043 TYAM7 2 6 − 6 1 5 − 87629.780(100) −0.007 TYAM8 2 7 − 7 1 6 − 97912.901(100) −0.036 TYAM9 2 8 − 8 1 7 − 108215.150(50) −0.106 NIST
10 2 9 − 9 1 8 − 118521.911(100) −0.120 TYAM11 2 10 − 10 1 9 − 128830.116(100) −0.013 TYAM12 2 11 − 11 1 10 − 139138.698(100) −0.023 TYAM13 2 12 − 12 1 11 − 149447.446(100) −0.044 TYAM14 2 13 − 13 1 12 − 159756.297(100) 0.027 TYAM15 2 14 − 14 1 13 − 170064.993(100) 0.034 TYAM
3 1 2 − 2 2 1 − 40302.920(100) 0.027 KYNT4 1 3 − 3 2 2 − 54673.363(100) −0.006 TYAM5 1 4 − 4 2 3 − 66493.027(100) −0.003 TYAM6 1 5 − 5 2 4 − 77199.036(100) −0.040 TYAM7 1 6 − 6 2 5 − 87586.473(100) −0.010 TYAM8 1 7 − 7 2 6 − 97905.687(100) −0.035 TYAM9 1 8 − 8 2 7 − 108214.050(50) −0.080 NIST
10 1 9 − 9 2 8 − 118521.911(100) 0.048 TYAM11 1 10 − 10 2 9 − 128830.116(100) 0.011 TYAM12 1 11 − 11 2 10 − 139138.698(100) −0.020 TYAM13 1 12 − 12 2 11 − 149447.446(100) −0.044 TYAM14 1 13 − 13 2 12 − 159756.297(100) 0.027 TYAM15 1 14 − 14 2 13 − 170064.993(100) 0.034 TYAM
8 2 6 + 7 2 5 + 108347.432(100) −0.292 TYAM9 2 7 + 8 2 6 + 118547.697(100) 0.041 TYAM
11 2 9 + 10 2 8 + 139112.019(100) 0.142 TYAM12 2 10 + 11 2 9 + 149410.918(100) 0.366 TYAM13 2 11 + 12 2 10 + 159712.085(100) 0.066 TYAM14 2 12 + 13 2 11 + 170014.979(100) 0.073 TYAM15 2 13 + 14 2 12 + 180318.770(100) 0.223 TYAM
4 3 2 + 3 3 1 + 61019.255(100) 0.208 TYAM7 3 5 + 6 3 4 + 97680.510(50) −0.106 NIST9 3 7 + 8 3 6 + 118513.518(100) 0.088 TYAM
C© 2002 Elsevier Science (USA)

MICROWAVE SPECTRUM OF ACETAMIDE (CH3CONH2) 149
TABLE 1—Continued
J ′ K a′ K c′ p′ J ′′ K a′′ K c′′ p′′ Obs. Freq. (MHz)a O−C (MHz) Ref.b
11 3 9 + 10 3 8 + 139110.462(100) −0.346 TYAM12 3 10 + 11 3 9 + 149410.918(100) 0.539 TYAM13 3 11 + 12 3 10 + 159712.085(100) 0.093 TYAM14 3 12 + 13 3 11 + 170014.979(100) 0.078 TYAM15 3 13 + 14 3 12 + 180318.770(100) 0.224 TYAM
3 3 1 + 2 2 0 + 63528.996(100) 0.076 TYAM4 3 2 + 3 2 1 + 74172.543(100) 0.012 TYAM5 3 3 + 4 2 2 + 82338.180(50) −0.022 NIST7 3 5 + 6 2 4 + 98604.620(50) −0.124 NIST8 3 6 + 7 2 5 + 108389.300(50) −0.189 NIST9 3 7 + 8 2 6 + 118554.925(100) −0.269 TYAM
10 3 8 + 9 2 7 + 128820.923(100) −0.117 TYAM11 3 9 + 10 2 8 + 139112.019(100) −0.062 TYAM12 3 10 + 11 2 9 + 149410.918(100) 0.335 TYAM13 3 11 + 12 2 10 + 159712.085(100) 0.061 TYAM14 3 12 + 13 2 11 + 170014.979(100) 0.073 TYAM15 3 13 + 14 2 12 + 180318.770(100) 0.223 TYAM
5 2 3 + 4 3 2 + 71382.676(100) −0.071 TYAM6 2 4 + 5 3 3 + 85746.010(100) −0.001 TYAM7 2 5 + 6 3 4 + 97469.748(100) −0.073 TYAM8 2 6 + 7 3 5 + 108136.930(50) 0.000 NIST9 2 7 + 8 3 6 + 118505.847(100) −0.044 TYAM
10 2 8 + 9 3 7 + 128812.182(100) −0.046 TYAM11 2 9 + 10 3 8 + 139110.462(100) −0.142 TYAM12 2 10 + 11 3 9 + 149410.918(100) 0.571 TYAM13 2 11 + 12 3 10 + 159712.085(100) 0.098 TYAM14 2 12 + 13 3 11 + 170014.979(100) 0.078 TYAM15 2 13 + 14 3 12 + 180318.770(100) 0.224 TYAM
8 3 5 − 7 3 4 − 119997.442(100) −0.309 TYAM10 3 7 − 9 3 6 − 139299.122(100) 0.041 TYAM
5 4 2 − 4 4 1 − 77854.546(100) 0.221 TYAM7 4 4 − 6 4 3 − 106033.870(50) −0.125 NIST8 4 5 − 7 4 4 − 117860.770(50) −0.144 NIST4 4 1 − 3 3 0 − 87419.544(100) 0.009 TYAM5 4 2 − 4 3 1 − 99085.840(50) 0.007 NIST6 4 3 − 5 3 2 − 107413.571(100) −0.274 TYAM7 4 4 − 6 3 3 − 113869.095(100) −0.039 TYAM8 4 5 − 7 3 4 − 120837.597(100) −0.377 TYAM9 4 6 − 8 3 5 − 129555.878(100) −0.295 TYAM
10 4 7 − 9 3 6 − 139339.389(100) −0.202 TYAM11 4 8 − 10 3 7 − 149485.160(100) 0.009 TYAM12 4 9 − 11 3 8 − 159731.666(100) −0.040 TYAM13 4 10 − 12 3 9 − 170007.568(100) 0.180 TYAM14 4 11 − 13 3 10 − 180293.711(100) 0.262 TYAM
7 3 4 − 6 4 3 − 103056.950(50) 0.016 NIST8 3 5 − 7 4 4 − 117020.700(50) 0.009 NIST9 3 6 − 8 4 5 − 128519.836(100) −0.072 TYAM
10 3 7 − 9 4 6 − 139103.083(100) 0.044 TYAM11 3 8 − 10 4 7 − 149436.870(100) −0.084 TYAM12 3 9 − 11 4 8 − 159722.684(100) 0.034 TYAM13 3 10 − 12 4 9 − 170005.969(100) 0.182 TYAM
5 4 1 + 4 4 0 + 80974.528(100) −0.136 TYAM7 4 3 + 6 4 2 + 118419.976(100) 0.022 TYAM9 4 5 + 8 4 4 + 142249.122(100) −0.276 TYAM
10 4 6 + 9 4 5 + 150943.764(100) −0.137 TYAM11 4 7 + 10 4 6 + 160309.700(100) −0.067 TYAM
5 5 1 + 4 4 0 + 110952.624(100) −0.144 TYAM6 5 2 + 5 4 1 + 124053.472(100) 0.006 TYAM7 5 3 + 6 4 2 + 133391.026(100) −0.182 TYAM8 5 4 + 7 4 3 + 139573.836(100) 0.037 TYAM
C© 2002 Elsevier Science (USA)

150 YAMAGUCHI ET AL.
TABLE 1—Continued
J ′ K a′ K c′ p′ J ′′ K a′′ K c′′ p′′ Obs. Freq. (MHz)a O−C (MHz) Ref.b
9 5 5 + 8 4 4 + 144834.501(100) −0.284 TYAM10 5 6 + 9 4 5 + 151660.418(100) −0.377 TYAM11 5 7 + 10 4 6 + 160479.389(100) −0.138 TYAM12 5 8 + 11 4 7 + 170282.873(100) 0.195 TYAM
6 4 2 + 5 5 1 + 70674.901(100) −0.364 TYAM7 4 3 + 6 5 2 + 95019.801(100) −0.056 TYAM8 4 4 + 7 5 3 + 117318.020(50) −0.005 NIST
10 4 6 + 9 5 5 + 148358.653(100) 0.140 TYAM11 4 7 + 10 5 6 + 159593.069(100) 0.196 TYAM12 4 8 + 11 5 7 + 170077.067(100) 0.296 TYAM
4 2 2 + 3 1 3 + 102663.960(50) −0.010 NIST5 2 3 + 4 1 4 + 135464.633(100) 0.138 TYAM4 3 1 − 3 2 2 − 90245.830(50) −0.035 NIST4 4 0 + 3 3 1 + 89238.980(50) 0.018 NIST5 4 1 + 4 3 2 + 109194.570(50) −0.009 NIST5 5 0 − 4 4 1 − 111679.650(50) −0.125 NIST6 5 1 − 5 4 2 − 129454.241(100) −0.065 TYAM7 5 2 − 6 4 3 − 152184.392(100) 0.048 TYAM8 5 3 − 7 4 4 − 181522.071(100) 0.222 TYAM2 2 1 − 2 0 2 + 19756.214(4) −0.003 NIST9 2 8 − 9 0 9 + 86920.640(50) −0.005 NIST3 3 1 + 3 1 2 − 25831.748(4) −0.005 NIST4 3 2 + 3 0 3 + 110555.210(50) −0.007 NIST
TABLE 2Observed Frequencies of Rotational Transitions of Acetamide in the Ground E Torsional Substate
J ′ K a′ K c′ J ′′ K a′′ K c′′ Obs. Freq. (MHz)a O−C (MHz) Ref.b
3 1 3 2 1 2 33393.560(100) 0.095 KYNT7 1 7 6 1 6 77329.971(100) −0.113 TYAM8 1 8 7 1 7 87604.785(100) 0.108 TYAM9 1 9 8 1 8 97893.431(100) 0.070 TYAM
10 1 10 9 1 9 108190.103(100) −0.004 TYAM11 1 11 10 1 10 118491.842(100) 0.124 TYAM12 1 12 11 1 11 128796.486(100) 0.088 TYAM13 1 13 12 1 12 139103.083(100) 0.008 TYAM14 1 14 13 1 13 149410.918(100) −0.156 TYAM15 1 15 14 1 14 159720.019(100) 0.061 TYAM
3 2 2 2 2 1 38585.140(100) 0.025 KYNT7 2 6 6 2 5 77331.262(100) 0.142 TYAM8 2 7 7 2 6 87604.785(100) −0.015 TYAM9 2 8 8 2 7 97893.431(100) 0.057 TYAM
10 2 9 9 2 8 108190.103(100) −0.002 TYAM11 2 10 10 2 9 118491.842(100) 0.131 TYAM12 2 11 11 2 10 128796.486(100) 0.102 TYAM13 2 12 12 2 11 139103.083(100) 0.033 TYAM14 2 13 13 2 12 149410.918(100) −0.119 TYAM15 2 14 14 2 13 159720.019(100) 0.116 TYAM
2 2 1 1 1 1 22095.527(4) −0.011 HD3 2 2 2 1 2 32640.030(100) −0.022 KYNT4 2 3 3 1 3 46534.254(100) −0.060 TYAM5 2 4 4 1 4 56860.903(100) 0.038 TYAM6 2 5 5 1 5 67079.738(100) 0.001 TYAM7 2 6 6 1 6 77329.971(100) 0.027 TYAM8 2 7 7 1 7 87604.785(100) 0.125 TYAM
a The numbers in parentheses are the estimated experimental uncertainties in units of the last quoted digits.b KYNT, HD, NIST, and TYAM denote Refs. (2), (3), (4), and present work, respectively.
C© 2002 Elsevier Science (USA)
MICROWAVE SPECTRUM OF ACETAMIDE (CH3CONH2) 151
TABLE 2—Continued
J ′ K a′ K c′ J ′′ K a′′ K c′′ Obs. Freq. (MHz)a O−C (MHz) Ref.b
9 2 8 8 1 8 97893.431(100) 0.074 TYAM10 2 9 9 1 9 108190.103(100) 0.002 TYAM11 2 10 10 1 10 118491.842(100) 0.137 TYAM12 2 11 11 1 11 128796.486(100) 0.116 TYAM13 2 12 12 1 12 139103.083(100) 0.061 TYAM14 2 13 13 1 13 149410.918(100) −0.067 TYAM15 2 14 14 1 14 159720.019(100) 0.206 TYAM
3 1 3 2 2 1 39338.450(100) −0.077 KYNT4 1 4 3 2 2 47373.036(100) −0.302 TYAM5 1 5 4 2 3 56956.428(100) 0.015 TYAM6 1 6 5 2 4 67090.850(100) 0.000 TYAM7 1 7 6 2 5 77331.262(100) 0.002 TYAM8 1 8 7 2 6 87604.785(100) −0.032 TYAM9 1 9 8 2 7 97893.431(100) 0.053 TYAM
10 1 10 9 2 8 108190.103(100) −0.008 TYAM11 1 11 10 2 9 118491.842(100) 0.118 TYAM12 1 12 11 2 10 128796.486(100) 0.074 TYAM13 1 13 12 2 11 139103.083(100) −0.020 TYAM14 1 14 13 2 12 149410.918(100) −0.209 TYAM15 1 15 14 2 13 159720.019(100) −0.028 TYAM
1 0 1 0 0 0 14488.861(4) −0.009 NIST9 0 9 8 0 8 107988.299(100) −0.246 TYAM
10 0 10 9 0 9 118206.442(100) 0.091 TYAM11 0 11 10 0 10 128448.784(100) −0.204 TYAM12 0 12 11 0 11 138706.177(100) −0.311 TYAM13 0 13 12 0 12 148973.018(100) −0.227 TYAM
4 3 2 3 3 1 59499.900(100) −0.001 TYAM9 3 7 8 3 6 107990.334(100) 0.235 TYAM
10 3 8 9 3 7 118206.442(100) −0.107 TYAM11 3 9 10 3 8 128448.784(100) −0.114 TYAM12 3 10 11 3 9 138706.177(100) −0.190 TYAM13 3 11 12 3 10 148973.018(100) −0.046 TYAM
3 3 1 2 0 2 33238.690(100) 0.122 KYNT6 3 4 5 0 5 77563.457(100) 0.042 TYAM7 3 5 6 0 6 87690.040(100) −0.046 TYAM8 3 6 7 0 7 97810.922(100) −0.019 TYAM9 3 7 8 0 8 107988.299(100) −0.018 TYAM
10 3 8 9 0 9 118206.442(100) 0.121 TYAM11 3 9 10 0 10 128448.784(100) −0.085 TYAM12 3 10 11 0 11 138706.177(100) −0.071 TYAM13 3 11 12 0 12 148973.018(100) 0.194 TYAM14 3 12 13 0 13 159245.220(100) 0.079 TYAM15 3 13 14 0 14 169520.957(100) −0.048 TYAM
3 0 3 3 3 1 12587.549(4) 0.015 HD6 0 6 5 3 3 78230.747(100) 0.087 TYAM7 0 7 6 3 4 87792.297(100) 0.132 TYAM8 0 8 7 3 5 97825.554(100) −0.010 TYAM9 0 9 8 3 6 107990.334(100) 0.008 TYAM
10 0 10 9 3 7 118206.442(100) −0.136 TYAM11 0 11 10 3 8 128448.784(100) −0.233 TYAM
3 −1 2 2 −2 0 18651.553(4) −0.008 NIST4 −1 3 3 −2 1 35226.540(100) −0.024 KYNT5 −1 4 4 −2 2 38352.926(100) 0.016 TYAM2 0 2 1 −1 0 9050.672(4) −0.016 NIST3 0 3 2 −1 1 24934.506(4) 0.003 HD2 1 2 1 0 1 14651.888(4) 0.001 NIST5 −1 4 4 −1 3 64548.952(100) −0.001 TYAM5 −4 1 4 −3 1 113867.640(50) 0.004 NIST4 −3 1 3 −2 1 93563.980(50) 0.012 NIST5 −3 2 4 −2 2 109349.152(100) −0.037 TYAM
C© 2002 Elsevier Science (USA)
152 YAMAGUCHI ET AL.
TABLE 2—Continued
J ′ K a′ K c′ J ′′ K a′′ K c′′ Obs. Freq. (MHz)a O−C (MHz) Ref.b
2 −2 0 1 −1 0 56911.361(100) 0.025 TYAM4 −2 2 3 −1 2 88282.550(50) 0.103 NIST5 −2 3 4 −1 3 104205.689(100) 0.090 TYAM5 −1 4 4 0 4 97552.840(50) 0.123 NIST3 3 1 3 2 2 15714.277(4) 0.003 HD4 4 1 4 3 2 17352.782(4) 0.000 NIST5 4 2 5 3 3 25074.295(4) 0.002 NIST6 4 3 6 3 4 38590.030(100) −0.084 KYNT5 5 1 5 4 2 21218.769(4) −0.007 NIST6 5 2 6 4 3 24013.136(4) −0.011 NIST6 6 1 6 5 2 25466.691(4) −0.002 NIST7 6 2 7 5 3 25665.720(4) 0.006 NIST7 7 1 7 6 2 28991.340(100) 0.176 KYNT5 −4 1 5 −3 2 36659.670(100) −0.138 KYNT4 −3 1 4 −2 2 32141.200(100) −0.161 KYNT5 −3 2 5 −2 3 31339.620(100) −0.013 KYNT2 −2 0 2 −1 1 26969.070(100) 0.020 KYNT3 −2 1 3 −1 2 26859.790(100) −0.050 KYNT4 −2 2 4 −1 3 26196.047(4) 0.004 NIST5 −2 3 5 −1 4 39656.527(100) −0.119 TYAM1 −1 0 1 0 1 20716.965(4) 0.008 HD2 −1 1 2 0 2 20891.601(4) 0.002 HD3 −1 2 3 0 3 20686.106(4) −0.002 HD4 −1 3 4 0 4 33003.900(100) 0.136 KYNT1 0 1 1 1 1 13388.703(4) −0.011 NIST2 0 2 2 1 2 15115.748(4) −0.011 NIST4 4 1 3 −2 1 16719.230(4) 0.029 NIST3 3 1 2 −1 1 12346.958(4) −0.011 NIST4 4 1 4 0 4 14496.404(4) 0.003 NIST5 4 2 5 0 5 24496.280(4) −0.005 NIST2 2 1 1 0 1 8706.829(4) 0.005 NIST4 4 1 3 2 2 92566.860(50) −0.097 NIST3 3 1 3 1 3 14960.874(4) 0.012 NIST5 −3 2 5 −1 4 70996.197(100) −0.082 TYAM2 0 2 2 2 1 21060.817(4) −0.004 NIST4 −1 3 4 4 1 18507.374(4) 0.011 HD5 −2 3 5 5 1 23996.933(4) 0.012 NIST
transitions of a given Ka-label for A-species get closer as J andtherefore Kc increase, because the JK a,K c and JK a+1,K c levelswith higher Kc are almost degenerate. The three frequen-cies of the JK a+1,K c−1 ← JK a,K c, JK a+1,K c−1 ← JK a+1,K c, andJK a+2,K c−1← JK a+1,K c Q-branch transitions of a given Ka labelalso get closer for higher J and Kc, because the JK a+2,K c−1
and JK a+1,K c−1 levels are almost degenerate as well as theJK a+1,K c and JK a,K c levels. These degeneracies are character-istic of the rotational energy level structure of acetamide in theground A torsional substate which is similar to that of an oblateasymmetric-top molecule. It is noted that the number of newlyassigned transitions is somewhat more than that of observed fre-quencies, since multiple assignments are sometimes given to anobserved frequency.
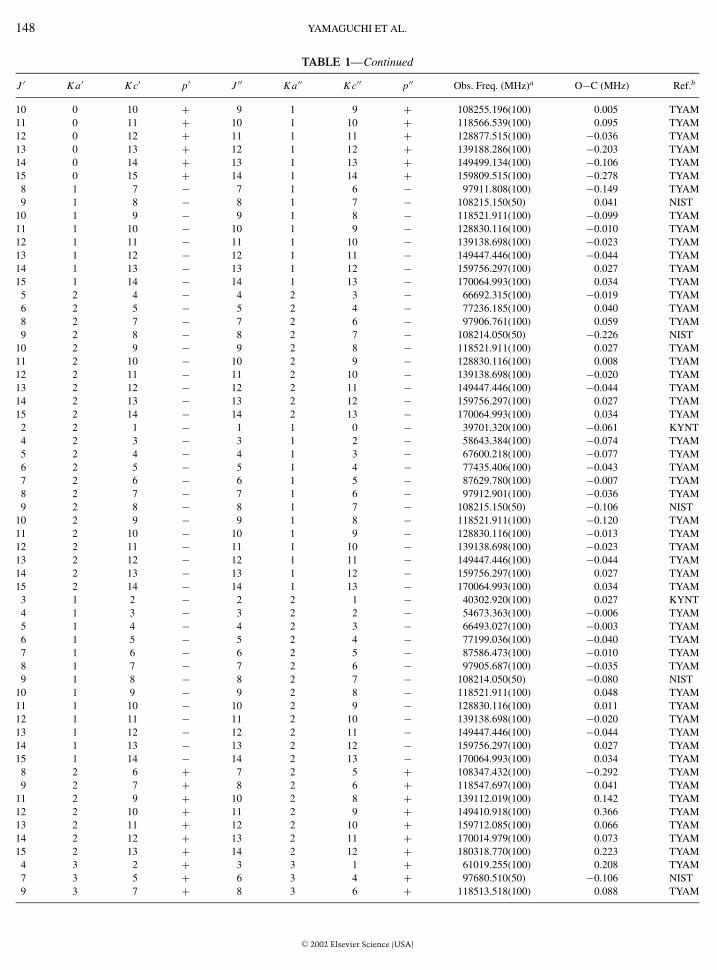
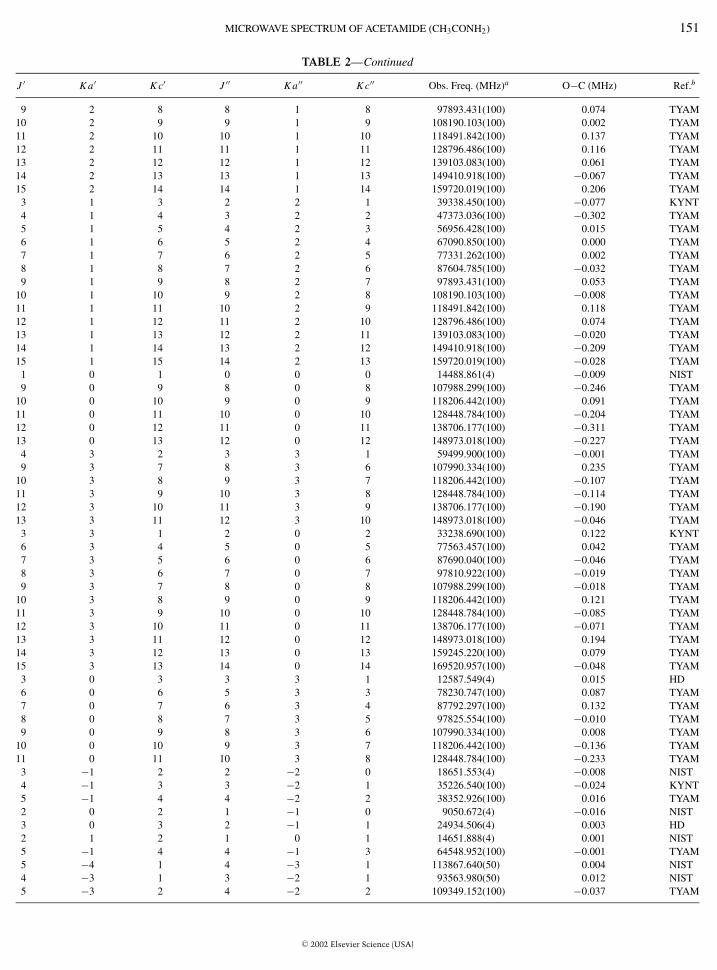
As shown in Table 2, similar bunching of four R-branchtransition frequencies is also found for two groups of E-specieslines: one involves levels with Ka = 2 and 1, the other levelswith Ka = 3 and 0. This bunching for E-species arises from
C© 2002 Elsevier
an origin similar to that for A-species. For lower-J levels ofE-species, Ka-variation of the torsional energy dominates therotational energy level structure, and signed Ka is a fairly goodquantum number. Therefore, based on this Ka value, a Ka-labelis given to a rotational level. In order of increasing of the torsion–rotation energy, each level has a Ka-label of 2, 1, 3, 0, 4, −1,5, −2, and so on (4). For higher J , however, the adjacent levelswith Ka = 3, 0 get degenerate as well as those with Ka = 2, 1,because the variation of rotational energy of the 2J + 1 sublevelsof a given J , as an oblate asymmetric-top molecule, becomesmuch larger than the Ka-variation of the torsional energy. Thisdegeneracy causes the frequency bunching. When the oblateasymmetric-top character for higher J is taken into account, theobserved b-type R-branch transitions related to the lowest fourlevels with Ka = 2, 1, 3, and 0 are strongly allowed. However,we failed to observe transitions involving higher adjacent levels,such as (J + 1, −1) ← (J, 4) and (J + 1, −2) ← (J, 5), near thepredicted frequencies.
Science (USA)
MICROWAVE SPECTRUM OF ACETAMIDE (CH3CONH2) 153
lines.
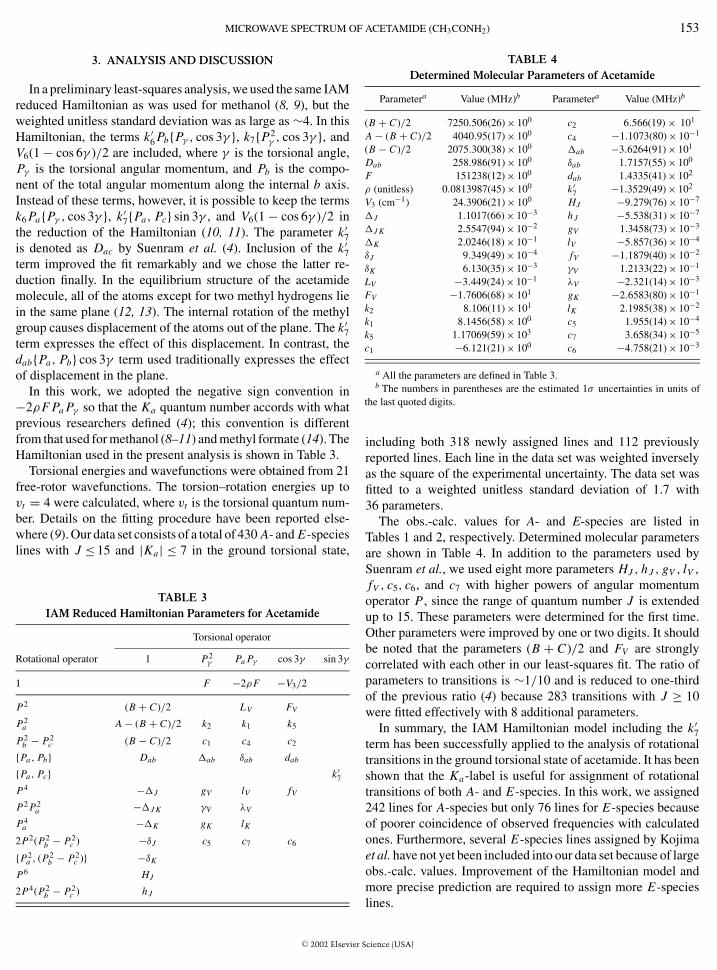
3. ANALYSIS AND DISCUSSION
In a preliminary least-squares analysis, we used the same IAMreduced Hamiltonian as was used for methanol (8, 9), but theweighted unitless standard deviation was as large as ∼4. In thisHamiltonian, the terms k ′
6 Pb{Pγ , cos 3γ }, k7{P2γ , cos 3γ }, and
V6(1 − cos 6γ )/2 are included, where γ is the torsional angle,Pγ is the torsional angular momentum, and Pb is the compo-nent of the total angular momentum along the internal b axis.Instead of these terms, however, it is possible to keep the termsk6 Pa{Pγ , cos 3γ }, k ′
7{Pa, Pc} sin 3γ , and V6(1 − cos 6γ )/2 inthe reduction of the Hamiltonian (10, 11). The parameter k ′
7is denoted as Dac by Suenram et al. (4). Inclusion of the k ′
7term improved the fit remarkably and we chose the latter re-duction finally. In the equilibrium structure of the acetamidemolecule, all of the atoms except for two methyl hydrogens liein the same plane (12, 13). The internal rotation of the methylgroup causes displacement of the atoms out of the plane. The k ′
7term expresses the effect of this displacement. In contrast, thedab{Pa, Pb} cos 3γ term used traditionally expresses the effectof displacement in the plane.
In this work, we adopted the negative sign convention in−2ρF Pa Pγ so that the Ka quantum number accords with whatprevious researchers defined (4); this convention is differentfrom that used for methanol (8–11) and methyl formate (14). TheHamiltonian used in the present analysis is shown in Table 3.
Torsional energies and wavefunctions were obtained from 21free-rotor wavefunctions. The torsion–rotation energies up tovt = 4 were calculated, where vt is the torsional quantum num-ber. Details on the fitting procedure have been reported else-where (9). Our data set consists of a total of 430 A- and E-specieslines with J ≤ 15 and |Ka| ≤ 7 in the ground torsional state,
TABLE 3IAM Reduced Hamiltonian Parameters for Acetamide
Torsional operator
Rotational operator 1 P2γ Pa Pγ cos 3γ sin 3γ
1 F −2ρF −V3/2
P2 (B + C)/2 LV FV
P2a A − (B + C)/2 k2 k1 k5
P2b − P2
c (B − C)/2 c1 c4 c2
{Pa, Pb} Dab �ab δab dab
{Pa, Pc} k′7
P4 −�J gV lV fV
P2 P2a −�J K γV λV
P4a −�K gK lK
2P2(P2b − P2
c ) −δJ c5 c7 c6
{P2a , (P2
b − P2c )} −δK
P6 HJ
2P4(P2b − P2
c ) h J
C© 2002 Elsevier
TABLE 4Determined Molecular Parameters of Acetamide
Parametera Value (MHz)b Parametera Value (MHz)b
(B + C)/2 7250.506(26) × 100 c2 6.566(19) × 101
A − (B + C)/2 4040.95(17) × 100 c4 −1.1073(80) × 10−1
(B − C)/2 2075.300(38) × 100 �ab −3.6264(91) × 101
Dab 258.986(91) × 100 δab 1.7157(55) × 100
F 151238(12) × 100 dab 1.4335(41) × 102
ρ (unitless) 0.0813987(45) × 100 k′7 −1.3529(49) × 102
V3 (cm−1) 24.3906(21) × 100 HJ −9.279(76) × 10−7
�J 1.1017(66) × 10−3 h J −5.538(31) × 10−7
�J K 2.5547(94) × 10−2 gV 1.3458(73) × 10−3
�K 2.0246(18) × 10−1 lV −5.857(36) × 10−4
δJ 9.349(49) × 10−4 fV −1.1879(40) × 10−2
δK 6.130(35) × 10−3 γV 1.2133(22) × 10−1
LV −3.449(24) × 10−1 λV −2.321(14) × 10−3
FV −1.7606(68) × 101 gK −2.6583(80) × 10−1
k2 8.106(11) × 101 lK 2.1985(38) × 10−2
k1 8.1456(58) × 100 c5 1.955(14) × 10−4
k5 1.17069(59) × 103 c7 3.658(34) × 10−5
c1 −6.121(21) × 100 c6 −4.758(21) × 10−3
a All the parameters are defined in Table 3.b The numbers in parentheses are the estimated 1σ uncertainties in units of
the last quoted digits.
including both 318 newly assigned lines and 112 previouslyreported lines. Each line in the data set was weighted inverselyas the square of the experimental uncertainty. The data set wasfitted to a weighted unitless standard deviation of 1.7 with36 parameters.
The obs.-calc. values for A- and E-species are listed inTables 1 and 2, respectively. Determined molecular parametersare shown in Table 4. In addition to the parameters used bySuenram et al., we used eight more parameters HJ , h J , gV , lV ,
fV , c5, c6, and c7 with higher powers of angular momentumoperator P , since the range of quantum number J is extendedup to 15. These parameters were determined for the first time.Other parameters were improved by one or two digits. It shouldbe noted that the parameters (B + C)/2 and FV are stronglycorrelated with each other in our least-squares fit. The ratio ofparameters to transitions is ∼1/10 and is reduced to one-thirdof the previous ratio (4) because 283 transitions with J ≥ 10were fitted effectively with 8 additional parameters.
In summary, the IAM Hamiltonian model including the k ′7
term has been successfully applied to the analysis of rotationaltransitions in the ground torsional state of acetamide. It has beenshown that the Ka-label is useful for assignment of rotationaltransitions of both A- and E-species. In this work, we assigned242 lines for A-species but only 76 lines for E-species becauseof poorer coincidence of observed frequencies with calculatedones. Furthermore, several E-species lines assigned by Kojimaet al. have not yet been included into our data set because of largeobs.-calc. values. Improvement of the Hamiltonian model andmore precise prediction are required to assign more E-species
Science (USA)
154 YAMAGUCHI ET AL.
ACKNOWLEDGMENTS
The authors thank Mr. Munakata, Mr. Nakagawa, Ms. Monda, and Mr. Ogatafor their help in the experiment and analysis. They are grateful to Dr. J. T. Hougenfor his correction of the English written in the manuscript. This work was partlysupported by a Grant-in-Aid from the Ministry of Education, Science, Sports,and Culture of Japan. The authors thank the Computer Center of the Institute forMolecular Science for the use of the Fujitsu VPP5000 and NEC SX-5 computers.The calculation was also carried out at Computing and Network Services ofToyama University.
REFERENCES
1. T. Kojima, E. Yano, K. Nakagawa, and S. Tsunekawa, J. Mol. Spectrosc.112, 494–495 (1985).
2. T. Kojima, E. Yano, K. Nakagawa, and S. Tsunekawa, J. Mol. Spectrosc.122, 408–416 (1987).
3. N. Heineking and H. Dreizler, Z. Naturforsch. A 48, 787–792 (1993).
C© 2002 Elsevier
4. R. D. Suenram, G. Yu. Golubiatnikov, I. I. Leonov, J. T. Hougen, J. Ortigoso,I. Kleiner, and G. T. Fraser, J. Mol. Spectrosc. 208, 188–193 (2001).
5. R. M. Lees and J. G. Baker, J. Chem. Phys. 48, 5299–5318 (1968).6. Y. Fukuyama, H. Odashima, K. Takagi, and S. Tsunekawa, Astrophys.
J. Suppl. 104, 329–346 (1996).7. C. H. Townes and A. L. Schawlow, “Microwave Spectroscopy.” Dover,
New York, 1975.8. J. Tang and K. Takagi, J. Mol. Spectrosc. 161, 487–498 (1993).9. H. Odashima, F. Matsushima, K. Nagai, S. Tsunekawa, and K. Takagi,
J. Mol. Spectrosc. 173, 404–422 (1995).10. Y.-B. Duan, L. Wang, and K. Takagi, J. Mol. Spectrosc. 193, 418–433
(1999).11. Y.-B. Duan, L. Wang, I. Mukhopadhyay, and K. Takagi, J. Chem. Phys.
110, 927–935 (1999).12. M. Kitano and K. Kuchitsu, Bull. Chem. Soc. Japan 46, 3048–3051
(1973).13. R. A. Kydd and A. R. C. Dunham, J. Mol. Struct. 69, 79–88 (1980).14. Y. Karakawa, K. Oka, H. Odashima, K. Takagi, and S. Tsunekawa, J. Mol.
Spectrosc. 210, 196–212 (2001).
Science (USA)


![FRX-3E Long-Haul Microwave Radio System Info...Long-Haul Microwave Radio System Features and Specifications Frequency Range [GHz] 4, 5, L6, U6, 7, 8, 11, 13 GHz Compliant with ITU-R](https://static.fdocuments.us/doc/165x107/6069d37ce7bdf846537be658/frx-3e-long-haul-microwave-radio-system-info-long-haul-microwave-radio-system.jpg)