The microseismic response at the In Salah Carbon Capture and ...
13
International Journal of Greenhouse Gas Control 32 (2015) 159–171 Contents lists available at ScienceDirect International Journal of Greenhouse Gas Control j ourna l h o mepage: www.elsevier.com/locate/ijggc The microseismic response at the In Salah Carbon Capture and Storage (CCS) site Anna L. Stork ∗ , James P. Verdon, J.-Michael Kendall School of Earth Sciences, University of Bristol, Wills Memorial Building, Queen’s Road, Bristol BS8 1RJ, UK a r t i c l e i n f o Article history: Received 27 June 2014 Received in revised form 22 October 2014 Accepted 17 November 2014 Available online 9 December 2014 Keywords: Microseismic monitoring Carbon Capture and Storage CCS a b s t r a c t In 2004, injection of carbon dioxide (CO 2 ) to be stored at depth began at the In Salah Carbon Capture and Storage (CCS) site and a pilot microseismic monitoring array was installed in 2009. The In Salah project presents an unusual dataset since it is the first major non-Enhanced Oil Recovery (EOR) CCS project to be monitored for microseismicity. This paper outlines an extensive seismological study using a range of techniques, relying mainly on data from a single three-component geophone. Important information is derived from the data, such as event locations, event magnitudes and fracture characteristics, that could be used in real-time to regulate the geomechanical response of a site to CO 2 injection. The event rate closely follows the CO 2 injection rate, with a total of 9506 seismic events detected. The locations for a carefully selected subset of events are estimated to occur at or below the injection interval, thereby ruling out fault or fracture activation caused by CO 2 migration at shallow depths. A very small number of events (11) with less well-constrained locations may have occurred above the injection interval. However, there is no microseismic evidence that these events are correlated with CO 2 injection and we suggest they are caused by stress transfer rather than CO 2 migration into the caprock. The observed maximum moment magnitude, M w = 1.7, is consistent with estimated fracture dimensions at the injection depth. Fracture orientation estimated using shear-wave splitting analysis is approximately NW-SE, in agreement with fracture orientations inferred from logging data. During periods of high injection rates the degree of anisotropy increases slightly and then falls back to original values when injection rates fall. This implies the CO 2 is opening pre-existing fractures which then close as pressure decreases. This an important proof-of-concept study that proves the value of microseismic monitoring of CCS projects, even with a limited array. We thus recommend that microseismic monitoring arrays are installed prior to CO 2 injection at future CCS sites to enhance our understanding by making baseline and compar- ative studies possible. This would also provide real-time monitoring of the geomechanical response to injection, allowing operators to modify injection parameters and to help ensure the safe operation of a project. © 2014 The Authors. Published by Elsevier Ltd. This is an open access article under the CC BY license (http://creativecommons.org/licenses/by/3.0/). 1. Introduction Carbon Capture and Storage (CCS) projects, where CO 2 is injected into the ground to be stored at depth, is one technology with the potential to reduce anthropogenic CO 2 emissions to mit- igate global warming. For the technology to be safe and effective, this CO 2 must remain trapped for thousands of years. However, few large-scale projects have so far come on-line and many ques- tions remain about the geological and geomechanical response to the injection of millions of tons of supercritical CO 2 at up to several kilometres depth. One particular concern for CO 2 storage security ∗ Corresponding author. Tel.: +44(0)1179545698. E-mail address: [email protected] (A.L. Stork). is the potential for such projects to induce earthquakes (Zoback and Gorelick, 2012; Verdon, 2014). Induced seismicity may result from the reactivation of pre-existing faults or fractures, or by gen- erating new fracture networks. The injection of CO 2 increases pore pressure around an injection site which reduces frictional resis- tance to fault slip and effective stress. Small stress perturbations in an already critically stressed crust could therefore activate nearby faults, resulting in pathways for CO 2 leakage. Similarly, there is an increased risk to safe storage if injection pressures exceed the value required to produce new fracture networks extending into the overburden. Understanding a site’s geomechanical response to CO 2 injection is key to the success of a project because without this knowledge the potential for CO 2 leakage is unidentified. Even though only a small number of CCS projects exist, it has been observed that the http://dx.doi.org/10.1016/j.ijggc.2014.11.014 1750-5836/© 2014 The Authors. Published by Elsevier Ltd. This is an open access article under the CC BY license (http://creativecommons.org/licenses/by/3.0/).
Transcript of The microseismic response at the In Salah Carbon Capture and ...

T(
AS
a
ARRAA
KMCC
1
iwitfttk
h1
International Journal of Greenhouse Gas Control 32 (2015) 159–171
Contents lists available at ScienceDirect
International Journal of Greenhouse Gas Control
j ourna l h o mepage: www.elsev ier .com/ locate / i jggc
he microseismic response at the In Salah Carbon Capture and StorageCCS) site
nna L. Stork ∗, James P. Verdon, J.-Michael Kendallchool of Earth Sciences, University of Bristol, Wills Memorial Building, Queen’s Road, Bristol BS8 1RJ, UK
r t i c l e i n f o
rticle history:eceived 27 June 2014eceived in revised form 22 October 2014ccepted 17 November 2014vailable online 9 December 2014
eywords:icroseismic monitoring
arbon Capture and StorageCS
a b s t r a c t
In 2004, injection of carbon dioxide (CO2) to be stored at depth began at the In Salah Carbon Capture andStorage (CCS) site and a pilot microseismic monitoring array was installed in 2009. The In Salah projectpresents an unusual dataset since it is the first major non-Enhanced Oil Recovery (EOR) CCS project tobe monitored for microseismicity. This paper outlines an extensive seismological study using a range oftechniques, relying mainly on data from a single three-component geophone. Important information isderived from the data, such as event locations, event magnitudes and fracture characteristics, that couldbe used in real-time to regulate the geomechanical response of a site to CO2 injection. The event rateclosely follows the CO2 injection rate, with a total of 9506 seismic events detected. The locations for acarefully selected subset of events are estimated to occur at or below the injection interval, thereby rulingout fault or fracture activation caused by CO2 migration at shallow depths. A very small number of events(11) with less well-constrained locations may have occurred above the injection interval. However, thereis no microseismic evidence that these events are correlated with CO2 injection and we suggest they arecaused by stress transfer rather than CO2 migration into the caprock. The observed maximum momentmagnitude, Mw = 1.7, is consistent with estimated fracture dimensions at the injection depth. Fractureorientation estimated using shear-wave splitting analysis is approximately NW-SE, in agreement withfracture orientations inferred from logging data. During periods of high injection rates the degree ofanisotropy increases slightly and then falls back to original values when injection rates fall. This impliesthe CO2 is opening pre-existing fractures which then close as pressure decreases.
This an important proof-of-concept study that proves the value of microseismic monitoring of CCS
projects, even with a limited array. We thus recommend that microseismic monitoring arrays are installedprior to CO2 injection at future CCS sites to enhance our understanding by making baseline and compar-ative studies possible. This would also provide real-time monitoring of the geomechanical response toinjection, allowing operators to modify injection parameters and to help ensure the safe operation of aproject.© 2014 The Authors. Published by Elsevier Ltd. This is an open access article under the CC BY license
. Introduction
Carbon Capture and Storage (CCS) projects, where CO2 isnjected into the ground to be stored at depth, is one technology
ith the potential to reduce anthropogenic CO2 emissions to mit-gate global warming. For the technology to be safe and effective,his CO2 must remain trapped for thousands of years. However,ew large-scale projects have so far come on-line and many ques-
ions remain about the geological and geomechanical response tohe injection of millions of tons of supercritical CO2 at up to severalilometres depth. One particular concern for CO2 storage security∗ Corresponding author. Tel.: +44(0)1179545698.E-mail address: [email protected] (A.L. Stork).
ttp://dx.doi.org/10.1016/j.ijggc.2014.11.014750-5836/© 2014 The Authors. Published by Elsevier Ltd. This is an open access article u
(http://creativecommons.org/licenses/by/3.0/).
is the potential for such projects to induce earthquakes (Zobackand Gorelick, 2012; Verdon, 2014). Induced seismicity may resultfrom the reactivation of pre-existing faults or fractures, or by gen-erating new fracture networks. The injection of CO2 increases porepressure around an injection site which reduces frictional resis-tance to fault slip and effective stress. Small stress perturbations inan already critically stressed crust could therefore activate nearbyfaults, resulting in pathways for CO2 leakage. Similarly, there isan increased risk to safe storage if injection pressures exceed thevalue required to produce new fracture networks extending intothe overburden.
Understanding a site’s geomechanical response to CO2 injectionis key to the success of a project because without this knowledgethe potential for CO2 leakage is unidentified. Even though only asmall number of CCS projects exist, it has been observed that the
nder the CC BY license (http://creativecommons.org/licenses/by/3.0/).

160 A.L. Stork et al. / International Journal of Greenhouse Gas Control 32 (2015) 159–171
Fig. 1. (a) Schematic illustration of the Krechba field showing the location of the injector (blue) and gas-producing (orange) wells. The star indicates the location of them giveni m deet der is
goCthsoettpediimrotcthtctg
2
fiiw5∼(Ct2alt
icroseismic monitoring well and the horizontal extent of the gas–water contact iss produced from and the CO2 is injected into a ∼20 m thick reservoir at 1850–1900riangles. (For interpretation of the references to color in this figure legend, the rea
eomechanical response to injection is very different dependingn the geological setting (Verdon et al., 2013). The Weyburn field,anada and the Sleipner field in Norway are two major CCS projectshat inject ≥1 million tonnes (Mt) of CO2 per year. At Weyburn CO2as been injected for enhanced oil recovery (EOR) since 2000, withome increase in pore pressure (15–20 MPa) and a small numberf induced seismic events, ∼100 between 2003 and 2010 (Verdont al., 2011). To date the Sleipner field in Norway is the site ofhe world’s largest non-EOR CCS project where around 14 milliononnes (Mt) of CO2 have been sequestered since 1996 and whereressures are reported to have remained close to pre-injection lev-ls (Chadwick et al., 2012). This makes significant geomechanicaleformation and seismic activity at the site unlikely. In contrast,
njection of <1 Mt of CO2 at the Decatur CCS demonstration projectn the Illinois basin resulted in the detection of 1000s of microseis-
ic events (Coueslan et al., 2013). In this study we focus on theesponse at the In Salah storage site to CO2 injection using a varietyf seismological techniques. We review the microseismic activity athe site to investigate the possibility that CO2 injection 2009–2011aused fracturing in the reservoir. In addition, we look at how real-ime microseismic data might be used to infer CO2 migration andelp regulate the geomechanical response of a reservoir to injec-ion. The techniques applied here are also important and relevant toontrolling site response in other industries that require fluid injec-ion (e.g., wastewater injection; hydraulic fracturing and enhancedeothermal stimulation).
. The In Salah CO2 storage site
The In Salah CO2 storage project at the gas-producing Krechbaeld in Algeria is a pioneering onshore CCS project that began
njection in 2004. Between 2004 and 2011, nearly 4 Mt of CO2as injected by three injection wells, KB-501, KB- 502 and KB-
03 (Fig. 1a; Ringrose et al., 2013). The CO2 was injected into the20m thick downdip water leg of the gas reservoir at ∼1.9 km depth
Fig. 1b; Mathieson et al., 2010). The reservoir is overlain by ∼950 marboniferous mudstones, siltstones, and limestones which, inurn, is overlain by Cretaceous sandstone deposits (Ringrose et al.,
009). This thickness of caprock makes it a good site for CO2 stor-ge. However, the porosity and permeability of the storage rocks areow relative to other large-scale projects, ∼10% and 10 mD respec-ively (Eiken et al., 2011). To measure the site performance in termsby the black line. (b) Schematic illustration of the geology of the Krechba field. Gasp. The positions of the geophones used in this study are also indicated by the greenreferred to the web version of this article.)
of injectivity and storage capacity a suite of geophysical and geo-chemical monitoring methods were put in place (Mathieson et al.,2011).
The response of the reservoir to CO2 injection has been observedusing two key geophysical technologies: InSAR (InterferometricSynthetic Aperture Radar) and 3D seismic surveys. Surface defor-mation of up to several cm was observed above the injection wellsthrough InSAR. Inversion of this data places deformation due to vol-ume and fracture aperture changes at reservoir depth around theinjection wells (Vasco et al., 2010; Rucci et al., 2013). The dimen-sions and depth are in agreement with results from a 2009 3Dseismic survey concluding that injection has activated a deep frac-ture zone extending NW of KB-502, several hundred metres wideand extending about 150 m above the reservoir (Rutqvist, 2012).The fracture zone is aligned parallel to the dominant NW-SE frac-ture orientation and perpendicular to the minimum compressiveprincipal stress (Iding and Ringrose, 2010; Rutqvist, 2012), sup-porting the idea that these observations are the result of fractureopening in the lower caprock rather than opening or reactivationof a large-fault.
3. Microseismic instrumentation and data
In 2009 a pilot microseismic monitoring array was installedin well KB-601, almost directly above the horizontal extensionof injector KB-502 (Fig. 1). Six three-component (3-C) 15 Hzgeophones between 80 m and 500 m deep were connected andrecorded continuous data at 500 Hz until June 2011 (Oye et al.,2013). Unfortunately, due to technical issues (e.g., non-functioningchannels, cabling problems and malfunctioning GPS units), it hasonly been possible to orientate and confidently process the datafrom one 3-C geophone, the uppermost instrument at 80 m deep.In addition the vertical component of the geophone at 160 m deepprovides reliable data.
We use the two reliable vertical components of data to detectevents using cross-correlation methods similar to those describedin Forghani-Arani et al. (2013). Initially the short-term average(STA) recorded amplitude to long-term average (LTA) amplitude
ratio is calculated using rolling time-windows. For the given veloc-ity model (Oye, pers. comm. and Fig. 2) and assuming events occurbelow the microseismic array, we estimate the expected travel-time difference between P-phases arriving from below at the two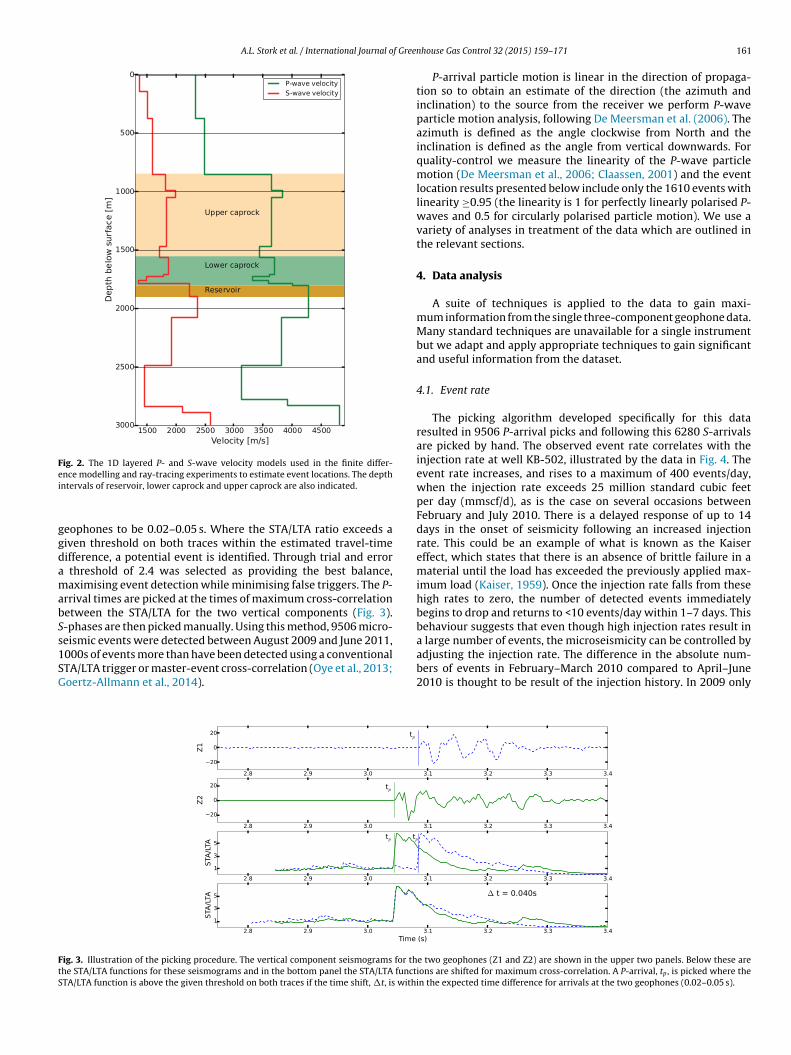
A.L. Stork et al. / International Journal of Green
Fig. 2. The 1D layered P- and S-wave velocity models used in the finite differ-ei
ggdamabSs1SG
a large number of events, the microseismicity can be controlled by
FtS
nce modelling and ray-tracing experiments to estimate event locations. The depthntervals of reservoir, lower caprock and upper caprock are also indicated.
eophones to be 0.02–0.05 s. Where the STA/LTA ratio exceeds aiven threshold on both traces within the estimated travel-timeifference, a potential event is identified. Through trial and error
threshold of 2.4 was selected as providing the best balance,aximising event detection while minimising false triggers. The P-
rrival times are picked at the times of maximum cross-correlationetween the STA/LTA for the two vertical components (Fig. 3).-phases are then picked manually. Using this method, 9506 micro-eismic events were detected between August 2009 and June 2011,
000s of events more than have been detected using a conventionalTA/LTA trigger or master-event cross-correlation (Oye et al., 2013;oertz-Allmann et al., 2014).ig. 3. Illustration of the picking procedure. The vertical component seismograms for thhe STA/LTA functions for these seismograms and in the bottom panel the STA/LTA functTA/LTA function is above the given threshold on both traces if the time shift, �t, is withi
house Gas Control 32 (2015) 159–171 161
P-arrival particle motion is linear in the direction of propaga-tion so to obtain an estimate of the direction (the azimuth andinclination) to the source from the receiver we perform P-waveparticle motion analysis, following De Meersman et al. (2006). Theazimuth is defined as the angle clockwise from North and theinclination is defined as the angle from vertical downwards. Forquality-control we measure the linearity of the P-wave particlemotion (De Meersman et al., 2006; Claassen, 2001) and the eventlocation results presented below include only the 1610 events withlinearity ≥0.95 (the linearity is 1 for perfectly linearly polarised P-waves and 0.5 for circularly polarised particle motion). We use avariety of analyses in treatment of the data which are outlined inthe relevant sections.
4. Data analysis
A suite of techniques is applied to the data to gain maxi-mum information from the single three-component geophone data.Many standard techniques are unavailable for a single instrumentbut we adapt and apply appropriate techniques to gain significantand useful information from the dataset.
4.1. Event rate
The picking algorithm developed specifically for this dataresulted in 9506 P-arrival picks and following this 6280 S-arrivalsare picked by hand. The observed event rate correlates with theinjection rate at well KB-502, illustrated by the data in Fig. 4. Theevent rate increases, and rises to a maximum of 400 events/day,when the injection rate exceeds 25 million standard cubic feetper day (mmscf/d), as is the case on several occasions betweenFebruary and July 2010. There is a delayed response of up to 14days in the onset of seismicity following an increased injectionrate. This could be an example of what is known as the Kaisereffect, which states that there is an absence of brittle failure in amaterial until the load has exceeded the previously applied max-imum load (Kaiser, 1959). Once the injection rate falls from thesehigh rates to zero, the number of detected events immediatelybegins to drop and returns to <10 events/day within 1–7 days. Thisbehaviour suggests that even though high injection rates result in
adjusting the injection rate. The difference in the absolute num-bers of events in February–March 2010 compared to April–June2010 is thought to be result of the injection history. In 2009 only
e two geophones (Z1 and Z2) are shown in the upper two panels. Below these areions are shifted for maximum cross-correlation. A P-arrival, tp , is picked where then the expected time difference for arrivals at the two geophones (0.02–0.05 s).

162 A.L. Stork et al. / International Journal of Greenhouse Gas Control 32 (2015) 159–171
(a)
(b)
Fig. 4. Histograms showing (a) the number of events detected early in the monitoring period (October 2009–May 2010) and (b) the number of events detected per day in2 e injed head pt
spstisp
010. There is no microseismic data available for November and December 2010. Thay, with the 25 mmscf/d level indicated by the dashed line. The green line is well-he reader is referred to the web version of this article.)
mall quantities of CO2 were injected at KB502 and the well-headressure was low (∼70 bar, Fig. 4a). Once injection restarts it takesome time for the pressure to build up in the surrounding forma-ion and following a sustained period of high well-head pressures
n April 2010 (Fig. 4a) the event rate dramatically increased, pre-umably as the pressure increased at distance from the injectionoint.ction rate at well KB-502 is shown by the red line in million standard cubic feet perressure/4 in bar. (For interpretation of the references to color in this figure legend,
4.2. Event clustering
If differences in arrival times of multiple seismic phases, forexample P- and S-waves, are available this enables the source-
station distance to be calculated, provided a velocity model isavailable for the region in question. Using P- and S-arrival times,the overwhelming majority of events recorded at the In Salah site
A.L. Stork et al. / International Journal of Greenhouse Gas Control 32 (2015) 159–171 163
(a) (b)
(c) (d)
Fig. 5. Example seismograms for events in (a) Cluster 1 (tsp∼0.95 s), (b) Cluster 2 tsp∼0.68 s), and events with t times (c) shorter and (d) longer than those observed forClusters 1 and 2. The two horizontal (X and Y) and the vertical (Z) components are given.
Fig. 6. tsp times measured for events throughout the monitoring period. The colourii
coiasr(ethot2icc
observed tsp times and directional information (the azimuth and
ndicates the azimuth of the P-arrival. (For interpretation of the references to colorn this figure legend, the reader is referred to the web version of this article.)
an be separated into two distinct clusters that occur through-ut the monitoring period and example seismograms are shownn Fig. 5a and b. These occur in groups with almost constant S − Prrival times, tsp, at ∼0.95 s and ∼0.68 s, illustrated in Fig. 6 andubsequently named Clusters 1 and 2, with 136 and 1226 eventsespectively. At times, usually during periods of high injection rates>25 mmscf/d), Cluster 2 spreads out to tsp = 0.68 ± 0.04s. If thesevents are repeating events, occurring at the same location and withhe same mechanism, then the waveforms within a cluster will beighly correlated. Cluster 1 shows such characteristics with >75%f the events in Cluster 1 having similar waveforms with correla-ion coefficients >0.9 (Fig. 7a and b). The variation within Cluster
is greater, as would be expected because there is more variation
n tsp times in this cluster, but it contains two sub-clusters withorrelation coefficients >0.9 that include most of the events in theluster (Fig. 7c). These clusters show no evolution with time andsp
events occur throughout the monitoring period. It seems a largeportion of the observed seismicity is repeating events, occurringat two locations and the similarity between waveforms within theclusters suggests they have very similar mechanisms.
The azimuth and inclination measured for these events (Fig. 8)shows Cluster 2 events occur almost directly below the array andalong a trend with an average azimuth of 109◦–289◦. These direc-tions are consistent with the events occurring on a NW-SE orientedfracture zone offset slightly to the West of the array. The eventsobserved here are more widely distributed than the four tight clus-ters of events reported by (Goertz-Allmann et al., 2014). We suggestthat this is a result of the differences between picking algorithmssince the arrivals identified in this study do not require any corre-lation with previously observed events.
4.3. Event locations
To gain a full understanding of the movement of injected CO2the location of any microseismicity is required. The extent ofmicroseismic activity is often taken to represent the extent ofhydraulic stimulation (e.g., Maxwell et al., 2002; Delépine et al.,2004) although microseismicity can often occur through stresstransfer rather than directly being caused by the presence of fluids(Orlecka-Sikora et al., 2009; Schoenball et al., 2012). The occur-rence of microseismicity in the cap rock is a particular concernfor CCS sites if this indicates the activation of faults and fracturesthat allows CO2 to migrate towards the surface. We therefore use
inclination of recorded P-waves) to estimate the location of someevents and identify any sequences of microseismicity that couldindicate the migration of CO2 into the caprock.

164 A.L. Stork et al. / International Journal of Greenhouse Gas Control 32 (2015) 159–171
Fig. 7. (a) Correlation matrix for vertical component seismograms for events in Cluster
and (c) correlation matrix for vertical component seismograms for events in Cluster 2 wi
Fig. 8. Estimated azimuth (angular coordinate) and inclination (radial coordinate)of P-arrivals coloured by tsp times. Results for arrivals with linearity ≥0.95 are shown.Trt
amo
he average azimuth is indicated by the line 109◦–289◦ . (For interpretation of theeferences to color in this figure legend, the reader is referred to the web version ofhis article.)
Since we have data from only one observation point, estimatingccurate hypocentres for the observed events is difficult. There areany uncertainties in our observations. For example, our estimates
f station-source azimuth and inclination contain measurement
1 with correlation coefficients >0.9; (b) vertical waveforms for 20 of these events;th correlation coefficients >0.9.
and systematic errors due to the presence of noise and ray-bendingin a layered velocity model.
To quantify the difference between observed inclinations, io, andthe geographical inclination from receiver to the hypocentre, ig, wecarry out finite difference modelling using E3D, a 3-D elastic seis-mic wave propagation code (Larsen and Grieger, 1998) and a 1-Dlayered velocity model (Oye, pers. comm.; Fig. 2). From the syntheticwaveforms we estimate the difference between observed and geo-graphical incidences, io − ig. We do this for a range of tsp times usinga grid of locations estimated using an eikonal solver (Fig. 9) and findthat, for 0.60 s<tsp<0.85 s, ig − io < 5◦ for io < 15◦.
Using the criteria io < 15◦ we estimate locations for 1214 eventsbased on our measured azimuths, inclinations and the event loca-tion grid illustrated in Fig. 9. The estimated depth and horizontaldistance of the events from the monitoring well give no indicationthat seismic activity becomes shallower with time or moves abovethe reservoir into the lower caprock (Fig. 10). The red colours inFig. 10 represent events that occurred during the first half of 2010when the injection rate and event rate were high and the spreadin the estimated depths is ∼600 m. Later in the sequence, in 2011(day > 500), the events are restricted to a range in depths of ∼250 m.
Although absolute depths are difficult to determine here due toerrors in the velocity model and the number of instruments, rela-tive depths show that high injection rates do appear to stimulate
A.L. Stork et al. / International Journal of Greenhouse Gas Control 32 (2015) 159–171 165
Fig. 9. Event depths and horizontal distances from the observation well for dif-ferent tsp times, estimated using E3D. The colours represent the inclination of theP-arrival measured from the synthetic waveforms. The caprock and reservoir layersare shaded as in Fig. 2 and the approximate injection interval is between the twothicker black lines at ∼1.9 km deep. (For interpretation of the references to color inthis figure legend, the reader is referred to the web version of this article.)
Fig. 10. Estimated depth and horizontal distance of events from observation well.Locations are projected onto a SE-NW plane. The colours indicate the time of theevent in number of days since the earliest plotted event. Locations are estimatedfor events with io < 15◦ , linearity ≥0.95 and signal-to-noise ratio >3.0. The caprockand reservoir layers are shaded as in Fig. 2 and the approximate injection interval isblt
asiindi
0 0.5 1 1.5 2 2.5 30
0.1
0.2
0.3
0.4
0.5
0.6
0.7
0.8
0.9
1
Horizontal Distance (km)
tsp
time
(s)
0 0.5 1 1.5 2 2.5 3−2.5
−2
−1.5
−1
−0.5
0
Horizontal Distance (km)
Dep
th (
km)
Fig. 11. Raytracing results for P- (red) and S-waves (green) (lower panel) and tsp
times as a function of distance (upper panel), estimated using the provided isotropic1-D velocity model and a source at 2.4 km deep (star). (For interpretation of the
etween the two thicker black lines at ∼1.9 km deep. The green triangle indicates theocation of the geophone used in the analysis. (For interpretation of the referenceso color in this figure legend, the reader is referred to the web version of this article.)
larger area to become seismically active. We do not observe anyystematic shortening of tsp times over time this suggests that theres no systematic migration of seismicity through the cap rock. This
s reassuring for the containment of CO2. We do observe a smallumber of events (11) with shorter tsp times (<0.5 s) (Fig. 6). Theseo not satisfy our criteria to estimate locations but their significances discussed below.
references to color in this figure legend, the reader is referred to the web version ofthis article.)
To provide additional evidence for the approximate locationsobtained through finite-difference modelling we conduct a ray-tracing exercise. The results from ray-tracing through the isotropic1-D velocity model using the method of Kendall and Thomson(1989) show that events with hypocentres at 2.4 km depth and1.2 km horizontal distance from the array (Fig. 11).
To estimate errors in our reported locations we tested the effectof the velocity model on the travel-times and, for example, welocate Cluster 2 up to 450 m shallower if the velocity model is 10%slower overall, if the near surface layer is 20% slower or if the modelis anisotropic (see Stork et al., 2015 for a detailed description). Thiswould place the events in this cluster between 1.65 km – 2.25 kmdeep and therefore extending up to 150 m unto the lower caprock.As an estimate of the error in horizontal distances from the arraywe take the maximum horizontal distance between grid points inFig. 9, this is 174 m when tsp = 0.60s near 0◦ incidence. Event loca-tions obtained using the two methods, finite difference modellingand ray-tracing, agree within the estimated errors.
Overall, the results for the estimated location of Cluster 2 showthat the seismicity occurred at depths over a range of ∼600 m at orbelow the injection interval and at azimuths from the monitoringwell consistent with the activation of a pre-existing wide fracturezone at the injection depth and extending into the lower caprock(as reported by Iding and Ringrose (2010) and Rutqvist (2012)) withevents occurring on similarly oriented fractures within the zone. Aninaccurate velocity model significantly affects seismic event loca-tions and if the velocity model is 10% slower this would imply thatthe events extend into the lowermost 150 m of the caprock, consis-tent with the previous fracture zone interpretation. An anisotropicfractured medium may also affect interpretation of the data.
We note that a few events occur outside the two main clustersand example seismograms are shown in Fig. 5. We find 11 eventswith 0.31 s <tsp< 0.5 s (Fig. 6 and example seismograms in Fig. 5c).According to our model locations in Fig. 9 these events are between
1.1 km and 1.8 km deep but, as with all locations reported here,there are significant uncertainties in these locations. The eventsoccur over the whole monitoring period and there is no correlation
166 A.L. Stork et al. / International Journal of Gree
Fit
wsis
s1osek
4
mma
M
ittsP�<iSfrWaa−abuwuu
ig. 12. Estimated Mw for P- and S-arrivals. Events are coloured by azimuth. (Fornterpretation of the references to color in this figure legend, the reader is referredo the web version of this article.)
ith injection and no evidence that observed tsp are becominghorter with time. We therefore suggest that these events do notndicate the presence of CO2 at shallower depths but that they areimply isolated individual events caused by stress transfer.
In addition we identify 12 events with 1.5 s<tsp<2.2 s (exampleeismograms in Fig. 5b). The estimated station-source azimuths for1 of these are consistent with the events originating in the vicinityf injection well KB-501. This implies that we detect a few micro-eismic events associated with injection at KB-501. A more spatiallyxtensive microseismic network would have been necessary tonow this for certain.
.4. Event magnitudes
With one 3-C geophone we are only able to obtain approximateoment magnitude, Mw , values. However, we estimate seismicoment, M0, for events satisfying the conditions linearity >0.95
nd ig − io < 5◦ with a signal-to-noise ratio >3.0 using
0 = 4��v3r�0
R, (1)
where R is the P- or S-wave radiation pattern correction term, �s the rock density, v is the P- or S-wave velocity at the source, r ishe source-receiver distance and �0 is the low frequency level ofhe amplitude spectrum. We have no estimate of focal mechanismolutions so we use average radiation pattern corrections (0.44 for-waves and 0.60 for S-waves: Boore and Boatwright, 1984) and0 is taken directly from the amplitude spectrum at frequencies
50 Hz. The spectra are corrected for geometrical spreading andntrinsic attenuation for P- and S-waves, Qp and Qs, respectively.ince we are unable to make a reliable estimate of Q directly we per-orm 1000 iterations of the calculation using Q-values taken from aandom uniform distribution with Qp = 100–400 and Qs = 100–400.
e also allow for some uncertainties in the velocity model using variation in velocity with a standard deviation of 5%. The aver-ge of the P and S-wave magnitudes for the events ranges between0.8 and 1.7 but the differences between estimates using P- and S-rrivals can be up to ∼1.0 units (Fig. 12). This variation is thought toe mainly attributable to the average radiation pattern correction
sed because the difference between the P- and S-estimates variesith azimuth (Fig. 12) and Stork et al. (2014) have shown that these of average radiation pattern correction terms can cause suchncertainties.nhouse Gas Control 32 (2015) 159–171
An important question in any CCS project is, what is the max-imum magnitude earthquake that may be triggered? Assuming acircular source model with radius d, the stress drop, derived fromEshelby (1957), is
��s = 7M0
16d3. (2)
Assuming events with ��s between 0.1 MPa and 10 MPa (e.g.,Abercrombie, 1995) and a maximum fracture radius of 100 m (Idingand Ringrose, 2010), we estimate the maximum expected momentmagnitude from the pre-existing fractures to be between 1.6 and2.9. This is similar to our reported maximum magnitude of 1.7 andwe therefore suggest that seismic activity with magnitudes up to ∼2could have been reasonably expected before CO2 injection began.
The Gutenberg–Richter relationship, log 10N = a − bM where Nis the number of earthquakes greater than magnitude M, is thecommonly assumed frequency of occurrence distribution of earth-quake magnitudes and is often used to characterise earthquakegeneration. The b-value, the slope of the frequency-magnitude dis-tribution, is globally found to be ∼1.0 but larger b-values have beenestimated up to ∼2.0 in volcanic regions and where fluid injec-tion increases pore pressure and causes fracturing (McNutt, 2005;Bachmann et al., 2012; Eaton et al., 2014). We thus estimate b-values for the In Salah data to test whether there is any variation inevent generation with injection rates, over time or with event loca-tion. We use the maximum likelihood method (Aki, 1965) to findb and apply a Kolmogorov–Smirnoff test to find the completenessmagnitude. To estimate the standard error in b we use the formu-lae given by Shi and Bolt (1982). Overall, we find b = 2.17 ± 0.09 foraverage P- and S-wave magnitudes with a magnitude of complete-ness of 0.1. This is a very high b-value but similar to the valuesreported by other studies of fluid injection sites, for example dur-ing hydraulic fracturing (Maxwell et al., 2009) and at EnhancedGeothermal System (EGS) injections (Bachmann et al., 2012). How-ever, looking at the data in more detail reveals that the b-value isdependent on the station-source azimuth, rather than the injectionrate. Events to the WNW of the array have b-values much closerto 1.0 (1.47 ± 0.13; Fig. 13a) and events to the ESE occur with avery high b-value (2.46 ± 0.18; Fig. 13b). As a consequence of usingaverage radiation pattern corrections to estimate Mw the b-valueis unreliable and depends on azimuth. However, the b-values esti-mated here are all high (>1.4), and since Cluster 2 occurs withina short (�1.0 km) horizontal distances from the injection site, it islikely that pore pressures are elevated in this area by the presenceof CO2, thus resulting in a proportionally large number of smallmagnitudes events.
Our reported b-values for events to the WNW of the array aresimilar to the values reported by Goertz-Allmann et al. (2014) (theirclusters named B and D). For events to the ESE we find a larger b-value (2.5 compared to 1.7–1.9 reported by Goertz-Allmann et al.,2014 for their Cluster C). As stated above, Mw estimates may haveerrors up to 1.0 units if only one instrument is available to makethe estimate due to uncertainties in radiation pattern corrections;the time windows selected around the arrival; and uncertainties inevent location, velocities and attenuation (e.g., Stork et al., 2014).In particular we believe the estimated magnitudes of the events tothe ESE of the array are unreliable because there is poor agreementbetween the values obtained from P- and S-arrivals. The differencesin magnitudes and b-values between this study and that by Goertz-Allmann et al. (2014) reflect the uncertainties in the magnitudeestimates.
4.5. Fracture strike and density using shear-wave splitting
Anisotropic seismic wave velocities arise in rock withaligned fracture sets with sizes and spacing smaller than the

A.L. Stork et al. / International Journal of Greenhouse Gas Control 32 (2015) 159–171 167
−0.5 0 0.5 1 1.50
0.5
1
1.5
2
2.5
3
log(
N)
Magnitude
b = 1.47
(a)
−0.5 0 0.5 1 1.50
0.5
1
1.5
2
2.5
3
log(
N)
Magnitude
b = 2.46
(b)
e azim
datit2ripmeaotttvdt(
odorrotcFttnf(stTtdroiirnt
Fig. 13. b-Values estimated for events (a) with station-sourc
ominant wavelength (e.g., Hudson, 1980). Characterisation of thisnisotropy can therefore be used to infer fracture properties and tohis end shear-wave splitting analysis has been successfully appliedn hydrocarbon recovery and mining settings to determine frac-ure strike, density and compliance ratios (e.g., Wuestefeld et al.,011; Verdon and Wüstefeld, 2013; Baird et al., 2013). Tempo-al variations in these characteristics provide important usefulnformation to operators regarding fluid flow behaviour and theotential for cavity collapse events. We therefore apply the auto-ated approach to shear-wave splitting analysis of Wuestefeld
t al. (2010) to confirm previously reported fracture orientationsnd to look for any evidence of changes in the orientation or densityf the fractures with CO2 injection. This method computes split-ing parameters, the strike of the fast polarisation direction, �, andhe time delay between the fast and slow S-waves, ıt, using bothhe cross-correlation (e.g., Bowman and Ando, 1987) and eigen-alue (e.g., Silver and Chan, 1991) methods. A measurement iseemed “good” using a quality index relying on the similarity ofhe results of the two methods, as described in Wuestefeld et al.2010).
For all events with S-wave picks we estimate �, as a measuref the dominant fracture direction, and ıt, as a measure of theegree of anisotropy. For quality control we require a quality indexf >0.8 and an estimated error in � < 5◦ and we then inspect theesults by hand. This leads to 349 “good” results and an exampleesult is shown in Fig. 14. Fig. 14b and c highlights the advantagef using two methods to compute shear-wave splitting parame-ers since the cross-correlation results (Fig. 14c) show evidence ofycle skipping which could lead to the wrong ıt being reported.ig. 15 shows the � and ıt estimated for the 349 good results andhe noticeable feature of Fig. 15a is the consistency of strike ofhe fast direction NW-SE. This provides an estimate of the domi-ant fracture strike, 140◦–160◦, that is consistent with the results
rom logging data (Iding and Ringrose, 2010) and fracture modellingBond et al., 2013). Although the lower limit of delay time mea-urements remains constant at ∼0.030 s between 2009 and 2011,he upper limit during periods of high injection increases to 0.10 s.he events with larger delay times originate mainly from east ofhe monitoring well (red colours in Fig. 15b) Once injection ratesecrease, towards the end of 2010, the upper limit for delay timeseturns to 0.05 s. This may indicate that high injection rates arepening pre-existing fractures around the injection well, resultingn an apparent increase in fracture density, that then close follow-
ng the migration of CO2 through the fractures. These results do notule out the possibility that injection prior to August 2009 createdew fractures or that fractures were created after August 2009 thathese raypaths do not sample.uths 270◦–310◦ , (b) with station-source azimuths 90◦–130◦ .
5. Discussion
5.1. Importance of experimental set-up
The microseismic data from the In Salah CCS site should be influ-ential in the planning of future CCS projects in terms of how a site ismonitored. The project was the first non-EOR >1 Mt storage projectto be monitored by a microseismic array and the results presentedabove prove the usefulness of the data in understanding the geome-chanical response of the site to CO2 injection. The main advantage ofmicroseismic monitoring over other geophysical techniques, suchas 4D seismic reflection and InSAR, is that the data can be processedin real-time and therefore analysis can provide an early warningsystem for CO2 leakage or fault reactivation.
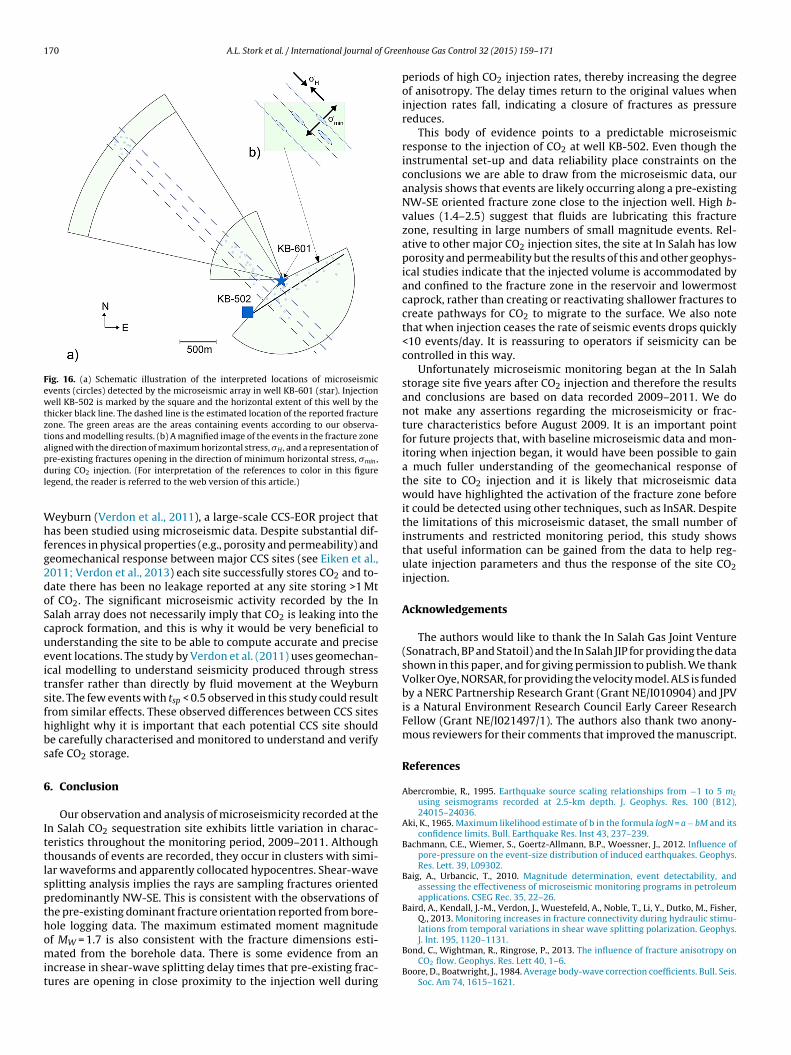
Unfortunately, due to the set-up of the pilot microseismic arrayat In Salah, the information to be gained from this dataset is limited.The main influence on the certainty of the results presented above isthe fact that only one 3-C geophone could be used in the analysis.Accurate seismic event locations require multi-sensor arrays (>5instruments) covering a wide aperture, allowing a detailed analysisof which structures are being activated. However, we have shownthat even a shallow microseismic array could be useful to monitorthe geomechanical response of CCS sites. With one instrument andusing particle motion analysis we are able to constrain approximatelocations for some events and make observations of fracture prop-erties. We suggest that the repeating events in the clusters occuralong the NW-SE oriented pre-existing fracture zone with eventsoccurring on neighbouring fractures with very similar orientations,hence the similarity in waveforms and tsp times within the clus-ters. A schematic form of our interpretation in Fig. 16 illustratesour inferred event epicentres and how fractures in the pre-existingfracture zone are expected to open preferentially because theyare aligned with the present day direction of maximum horizon-tal stress. However, we are unable to report accurate locations forthe events and our modelling and ray-tracing results suggest thatour locations estimated from the grid search could be in error byup to ∼200 m horizontally due to the discretisation of the grid andup to ∼500 m horizontally if the measured inclination is out by 5◦
(Fig. 9). Additionally, the depths could be in error by ∼400 m if thereare errors up to 10% in the velocity model.
Recently, some methods for single-station experiments havebeen developed although these require specific set-ups, such assignificant coda waves recorded for highly correlated waveforms
from clusters of earthquakes (Robinson et al., 2013). When a CCSproject is undertaken a microseismic array should be deployed thatcan be used to track the CO2 footprint using any seismic activityand also that is able to detect unexpected seismic activity at some
168 A.L. Stork et al. / International Journal of Greenhouse Gas Control 32 (2015) 159–171
(a)
N
E
(b)
−90
−60
−30
0
30
60
90
Fas
t Dire
ctio
n (°
)
0.00 0.05 0.10δt[s]
0.044
−30
(c)
−90
−60
−30
0
30
60
90
Fas
t Dire
ctio
n (°
)
0.00 0.05 0.10δt [s]
Q = 0.95
(d)
Fig. 14. (a) Example 3C waveforms for an event with a split S-wave. The two horizontal (H1 and H2) and the vertical (Z) components are shown. (b) The particle motion inSH-SV coordinates before (dashed red line) and after (blue line) correction. Note the motion is linearly polarised after correction. (c) Map of error surfaces for the eigenvectorm r surfam resull
dte
otSke5mstmf
dtdlswtim
ethod. The best-fitting delay time and fast direction are shown. (d) Map of erroethods is shown. The blue cross and red circle in (c) and (d) indicate the best fitting
egend, the reader is referred to the web version of this article.)
istance from the injection point. For an overview of recommenda-ions for microseismic array deployments at CCS sites see Verdont al. (2012).
Good coverage of the focal sphere also allows the computationf focal mechanism solution and hence an understanding of theype of deformation taking place. With the available data from Inalah we are unable to do this with any confidence. Since we do notnow the focal mechanism solutions our estimates of Mw may be inrror up to 1.0 unit (Stork et al., 2014). The recording frequency of00 Hz also affects our magnitude estimates since we cannot deter-ine Q from the source spectra because the corner frequencies for
uch small earthquakes could be around the Nyquist frequency forhis data. If Q is to be estimated from source spectra it is recom-
ended that the recording frequency is at least 4 times the Nyquistrequency (McGarr, 1984; Baig and Urbancic, 2010).
Finally, the pilot microseismic monitoring array at In Salah waseployed 5 years after injection began. It is therefore impossibleo assess the true impact of CO2 injection even with a perfectlyesigned array because the data cannot be compared to a base-
ine taken before injection began. Even so, the microseismic, 3Deismic and InSAR monitoring clearly revealed how CO2 injection
as affecting the site, acting as an early warning system to ensurehe response could be controlled. This should provide confidencen moving forward with other CCS sites, as long as appropriate
onitoring is in place. We therefore recommend that a suitable
ces for the cross-correlation method. The combined quality value, Q, for the twots from the two methods. (For interpretation of the references to color in this figure
microseismic array is installed at future CCS sites prior to the startof injection activities.
5.2. Combining microseismic and geomechanical studies
It is important that any microseismic observations are combinedwith geomechanical studies to verify the site response predictedby geomechanical models. Verdon et al. (in preparation) combinea history matched reservoir model that simulates pore pressurechanges caused by gas extraction and CO2 injection with a frac-ture model to determine when and where Mohr–Coulomb failurecriteria were exceeded. This is verified against the results from thisstudy to understand the changes in the rate and location of seismic-ity at the In Salah site through time. Such combined studies willimprove with developments in computing power and increasedcomplexity of models, with improved instrumentation and appro-priate deployments of microseismic arrays. These types of studiesare essential for future projects to fully understand how sites reactto CO2 injection.
Recently, White et al. (2014) consider the evidence for dif-ferent explanations for the observed geomechanical response at
In Salah. They conclude that the most likely explanation forthe observed surface deformation, seismic and pressure data isthat the lowermost caprock was hydrofractured by CO2 injectionand that preexisting fractures could play a significant role. Our
A.L. Stork et al. / International Journal of Greenhouse Gas Control 32 (2015) 159–171 169
F time,a tion rao sion o
sib
ATbOsbeeidstt
ig. 15. (a) Histogram of the strike of the fast shear-wave. (b) Upper panel: Delayutomated shear-wave splitting analysis. Lower panel: The red line is the CO2 injecf the references to color in this figure legend, the reader is referred to the web ver
hear-wave splitting observations, made towards the end of thenjection period, support the idea that preexisting fractures areeing reactivated at this time.
Comparing and contrasting this study with that of Goertz-llmann et al. (2014) shows many similarities but key differences.he method used to pick arrival times significantly affects the num-er of microseismic events identified (compare this study withye et al. (2013) and Goertz-Allmann et al. (2014)). In the present
tudy we find more but less tightly clustered events. This may beecause our picking method does not rely on a correlation betweenvents, only between receivers. We observe similar variations invent rate, magnitudes and b-values to the aforementioned stud-es. Small discrepancies between the studies may be put down to
ifferences in processing techniques. However, in contrast to thetudy of Goertz-Allmann et al. (2014) we observe variations inhe delay time between fast and slow shear-waves dependent onhe injection rate. This leads us to conclude that the injection isıt, between the fast and slow shear-waves as a function of time, measured usingte and the black line is the 5 point moving average of ıt values. (For interpretation
f this article.)
opening preexisting fractures around the injection well that thenclose as pressure reduces. This is an important difference in theconclusions of the two studies. Overall, we find smaller delay timesthan those reported by Goertz-Allmann et al. (2014) but we findsimilar results for events in our Cluster 1 (their Cluster A). The dif-ferences between the inferred dominant fracture strike are moredifficult to explain. Our reported orientation (NW-SE) is in agree-ment with fracture orientations derived from logging data (Idingand Ringrose, 2010) and the regional maximum horizontal stress.The difference between the studies may be because we reportresults for different events, both studies report results from <5%of the total events detected.
5.3. Comparison with other CCS sites
The large number of events detected at the In Salah site isin contrast to the very few events (∼100) that were detected at
170 A.L. Stork et al. / International Journal of Gree
Fig. 16. (a) Schematic illustration of the interpreted locations of microseismicevents (circles) detected by the microseismic array in well KB-601 (star). Injectionwell KB-502 is marked by the square and the horizontal extent of this well by thethicker black line. The dashed line is the estimated location of the reported fracturezone. The green areas are the areas containing events according to our observa-tions and modelling results. (b) A magnified image of the events in the fracture zonealigned with the direction of maximum horizontal stress, �H , and a representation ofpdl
Whfg2doScueitsfhbs
6
Ittlspthomit
re-existing fractures opening in the direction of minimum horizontal stress, �min ,uring CO2 injection. (For interpretation of the references to color in this figure
egend, the reader is referred to the web version of this article.)
eyburn (Verdon et al., 2011), a large-scale CCS-EOR project thatas been studied using microseismic data. Despite substantial dif-
erences in physical properties (e.g., porosity and permeability) andeomechanical response between major CCS sites (see Eiken et al.,011; Verdon et al., 2013) each site successfully stores CO2 and to-ate there has been no leakage reported at any site storing >1 Mtf CO2. The significant microseismic activity recorded by the Inalah array does not necessarily imply that CO2 is leaking into theaprock formation, and this is why it would be very beneficial tonderstanding the site to be able to compute accurate and precisevent locations. The study by Verdon et al. (2011) uses geomechan-cal modelling to understand seismicity produced through stressransfer rather than directly by fluid movement at the Weyburnite. The few events with tsp < 0.5 observed in this study could resultrom similar effects. These observed differences between CCS sitesighlight why it is important that each potential CCS site shoulde carefully characterised and monitored to understand and verifyafe CO2 storage.
. Conclusion
Our observation and analysis of microseismicity recorded at then Salah CO2 sequestration site exhibits little variation in charac-eristics throughout the monitoring period, 2009–2011. Althoughhousands of events are recorded, they occur in clusters with simi-ar waveforms and apparently collocated hypocentres. Shear-waveplitting analysis implies the rays are sampling fractures orientedredominantly NW-SE. This is consistent with the observations ofhe pre-existing dominant fracture orientation reported from bore-ole logging data. The maximum estimated moment magnitude
f MW = 1.7 is also consistent with the fracture dimensions esti-ated from the borehole data. There is some evidence from anncrease in shear-wave splitting delay times that pre-existing frac-ures are opening in close proximity to the injection well during
nhouse Gas Control 32 (2015) 159–171
periods of high CO2 injection rates, thereby increasing the degreeof anisotropy. The delay times return to the original values wheninjection rates fall, indicating a closure of fractures as pressurereduces.
This body of evidence points to a predictable microseismicresponse to the injection of CO2 at well KB-502. Even though theinstrumental set-up and data reliability place constraints on theconclusions we are able to draw from the microseismic data, ouranalysis shows that events are likely occurring along a pre-existingNW-SE oriented fracture zone close to the injection well. High b-values (1.4–2.5) suggest that fluids are lubricating this fracturezone, resulting in large numbers of small magnitude events. Rel-ative to other major CO2 injection sites, the site at In Salah has lowporosity and permeability but the results of this and other geophys-ical studies indicate that the injected volume is accommodated byand confined to the fracture zone in the reservoir and lowermostcaprock, rather than creating or reactivating shallower fractures tocreate pathways for CO2 to migrate to the surface. We also notethat when injection ceases the rate of seismic events drops quickly<10 events/day. It is reassuring to operators if seismicity can becontrolled in this way.
Unfortunately microseismic monitoring began at the In Salahstorage site five years after CO2 injection and therefore the resultsand conclusions are based on data recorded 2009–2011. We donot make any assertions regarding the microseismicity or frac-ture characteristics before August 2009. It is an important pointfor future projects that, with baseline microseismic data and mon-itoring when injection began, it would have been possible to gaina much fuller understanding of the geomechanical response ofthe site to CO2 injection and it is likely that microseismic datawould have highlighted the activation of the fracture zone beforeit could be detected using other techniques, such as InSAR. Despitethe limitations of this microseismic dataset, the small number ofinstruments and restricted monitoring period, this study showsthat useful information can be gained from the data to help reg-ulate injection parameters and thus the response of the site CO2injection.
Acknowledgements
The authors would like to thank the In Salah Gas Joint Venture(Sonatrach, BP and Statoil) and the In Salah JIP for providing the datashown in this paper, and for giving permission to publish. We thankVolker Oye, NORSAR, for providing the velocity model. ALS is fundedby a NERC Partnership Research Grant (Grant NE/I010904) and JPVis a Natural Environment Research Council Early Career ResearchFellow (Grant NE/I021497/1). The authors also thank two anony-mous reviewers for their comments that improved the manuscript.
References
Abercrombie, R., 1995. Earthquake source scaling relationships from −1 to 5 mL
using seismograms recorded at 2.5-km depth. J. Geophys. Res. 100 (B12),24015–24036.
Aki, K., 1965. Maximum likelihood estimate of b in the formula logN = a − bM and itsconfidence limits. Bull. Earthquake Res. Inst 43, 237–239.
Bachmann, C.E., Wiemer, S., Goertz-Allmann, B.P., Woessner, J., 2012. Influence ofpore-pressure on the event-size distribution of induced earthquakes. Geophys.Res. Lett. 39, L09302.
Baig, A., Urbancic, T., 2010. Magnitude determination, event detectability, andassessing the effectiveness of microseismic monitoring programs in petroleumapplications. CSEG Rec. 35, 22–26.
Baird, A., Kendall, J.-M., Verdon, J., Wuestefeld, A., Noble, T., Li, Y., Dutko, M., Fisher,Q., 2013. Monitoring increases in fracture connectivity during hydraulic stimu-lations from temporal variations in shear wave splitting polarization. Geophys.
J. Int. 195, 1120–1131.Bond, C., Wightman, R., Ringrose, P., 2013. The influence of fracture anisotropy onCO2 flow. Geophys. Res. Lett 40, 1–6.
Boore, D., Boatwright, J., 1984. Average body-wave correction coefficients. Bull. Seis.Soc. Am 74, 1615–1621.

f Green
B
C
C
C
D
D
E
E
E
F
G
H
I
K
K
L
M
M
M
M
M
MO
A.L. Stork et al. / International Journal o
owman, J., Ando, M., 1987. Shear-wave splitting in the upper-mantle wedge abovethe Tonga subduction zone. Geophys. J. Roy. Astr. Soc 88, 25–41.
hadwick, R.A., Williams, G.A., Williams, J.D.O., Noy, D.J., 2012. Measuring pres-sure performance of a large saline aquifer during industrial-scale CO2 injection:the Utsira Sand, Norwegian North Sea. Int. J. Greehouse Gas Control 10,374–388.
laassen, J., 2001. Robust bearing estimation for three-component stations. PureAppl. Geophys 158, 349–374.
oueslan, M., Smith, V., Jaques, P., Will, R., Maxwell, S., Raymer, D., Senel, O., Finley,R., 2013. Evolution of induced microseismicity at the Illinois Basin – Decaturproject. In: AGU Fall Meeting (S23E-02).
e Meersman, K., van der Baan, M., Kendall, J.-M., 2006. Signal extraction and auto-mated polarization analysis of multicomponent array data. Bull. Seis. Soc. Am.96, 2415–2430.
elépine, N., Cuenot, N., Rothert, E., Parotidis, M., Rentsch, S., Shapiro, S., 2004.Characterization of fluid transport properties of the Hot Dry Rock reservoirSoultz-2000 using induced microseismicity. J. Geophys. and Eng. 1, 77–83.
aton, D.W., Davidsen, J., Pedersen, P.K., Boroumand, N., 2014. Breakdown of theGutenberg–Richter relation for microearthquakes induced by hydraulic fractur-ing: influence of stratabound fractures. Geophys. Prospect. 62, 806–818.
iken, O., Ringrose, P., Hermanrud, C., Nazarian, B., Torp, T.A., Høier, L., 2011. Lessonslearned from 14 years of CCS operations: Sleipner, In Salah and Snøhvit. EnergyProc. 4, 5541–5548.
shelby, J., 1957. The determination of the elastic field of an ellipsoidal inclusion,and related problems. Proc. R. Soc. London 241, 376–396.
orghani-Arani, F., Behura, J., Haines, S.S., Batzle, M., 2013. An automated cross-correlation based event detection technique and its application to a surfacepassive data set. Geophys. Prospect. 61, 778–787.
oertz-Allmann, B.P., Kühn, D., Oye, V., Bohloli, B., Aker, E., 2014. Combining micro-seismic and geomechanical observations to interpret storage integrity at the InSalah CCS site. Geophys. J. Int. 198, 447–461.
udson, J., 1980. Overall properties of a cracked solid. In: Mathematical Proceedingsof the Cambridge Philosophical Society, vol. 88, pp. 371–384.
ding, M., Ringrose, P., 2010. Evaluating the impact of fractures on the performanceof the In Salah CO2 storage site. Int. J. Greenhouse Gas Control 4, 242–248.
aiser, E., 1959. A study of acoustic phenomena in tensile test. TH München, Munich,Germany, Ph. D. thesis.
endall, J.-M., Thomson, C.J., 1989. A comment on the form of the geometricalspreading equations, with some numerical examples of seismic ray tracing ininhomogeneous, anisotropic media. Geophys. J. Int. 99, 401–413.
arsen, S., Grieger, J., 1998. Elastic modeling initiative, Part III: 3-D computationalmodeling. SEG Expand. Abstr. 68, 1803–1806.
athieson, A., Midgley, J., Dodds, K., Wright, I., Ringrose, P., Saoula, N., 2010. CO2
sequestration monitoring and verification technologies applied at Krechba,Algeria. Lead. Edge 29, 216–222.
athieson, A., Midgley, J., Wright, I., Saoula, N., Ringrose, P., 2011. In Salah CO2
Storage JIP: sequestration monitoring and verification technologies applied atKrechba, Algeria. Energy Proc. 4, 3596–3603.
axwell, S., Jones, M., Parker, R., Miong, S., Leaney, S., Dorval, D., D’Amico, D., Logel,J., Anderson, E., Hammermaster, K., 2009. Fault activation during hydraulic frac-turing. SEG Expand. Abstr., 1552–1556.
axwell, S., Urbancic, T., Demerling, T., Prince, M., 2002. Real time 4D seismic imag-ing of hydraulic fractures. In: SPE/ISRM78191.
cGarr, A., 1984. Scaling of ground motion parameters, state of stress, and focal
depth. J. Geophys. Res. 89 (B8), 6969–6979.cNutt, S., 2005. Volcanic seismology. Annu. Rev. Earth Planet. Sci. 33, 461–491.rlecka-Sikora, B., Papadimitriou, E., G, K., 2009. A study of the interaction among
mining-induced seismic events in the Legnica-Glogów Copper District, Poland.Acta Geophys. 57, 413–434.
house Gas Control 32 (2015) 159–171 171
Oye, V., Aker, E., Daley, T.M., Kühn, D., Bahman, B., Korneev, V., 2013. Microseismicmonitoring and interpretation of injection data from the In Salah CO2 storagesite (Krechba), Algeria. Energy Proc. 37, 4191–4198.
Ringrose, P., Atbi, M., Mason, D., Espinassous, M., Myhrer, Ø., Iding, M., Mathieson,A., Wright, I., 2009. Plume development around well KB-502 at the In Salah CO2
storage site. First Break 27, 85–89.Ringrose, P.S., Mathieson, A.S., Wright, I.W., Selamac, F., Hansen, O., Bissell, R., Saoula,
N., Midgley, J., 2013. The In Salah CO2 storage project: lessons learned andknowledge transfer. Energy Proc. 37, 6226–6236.
Robinson, D.J., Sambridge, M., Snieder, R., J., H., 2013. Reloctaing a cluster of earth-quakes using a single seismic station. Bull. Seis. Soc. Am. 103, 3057–3072.
Rucci, A., Vasco, D.W., Ferretti, A., 2013. Monitoring the geologic storage of car-bon dioxide using multicomponent SAR interferometry. Geophys. J. Int. 193,197–208.
Rutqvist, J., 2012. The geomechanics of CO2 storage in deep sedimentary formations.Geotech. Geol. Eng. 30, 525–551.
Schoenball, M., Baujard, C., Kohl, T., Dorbath, L., 2012. The role of triggering by staticstress transfer during geothermal reservoir stimulation. J. Geophys. Res. 117,B09307.
Shi, Y., Bolt, B.A., 1982. The standard error of the magnitude-frequency b value. Bull.Seis. Soc. Am. 72, 1677–1687.
Silver, P., Chan, W., 1991. Shear wave splitting and subcontinental mantle deforma-tion. J. Geophys. Res. 96 (B10), 16429–16454.
Stork, A.L., Verdon, J.P., Kendall, J.-M., 2014. The robustness of seismic moment andmagnitudes estimated using spectral analysis. Geophys. Prospect. 62, 862–878.
Stork, A.L., Verdon, J.P., Kendall, J.-M., 2015. Assessing the effect of velocity modelaccuracy on microseismic interpretation at the in Salah Carbon Capture andStorage site. Energy Proc.
Vasco, D.W., Rucci, A., Ferretti, A., Novali, F., Bissell, R.C., Ringrose, P.S., Mathieson,A.S., Wright, I.W., 2010. Satellite-based measurements of surface deformationreveal fluid flow associated with the geological storage of carbon dioxide. Geo-phys. Res. Lett. 37, L03303.
Verdon, J., Kendall, J.-M., D.J., W., 2012. Monitoring carbon dioxide storage usingpassive seismic techniques. In: Proceedings of the Institution of Civil Engineers,Energy, vol. 165, pp. 85–89.
Verdon, J.P., 2014. Significance for secure CO2 storage of earthquakes induced byfluid injection. Env. Rev. Lett 9, 064022.
Verdon, J.P., Kendall, J.-M., Stork, A.L., Chadwick, R.A., White, D.J., Bissell, R.C., 2013.Comparison of geomechanical deformation induced by megatonne-scale CO2
storage at Sleipner. Weyburn, and In Salah. PNAS 110, E2762–E2771.Verdon, J.P., Kendall, J.-M., White, D.J., Angus, D.A., 2011. Linking microseismic event
observations with geomechanical models to minimise the risks of storing CO2
in geological formations. Earth Planet. Sci. Lett. 305, 143–152.Verdon, J.P., Stork, A.L., Bissell, R.C., Bond, C.E., Werner, M.J., in preparation. Simula-
tion of seismic events induced by CO2 injection at In Salah, Algeria.Verdon, J.P., Wüstefeld, A., 2013. Measurement of the normal/tangential fracture
compliance ratio (ZNZT) during hydraulic fracture stimulation using S-wavesplitting data. Geophys. Prospect. 61 (Suppl. 1), 461–475.
White, J., Chiaramontea, L., Ezzedineb, S., Foxalla, W., Haoa, Y., Ramireza, A., McNab,W., 2014. Geomechanical behavior of the reservoir and caprock system at the InSalah CO2 storage project. PNAS 111, 8747–8752.
Wuestefeld, A., Al-Harrasi, O., Verdon, J., Wookey, J., Kendall, J.-M., 2010. A strategyfor automated analysis of passive microseismic data to image seismic anisotropyand fracture characteristics. Geophys. Prospect. 58, 755–773.
Wuestefeld, A., Kendall, J.-M., Verdon, J.P., van As, A., 2011. In situ monitoring ofrock fracturing using shear wave splitting analysis: an example from a miningsetting. Geophys. J. Int 187, 848–860.
Zoback, M.D., Gorelick, S.M., 2012. Earthquake triggering and large-scale geologicstorage of carbon dioxide. PNAS 109, E3624–E3624.