The Micro and Macro Causes of Prison Growth
37
Georgia State University Law Review Volume 28 Issue 4 Summer 2012 Article 9 April 2013 e Micro and Macro Causes of Prison Growth John F. Pfaff Follow this and additional works at: hps://readingroom.law.gsu.edu/gsulr Part of the Law Commons is Article is brought to you for free and open access by the Publications at Reading Room. It has been accepted for inclusion in Georgia State University Law Review by an authorized editor of Reading Room. For more information, please contact [email protected]. Recommended Citation John F. Pfaff, e Micro and Macro Causes of Prison Growth, 28 Ga. St. U. L. Rev. (2013). Available at: hps://readingroom.law.gsu.edu/gsulr/vol28/iss4/9
Transcript of The Micro and Macro Causes of Prison Growth

Georgia State University Law ReviewVolume 28Issue 4 Summer 2012 Article 9
April 2013
The Micro and Macro Causes of Prison GrowthJohn F. Pfaff
Follow this and additional works at: https://readingroom.law.gsu.edu/gsulr
Part of the Law Commons
This Article is brought to you for free and open access by the Publications at Reading Room. It has been accepted for inclusion in Georgia StateUniversity Law Review by an authorized editor of Reading Room. For more information, please contact [email protected].
Recommended CitationJohn F. Pfaff, The Micro and Macro Causes of Prison Growth, 28 Ga. St. U. L. Rev. (2013).Available at: https://readingroom.law.gsu.edu/gsulr/vol28/iss4/9
1237
THE MICRO AND MACRO CAUSES OF PRISON GROWTH
John F. Pfaff* Over the past four decades, prison populations in the United States
have exploded. As Figure 1 demonstrates, from the 1920s (when reliable statistics first become available) through the mid-1970s, the incarceration rate hovered around 100 per 100,000 people.1 These rates were so stable that a leading criminologist argued in 1979 that political pressures would continue to keep the rate around 100 per 100,000.2 Thus, the subsequent quintupling of the incarceration rate over the next forty years, with the prison population growing by over 1.3 million inmates, was an unexpected and unprecedented development.3
Moreover, this boom was unique to the United States. While home to only about 5% of the world’s population, the United States currently contains nearly 25% of the world’s prisoners.4 And the
* Associate Professor, Fordham Law School. My thanks to Craig Langley at the Census Bureau for providing me with the complete Annual Survey of Government Finances data set, and to participants at the Georgia State University Law Review 2012 Symposium for helpful comments and questions. All errors are my own. 1. Unless otherwise stated, “incarceration rate” refers to the prison incarceration rate, not the aggregate prison-and-jail incarceration rate. In Figure 1, “in custody” and “under jurisdiction” refer to two ways the Bureau of Justice Statistics counts inmates. A change in methods in 1977 led to a slight discontinuous jump in that year. 2. Alfred Blumstein & Soumyo Moitra, An Analysis of the Time Series of the Imprisonment Rate in the States of the United States: A Further Test of the Stability of Punishment Hypothesis, 70 J. CRIM. L. & CRIMINOLOGY 376, 376 (1979). Specifically, they state that as prison populations rise, “police can choose not to arrest, prosecutors can choose not to press charges, judges can choose not to imprison, or parole boards can choose to [sic] deny requests.” Id. at 377. 3. PAUL GUERINO, PAIGE M. HARRISON & WILLIAM J. SABOL, PRISONERS IN 2010, at 14 (2011). It should be pointed out that there is substantial variation across states in rates of prison growth. In particular, five states (Delaware, Maryland, Michigan, New Jersey, and New York) saw average annual declines in prison populations over the entire 2000s. Id. at 3 fig.3. 4. ROY WALMSLEY, WORLD PRISON POPULATION LIST (8th ed. 2010). This list focuses on the prison-and-jail incarceration rate, rather than the prison-specific rate. In 2010, inmates in jail made up approximately 33% of all inmates (748,728 out of 2,266,832). See SOURCEBOOK OF CRIMINAL JUSTICE
STATISTICS ONLINE, available at http://www.albany.edu/sourcebook/pdf/t612010.pdf. Only China, however, also has more than one million people in prison and jails combined: the United States prison population is thus larger than the prison-and-jail populations in all other countries (except perhaps China). WALMSLEY, supra, at 4.
1
Pfaff: The Micro and Macro Causes of Prison Growth
Published by Reading Room, 2012

1238 GEORGIA STATE UNIVERSITY LAW REVIEW [Vol. 28:4
company we keep is troubling. Figure 2 compares the U.S. prison-and-jail incarceration rate to other high-incarceration countries as well as to a sample of our political and cultural allies. Our incarceration “peers” are countries such as Russia, Cuba, and Kazakhstan, while our allies have rates often six or seven times lowers than ours.
In this Article, I want to examine what we know—and what we do
not know—about the causes behind this remarkable development. In particular, I want to focus on two distinct questions, the micro and the macro. The micro question is the “who” question. The criminal justice system is not a coherent “system” of actors but a sprawling web of competing institutions: police, prosecutors, judges, legislators, governors, and parole boards, all of whom respond to different constituencies and have different incentives. It is thus important to ask which actors are driving prison populations upwards.
100
200
300
400
500
1920 1940 1960 1980 2000 2020Year
In Custody Under Jurisdiction
Data from the Bureau of Justice Statistics National Prisoner Statisticsand Historical Statistics on Prisoners in State and Federal Institutions
1922 - 2008Figure 1: US Incarceration Rate
2
Georgia State University Law Review, Vol. 28, Iss. 4 [2012], Art. 9
https://readingroom.law.gsu.edu/gsulr/vol28/iss4/9

2012] MICRO AND MACRO CAUSES OF PRISON GROWTH 1239
The macro question is the “why” question. Clearly, something
must have changed in the 1970s to cause prison populations to increase so dramatically. Was the spike just a natural response to rising crime rates during the 1960s and 1970s, or was there a deeper cause—a change in economic conditions or in politics, or perhaps a reaction against the civil rights movement? If we want to understand how we got where we are and where we can go, it is essential to understand not just who got us here, but why.
As I show below, we know the answer to the micro question much better than that to the macro. On the micro side, data indicate that at least since 1994, prison growth has been driven primarily by prosecutors increasing the rate at which they file charges against arrestees. None of the other possible sources seems to matter: arrests (and arrests per crime), prison admissions per felony filing, and time served have generally been flat or falling over that time. Due to limitations in the data, it is harder to assign responsibility prior to 1994, but the data we have suggest that time served in prison was still mostly flat during that time, and that at least a chunk of the increase in admissions was due to rising crime rates.
8996
116119129
153207
288305
323326329335
356378
415455468
531629
756
0 200 400 600 800mean of Rate
GermanyFrance
CanadaChina
AustraliaUnited Kingdom
MexicoLatviaChile
UkraineIsrael
BotswanaSouth Africa
SurinameKazakhstan
GeorgiaBelize
BelarusCuba
RussiaUnited States
Data from Walmsley. Rate includes both prisons and jails
Figure 2: Select Incarceration Rates, 2008
3
Pfaff: The Micro and Macro Causes of Prison Growth
Published by Reading Room, 2012
1240 GEORGIA STATE UNIVERSITY LAW REVIEW [Vol. 28:4
It is harder to make such concrete statements about the macro factors. Changes in crime rates, economic conditions (in particular state fiscal capacity), political attitudes, and racial policies all certainly played roles in driving up prison populations. Trends in crime and state resources have been important. But we have less solid quantitative evidence concerning the political and racial factors. Of course, these complex social phenomena do not lend themselves to easy quantification. However, a less obvious problem exists: studies examining these issues tend to focus on national and state-level actors, despite the fact that it appears county prosecutors bear the largest responsibility. Although it will be possible to tease out some of the theories’ implications for county-level officials, these will unfortunately be somewhat speculative.
This Article proceeds as follows. Part 1 discusses the micro causes of prison growth, and Part 2 the macro causes and their implications for reform efforts.
1. THE MICRO CAUSES OF PRISON GROWTH
In order to understand why prison populations have grown, it is first essential to figure out where the growth has occurred. To start, two major “locations” for growth exist: the number of prison admissions and length of time served. In this section, I will first show that longer sentences do not explain United States prison growth—ours is an admissions-driven boom. In the second part of this section, I will thus examine where in the admissions process growth is occurring. After all, the growth in admissions can be driven by changes in crimes, arrests per crime, felony filings per arrest, convictions per filing, and admissions per conviction; my results indicate that, at least since the 1990s, increases in filing-per-arrest have been the most important source of growth.
1.1 The Story Is Not One of Increasing Severity
The conventional perception of punishment in the United States is that we are imposing increasingly longer sentences on offenders. For
4
Georgia State University Law Review, Vol. 28, Iss. 4 [2012], Art. 9
https://readingroom.law.gsu.edu/gsulr/vol28/iss4/9

2012] MICRO AND MACRO CAUSES OF PRISON GROWTH 1241
example, Franklin Zimring has stated that since the 1990s our criminal justice system has focused on “throw[ing] away the key.”5 The media often provides stories of low-level offenders receiving severe sentences, and state legislatures have passed a rash of punitive laws, such as three-strikes and truth-in-sentencing laws.6
But in practice, sentence lengths have generally remained relatively short, and evidence suggests that sentence lengths do not explain much of the increase in the U.S. prison population. For example, I have shown that in eleven predominantly northern states (chosen solely due to limitations in the data) median time spent in prison hovered around one year from the late 1980s through the early 2000s, with lows of six months in states like California and Illinois.7 Moreover, data from these states clearly demonstrate that trends in admissions, not releases, drove their prison growth. Changes in sentence lengths had no noticeable effects on prison populations in these states, but prison populations in all eleven states would have flattened, and sometimes even fallen, by the mid- to late-1990s had admissions levels not grown.
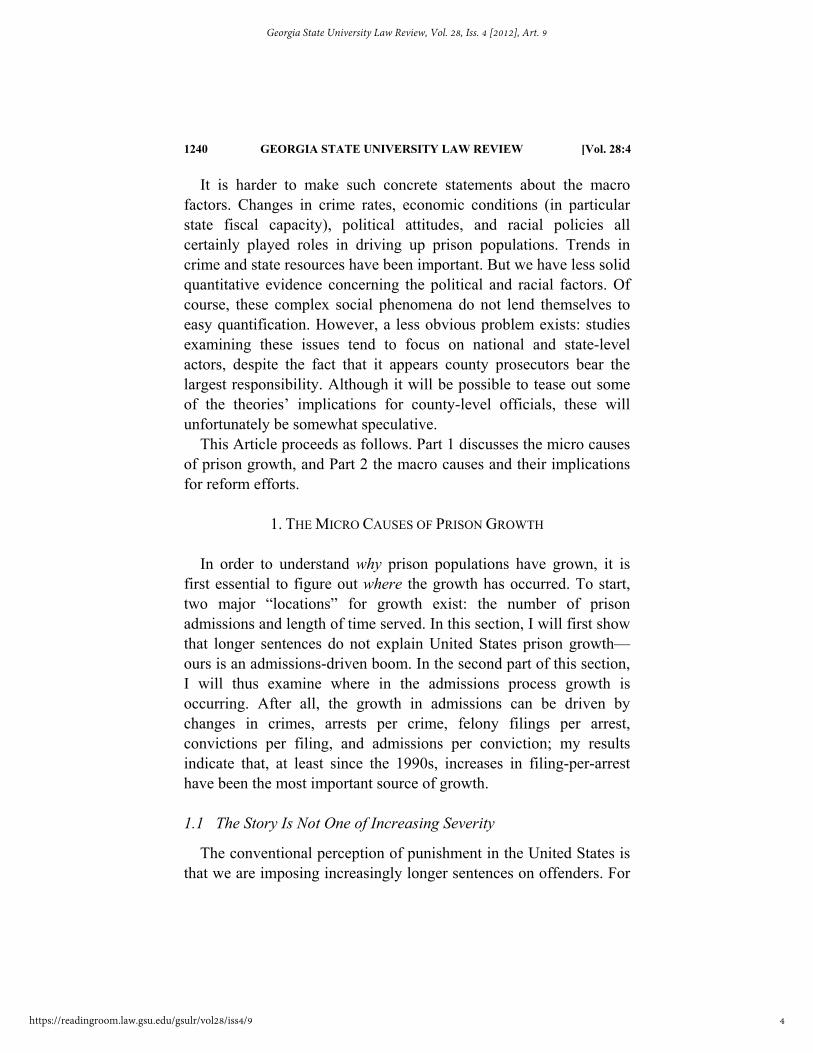
Furthermore, in a recent paper I demonstrate that these findings are generalizable to the country as a whole.8 There is actually a fairly simple way to show that increased severity is unlikely to be the primary engine of population growth. Figure 3 plots annual admissions and releases from prison. If sentences were getting significantly longer, we should expect to see the dotted releases line grow more slowly relative to the solid admissions line—the gap between the two should widen. But except for a brief period in the
5. Franklin E. Zimring, Imprisonment Rates and the New Politics of Criminal Punishment, 3 PUNISHMENT & SOC’Y 161, 162 (2001). 6. For an overview of these developments, see John F. Pfaff, The Continued Vitality of Structured Sentencing Following Blakely: The Effectiveness of Voluntary Guidelines, 54 UCLA L. REV. 235, 242–47 (2006). 7. John F. Pfaff, The Myths and Realities of Correctional Severity: Evidence From the National Corrections Reporting Program on Sentencing Practices, 13 AM. L. & ECON. REV. 491, 494 (2011) [hereinafter Pfaff, Correctional Severity]; John F. Pfaff, The Durability of Prison Populations, 2010 U. CHI. LEGAL F. 73, 81 (2010) [hereinafter Pfaff, Durability]. 8. John F. Pfaff, The Causes of Growth in Prison Populations and Admissions, (Working Paper No. 1884674, 2011), available at http://papers.ssrn.com/sol3/papers.cfm?abstract_id=1884674.
5
Pfaff: The Micro and Macro Causes of Prison Growth
Published by Reading Room, 2012
1242 GEORGIA STATE UNIVERSITY LAW REVIEW [Vol. 28:4
early 1990s, that simply does not happen; as we enter the 2000s, the gap actually narrows.
Thus, sentence length does not appear to drive prison growth,
implying that admissions must be doing the heavy lifting. This is good news for those who wish to rein in or reduce prison growth: significant, immediate gains can be made simply by admitting fewer people, rather than having to wait for long-serving inmates to gradually leave prison.9 I turn now to the causes of admissions growth.
1.2 The Causes of Admissions Growth
There are five “locations” where admissions growth can take place: crimes, arrests per crime, felony filings per arrest, felony convictions per filing, and prison admissions per conviction. Studies have tried to rigorously identify the relative importance of these 9. A small core of long-serving inmates establishes a floor that will take some time to decay, absent executive fiats releasing them. But reduced admissions can still cause substantial reductions in the prison population within only two or three years. See Pfaff, Durability, supra note 7, at 84.
020
0000
4000
0060
0000
8000
00
1975 1980 1985 1990 1995 2000 2005 2010Year
Admission Releases
Data from the National Prisoner Statistics.
1977 - 2009Figure 3: Admissions and Releases
6
Georgia State University Law Review, Vol. 28, Iss. 4 [2012], Art. 9
https://readingroom.law.gsu.edu/gsulr/vol28/iss4/9

2012] MICRO AND MACRO CAUSES OF PRISON GROWTH 1243
locations, but they have looked at only a subset of these factors: crimes, arrests per crime, and admissions per arrest.10 This is due to a limitation in the data: there is very little publicly available data on prosecutorial behavior. In a recent paper, however, I exploit a seemingly unused dataset on such behavior that allows me to look at trends in crimes, arrests per crime, felony filings per arrest, admissions per felony filing, and time served per admission.11 Adequate data on the “convictions” step remains harder to gather, but this model is still a significant improvement on past efforts.
This section thus proceeds as follows. I start by briefly looking at what we know about the importance of trends in crime rates and arrests over the whole period of the boom, 1977 to 2010. I then discuss my results about the role of prosecutors starting in 1994, the first year for which I have reliable prosecutorial data. This is actually not an important limitation: crime has been dropping steadily since 1991, so the causal forces at work prior to 1991 are likely different than those at work now.
It is easy to summarize the basic findings I present here: (1) Growth in crime appears to have been an important engine of growth prior to the mid-1990s; (2) there has been no change in arrests per crime in decades; (3) starting in the 1990s, felony filings per arrest have risen significantly; and (4) admissions per conviction have remained flat.
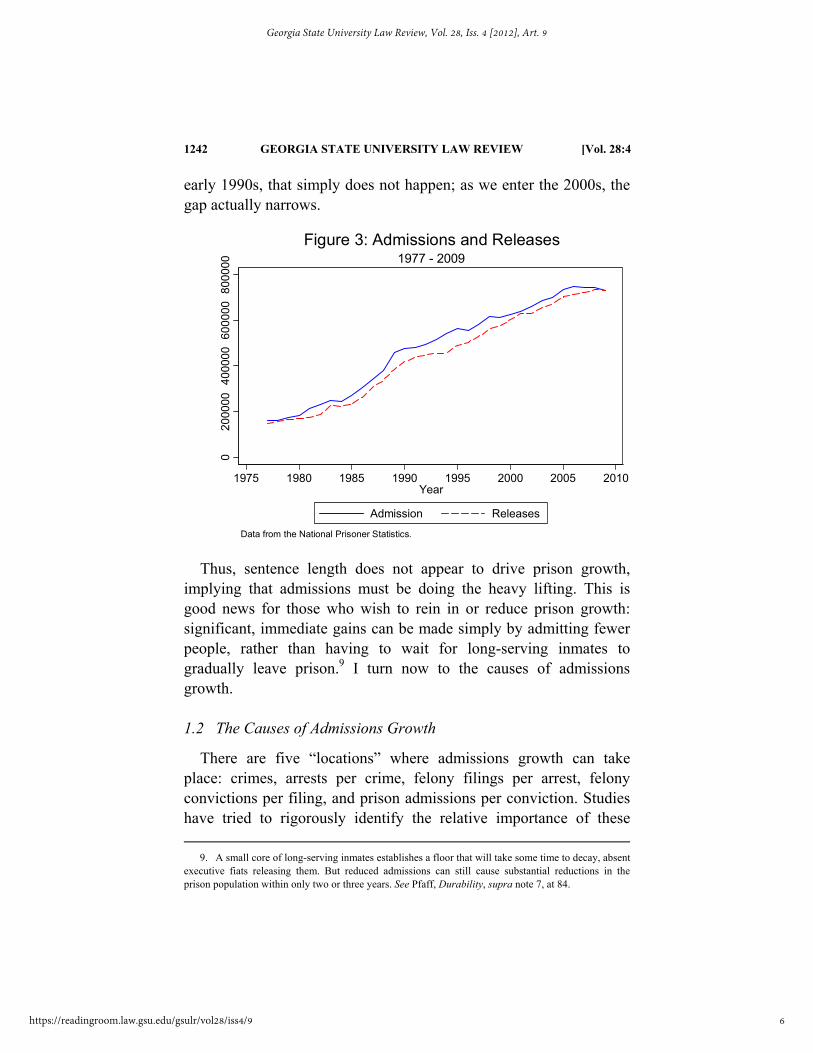
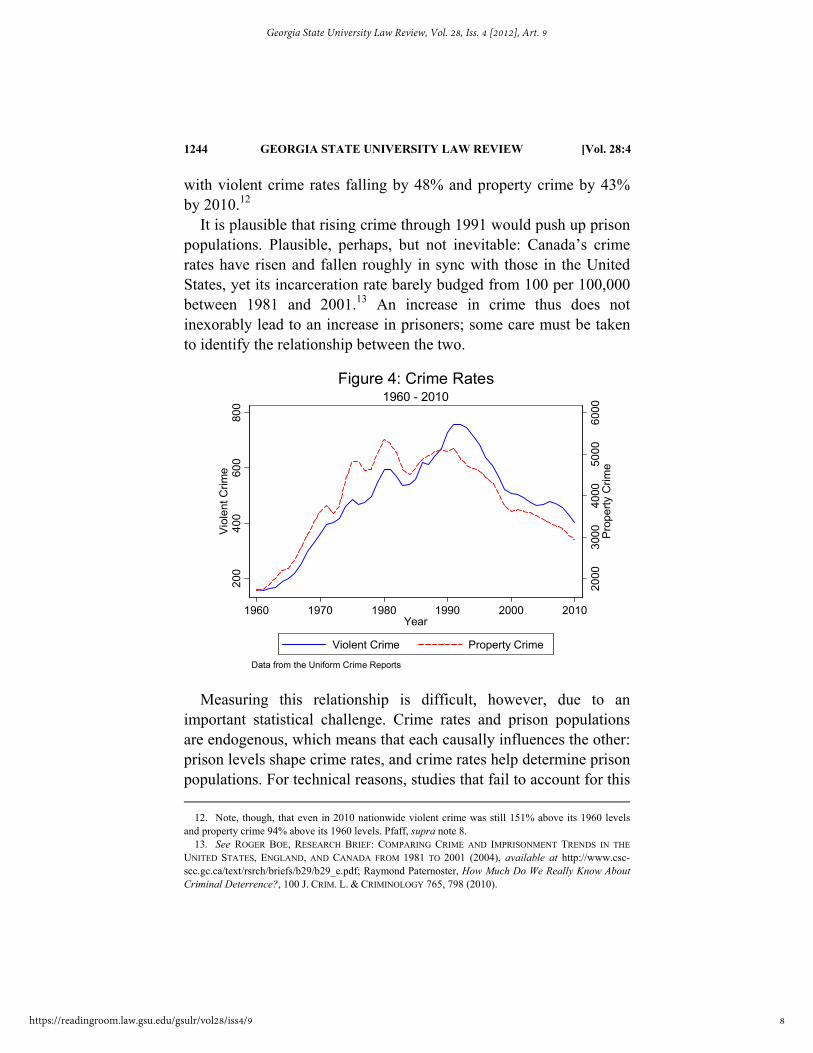
Factor 1: Crime Rates. Figure 4 plots violent and property crime rates (per 100,000 people) since 1960. Two trends stand out. First, between 1960 and 1991 violent and property crimes rise dramatically, except for a brief lull in the early 1980s. During that thirty-two year period, violent crime rates grew by 371% (or 11.6% per year) and property crime rates by 198% (or 6.2% per year). Second, from 1991 through today, crime rates have steadily declined,
10. See Alfred Blumstein & Allen J. Beck, Population Growth in the U.S. Prisons, 1980–1996, in PRISONS 17 (Michael Tonry & Joan Petersilia eds., 1999); Alfred Blumstein & Allen J. Beck, Reentry as a Transient State Between Liberty and Recommitment, in PRISONER REENTRY AND CRIME IN AMERICA (Jeremy Travis & Christy Visher eds., 2005); Scott Boggess & John Bound, Did Criminal Activity Increase During the 1980s?: Comparisons across Data Sources, 78 SOC. SCI. Q. 725 (1997); Patrick A Langan, America’s Soaring Prison Population, 251 SCI. 1568 (1991). 11. Pfaff, supra note 8.
7
Pfaff: The Micro and Macro Causes of Prison Growth
Published by Reading Room, 2012
1244 GEORGIA STATE UNIVERSITY LAW REVIEW [Vol. 28:4
with violent crime rates falling by 48% and property crime by 43% by 2010.12
It is plausible that rising crime through 1991 would push up prison populations. Plausible, perhaps, but not inevitable: Canada’s crime rates have risen and fallen roughly in sync with those in the United States, yet its incarceration rate barely budged from 100 per 100,000 between 1981 and 2001.13 An increase in crime thus does not inexorably lead to an increase in prisoners; some care must be taken to identify the relationship between the two.
Measuring this relationship is difficult, however, due to an
important statistical challenge. Crime rates and prison populations are endogenous, which means that each causally influences the other: prison levels shape crime rates, and crime rates help determine prison populations. For technical reasons, studies that fail to account for this 12. Note, though, that even in 2010 nationwide violent crime was still 151% above its 1960 levels and property crime 94% above its 1960 levels. Pfaff, supra note 8. 13. See ROGER BOE, RESEARCH BRIEF: COMPARING CRIME AND IMPRISONMENT TRENDS IN THE
UNITED STATES, ENGLAND, AND CANADA FROM 1981 TO 2001 (2004), available at http://www.csc-scc.gc.ca/text/rsrch/briefs/b29/b29_e.pdf; Raymond Paternoster, How Much Do We Really Know About Criminal Deterrence?, 100 J. CRIM. L. & CRIMINOLOGY 765, 798 (2010).
2000
3000
4000
5000
6000
Pro
pert
y C
rime
200
400
600
800
Vio
lent
Crim
e
1960 1970 1980 1990 2000 2010Year
Violent Crime Property Crime
Data from the Uniform Crime Reports
1960 - 2010Figure 4: Crime Rates
8
Georgia State University Law Review, Vol. 28, Iss. 4 [2012], Art. 9
https://readingroom.law.gsu.edu/gsulr/vol28/iss4/9

2012] MICRO AND MACRO CAUSES OF PRISON GROWTH 1245
causal intertwining are likely to understate the effect of crime rates on prison populations—and all but one paper that look at this issue make just this oversight.14
The one paper that accounts for the endogenous relationship between prison and crime, by Yair Listokin, relies on a clever but controversial empirical maneuver.15 Assuming we accept his technique, his results suggest that between 1985 and 1997 each 1% increase in crime rates led to a 1.07% increase in prison admissions. Note, though, that the error bars around that estimate are quite large,16 and the potential limitations of his method for addressing endogeneity should not be taken lightly.
Roughly speaking, however, Listokin’s results suggest that increases in crime, and violent crime in particular, could explain up to half the growth in prison admissions between 1985 and 1991. During that time, violent crime rates rose by about 5% per year (and total crime rates by 2% per year), and prison admissions by 9%. At the very least, Listokin’s model provides some evidence that trends in crime played an important, but by no means dispositive, role in prison growth during the 1980s.
Note, too, an interesting collateral implication of the paper. Listokin’s results run through 1997, well into the sustained crime drop that began in 1991. If his results are accurate both before and after 1991—and Listokin does not break out his analysis in this way—then his results suggest that the crime decline has acted as a major brake on prison growth since 1991.
Factor 2: Arrests per Crime. Arrests per crime is an easy factor to dismiss. Figure 5A provides the clearance rates for eight major categories of crime between 1972 and 2004. Clearance rates measure
14. I survey these papers and explain the implications of this failure—which are severe—in John F. Pfaff, The Empirics of Prison Growth: A Critical Review and Path Forward, 98 J. CRIM. L. &
CRIMINOLOGY 547 (2008). 15. Yair Listokin, Does More Crime Mean More Prisoners? An Instrumental Variables Approach, 46 J.L. & ECON. 181 (2003). For readers with a technical background, Listokin uses abortion rates as an instrumental variable for crime, building on John Donohue & Steven Levitt, The Impact of Legalized Abortion on Crime, 116 Q. J. ECON. 379 (2001). The instrument works best if abortion has no effect on prison populations except through crime rates, which is certainly not the case. The extent to which this undermines the instrument is, unfortunately, unclear. 16. The standard error for his point estimate of 1.07 is 0.70. Listokin, supra note 15, at 191.
9
Pfaff: The Micro and Macro Causes of Prison Growth
Published by Reading Room, 2012
1246 GEORGIA STATE UNIVERSITY LAW REVIEW [Vol. 28:4
the percent of crimes for which charges are filed; as Figure 5A clearly demonstrates, clearance rates have been relatively flat (or, for murder, declining) for three decades. Thus, at least for violent and property crimes, changes in arrests per crime cannot explain prison growth.
10
Georgia State University Law Review, Vol. 28, Iss. 4 [2012], Art. 9
https://readingroom.law.gsu.edu/gsulr/vol28/iss4/9

2012] MICRO AND MACRO CAUSES OF PRISON GROWTH 1247
Moreover, since 1991 the absolute number of arrests for violent
and property crimes have fallen, thanks to the drop in crime. Adding
.2.4
.6.8
.2.4
.6.8
.2.4
.6.8
1970 1980 1990 2000
1970 1980 1990 2000 1970 1980 1990 2000
Agg. Assault Arson Auto
Burglary Larceny Murder
Rape Robbery
Rat
e
YearData from the Uniform Crime Reports
1972 - 2004Fig. 5A: Clearance Rates
380
0000
400
0000
420
0000
440
0000
460
0000
Arr
ests
1995 2000 2005 2010Year
Data from the Uniform Crime Reprots
1994 - 2008Fig. 5B: Arrests
11
Pfaff: The Micro and Macro Causes of Prison Growth
Published by Reading Room, 2012

1248 GEORGIA STATE UNIVERSITY LAW REVIEW [Vol. 28:4
in drug arrests does not change the story noticeably. Figure 5B plots the number of annual arrests between 1994 and 2008 for violent, property, and non-marijuana drug offenses.17 Despite an uptick in arrests in the 2000s, the overall number of arrests fell by 8.4%.
Factor 3: Felony Filings per Arrest.18 Micro studies of prison growth have generally moved from arrests per crime to admissions per arrest, solely as a concession to the absence of data on prosecutorial behavior. Yet it turns out such data exists: the National Center on State Courts gathers data on the number of felony filings per year in criminal courts. There are two limits to the data. First, the NCSC revised how it gathered the data in 1994, making it impossible to compare data before and after 1994; and second, not every state provides data every year. As a result, I can examine felony filings trends from 1994 to 2008 for thirty-four states; these states are shown in Figure 6.19
Figure 7A plots the total number of cases filed in the thirty-four state sample against the number of prisoners admitted. Between 1994 and 2008, filings grew by 37.4% and admissions by a nearly identical 40%. This is actually a more remarkable number than it might first appear. As Figure 5B demonstrates, this is a period of declining arrests: in my thirty-four state sample, arrests20 fell by 10.1%, slightly above the national decline of 8.4%. Thus, filings and admissions rose significantly during a period when the number of defendants declined sharply.
17. I focus on non-marijuana drug arrests since very few defendants are sent to prison on marijuana charges, and drug arrest data does not distinguish between misdemeanor and felony arrests. Due to limitations in the data, Washington, DC, Florida, Kansas, and New York are excluded. 18. The discussion here draws heavily on Pfaff, supra note 8. 19. Data from the lighter-shaded states are slightly less reliable than those from the darker-shaded states, but the results are the same whether the less reliable states are included or not. 20. From here on, I will use “arrests” to refer to arrests for violent, property, and non-marijuana drug offenses.
12
Georgia State University Law Review, Vol. 28, Iss. 4 [2012], Art. 9
https://readingroom.law.gsu.edu/gsulr/vol28/iss4/9

2012] MICRO AND MACRO CAUSES OF PRISON GROWTH 1249
Fig. 6: States Providing Data on Felony Filings
Figure 7B illuminates just how important this change in
prosecutorial behavior has been. The solid line is the number of prisoners actually admitted each year, and the dotted line is the number that would have been admitted had the filings-per-arrest rate remained fixed at its 1994 level. Had that rate, which rose from 0.375 in 1994 to 0.573 in 2008, remained constant, admissions in 2008 would have been approximately 36% below what they actually were that year and just over 10% below where they actually were back in 1994.
13
Pfaff: The Micro and Macro Causes of Prison Growth
Published by Reading Room, 2012

1250 GEORGIA STATE UNIVERSITY LAW REVIEW [Vol. 28:4
05
0000
01
.0e+
061
.5e+
062
.0e+
06
1995 2000 2005 2010year
Cases Admissions
Data from the National Center for State Courts and National Prisoner Statistics
34 States, 1994 - 2008Fig. 7A: Cases and Admissions
300
000
350
000
400
000
450
000
500
000
1995 2000 2005 2010year
Admissions File Counter., 1994
Data from the National Center for State Courts and the National Prisoner Statistics
34 States, 1994 - 2008Figure 7B: Admissions Counterfactual
14
Georgia State University Law Review, Vol. 28, Iss. 4 [2012], Art. 9
https://readingroom.law.gsu.edu/gsulr/vol28/iss4/9

2012] MICRO AND MACRO CAUSES OF PRISON GROWTH 1251
Factor 4: Admissions per Filing. Admissions per filing is another factor that is easy to exclude. In my thirty-four state sample, admissions per filing remain almost perfectly flat between 1994 and 2008, rising from 0.258 to 0.264 and peaking at 0.271 in 1999; these distinctions are fairly trivial. Once the prosecutor decided to file charges, the likelihood of going to prison did not change in any meaningful way during the 1990s and 2000s.
An Important Aside: Prosecutors vs. Parole Officers. My claim here is that prosecutors have driven prison growth in recent decades. But there is another path to prison admissions that does not fit the prosecutorial story so clearly: parole violations. At least outside of California, however, it seems unlikely that these violations have driven prison growth. I have developed this argument in some detail elsewhere,21 so I will just make two brief points here. First, in general, the percent of annual admissions from parole has not fluctuated much, increasing in my sample of eleven states from about 30% of admissions to 40% over the 1990s; a wider-looking study by the Bureau of Justice Statistics reported a similar value of 35%.22 California is the one exception (at around 60% to 70%), but it is such an outlier that the Bureau of Justice Statistics often discusses California separately when providing parole statistics.
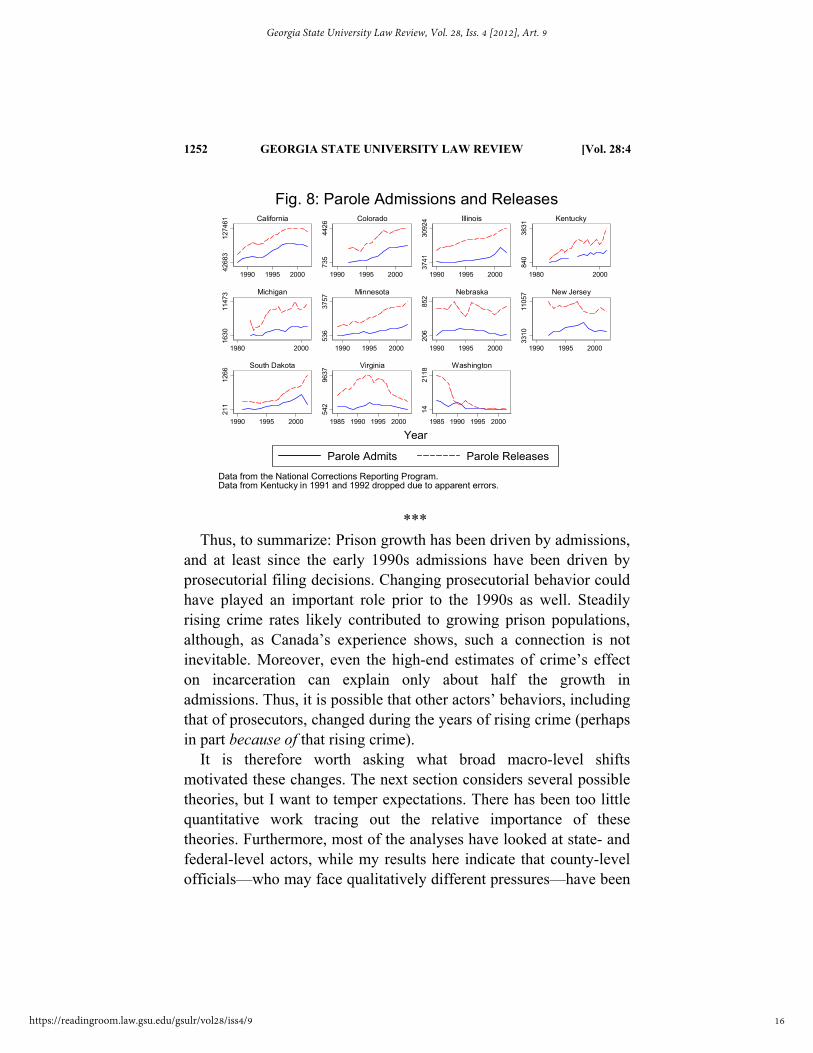
Second, and more important, while parole admissions are up, so too are parole releases. In fact, as shown in Figure 8, parole releases are always greater than parole admissions, and release and admissions rates tend to track each other closely. So are parole admissions causing prison growth, or are larger prison populations leading to more parole releases that in turn generate more parole violations? The following metaphor is helpful: when bailing out a boat using a bucket with a leak in it, is the water leaking out of the bucket and back into the boat causing the water levels in the boat to rise? It is true that a bucket with no leak at all would bail out the boat even faster, but the leak is not really causing the water to get there in the first place. So too with parole violations.
21. See Pfaff, Correctional Severity, supra note 7. 22. PAUL GUERINO, PAIGE M. HARRISON & WILLIAM J. SOBOL, PRISONERS IN 2010, at 6 (2011).
15
Pfaff: The Micro and Macro Causes of Prison Growth
Published by Reading Room, 2012
1252 GEORGIA STATE UNIVERSITY LAW REVIEW [Vol. 28:4
***
Thus, to summarize: Prison growth has been driven by admissions, and at least since the early 1990s admissions have been driven by prosecutorial filing decisions. Changing prosecutorial behavior could have played an important role prior to the 1990s as well. Steadily rising crime rates likely contributed to growing prison populations, although, as Canada’s experience shows, such a connection is not inevitable. Moreover, even the high-end estimates of crime’s effect on incarceration can explain only about half the growth in admissions. Thus, it is possible that other actors’ behaviors, including that of prosecutors, changed during the years of rising crime (perhaps in part because of that rising crime).
It is therefore worth asking what broad macro-level shifts motivated these changes. The next section considers several possible theories, but I want to temper expectations. There has been too little quantitative work tracing out the relative importance of these theories. Furthermore, most of the analyses have looked at state- and federal-level actors, while my results here indicate that county-level officials—who may face qualitatively different pressures—have been
4268
312
7461
1990 1995 2000
California
735
4426
1990 1995 2000
Colorado
3741
3092
4
1990 1995 2000
Illinois
840
3831
1980 2000
Kentucky16
3011
473
1980 2000
Michigan
536
3757
1990 1995 2000
Minnesota
206
852
1990 1995 2000
Nebraska
3310
1105
7
1990 1995 2000
New Jersey
211
1266
1990 1995 2000
South Dakota
542
9637
1985 1990 1995 2000
Virginia
1421
181985 1990 1995 2000
Washington
Parole Admits Parole Releases
Year
Data from the National Corrections Reporting Program.Data from Kentucky in 1991 and 1992 dropped due to apparent errors.
Fig. 8: Parole Admissions and Releases
16
Georgia State University Law Review, Vol. 28, Iss. 4 [2012], Art. 9
https://readingroom.law.gsu.edu/gsulr/vol28/iss4/9
2012] MICRO AND MACRO CAUSES OF PRISON GROWTH 1253
at the forefront of prison growth. The next section will discuss these theories broadly, and it will try as best as possible to tease out some policy implications from them.
2. THE MACRO CAUSES OF PRISON GROWTH
To explain the macro causes of prison growth, commentators have generally considered three main theories besides changing crime rates: changing political conditions, changing economic conditions, and changing demographics of potential offenders. Studies have also considered the importance of the deinstitutionalization of the mentally ill, changes in sentencing laws, and the role of court orders regulating population size. Unfortunately, our empirical understanding of the absolute and relative importance of these theories remains quite weak.23
Rather than simply summarizing these theories (and our limited empirical knowledge about them), I want to examine two macro-level questions that are closely tied to this symposium’s theme of the relationship between the current economic crisis and prison growth. First, to what extent is recent prison growth simply the result of expanding state fiscal capacity? The closer this connection, the more the current crisis provides an opportunity for reform. And second, to the extent that prison populations have grown faster than overall state spending, how important are changing political views (including those with respect to race) to this growth?
2.1 Expanded State Fiscal Capacity
The current financial crisis may encourage states to seriously rein in their use of incarceration; that 2011 marked the first decline in total prison populations since 1972 is likely not coincidental. This section thus examines the connection between state prison growth and state fiscal resources. A rough hypothesis can help guide the discussion. Broadly speaking, if state resources are driving prison
23. Pfaff, supra note 14.
17
Pfaff: The Micro and Macro Causes of Prison Growth
Published by Reading Room, 2012
1254 GEORGIA STATE UNIVERSITY LAW REVIEW [Vol. 28:4
growth, then corrections’ share of state expenditures should hold constant; if prison growth reflects increased punitiveness, then corrections’ share should rise. It is essential to make clear that observing stable expenditures shares does not prove that state fiscal capacity is driving growth, but it at least supports that story’s plausibility.24
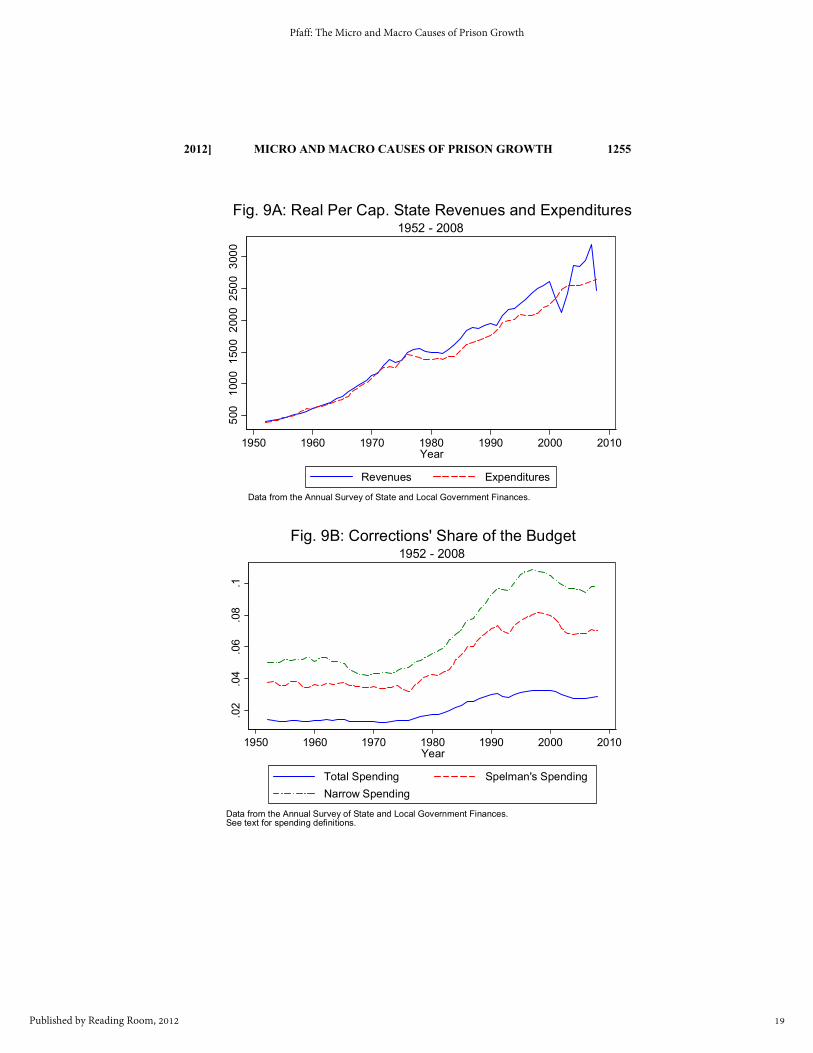
To start, Figure 9A plots total real per capita revenues and expenditures for all state governments from 1952 to 2008. State spending grows steadily from the 1950s to the mid-1970s and again from the 1980s through the late 2000s. Thus, the general rise in incarceration, and that during the crime drop in particular, coincides with increasing state and local spending across the board.
24. The old saw that correlation does not imply causation applies. For example, corrections’ share of the budget could remain flat in the presence of increased punitiveness if that increase coincides with technical advances that reduce the cost of each “unit” of punishment. The results I provide here cannot uncover such an effect. That said, if corrections’ share of the budget remains flat, we learn that the simple “we became more punitive” story is at least incomplete.
18
Georgia State University Law Review, Vol. 28, Iss. 4 [2012], Art. 9
https://readingroom.law.gsu.edu/gsulr/vol28/iss4/9
2012] MICRO AND MACRO CAUSES OF PRISON GROWTH 1255
500
100
01
500
200
02
500
300
0
1950 1960 1970 1980 1990 2000 2010Year
Revenues Expenditures
Data from the Annual Survey of State and Local Government Finances.
1952 - 2008Fig. 9A: Real Per Cap. State Revenues and Expenditures
.02
.04
.06
.08
.1
1950 1960 1970 1980 1990 2000 2010Year
Total Spending Spelman's Spending
Narrow Spending
Data from the Annual Survey of State and Local Government Finances.See text for spending definitions.
1952 - 2008Fig. 9B: Corrections' Share of the Budget
19
Pfaff: The Micro and Macro Causes of Prison Growth
Published by Reading Room, 2012

1256 GEORGIA STATE UNIVERSITY LAW REVIEW [Vol. 28:4
Figure 9B then plots corrections’ share of state spending, using three increasingly restrictive definitions of “spending” to reflect William Spelman’s concern that state laws and federal mandates put much of state spending beyond the day-to-day reach of legislators.25 The lowest curve depicts corrections’ share of all spending, and the two higher curves corrections’ shares of various, more-discretionary subsets of that amount.26 For all three definitions, the same general pattern emerges. Corrections’ share remains flat until the mid-1970s, grows steadily until the mid-1990s, and then falls and flattens into and throughout the 2000s. In 2008, corrections’ share of the various measures of expenditure was 2.9% (up from 1.4% in 1952), 7.0% (up from 3.8% in 1952), and 9.8% (up from 5.0% in 1952), respectively. Thus, for many years, spending on corrections did grow somewhat faster than overall state fiscal capacity, but a few years into the crime decline corrections’ share of the budget generally flattened or even fell.
Thus, at least since the mid-1990s spending on corrections and spending overall have been highly correlated. It is quite likely that this connection is somewhat causal. In a more rigorous analysis of this issue, Spelman argued that up to 30% of the variation in state prison populations could be explained by variations in state resources.27 And tellingly, the number of states whose prison populations declined rose significantly at the end of the 2000s, as the crisis erupted and worsened.28
25. William Spelman, Crime, Cash, and Limited Options: Explaining the Prison Boom, 8 CRIMINOLOGY & PUB. POL’Y 29, 40–41 (2009). 26. The middle curve adopts Spelman’s definition of discretionary spending, which is total spending minus spending on welfare, health and hospitals, highways, primary and secondary education, and interest on debt. The highest curve further reduces Spelman’s budget by removing expenditures on insurance trust programs like workers’ compensation and unemployment insurance. 27. Spelman, supra note 25, at 63. 28. In 2005, eleven states saw their prison populations shrink at an average rate of 1.9%. In 2006, the number dropped to nine states, although the average decline rose to 2.3%. In 2007, the number of states with declining populations rose to fifteen (average of 1%), in 2008 to sixteen (average of 1.6%), and in 2009 and 2010 twenty-four (with averages of 1.8% and then, most dramatically, 2.7%, respectively). Allen J. Beck & Paige M. Harrison, Prisoners in 2005 Summary, BUREAU OF JUSTICE STATISTICS (Nov. 30, 2006), http://bjs.ojp.usdoj.gov/index.cfm?ty=pbdetail&iid=912; WILLIAM J. SABOL, HEATHER
COUTURE & PAIGE M. HARRISON, BUREAU OF JUSTICE STATISTICS, PRISONERS IN 2006, at 2 (2007); HEATHER C. WEST & WILLIAM J. SABOL, PRISONERS IN 2007, at 2 (2008); WILLIAM J. SABOL, HEATHER C. WEST & MATTHEW COOPER, BUREAU OF JUSTICE STATISTICS, PRISONERS IN 2008, at 17–
20
Georgia State University Law Review, Vol. 28, Iss. 4 [2012], Art. 9
https://readingroom.law.gsu.edu/gsulr/vol28/iss4/9
2012] MICRO AND MACRO CAUSES OF PRISON GROWTH 1257
Note that the stability of corrections’ share of the budget may explain the durability of a well-documented criminal justice moral hazard problem. Prosecutors are county officials, but the state pays to incarcerate the defendants they convict; we should thus expect prosecutors to “overuse” prison beds, since neither they nor their constituents bear the full cost.29 These results suggest that state-level officials may have been willing to tolerate these moral hazard costs because they were not particularly important—they do not appear to have crowded out spending on other programs.30 State-level politicians continued to adopt “tough-on-crime” positions without appearing to have to sacrifice other programs they favored. Tellingly, the onset of the financial crisis has seen state-level officials begin to rein in county-level actors. Many efforts have been blunt, such as gubernatorial furloughs and early releases. California, at least, is targeting the moral hazard problem more directly by attempting to require county jails to maintain custody of some drug offenders who previously would have gone to state prison.31
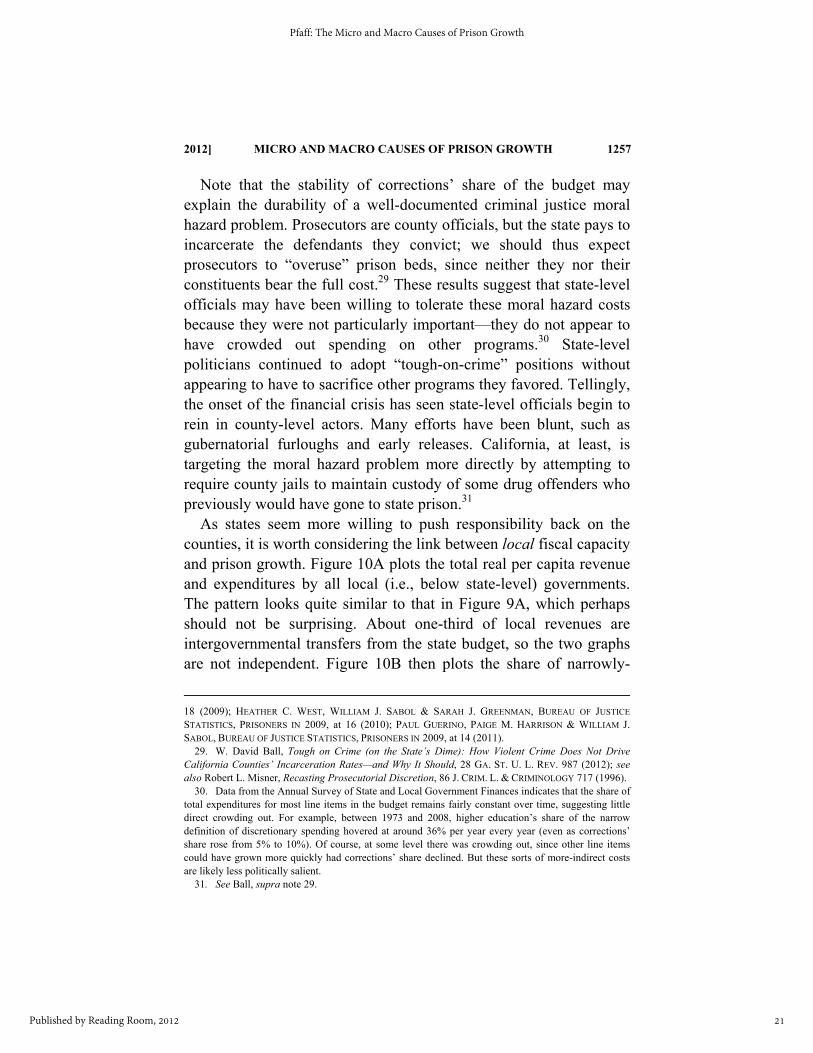
As states seem more willing to push responsibility back on the counties, it is worth considering the link between local fiscal capacity and prison growth. Figure 10A plots the total real per capita revenue and expenditures by all local (i.e., below state-level) governments. The pattern looks quite similar to that in Figure 9A, which perhaps should not be surprising. About one-third of local revenues are intergovernmental transfers from the state budget, so the two graphs are not independent. Figure 10B then plots the share of narrowly-
18 (2009); HEATHER C. WEST, WILLIAM J. SABOL & SARAH J. GREENMAN, BUREAU OF JUSTICE
STATISTICS, PRISONERS IN 2009, at 16 (2010); PAUL GUERINO, PAIGE M. HARRISON & WILLIAM J. SABOL, BUREAU OF JUSTICE STATISTICS, PRISONERS IN 2009, at 14 (2011). 29. W. David Ball, Tough on Crime (on the State’s Dime): How Violent Crime Does Not Drive California Counties’ Incarceration Rates—and Why It Should, 28 GA. ST. U. L. REV. 987 (2012); see also Robert L. Misner, Recasting Prosecutorial Discretion, 86 J. CRIM. L. & CRIMINOLOGY 717 (1996). 30. Data from the Annual Survey of State and Local Government Finances indicates that the share of total expenditures for most line items in the budget remains fairly constant over time, suggesting little direct crowding out. For example, between 1973 and 2008, higher education’s share of the narrow definition of discretionary spending hovered at around 36% per year every year (even as corrections’ share rose from 5% to 10%). Of course, at some level there was crowding out, since other line items could have grown more quickly had corrections’ share declined. But these sorts of more-indirect costs are likely less politically salient. 31. See Ball, supra note 29.
21
Pfaff: The Micro and Macro Causes of Prison Growth
Published by Reading Room, 2012

1258 GEORGIA STATE UNIVERSITY LAW REVIEW [Vol. 28:4
defined local expenditures given over to corrections and to “judicial” expenditures, which include funding for prosecutors’ offices (as well as for public defenders, the courts, and other judicial expenses).32
As with the states, local correctional spending has been relatively flat since the crime decline began—and judicial spending has even declined. Moreover, both correctional and judicial spending constitute relatively small shares of overall expenditures. It is unclear, however, whether that means local governments are willing to take on more spending in these areas: the trends in Figure 10B suggest that these governments have not been eager to approve such spending, and the reports of deep across-the-board cuts in local government spending point to a general lack of local fiscal capacity.
Though quite tentative due to limitations in the data, these results suggest that the current crisis could lead to real cuts in prison population size. That, however, begs the question: what will happen when the economy inevitably recovers? Will prison and jail populations again resume their upward trajectory, or will they stay flat? To shed some light on this question, we need to turn away from finances and towards politics. Prison populations do not necessarily rise even as state fiscal capacity expands: both expenditures and crime rose between 1960 and the mid-1970s without any increase in prison populations. “Something” changed in the 1970s, and so in the next section I look at several theories about what that “something” was, and I consider what light these theories can shed on possible future trends.
32. The results here start in 1985 due to limitations in the data.
22
Georgia State University Law Review, Vol. 28, Iss. 4 [2012], Art. 9
https://readingroom.law.gsu.edu/gsulr/vol28/iss4/9
2012] MICRO AND MACRO CAUSES OF PRISON GROWTH 1259
500
100
01
500
200
02
500
1950 1960 1970 1980 1990 2000 2010Year
Revenues Expenditures
Data from the Annual Survey of State and Local Government Finances.
1952 - 2008Fig. 10A: Real Per Cap. Local Revenue and Expenditure
.02
4.0
26
.02
8.0
3.0
32
.03
4
1985 1990 1995 2000 2005 2010Year
Correction Judicial
Data from the Annual Survey of State and Local Government Finances.
1985 - 2008Fig. 10B: Corrections' and Judicial's Shares of the Budget
23
Pfaff: The Micro and Macro Causes of Prison Growth
Published by Reading Room, 2012

1260 GEORGIA STATE UNIVERSITY LAW REVIEW [Vol. 28:4
2.2 Changing Political Conditions
Many academics have tied the prison population boom to political changes that began in the 1960s and 1970s. I start this section by discussing several theories that look at general political shifts, and I conclude by briefly evaluating the more specific claim that increased punitiveness is a partial reaction against the civil rights movement.
2.2.1 General Political Shifts
Perhaps the most ambitious general theory is that developed by David Garland in his book The Culture of Control.33 Simplifying somewhat, Garland argues that a wave of cultural and economic shocks during the 1960s and 1970s—the oil crisis, the decline of industrialization, changing gender roles, the civil rights movement—led citizens in the United States (and the United Kingdom) to fundamentally rethink the proper goal of government. Voters lost faith in the government’s ability to provide for them via the welfare state, and instead asked the state to protect them from outside threats, crime in particular. This political reordering privileged retributivism and incapacitation over rehabilitation, and populist policies over more technocratic ones.
Another theory, advanced by Theodore Caplow and Jonathan Simon, suggests that politicians focused more on crime starting in the 1970s due to the rise of “identity politics.”34 Issues such as abortion and civil rights are polarizing topics that provide little room for compromise, and thus little room for politicians to draw voters away from their opponents. But there was a strong national consensus about the need to be “tough on crime,” so politicians used the issue to try to poach voters from the other party. There is some quantitative support for Caplow and Simon’s theory. One paper, for example, has demonstrated that a state’s prison admission rate appears to rise as
33. See generally DAVID GARLAND, THE CULTURE OF CONTROL (2002); see also Michael Tonry, Rethinking Unthinkable Punishment Policies in America, 46 UCLA L. REV. 1781 (1999); BERT USEEM
& ANNE PIEHL, PRISON STATE (2008), provide examples of other authors making similar points. 34. Theodore Caplow & Jonathan Simon, Understanding Prison Policy and Population Trends, in PRISONS 63, 71 (Michael Tonry & Joan Petersilia eds., 1999).
24
Georgia State University Law Review, Vol. 28, Iss. 4 [2012], Art. 9
https://readingroom.law.gsu.edu/gsulr/vol28/iss4/9

2012] MICRO AND MACRO CAUSES OF PRISON GROWTH 1261
the majority party’s control of the legislature becomes more uncertain.35 This is consistent with politicians choosing to deploy “tough on crime” policies to attract voters in contested elections.
Katherine Beckett has put forth a more cynical argument, namely that politicians stoke people’s fear of crime to scare them into voting for them—tough-on-crime rhetoric is less a response to the public’s genuine fear of crime but rather an attempt to make the public fear crime in the first place.36 Her evidence for this is survey data suggesting the public’s fear of crime lags politicians’ rhetoric about it instead of leading it.37
A common theme ties these theories together. Whether due to the public’s loss of faith in the government, to polarizing political issues taking on increased importance, or to efforts to literally “scare up” votes, these theories argue that by the 1970s politicians had begun to devote increasing attention to criminal justice issues. There is no doubt that each of these theories has some merit.38 But it is worth asking whether these theories remain compelling today.
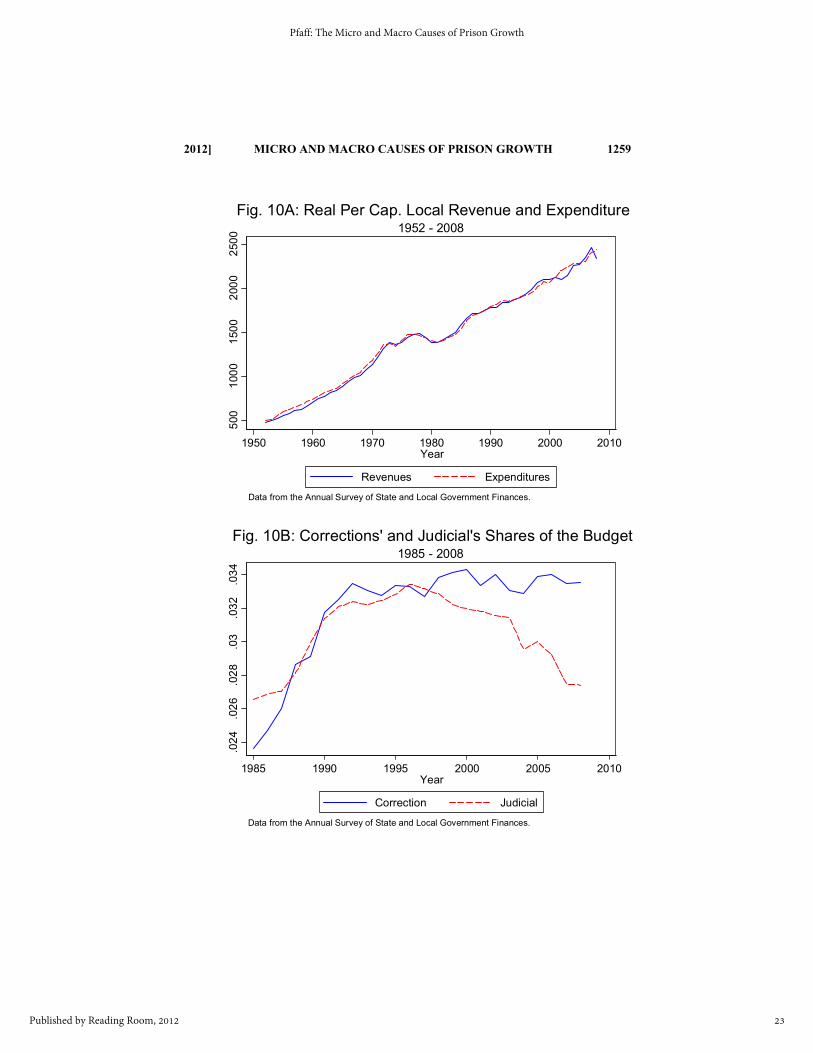
A key limitation to all these theories is that they pay too little attention to the spike in crime that started in the early 1960s. Although concurrent with broad social changes, the dramatic rise in crime between 1960 and 1991, shown in Figure 4 above, surely influenced people’s views about the proper role of government. In fact, Figure 4 may understate why crime became so politically salient. Figure 11 plots what I will call the “effective” incarceration rate: not the number of prisoners per 100,000 people, but the number of prisoners per 1,000 violent and per 1,000 property crimes.39
35. Thomas D. Stucky, Karen Heimer & Joseph B. Lang, Partisan Politics, Electoral Competition and Imprisonment: An Analysis of States Over Time, 43 CRIMINOLOGY 211 (2005). 36. KATHERINE BECKETT, MAKING CRIME PAY 23 (1997). 37. USEEM & PIEHL, supra note 33 point to some limitations in the survey evidence on which Beckett relies. 38. For more in-depth summaries and critiques of the political theories, please see Pfaff, supra note 14, and USEEM & PIEHL, supra note 33. 39. See USEEM & PIEHL, supra note 33, at 22 fig.2.2.
25
Pfaff: The Micro and Macro Causes of Prison Growth
Published by Reading Room, 2012
1262 GEORGIA STATE UNIVERSITY LAW REVIEW [Vol. 28:4
Figure 11 demonstrates that the effective incarceration rate
actually declined at the start of the crime boom and then remained flat into the early 1980s. Such an apparent “failure” of the criminal justice system likely amplified whatever concerns the crime wave was producing on its own. It thus seems unlikely that the punitive “turn” occurred independently of the crime boom, which then suggests that the “politics of crime” of the high-crime 1970s may be qualitatively different than those of the low-crime 2010s.40
And, at least at the national level, there is some anecdotal evidence consistent with this claim. Crime policy has not played an important role in the past several Presidential or Congressional elections. And it is worth noting that during the 2011-12 Republican Presidential primary race, no candidate opposing Newt Gingrich’s bid for the party’s nomination raised the fact that he helped establish Right on
40. Spelman, supra note 25, at 31 makes a similar point about the central importance of the crime boom.
050
100
150
200
Pro
pert
y C
rime
200
400
600
800
1000
1200
Vio
lent
Crim
e
1960 1970 1980 1990 2000 2010Year
Violent Crime Property Crime
Data from the Uniform Crime Reports and the National Prisoner Statistics
1960 - 2008Fig. 11: Incarceration per 1,000 Crimes
26
Georgia State University Law Review, Vol. 28, Iss. 4 [2012], Art. 9
https://readingroom.law.gsu.edu/gsulr/vol28/iss4/9

2012] MICRO AND MACRO CAUSES OF PRISON GROWTH 1263
Crime, a conservative group committed to reducing prison populations.41
Unfortunately, our understanding of local-level politics is much weaker. To start, the interest groups that are powerful at the state level are not necessarily the same as those that are powerful at the federal level;42 there are surely state/local differences as well, but these are even harder to uncover. Moreover, state and local politicians often face different electoral pressures. State legislative elections, for example, are often much less contested than those for Congress,43 and local elections may be less contested still. Given the evidence about the link between punitiveness and electoral vulnerability, differences in contestation may be important. County-level actors could be subject to similar political pressures or cultures as state- and national-level actors, and it certainly would be surprising if there were no correlation at all. But to the extent county officials are driving prison growth, we need a richer understanding of the particular political environments in which they operate.
That said, these theories may still provide some insight into how local politicians may behave in the years ahead, and what policies may be more or less viable. For example, many reforms put forth these days are more technocratic in nature: actuarial risk scales, diversion courts, various forms of technocorrections. If these programs are scaled up too quickly, or implemented poorly, they could engender significant pushback. A public whose views are still more “protect from” than “provide for” may not have a great tolerance for technocratic error—although that tolerance may be greater in periods, like today, of lower crime.
41. The list of those who support Right on Crime’s efforts reflects a wide array of prominent Republican and conservative politicians and activists. See Statement of Principles, RIGHT ON CRIME, http://www.rightoncrime.com/the-conservative-case-for-reform/statement-of-principles/ (last visited Mar. 2, 2012). 42. See, for example, the list of state interest groups given in Clive S. Thomas & Ronald J. Hrebenar, Interest Groups in the States, in POLITICS IN THE AMERICAN STATES Table 100, 119 tbl.4.1 (Virginia Gray & Russell L. Hanson eds., 2004). 43. Between 1988 and 1996, the fraction of Congressional elections that were uncontested fell from almost 20% to 5%, while the fraction of uncontested state legislative seats remained stable around 35%. See Peverill Squire, Uncontested Seats in State Legislative Elections, 25 LEGIS. STUDIES Q. 131, 133 (2000).
27
Pfaff: The Micro and Macro Causes of Prison Growth
Published by Reading Room, 2012
1264 GEORGIA STATE UNIVERSITY LAW REVIEW [Vol. 28:4
More generally, the decline in crime suggests that crime is less salient these days, whether as a tool for reaching out to voters from the other party (as Caplow and Simon suggest) or as a means of playing on people’s fears (as Beckett argues). Furthermore, the current political focus on economic issues likely reduces the salience of crime as well. This implies that politicians have room to experiment now that they did not have even a few years ago. Yet the work of Garland, Beckett, Caplow and Simon and others cautions against taking too many risks: if crime starts to rise again, its political salience may very well return.44
2.2.2 Punishment and Civil Rights
A more specific branch of the political theory considers the extent to which some people have tried to use the criminal justice system to roll back gains that minorities made via the civil rights movement.45 Some, like Michelle Alexander, argue that arrests, incarceration, and post-release collateral restrictions are used as a form of political repression. Others, like Michael Tonry, make a more indirect claim, that the collateral costs of incarceration are politically tolerable because they fall disproportionately on minorities. Politicians thus reap the benefits of appearing tough on crime without facing the full political costs of their actions.
It is clear that race and punishment interact in troubling ways. Blacks make up approximately 12% of the US population, but by the late 2000s they comprised 28.3% of all arrests, 38% of all those convicted of felonies, and 38% of all prisoners.46 And even though
44. Figure 11 highlights one particularly important component to this risk. While crime is lower than it has been in decades, both the violent and property crimes rates in 2010 are still twice as high as they were in 1960. Older Americans who lived during the periods of lower crime are particularly likely to remain sensitive to crime-control concerns. 45. See BECKETT, supra note 43; MICHELLE ALEXANDER, THE NEW JIM CROW (2010); MICHAEL
TONRY, MALIGN NEGLECT (1995). A good overview of this literature is given in James Forman Jr., Racial Critiques of Mass Incarceration Beyond the New Jim Crow, 87 N.Y.U. L. REV. (forthcoming 2012), available at http://papers.ssrn.com/sol3/papers.cfm?abstract_id=1966018. 46. For the population data, see U.S. BUREAU OF THE CENSUS, STATISTICAL ABSTRACT OF THE
UNITED STATES 2012, at tbl.695 (2012); for the data on arrests, convictions, and prison populations, see SOURCEBOOK OF CRIMINAL JUSTICE STATISTICS tbls.4.10, 5.45, & 6.33 (Kathleen Maguire ed., 2012). All data are from 2008 except for convictions, which are from 2006.
28
Georgia State University Law Review, Vol. 28, Iss. 4 [2012], Art. 9
https://readingroom.law.gsu.edu/gsulr/vol28/iss4/9
2012] MICRO AND MACRO CAUSES OF PRISON GROWTH 1265
blacks are overrepresented among poorer Americans, these disparities—at least for convictions and incarceration—cannot be explained by class effects alone, since only 23.5% of American families earning under $20,000 self-identified as black.47 Moreover, it is undeniable that a sizeable number of whites resent the advances that blacks have made in recent decades, and Beckett and others provide evidence of tough-on-crime rhetoric being used to signal resistance to the Civil Rights movement.48
Yet the connection between this resistance and prison growth is difficult to untangle. In this section I want to touch on just two of the leading concerns.49 First, some of the disparity in punishment reflects disparities in offending—although some of the racial differences in offending could themselves be the product of earlier (racial) differences in punishment. Second, drug offenses, which are the offenses over which police and prosecutors have the most discretion and which thus have been the focus of much of the writing on this topic, simply have not contributed that significantly to prison growth, at least not directly.
Start with offense differentials. Some of the racial disparities in arrests, convictions, and incarcerations reflect underlying racial differences in offending. Blacks engage in higher levels of violent and property crimes, so a race-blind system would still arrest and convict blacks at a rate greater than their share of the population. For a particularly striking example, Figure 12 plots the murder rates for white and black males aged 18 to 24; since most murders are intraracial, racial differences in victimization correlate to racial differences in offending.50 Throughout the sample period, the
47. U.S. BUREAU OF THE CENSUS, supra note 46, at tbl.695. 48. BECKETT, supra note 36, at 31–32. Randall Kennedy has similarly written that a tough-on-crime position is often a “thinly veiled code” for expressing opposition to social change in general and civil rights advances in particular. RANDALL KENNEDY, RACE, CRIME, AND THE LAW 4 (1997). And James Unnever and Francis Cullen use data from the 2000 National Election Study to demonstrate that racial animus appears to play an important role in shaping punitive attitudes towards crime. James D. Unnever & Francis T. Cullen, The Social Sources of Americans’ Punitiveness: A Test of Three Competing Models, 48 CRIMINOLOGY 99, 119 (2010). 49. Forman, supra note 45, provides a good summary of these and other criticism of the “New Jim Crow” hypothesis. 50. Approximately 93% of all black murders were intraracial crimes. See ALEXIA COOPER & ERICA
29
Pfaff: The Micro and Macro Causes of Prison Growth
Published by Reading Room, 2012

1266 GEORGIA STATE UNIVERSITY LAW REVIEW [Vol. 28:4
homicide rate for young black men was nearly ten times that for young white men. More generally, between 1980 and 2008, blacks made up 47% of all murder victims and 52% of all murderers.51
Similar patterns hold across other offenses. According to the 2008 National Crime Victimization Survey, blacks were disproportionately likely to be the victims of violent and property crime. For violent crimes, their victimization rate was 25.9 per 1,000 households, compared to 18.1 per 1,000 for whites; for property crimes, a rate of 158, compared to 130.2 for whites.52 And blacks are similarly overrepresented among violent offenders: victims report that 22.8% of their attackers were black—which is actually not that far off from the overall arrest rate of 28.3%.53 Thus at least some of the racial disparity in the criminal justice system is due to differences in offending, and thus also victimization, rates.54
L. SMITH, HOMICIDE TRENDS IN THE UNITED STATES, 1980–2008, at 13 (2011). 51. Id. at 12. 52. US DEP’T OF JUSTICE, CRIMINAL VICTIMIZATION IN THE UNITED STATES, 2008 STATISTICAL
TABLES, tbls.5 & 16 (2010). 53. Id. at tbl.40. Henry Ruth and Kevin Reitz suggest that the punishment disparities for significant violent crimes—homicide, rape, robbery, serious assault—are roughly in keeping with disparities in offending; the imprisonment disparities for lesser offenses do not track offending differences nearly as closely. See HENRY RUTH & KEVIN REITZ, THE CHALLENGE OF CRIME 35 (2003). That a majority of all prisoners (52.4% overall and 54.1% of black prisoners) are in prison for violent crimes suggests that differentials in serious offending do play an important role in explaining differences in incarceration rates. For the incarceration data, see SOURCEBOOK OF CRIMINAL JUSTICE STATISTICS, supra note 46, at tbl.6.0001. 54. None of this discussion should be read as downplaying an important feedback loop between punishment and offending. Conviction and incarceration often bring with them significant collateral consequences: restrictions on housing, welfare benefits, employment options, and so on. And these limitations could themselves contribute to future offending—and thus to the racial disparity in offending. The criminal justice system is thus responding to offending differentials that it has helped to create, or at least magnify.
30
Georgia State University Law Review, Vol. 28, Iss. 4 [2012], Art. 9
https://readingroom.law.gsu.edu/gsulr/vol28/iss4/9

2012] MICRO AND MACRO CAUSES OF PRISON GROWTH 1267
Unlike violent and property offenses, however, drug offenses
provide much more room for discretionary responses, which is why many advocates of the anti-Civil Rights hypothesis focus on them. Their motivation is clear. Data indicate that blacks and whites use drugs at roughly similar rates, yet in 2006 blacks comprised 35% of all drug arrests, 44% of all drug convictions, and 45% of all prisoners serving time for drug convictions; note, though, that dealing is more likely to result in incarceration than using, and racial breakdowns on dealing are harder to come by.55 Moreover, the police have the ability to concentrate or distribute the racial impact of drug enforcement. Tracey Meares and Dan Kahan, for example, have argued that reverse stings, which would focus on buyers rather than sellers, would have less-concentrated racial effects while still being as effective as the current supply-side approaches.56 55. ALEXANDER, supra note 45, at 97 n.10, provides a good list of sources concerning drug use. For the arrest, conviction, and incarceration data, see SOURCEBOOK OF CRIMINAL JUSTICE STATISTICS, supra note 46, at tbls.4.10, 5.45, & 6.0001, respectively. Although more recent data are available for arrests and incarceration, 2006 is the last year for which there is conviction data. 56. Tracey L. Meares & Dan M. Kahan, Law and (Norms of) Order in the Inner City, 32 L. & SOC’Y
REV. 805, 816–19 (1998).
050
100
150
200
1980 1990 2000 2010Year
Blacks Whites
Data from the National Crime Victimization Survey
1980 - 2008Fig. 12: Homicide Rates, Males 18 - 24
31
Pfaff: The Micro and Macro Causes of Prison Growth
Published by Reading Room, 2012
1268 GEORGIA STATE UNIVERSITY LAW REVIEW [Vol. 28:4
And it could very well be that the heavy reliance on supply-side enforcement is either motivated by, or tolerated because of, some degree of racial animus.57 Yet even if true, this does not imply that the war on drugs has played a direct, major role in prison growth. Figure 13 plots the share of state prisoners whose primary convictions are drug violations. The run-up between 1980 and 1990 is dramatic, but after peaking at around 22% in 1990, the share has declined to about 18% today.58 Even if we released every offender currently serving time for a drug conviction, the US prison population would remain above 1 million, and the racial composition of its prisons would not shift much.59 The police arrest a lot of people for drugs—over 1.3 million in 2008, or approximately 12% of the 10.6 million total arrests made—but only a fraction of those arrests result in incarceration.
57. Reality is, of course, somewhat more complicated. As Forman, supra note 45, at 115 points out, black political groups often lobbied for tougher drug laws and more rigorous drug enforcement, since the communities that incurred the costs of the government’s war on drugs were also the ones that suffered the most from the various harms drugs and drug markets cause. 58. The federal system is a notorious outlier: in 2011, 50.7% of its prisoners were serving time for drug charges. See SOURCEBOOK OF CRIMINAL JUSTICE STATISTICS, supra note 46, at tbl.6.0023.2011. This reflects the limited scope of federal criminal jurisdiction. Since the federal system holds only about 13% of all prisoners, its disproportionate focus on drug offenses does not significantly alter the national picture. 59. Using 2008 data, the population would fall from 1.4 million to 1.1 million, and the percent of prisoners who are black would decline from 38% to 36%.
32
Georgia State University Law Review, Vol. 28, Iss. 4 [2012], Art. 9
https://readingroom.law.gsu.edu/gsulr/vol28/iss4/9

2012] MICRO AND MACRO CAUSES OF PRISON GROWTH 1269
There is, however, an indirect way that the war on drugs could still
matter, perhaps importantly. It is hard to estimate how many offenders in prison for violent or property crimes would have received at most probation had it not been for their prior records—and many of their priors could be for drug arrests that on their own did not result in incarceration. These inmates do not count as “drug offenders” in prison data, but they are in prison (or are in prison for longer) because of their prior drug arrests. In this way, the war on drugs could play an important role in driving prison growth, and perhaps in a way that exacerbates underlying racial differences. But it is hard if not impossible to detect this effect with currently-available data.
Finally, it is important to again return our focus to local actors. Consider, for example, the following two facts: New York State adopted its draconian Rockefeller Drug Laws in 1973, but as of the early 1980s only 5% of its inmates were serving time for drug offenses, a percent that would rise to over 30% by 1991.60 Just
60. The data are from the New York State Department of Corrections.
.05
.1.1
5.2
.25
Per
cent
1980 1990 2000 2010Year
Data from the National Prisoner Survey
1980 - 2008Fig. 13: Drug Offenses as Percent of Prison Population
33
Pfaff: The Micro and Macro Causes of Prison Growth
Published by Reading Room, 2012
1270 GEORGIA STATE UNIVERSITY LAW REVIEW [Vol. 28:4
because state-level politicians had passed a punitive law did not mean that local officials immediately used it. And given that counties are more racially homogenous than states, the racial perceptions of county-level actors—and thus their motivations—may differ systematically from those at the state level.
Regardless, when it comes to prison growth there is an even easier claim: whatever the racial motivations of county officials, increases in drug incarcerations explain only a fraction of prison growth, so any reduction in drug commitments will have only a moderate effect on prison population size. Changes in arrests and convictions, however, may matter more.
CONCLUSION
Those who wish to rein in prison growth in the United Stated need to answer two questions: who is responsible for the growth, and why are they acting the way they are? I argue here that we have a good idea of the answer to the first question but only a weak understanding of that for the second. With regards to “who,” the answer appears to be prosecutors, at least since the crime drop began in the early 1990s. Crime has been falling, arrests per crime have been relatively flat (with a slight rise in the 2000s due to drug arrests), admissions per felony filing have not budged, and time served has been relatively stable. But felony filings per arrest have soared during the 1990s and 2000s.
The “why” question is much harder. If nothing else, almost all research on the causes of increased incarceration have focused on federal- or state-level actors. But prosecutors are county officials, and they may be subject to different pressures; if nothing else, state-level analyses cannot capture the moral hazard problem of county-level officials using state-level resources. It does appear, however, that expanding state fiscal capacity has played some role in the growth during the 1990s and 2000s. And while political shifts likely contributed to the growth as well, it appears that the “politics of crime” are changing again in response to sustained low crime rates,
34
Georgia State University Law Review, Vol. 28, Iss. 4 [2012], Art. 9
https://readingroom.law.gsu.edu/gsulr/vol28/iss4/9

2012] MICRO AND MACRO CAUSES OF PRISON GROWTH 1271
and that local actors are subject to qualitatively different political forces than the state- and national-level politicians who have been the subject of most research. Beyond crime and resources, however, the “why” picture remains particularly unclear, especially now that we know who is most responsible.
35
Pfaff: The Micro and Macro Causes of Prison Growth
Published by Reading Room, 2012

1272 GEORGIA STATE UNIVERSITY LAW REVIEW [Vol. 28:4
36
Georgia State University Law Review, Vol. 28, Iss. 4 [2012], Art. 9
https://readingroom.law.gsu.edu/gsulr/vol28/iss4/9