The mice Package - uni-bayreuth.deftp.uni-bayreuth.de/math/statlib/R/CRAN/doc/packages/mice.pdf ·...
31
The mice Package June 25, 2007 Version 1.16 Date 2007-06-25 Title Multivariate Imputation by Chained Equations Author S. Van Buuren & C.G.M. Oudshoorn Maintainer Roel de Jong <[email protected]> Depends MASS, nnet Description Multivariate Imputation by Chained Equations License GPL (version 2) URL http://web.inter.nl.net/users/S.van.Buuren/mi/hmtl/mice.htm R topics documented: complete ........................................... 2 glm.mids .......................................... 3 lm.mids ........................................... 5 md.pattern .......................................... 6 mice.internal ........................................ 7 mice ............................................. 8 mice.impute.lda ....................................... 11 mice.impute.logreg ..................................... 12 mice.impute.logreg2 .................................... 13 mice.impute.mean ...................................... 15 mice.impute.norm ...................................... 16 mice.impute.norm.improper ................................ 17 mice.impute.passive ..................................... 18 mice.impute.pmm ...................................... 19 mice.impute.polyreg .................................... 20 mice.impute.sample ..................................... 21 mice.mids .......................................... 22 mids ............................................. 23 1
Transcript of The mice Package - uni-bayreuth.deftp.uni-bayreuth.de/math/statlib/R/CRAN/doc/packages/mice.pdf ·...
The mice PackageJune 25, 2007
Version 1.16
Date 2007-06-25
Title Multivariate Imputation by Chained Equations
Author S. Van Buuren & C.G.M. Oudshoorn
Maintainer Roel de Jong <[email protected]>
Depends MASS, nnet
Description Multivariate Imputation by Chained Equations
License GPL (version 2)
URL http://web.inter.nl.net/users/S.van.Buuren/mi/hmtl/mice.htm
R topics documented:complete . . . . . . . . . . . . . . . . . . . . . . . . . . . . . . . . . . . . . . . . . . . 2glm.mids . . . . . . . . . . . . . . . . . . . . . . . . . . . . . . . . . . . . . . . . . . 3lm.mids . . . . . . . . . . . . . . . . . . . . . . . . . . . . . . . . . . . . . . . . . . . 5md.pattern . . . . . . . . . . . . . . . . . . . . . . . . . . . . . . . . . . . . . . . . . . 6mice.internal . . . . . . . . . . . . . . . . . . . . . . . . . . . . . . . . . . . . . . . . 7mice . . . . . . . . . . . . . . . . . . . . . . . . . . . . . . . . . . . . . . . . . . . . . 8mice.impute.lda . . . . . . . . . . . . . . . . . . . . . . . . . . . . . . . . . . . . . . . 11mice.impute.logreg . . . . . . . . . . . . . . . . . . . . . . . . . . . . . . . . . . . . . 12mice.impute.logreg2 . . . . . . . . . . . . . . . . . . . . . . . . . . . . . . . . . . . . 13mice.impute.mean . . . . . . . . . . . . . . . . . . . . . . . . . . . . . . . . . . . . . . 15mice.impute.norm . . . . . . . . . . . . . . . . . . . . . . . . . . . . . . . . . . . . . . 16mice.impute.norm.improper . . . . . . . . . . . . . . . . . . . . . . . . . . . . . . . . 17mice.impute.passive . . . . . . . . . . . . . . . . . . . . . . . . . . . . . . . . . . . . . 18mice.impute.pmm . . . . . . . . . . . . . . . . . . . . . . . . . . . . . . . . . . . . . . 19mice.impute.polyreg . . . . . . . . . . . . . . . . . . . . . . . . . . . . . . . . . . . . 20mice.impute.sample . . . . . . . . . . . . . . . . . . . . . . . . . . . . . . . . . . . . . 21mice.mids . . . . . . . . . . . . . . . . . . . . . . . . . . . . . . . . . . . . . . . . . . 22mids . . . . . . . . . . . . . . . . . . . . . . . . . . . . . . . . . . . . . . . . . . . . . 23
1

2 complete
mipo . . . . . . . . . . . . . . . . . . . . . . . . . . . . . . . . . . . . . . . . . . . . . 25mira . . . . . . . . . . . . . . . . . . . . . . . . . . . . . . . . . . . . . . . . . . . . . 26nhanes . . . . . . . . . . . . . . . . . . . . . . . . . . . . . . . . . . . . . . . . . . . . 27nhanes2 . . . . . . . . . . . . . . . . . . . . . . . . . . . . . . . . . . . . . . . . . . . 27pool . . . . . . . . . . . . . . . . . . . . . . . . . . . . . . . . . . . . . . . . . . . . . 28
Index 30
complete Produces Imputed Flat Files from Multiply Imputed Data Set (mids)
Description
Takes an object of type mids, fills in the missing data, and returns the completed data in a specifiedformat.
Usage
complete(x, action=1)
Arguments
x An object of class ’mids’ (created by the function mice()).
action If action is a scalar between 1 and x$m, the function returns the data withthe action’s imputation filled in. Thus, action=1 returns the first completeddata set. The can also be one of the following strings: "long", "broad","repeated". This has the following meaning:
action="long" produces a long matrix with n*m rows,containing all im-puted data plus two additional variables "_ID_" (containing the row.names)and "_IMP_" (containing the imputation number).
action="broad" produces a broad matrix with m times the number of columnsin the original data. The first ncol(x$data) columns contain the first im-puted data matrix. Column names are changed to reflect the imputationnumber.
action="repeated" produces a broad matrix with m times ncol(x$data)columns. The first m columns give the filled-in first variable. Columnnames are changed to reflect the imputation number.
Value
A data frame with the imputed values filled in.
Author(s)
Stef van Buuren, Karin Oudshoorn, 2000
glm.mids 3
References
Van Buuren, S. & Oudshoorn, C.G.M. (2000). Multivariate Imputation by Chained Equations:MICE V1.0 User’s manual. Report PG/VGZ/00.038, TNO Prevention and Health, Leiden.
See Also
mice, mids
Examples
data(nhanes)imp <- mice(nhanes) # do default multiple imputation on a numeric matrixmat <- complete(imp) # fills in the first imputationmat <- complete(imp, 3) # fills in the third imputationmat <- complete(imp, "long") # produces a long matrix with stacked complete datamat <- complete(imp, "b") # a broad matrixcor(mat) # for numeric mat, produces a blocked correlation matrix, where
# each m*m block contains of the same variable pair over different# multiple imputations.
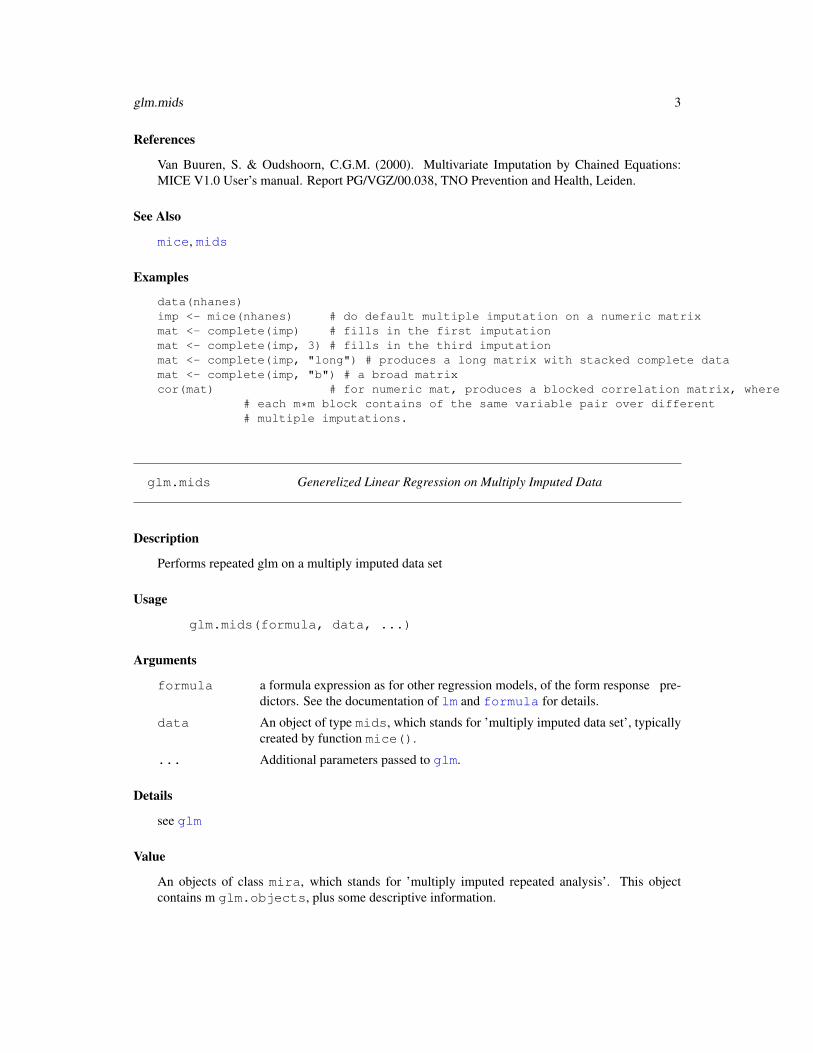
glm.mids Generelized Linear Regression on Multiply Imputed Data
Description
Performs repeated glm on a multiply imputed data set
Usage
glm.mids(formula, data, ...)
Arguments
formula a formula expression as for other regression models, of the form response pre-dictors. See the documentation of lm and formula for details.
data An object of type mids, which stands for ’multiply imputed data set’, typicallycreated by function mice().
... Additional parameters passed to glm.
Details
see glm
Value
An objects of class mira, which stands for ’multiply imputed repeated analysis’. This objectcontains m glm.objects, plus some descriptive information.

4 glm.mids
Author(s)
Stef van Buuren, Karin Oudshoorn, 2000
References
Van Buuren, S. & Oudshoorn, C.G.M. (2000). Multivariate Imputation by Chained Equations:MICE V1.0 User’s manual. Report PG/VGZ/00.038, TNO Prevention and Health, Leiden.
See Also
glm, mids, mira
Examples
data(nhanes)imp <- mice(nhanes) # do default multiple imputation on a numeric matrixglm.mids((hyp==2)~bmi+chl,data=imp)
# fit# $call:# glm.mids(formula = (hyp == 2) ~ bmi + chl, data = imp)## $call1:# mice(data = nhanes)## $nmis:# age bmi hyp chl# 0 9 8 10## $analyses:# $analyses[[1]]:# Call:# glm(formula = formula, data = data.i)## Coefficients:# (Intercept) bmi chl# -0.4746337 -0.01565534 0.005417846## Degrees of Freedom: 25 Total; 22 Residual# Residual Deviance: 2.323886## $analyses[[2]]:# Call:# glm(formula = formula, data = data.i)## Coefficients:# (Intercept) bmi chl# -0.1184695 -0.02885779 0.006090282## Degrees of Freedom: 25 Total; 22 Residual# Residual Deviance: 3.647927## $analyses[[3]]:

lm.mids 5
# Call:# glm(formula = formula, data = data.i)## Coefficients:# (Intercept) bmi chl# -0.1503616 -0.003002851 0.002130091## Degrees of Freedom: 25 Total; 22 Residual# Residual Deviance: 3.799126## $analyses[[4]]:# Call:# glm(formula = formula, data = data.i)## Coefficients:# (Intercept) bmi chl# 0.009442083 -0.0237619 0.004631881## Degrees of Freedom: 25 Total; 22 Residual# Residual Deviance: 3.874522## $analyses[[5]]:# Call:# glm(formula = formula, data = data.i)## Coefficients:# (Intercept) bmi chl# 0.09932161 -0.02168292 0.003857599## Degrees of Freedom: 25 Total; 22 Residual# Residual Deviance: 4.025066### >#
lm.mids Linear Regression on Multiply Imputed Data
Description
Performs repeated linear regression on multiply imputed data set
Usage
lm.mids(formula, data, ...)
6 md.pattern
Arguments
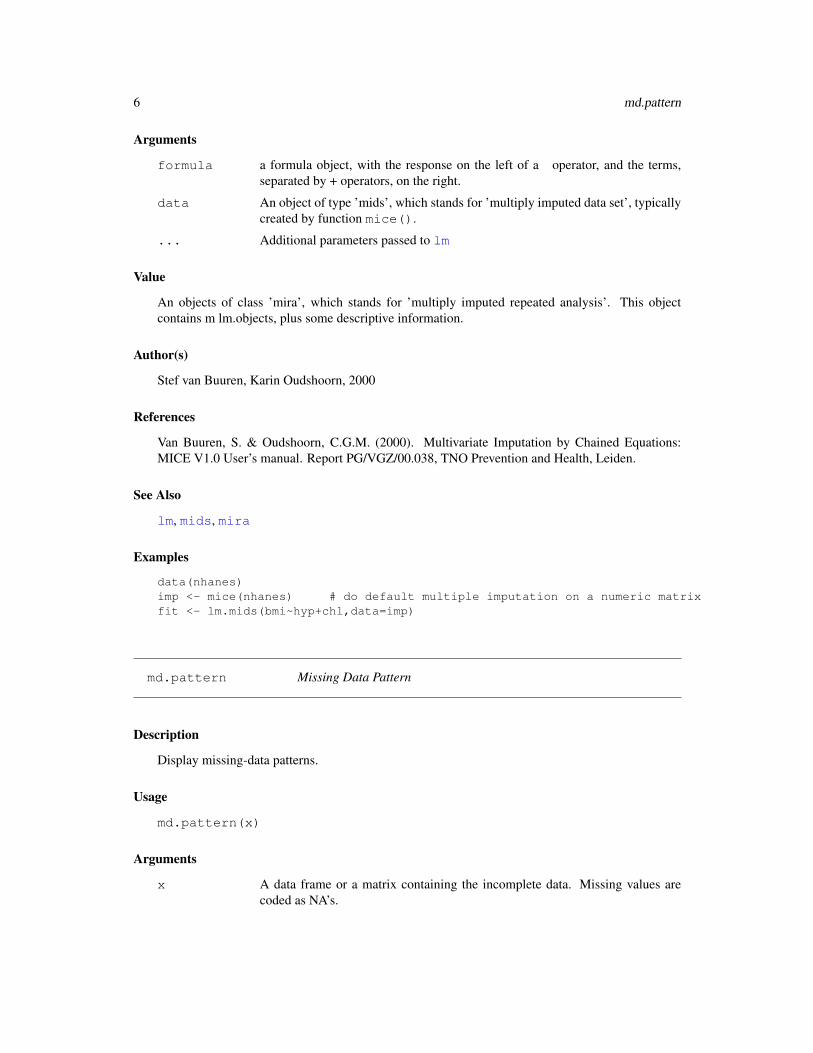
formula a formula object, with the response on the left of a operator, and the terms,separated by + operators, on the right.
data An object of type ’mids’, which stands for ’multiply imputed data set’, typicallycreated by function mice().
... Additional parameters passed to lm
Value
An objects of class ’mira’, which stands for ’multiply imputed repeated analysis’. This objectcontains m lm.objects, plus some descriptive information.
Author(s)
Stef van Buuren, Karin Oudshoorn, 2000
References
Van Buuren, S. & Oudshoorn, C.G.M. (2000). Multivariate Imputation by Chained Equations:MICE V1.0 User’s manual. Report PG/VGZ/00.038, TNO Prevention and Health, Leiden.
See Also
lm, mids, mira
Examples
data(nhanes)imp <- mice(nhanes) # do default multiple imputation on a numeric matrixfit <- lm.mids(bmi~hyp+chl,data=imp)
md.pattern Missing Data Pattern
Description
Display missing-data patterns.
Usage
md.pattern(x)
Arguments
x A data frame or a matrix containing the incomplete data. Missing values arecoded as NA’s.
mice.internal 7
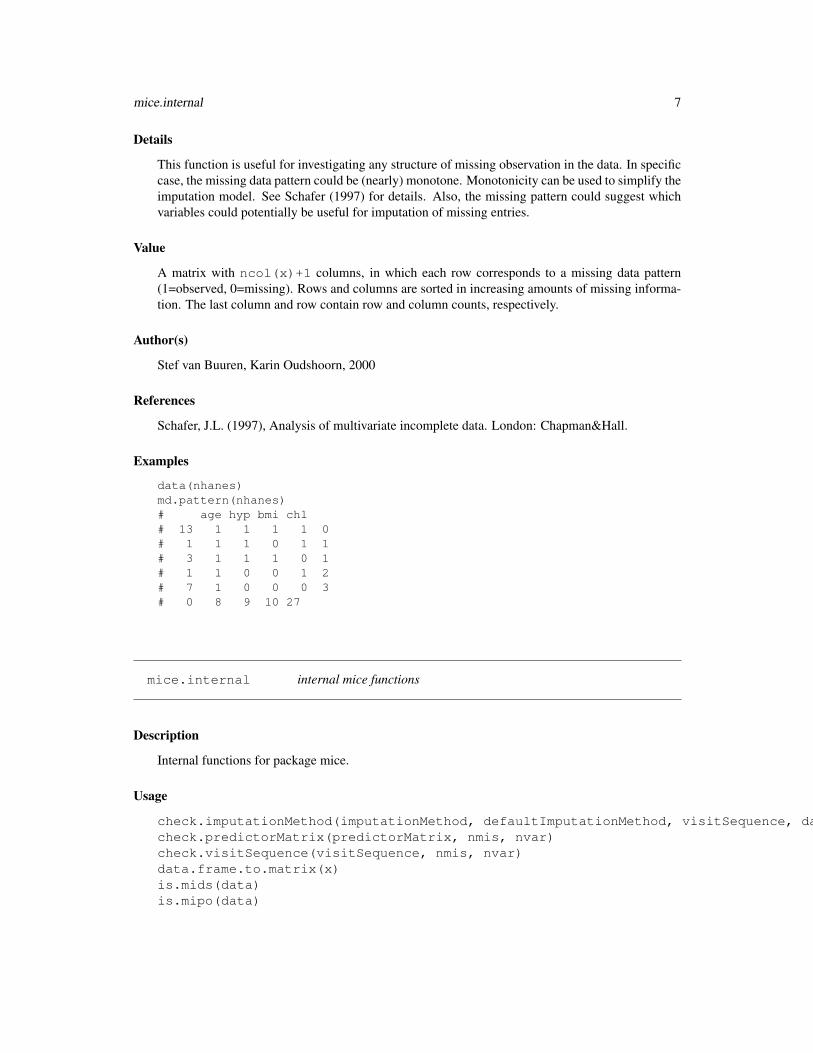
Details
This function is useful for investigating any structure of missing observation in the data. In specificcase, the missing data pattern could be (nearly) monotone. Monotonicity can be used to simplify theimputation model. See Schafer (1997) for details. Also, the missing pattern could suggest whichvariables could potentially be useful for imputation of missing entries.
Value
A matrix with ncol(x)+1 columns, in which each row corresponds to a missing data pattern(1=observed, 0=missing). Rows and columns are sorted in increasing amounts of missing informa-tion. The last column and row contain row and column counts, respectively.
Author(s)
Stef van Buuren, Karin Oudshoorn, 2000
References
Schafer, J.L. (1997), Analysis of multivariate incomplete data. London: Chapman&Hall.
Examples
data(nhanes)md.pattern(nhanes)# age hyp bmi chl# 13 1 1 1 1 0# 1 1 1 0 1 1# 3 1 1 1 0 1# 1 1 0 0 1 2# 7 1 0 0 0 3# 0 8 9 10 27
mice.internal internal mice functions
Description
Internal functions for package mice.
Usage
check.imputationMethod(imputationMethod, defaultImputationMethod, visitSequence, data, nmis, nvar)check.predictorMatrix(predictorMatrix, nmis, nvar)check.visitSequence(visitSequence, nmis, nvar)data.frame.to.matrix(x)is.mids(data)is.mipo(data)
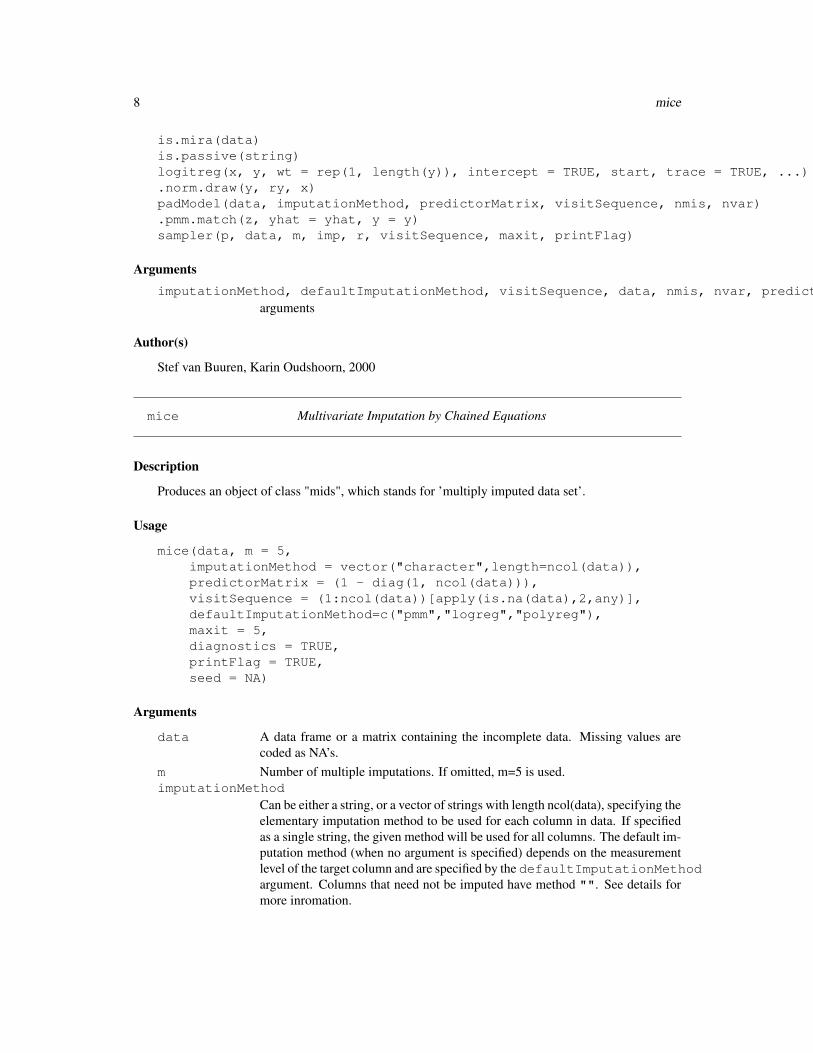
8 mice
is.mira(data)is.passive(string)logitreg(x, y, wt = rep(1, length(y)), intercept = TRUE, start, trace = TRUE, ...).norm.draw(y, ry, x)padModel(data, imputationMethod, predictorMatrix, visitSequence, nmis, nvar).pmm.match(z, yhat = yhat, y = y)sampler(p, data, m, imp, r, visitSequence, maxit, printFlag)
ArgumentsimputationMethod, defaultImputationMethod, visitSequence, data, nmis, nvar, predictorMatrix, x, y, ry, string, wt, intercept, start, trace, z, yhat, p, m, imp, r, maxit, printFlag, ...
arguments
Author(s)
Stef van Buuren, Karin Oudshoorn, 2000
mice Multivariate Imputation by Chained Equations
Description
Produces an object of class "mids", which stands for ’multiply imputed data set’.
Usage
mice(data, m = 5,imputationMethod = vector("character",length=ncol(data)),predictorMatrix = (1 - diag(1, ncol(data))),visitSequence = (1:ncol(data))[apply(is.na(data),2,any)],defaultImputationMethod=c("pmm","logreg","polyreg"),maxit = 5,diagnostics = TRUE,printFlag = TRUE,seed = NA)
Arguments
data A data frame or a matrix containing the incomplete data. Missing values arecoded as NA’s.
m Number of multiple imputations. If omitted, m=5 is used.imputationMethod
Can be either a string, or a vector of strings with length ncol(data), specifying theelementary imputation method to be used for each column in data. If specifiedas a single string, the given method will be used for all columns. The default im-putation method (when no argument is specified) depends on the measurementlevel of the target column and are specified by the defaultImputationMethodargument. Columns that need not be imputed have method "". See details formore inromation.
mice 9
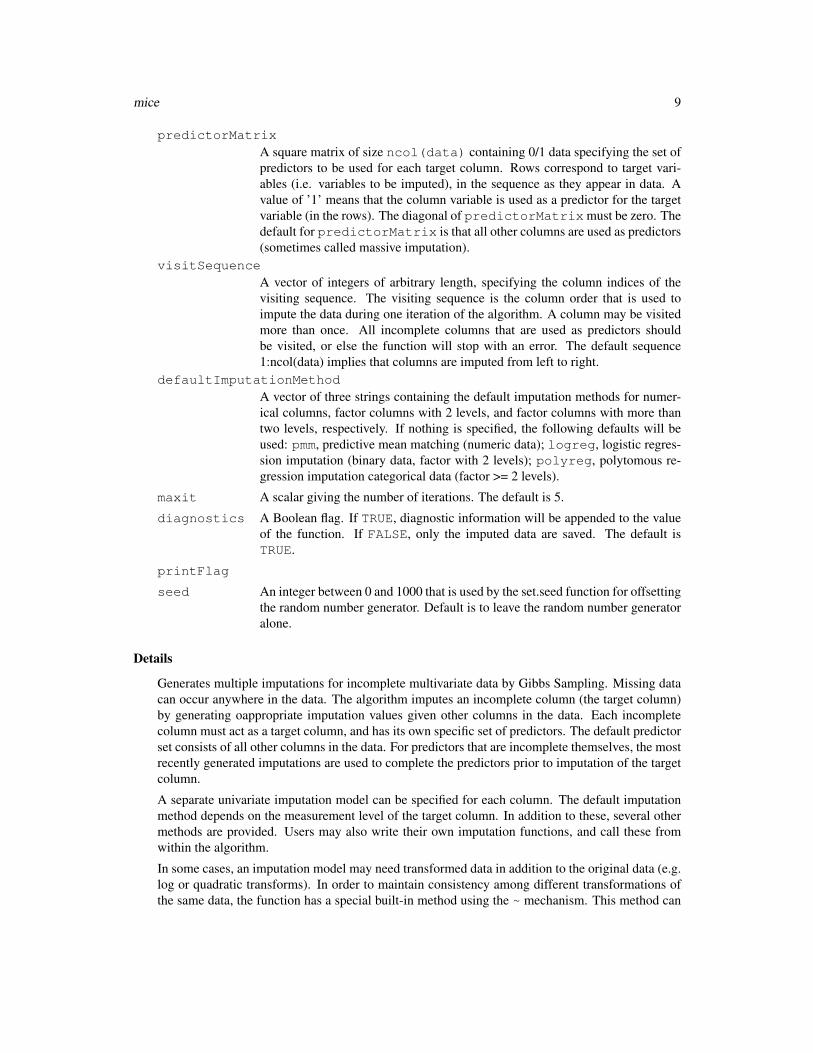
predictorMatrixA square matrix of size ncol(data) containing 0/1 data specifying the set ofpredictors to be used for each target column. Rows correspond to target vari-ables (i.e. variables to be imputed), in the sequence as they appear in data. Avalue of ’1’ means that the column variable is used as a predictor for the targetvariable (in the rows). The diagonal of predictorMatrix must be zero. Thedefault for predictorMatrix is that all other columns are used as predictors(sometimes called massive imputation).
visitSequenceA vector of integers of arbitrary length, specifying the column indices of thevisiting sequence. The visiting sequence is the column order that is used toimpute the data during one iteration of the algorithm. A column may be visitedmore than once. All incomplete columns that are used as predictors shouldbe visited, or else the function will stop with an error. The default sequence1:ncol(data) implies that columns are imputed from left to right.
defaultImputationMethodA vector of three strings containing the default imputation methods for numer-ical columns, factor columns with 2 levels, and factor columns with more thantwo levels, respectively. If nothing is specified, the following defaults will beused: pmm, predictive mean matching (numeric data); logreg, logistic regres-sion imputation (binary data, factor with 2 levels); polyreg, polytomous re-gression imputation categorical data (factor >= 2 levels).
maxit A scalar giving the number of iterations. The default is 5.
diagnostics A Boolean flag. If TRUE, diagnostic information will be appended to the valueof the function. If FALSE, only the imputed data are saved. The default isTRUE.
printFlag
seed An integer between 0 and 1000 that is used by the set.seed function for offsettingthe random number generator. Default is to leave the random number generatoralone.
Details
Generates multiple imputations for incomplete multivariate data by Gibbs Sampling. Missing datacan occur anywhere in the data. The algorithm imputes an incomplete column (the target column)by generating oappropriate imputation values given other columns in the data. Each incompletecolumn must act as a target column, and has its own specific set of predictors. The default predictorset consists of all other columns in the data. For predictors that are incomplete themselves, the mostrecently generated imputations are used to complete the predictors prior to imputation of the targetcolumn.
A separate univariate imputation model can be specified for each column. The default imputationmethod depends on the measurement level of the target column. In addition to these, several othermethods are provided. Users may also write their own imputation functions, and call these fromwithin the algorithm.
In some cases, an imputation model may need transformed data in addition to the original data (e.g.log or quadratic transforms). In order to maintain consistency among different transformations ofthe same data, the function has a special built-in method using the ~ mechanism. This method can

10 mice
be used to ensure that a data transform always depends on the most recently generated imputationsin the untransformed (active) column.
The data may contain categorical variables that are used in a regressions on other variables. Thealgorithm creates dummy variables for the categories of these variables, and imputes these from thecorresponding categorical variable.
Built-in imputation methods are:
norm Bayesian linear regression (Numeric)
pmm Predictive mean matching (Numeric)
mean Unconditional mean imputation (Numeric)
logreg Logistic regression (2 categories)
logreg2 Logistic regression (direct minimization)(2 categories)
polyreg Polytomous logistic regression (>= 2 categories)
lda Linear discriminant analysis (>= 2 categories)
sample Random sample from the observed values (Any)
Special method If the first character of the elementary method is a ~, then the string is interpretedas the formula argument in a call to model.frame(formula, data[!r[,j],]). Thisprovides a simple mechanism for specifying a large variety of dependencies among the vari-ables. For example transformed versions of imputed variables, recodes, interactions, sumscores, and so on, that may themselves be needed in other parts of the algoritm, can be spec-ified in this way. Note that the ~ mechanism works only on those entries which have missingvalues in the target column. The user should make sure that the combined observed and im-puted parts of the target column make sense. One easy way to create consistency is by codingall entries in the target as NA, but for large data sets, this could be inefficient. Moreover,this will not work in S-Plus 4.5. Though not strictly needed, it is often useful to specifyvisitSequence such that the column that is imputed by the ~ mechanism is visited eachtime after one of its predictors was visited. In that way, deterministic relation between columnswill always be synchronized.
For example, for the j’th column, the impute.norm function that implements the Bayesian linearregression method can be called by specifying the string "norm" as the j’th entry in the vector ofstrings.
The user can write his or her own imputation function, say impute.myfunc, and call it for allcolumns by specifying imputationMethod="myfunc", or for specific columns by specifyingimputationMethod=c("norm","myfunc",...).
side effects: Some elementary imputation method require access to the nnet or MASS libraries ofVenables & Ripley. Where needed, these libraries will be attached.
Value
An object of class mids, which stands for ’multiply imputed data set’. For a description of theobject, see the documentation on mids.
Author(s)
Stef van Buuren, Karin Oudshoorn, 2000
mice.impute.lda 11
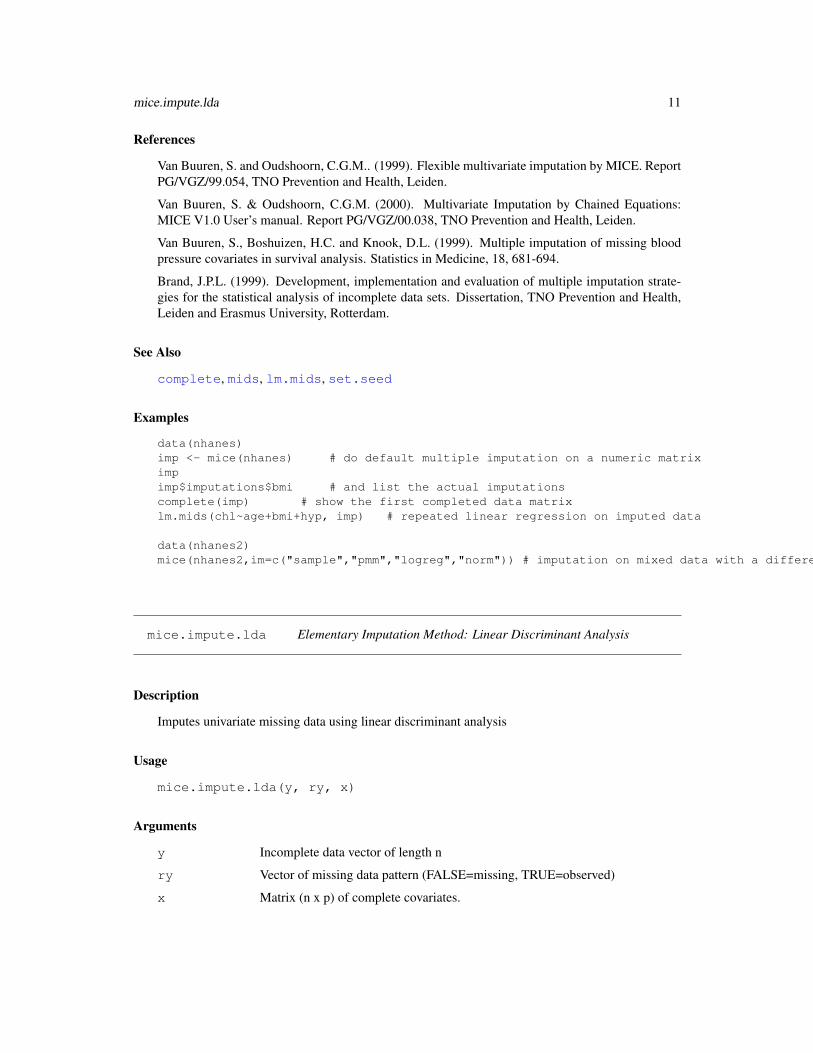
References
Van Buuren, S. and Oudshoorn, C.G.M.. (1999). Flexible multivariate imputation by MICE. ReportPG/VGZ/99.054, TNO Prevention and Health, Leiden.
Van Buuren, S. & Oudshoorn, C.G.M. (2000). Multivariate Imputation by Chained Equations:MICE V1.0 User’s manual. Report PG/VGZ/00.038, TNO Prevention and Health, Leiden.
Van Buuren, S., Boshuizen, H.C. and Knook, D.L. (1999). Multiple imputation of missing bloodpressure covariates in survival analysis. Statistics in Medicine, 18, 681-694.
Brand, J.P.L. (1999). Development, implementation and evaluation of multiple imputation strate-gies for the statistical analysis of incomplete data sets. Dissertation, TNO Prevention and Health,Leiden and Erasmus University, Rotterdam.
See Also
complete, mids, lm.mids, set.seed
Examples
data(nhanes)imp <- mice(nhanes) # do default multiple imputation on a numeric matriximpimp$imputations$bmi # and list the actual imputationscomplete(imp) # show the first completed data matrixlm.mids(chl~age+bmi+hyp, imp) # repeated linear regression on imputed data
data(nhanes2)mice(nhanes2,im=c("sample","pmm","logreg","norm")) # imputation on mixed data with a different method per column
mice.impute.lda Elementary Imputation Method: Linear Discriminant Analysis
Description
Imputes univariate missing data using linear discriminant analysis
Usage
mice.impute.lda(y, ry, x)
Arguments
y Incomplete data vector of length n
ry Vector of missing data pattern (FALSE=missing, TRUE=observed)
x Matrix (n x p) of complete covariates.
12 mice.impute.logreg
Details
Imputation of categorical response variables by linear discriminant analysis. This function uses theVenables/Ripley functions lda and predict.lda to compute posterior probabilities for each incompletecase, and draws the imputations from this posterior.
Value
A vector of length nmis with imputations.
Warning
The function does not incorporate the variability of the discriminant weight, so it is not ’proper’ inthe sense of Rubin. For small samples and rare categories in the y, variability of the mice.imputeddata could therefore be somewhat underestimated.
Note
This function can be called from within the Gibbs sampler by specifying ’lda’ in the imputation-Method argument. This method is usually faster and uses less resources than mice.impute.polyreg.
Author(s)
Stef van Buuren, Karin Oudshoorn, 2000
References
Van Buuren, S. & Oudshoorn, C.G.M. (2000). Multivariate Imputation by Chained Equations:MICE V1.0 User’s manual. Report PG/VGZ/00.038, TNO Prevention and Health, Leiden.
Brand, J.P.L. (1999). Development, Implementation and Evaluation of Multiple Imputation Strate-gies for the Statistical Analysis of Incomplete Data Sets. Ph.D. Thesis, TNO Prevention andHealth/Erasmus University Rotterdam. ISBN 90-74479-08-1.
Venables, W.N. & Ripley, B.D. (1999). Modern applied statistics with S-Plus (3rd ed). Springer,Berlin.
See Also
mice, lda, predict.lda
mice.impute.logreg Elementary Imputation Method: Logistic Regression
Description
Imputes univariate missing data using logistic regression.
Usage
mice.impute.logreg(y, ry, x)

mice.impute.logreg 13
Arguments
y Incomplete data vector of length n
ry Vector of missing data pattern of length n (FALSE=missing, TRUE=observed)
x Matrix (n x p) of complete covariates.
Details
Imputation for binary response variables by the Bayesian logistic regression model. See Rubin(1987, p. 169-170) for a description of the method. The method consists of the following steps:
1. Fit a logit, and find (bhat, V(bhat))
2. Draw BETA from N(bhat, V(bhat))
3. Compute predicted scores for m.d., i.e. logit-1(X BETA)
4. Compare the score to a random (0,1) deviate, and mice.impute.
The method relies on the standard glm.fit function.
Value
imp A vector of length nmis with imputations (0 or 1).
Note
An alternative is mice.impute.logreg2.
Author(s)
Stef van Buuren, Karin Oudshoorn, 2000
References
Van Buuren, S. & Oudshoorn, C.G.M. (2000). Multivariate Imputation by Chained Equations:MICE V1.0 User’s manual. Report PG/VGZ/00.038, TNO Prevention and Health, Leiden.
Brand, J.P.L. (1999). Development, Implementation and Evaluation of Multiple Imputation Strate-gies for the Statistical Analysis of Incomplete Data Sets. Ph.D. Thesis, TNO Prevention andHealth/Erasmus University Rotterdam. ISBN 90-74479-08-1.
See Also
mice, glm, glm.fit, mice.impute.logreg2

14 mice.impute.logreg2
mice.impute.logreg2Elementary Imputation Method: Logistic Regression
Description
Imputes univariate missing data using logistic regression.
Usage
imp <- mice.impute.logreg2(y, ry, x)
Arguments
y Incomplete data vector of length n
ry Vector of missing data pattern of length n (FALSE=missing, TRUE=observed)
x Matrix (n x p) of complete covariates.
Details
Imputation for binary response variables by the Bayesian logistic regression model. See Rubin(1987, p. 169-170) for a description of the method. The method consists of the following steps:
1. Fit a logit, and find (bhat, V(bhat))
2. Draw BETA from N(bhat, V(bhat))
3. Compute predicted scores for m.d., i.e. logit-1(X BETA)
4. Compare the score to a random (0,1) deviate, and mice.impute.
This method uses direct minimization of the likelihood function by means of V&R function logitreg(V&R, 2nd ed, p. 293).
Value
imp A vector of length nmis with imputations (0 or 1).
Note
An alternative is mice.impute.logreg.
Author(s)
Stef van Buuren, Karin Oudshoorn, 2000

mice.impute.mean 15
References
Van Buuren, S. & Oudshoorn, C.G.M. (2000). Multivariate Imputation by Chained Equations:MICE V1.0 User’s manual. Report PG/VGZ/00.038, TNO Prevention and Health, Leiden.
Brand, J.P.L. (1999). Development, Implementation and Evaluation of Multiple Imputation Strate-gies for the Statistical Analysis of Incomplete Data Sets. Ph.D. Thesis, TNO Prevention andHealth/Erasmus University Rotterdam. ISBN 90-74479-08-1.
Venables, W.N. & Ripley, B.D. (1997). Modern applied statistics with S-Plus (2nd ed). Springer,Berlin.
See Also
mice, logitreg, mice.impute.logreg
mice.impute.mean Elementary Imputation Method: Simple Mean Imputation
Description
Imputes the arithmetic mean of the observed data
Usage
mice.impute.mean(y, ry, x=NULL)
Arguments
y Incomplete data vector of length n
ry Vector of missing data pattern (FALSE=missing, TRUE=observed)
x Matrix (n x p) of complete covariates.
Value
A vector of length nmis with imputations.
Warning
Imputing the mean of a variable rarely produces appropriate inferences. See Little and Rubin(1987).
Author(s)
Stef van Buuren, Karin Oudshoorn, 2000

16 mice.impute.norm
References
Van Buuren, S. & Oudshoorn, C.G.M. (2000). Multivariate Imputation by Chained Equations:MICE V1.0 User’s manual. Report PG/VGZ/00.038, TNO Prevention and Health, Leiden.
Little, R.J.A. and Rubin, D.B. (1987). Statistical Analysis with Missing Data. New York: JohnWiley and Sons.
See Also
mice, mean
mice.impute.norm Elementary Imputation Method: Linear Regression Analysis
Description
Imputes univariate missing data using linear regression analysis
Usage
mice.impute.norm(y, ry, x)
Arguments
y Incomplete data vector of length n
ry Vector of missing data pattern (FALSE=missing, TRUE=observed)
x Matrix (n x p) of complete covariates.
Details
Draws values of beta and sigma for Bayesian linear regression imputation of y given x according toRubin p. 167.
Value
A vector of length nmis with imputations.
Note
Using mice.impute.norm for all columns gives results similar to Schafer’s norm method (Schafer,1997), though much slower.
Author(s)
Stef van Buuren, Karin Oudshoorn, 2000
mice.impute.norm.improper 17
References
Van Buuren, S. & Oudshoorn, C.G.M. (2000). Multivariate Imputation by Chained Equations:MICE V1.0 User’s manual. Report PG/VGZ/00.038, TNO Prevention and Health, Leiden. Brand,J.P.L. (1999). Development, Implementation and Evaluation of Multiple Imputation Strategies forthe Statistical Analysis of Incomplete Data Sets. Ph.D. Thesis, TNO Prevention and Health/ErasmusUniversity Rotterdam. ISBN 90-74479-08-1.
Schafer, J.L. (1997). Analysis of incomplete multivariate data. London: Chapman & Hall.
mice.impute.norm.improperElementary Imputation Method: Linear Regression Analysis (im-proper)
Description
Imputes univariate missing data using linear regression analysis (improper version)
Usage
mice.impute.norm.improper(y, ry, x)
Arguments
y Incomplete data vector of length n
ry Vector of missing data pattern (FALSE=missing, TRUE=observed)
x Matrix (n x p) of complete covariates.
Details
This creates imputation using the spread around the fitted linear regression line of y given x, asfitted on the observed data.
Value
A vector of length nmis with imputations.
Warning
The function does not incorporate the variability of the regression weights, so it is not ’proper’ inthe sense of Rubin. For small samples, variability of the mice.imputed data is therefore somewhatunderestimated.
Note
This function is provided mainly to allow comparison between proper and improper norm methods.
18 mice.impute.passive
Author(s)
Stef van Buuren, Karin Oudshoorn, 2000
References
Van Buuren, S. & Oudshoorn, C.G.M. (2000). Multivariate Imputation by Chained Equations:MICE V1.0 User’s manual. Report PG/VGZ/00.038, TNO Prevention and Health, Leiden.
Brand, J.P.L. (1999). Development, Implementation and Evaluation of Multiple Imputation Strate-gies for the Statistical Analysis of Incomplete Data Sets. Ph.D. Thesis, TNO Prevention andHealth/Erasmus University Rotterdam. ISBN 90-74479-08-1.
See Also
mice, mice.impute.norm
mice.impute.passiveElementary Imputation Method: Passive Imputation
Description
Derive a new variable based on the mice.imputed data
Usage
mice.impute.passive(data, func)
Arguments
data A data frame
func A formula specifying the transformations on data
Details
This is a special imputation function for so-called passive imputation. Using this function, the usercan specify, at any point in the mice Gibbs sampling algorithm, a function on the (mice.imputed)data. This is useful, for example, to compute a cubic version of a variable, a transformation likeQ = W/H2 based on two variables, or a mean variable like (x1 + x2 + x3)/3. The so derivedvariables might be used in other places in the imputation model. The function allows to dynamicallyderive virtually any function of the mice.imputed data at virtually any time.
Value
t The tranformed data.
Author(s)
Stef van Buuren, Karin Oudshoorn, 2000
mice.impute.pmm 19
References
Van Buuren, S. & Oudshoorn, C.G.M. (2000). Multivariate Imputation by Chained Equations:MICE V1.0 User’s manual. Report PG/VGZ/00.038, TNO Prevention and Health, Leiden.
See Also
mice
mice.impute.pmm Elementary Imputation Method: Linear Regression Analysis
Description
Imputes univariate missing data using predictive mean matching
Usage
mice.impute.pmm(y, ry, x)
Arguments
y Incomplete data vector of length n
ry Vector of missing data pattern (FALSE=missing, TRUE=observed)
x Matrix (n x p) of complete covariates.
Details
Imputation of y by predictive mean matching, based on Rubin (p. 168, formulas a and b). Theprocedure is as follows:
1. Draw beta and sigma from the proper posterior
2. Compute predicted values for yobs and ymis
3. For each ymis, find the observation with closest predicted value, and take its observed y as theimputation.
The matching is on yhat, NOT on y, which deviates from formula b.
Value
imp A vector of length nmis with imputations.
Author(s)
Stef van Buuren, Karin Oudshoorn, 2000
20 mice.impute.polyreg
References
Van Buuren, S. & Oudshoorn, C.G.M. (2000). Multivariate Imputation by Chained Equations:MICE V1.0 User’s manual. Report PG/VGZ/00.038, TNO Prevention and Health, Leiden.
Rubin, D.B. (1987). Multiple imputation for nonresponse in surveys. New York: Wiley.
mice.impute.polyregElementary Imputation Method: Polytomous Regression
Description
Imputes missing data in a categorical variable using polytomous regression
Usage
mice.impute.polyreg(y, ry, x)
Arguments
y Incomplete data vector of length n
ry Vector of missing data pattern (FALSE=missing, TRUE=observed)
x Matrix (n x p) of complete covariates.
Details
Imputation for categorical response variables by the Bayesian polytomous regression model. SeeJ.P.L. Brand (1999), Chapter 4, Appendix B.
The method consists of the following steps:
1. Fit categorical response as a multinomial model
2. Compute predicted categories
3. Add appropriate noise to predictions.
This algorithm uses the function multinom from the libraries nnet and MASS (Venables and Ripley).
Value
A vector of length nmis with imputations.
Author(s)
Stef van Buuren, Karin Oudshoorn, 2000

mice.impute.sample 21
References
Van Buuren, S. & Oudshoorn, C.G.M. (2000). Multivariate Imputation by Chained Equations:MICE V1.0 User’s manual. Report PG/VGZ/00.038, TNO Prevention and Health, Leiden.
Brand, J.P.L. (1999). Development, Implementation and Evaluation of Multiple Imputation Strate-gies for the Statistical Analysis of Incomplete Data Sets. Ph.D. Thesis, TNO Prevention andHealth/Erasmus University Rotterdam. ISBN 90-74479-08-1.
See Also
mice, multinom
mice.impute.sample Elementary Imputation Method: Simple Random Sample
Description
Imputes a random sample from the observed y data
Usage
mice.impute.sample(y, ry, x=NULL)
Arguments
y Incomplete data vector of length n
ry Vector of missing data pattern (FALSE=missing, TRUE=observed)
x Matrix (n x p) of complete covariates.
Details
This function takes a simple random sample from the observed values in y, and returns these asimputations.
Value
A vector of length nmis with imputations.
Author(s)
Stef van Buuren, Karin Oudshoorn, 2000
References
Van Buuren, S. & Oudshoorn, C.G.M. (2000). Multivariate Imputation by Chained Equations:MICE V1.0 User’s manual. Report PG/VGZ/00.038, TNO Prevention and Health, Leiden.

22 mice.mids
mice.mids Multivariate Imputation by Chained Equations (Iteration Step)
Description
Takes a "mids"-object, and produces an new object of class "mids".
Usage
mice.mids(obj, maxit=1, diagnostics=TRUE, printFlag=TRUE)
Arguments
obj An object of class "mids", typically produces by a previous call to mice() ormice.mids()
maxit The number of additional Gibbs sampling iterations.
diagnostics A Boolean flag. If TRUE, diagnostic information will be appended to the valueof the function. If FALSE, only the imputed data are saved. The default isTRUE.
printFlag A Boolean flag. If TRUE, diagnostic information during the Gibbs samplingiterations will be written to the command window. The default is TRUE.
Details
This function enables the user to split up the computations of the Gibbs sampler into smaller parts.This is useful for the following reasons:
• RAM memory may become easily exhausted if the number of iterations is large. Returning toprompt/session level may alleviate these problems.
• The user can compute customized convergence statistics at specific points, e.g. after eachiteration, for monitoring convergence. - For computing a ’few extra iterations’.
Note: The imputation model itself is specified in the mice() function and cannot be changed withmice.mids. The state of the random generator is saved with the mids-object.
Author(s)
Stef van Buuren, Karin Oudshoorn, 2000
References
Van Buuren, S. & Oudshoorn, C.G.M. (2000). Multivariate Imputation by Chained Equations:MICE V1.0 User’s manual. Report PG/VGZ/00.038, TNO Prevention and Health, Leiden.
See Also
mids 23
Examples
data(nhanes)imp1 <- mice(nhanes,maxit=1)imp2 <- mice.mids(imp1)
# yields the same result asimp <- mice(nhanes,maxit=2)
# for example:## > imp$imp$bmi[1,]# 1 2 3 4 5# 1 30.1 35.3 33.2 35.3 27.5# > imp2$imp$bmi[1,]# 1 2 3 4 5# 1 30.1 35.3 33.2 35.3 27.5#
mids Multiply Imputed Data Set
Description
An object containing a multiply imputed data set. The "mids" object is generated by the mice andmice.mids functions. The "mids" class of objects has methods for the following generic functions:print, summary, plot
Usage
## S3 method for class 'mids':print(x, ...)## S3 method for class 'mids':summary(object, ...)## S3 method for class 'mids':plot(x, y, ...)
Arguments
x A mids object.
object A mids object.
y Not used.
... Not used.
24 mids
Value
call The call that created the object.
data A copy of the incomplete data set.
m The number of imputations.
nmis An array containing the number of missing observations per column.
imp A list of nvar components with the generated multiple imputations. Each part ofthe list is a nmis[j] by m matrix of imputed values for variable j.
imputationMethodA vector of strings of length(nvar) specifying the elementary imputation methodper column.
predictorMatrixA square matrix of size ncol(data) containing 0/1 data specifying the pre-dictor set.
visitSequenceThe sequence in which columns are visited.
seed The seed value of the solution.
iteration Last Gibbs sampling iteration number.
lastSeedValueThe most recent seed value.
chainMean A list of m components. Each component is a length(visitSequence)by maxit matrix containing the mean of the generated multiple imputations. Thearray can be used for monitoring convergence. Note that observed data are notpresent in this mean.
chainCov A list with similar structure of itermean, containing the covariances of the im-puted values.
pad A list containing various settings of the padded imputation model, i.e. the impu-tation model after creating dummy variables. Normally, this array is only usefulfor error checking.
Author(s)
Stef van Buuren, Karin Oudshoorn, 2000
References
Van Buuren, S. & Oudshoorn, C.G.M. (2000). Multivariate Imputation by Chained Equations:MICE V1.0 User’s manual. Report PG/VGZ/00.038, TNO Prevention and Health, Leiden.

mipo 25
mipo Multiply Imputed Pooled Analysis
Description
The "mipo" object is generated by the lm.mids and glm.mids functions. The "mipo" class ofobjects has methods for the following generic functions: print, summary.
Usage
print.mipo(x,...)summary.mipo(object,...)
Arguments
x, object An object containing the m fit objects of a complete data analysis, plus someadditional information.
... not used.
Value
call The call that created the mipo object.
call1 The call that created the mira object that was used in ’call’.
call2 The call that created the mids object that was used in ’call1’.
nmis An array containing the number of missing observations per column.
m Number of multiple imputations.
qhat An m x npar matrix containing the complete data estimates for the nparparemeters of the m complete data analyses.
u An m x npar x npar array containing the variance-covariance matrices of them complete data analyses.
qbar The average of complete data estimates.
ubar The average of the variance-covariance matrix of the complete data estimes.
b The between imputation variance-covariance matrix.
t The total variance-covariance matrix.
r Relative increases in variance due to missing data
df Degrees of freedom associated with the t-statistics.
f Fractions of missing information.
Author(s)
Stef van Buuren, Karin Oudshoorn, 2000

26 mira
References
Van Buuren, S. & Oudshoorn, C.G.M. (2000). Multivariate Imputation by Chained Equations:MICE V1.0 User’s manual. Report PG/VGZ/00.038, TNO Prevention and Health, Leiden.
mira Multiply Imputed Repeated Analysis
Description
The "mira" object is generated by the lm.mids and glm.mids functions. The "mira" class of objectshas methods for the following generic functions: print, summary.
Usage
print.mira(x,...)summary.mira(object, correlation, ...)
Arguments
x, object An object containing the m fit objects of a complete data analysis, plus someadditional information.
correlation
... not used
Value
call The call that created the object.
call1 The call that created the mids object that was used in ’call’.
nmis An array containing the number of missing observations per column.
analyses A list of m components containing the individual fit objects from each of the mcomplete data analyses.
Author(s)
Stef van Buuren, Karin Oudshoorn, 2000
References
Van Buuren, S. & Oudshoorn, C.G.M. (2000). Multivariate Imputation by Chained Equations:MICE V1.0 User’s manual. Report PG/VGZ/00.038, TNO Prevention and Health, Leiden.

nhanes 27
nhanes nhanes data set
Description
Usage
data(nhanes)
Format
A data frame with 25 observations on the following 4 variables.
age a numeric vectorbmi a numeric vectorhyp a numeric vectorchl a numeric vector
Source
nhanes2 nhanes2 data set
Description
Usage
data(nhanes2)
Format
A data frame with 25 observations on the following 4 variables.
age a factor with levels 1 2 3bmi a numeric vectorhyp a factor with levels 1 2chl a numeric vector
Source
28 pool
pool Multiple Imputation Pooling
Description
Pools the results of m repeated complete data analysis
Usage
pool(object, method="smallsample")
Arguments
object An object of class ’mira’, produced by functions like lm.mids or glm.mids.
method A string describing the method to compute the degrees of freedom. The defaultvalue is "smallsample", which specifies the is Barnard-Rubin adjusted degreesof freedom (Barnard& Rubin, 1999) for small samples. Specifying a differentstring produces the conventional degrees of freedom as in Rubin (1987).
Details
The function averages the estimates of the complete data model, computes the total variance overthe repeated analyses, and computes the relative increase in variance due to nonresponse and thefraction of missing information. The function relies on the availability of
1. the estimates of the model, typically present as ’coefficients’ in the fit object
2. an appropriate estimate of the variance-covariance matrix of the estimates per analyses.
R-Specific: The original use of Varcov has been removed to vcov (VR MASS).
Value
An object of class ’mipo’, which stands for ’multiple imputation pooled’.
Author(s)
Stef van Buuren, Karin Oudshoorn, 2000
References
Barnard, J. and Rubin, D.B. (1999). Small sample degrees of freedom with multiple imputation.Biometrika, 86, 948-955.
Rubin, D.B. (1987). Multiple Imputation for Nonresponse in Surveys. New York: John Wiley andSons.
Alzola, C.F. and Harrell, F.E. (1999). An introduction to S-Plus and the Hmisc and Design Libraries.http://hesweb1.med.virginia.edu/biostat/s/index.html.
pool 29
See Also
lm.mids, glm.mids, vcov, print.mira, summary.mira
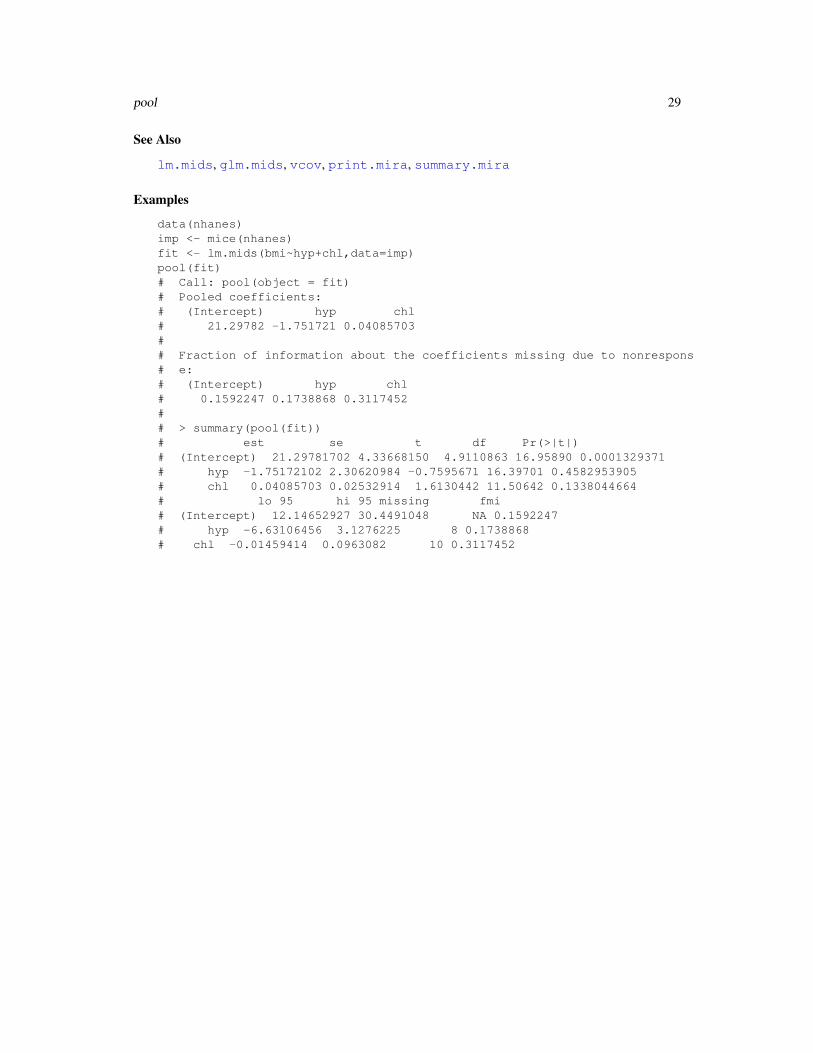
Examples
data(nhanes)imp <- mice(nhanes)fit <- lm.mids(bmi~hyp+chl,data=imp)pool(fit)# Call: pool(object = fit)# Pooled coefficients:# (Intercept) hyp chl# 21.29782 -1.751721 0.04085703## Fraction of information about the coefficients missing due to nonrespons# e:# (Intercept) hyp chl# 0.1592247 0.1738868 0.3117452## > summary(pool(fit))# est se t df Pr(>|t|)# (Intercept) 21.29781702 4.33668150 4.9110863 16.95890 0.0001329371# hyp -1.75172102 2.30620984 -0.7595671 16.39701 0.4582953905# chl 0.04085703 0.02532914 1.6130442 11.50642 0.1338044664# lo 95 hi 95 missing fmi# (Intercept) 12.14652927 30.4491048 NA 0.1592247# hyp -6.63106456 3.1276225 8 0.1738868# chl -0.01459414 0.0963082 10 0.3117452

Index
∗Topic datasetsnhanes, 27nhanes2, 27
∗Topic misccomplete, 1glm.mids, 3lm.mids, 5md.pattern, 6mice, 8mice.impute.lda, 11mice.impute.logreg, 12mice.impute.logreg2, 13mice.impute.mean, 15mice.impute.norm, 16mice.impute.norm.improper, 17mice.impute.passive, 18mice.impute.pmm, 19mice.impute.polyreg, 20mice.impute.sample, 21mice.internal, 7mice.mids, 22mids, 23mipo, 25mira, 26pool, 28
.norm.draw (mice.internal), 7
.pmm.match (mice.internal), 7
check.imputationMethod(mice.internal), 7
check.predictorMatrix(mice.internal), 7
check.visitSequence(mice.internal), 7
complete, 1, 11
data.frame.to.matrix(mice.internal), 7
formula, 3
glm, 3, 13glm.fit, 13glm.mids, 3, 25, 29
is.mids (mice.internal), 7is.mipo (mice.internal), 7is.mira (mice.internal), 7is.passive (mice.internal), 7
lda, 12lm, 3, 5, 6lm.mids, 5, 11, 25, 29logitreg, 14logitreg (mice.internal), 7
md.pattern, 6mean, 15mice, 2, 8, 12–15, 18, 19, 21mice.impute.lda, 11mice.impute.logreg, 12, 14mice.impute.logreg2, 13, 13mice.impute.mean, 15mice.impute.norm, 16, 18mice.impute.norm.improper, 17mice.impute.passive, 18mice.impute.pmm, 19mice.impute.polyreg, 12, 20mice.impute.sample, 21mice.internal, 7mice.mids, 22mids, 2, 3, 6, 10, 11, 23mipo, 25mipo (mice.internal), 7mira, 3, 6, 26multinom, 21
nhanes, 27nhanes2, 27
padModel (mice.internal), 7plot.mids (mids), 23
30
INDEX 31
pool, 28predict.lda, 12print.mids (mids), 23print.mipo (mipo), 25print.mira, 29print.mira (mira), 26
sampler (mice.internal), 7set.seed, 11summary.mids (mids), 23summary.mipo (mipo), 25summary.mira, 29summary.mira (mira), 26
vcov, 29